

Abstract
Objective
We previously derived and validated a risk score for major nonsteroidal anti‐inflammatory drug (NSAID) toxicity over 1 year among NSAID users in a randomized controlled trial. This work was extended to examine the risk score's performance in an external population using real‐world data.
Methods
Patients enrolled in the Corrona Rheumatoid Arthritis (RA) Registry were included if they initiated use of an NSAID. We defined the original risk factors previously identified in the risk score for major NSAID toxicity: age; male sex; history of cardiovascular disease, hypertension, and diabetes; tobacco use; statin use; elevated serum creatinine and hematocrit values; and RA. Additionally, we defined the occurrence of major toxicity, including major adverse cardiovascular events, acute kidney injury, significant gastrointestinal events, and mortality. The original risk factors were assessed in Cox regression examining discrimination and calibration. Low (less than 1%), intermediate (1%‐4%), and high (more than 4%) risk categories for 1‐year risk were applied to the population.
Results
A total of 5231 patients from Corrona who had a new NSAID exposure period were included. The original risk score model showed good discrimination (C‐index 0.70). Not all of the original variables were statistically significant in real‐world data. Using the original risk score weights, 1363 (26.1%) patients had predicted risk of less than 1%, 3571 (68.3%) had predicted risk of 1% to 4%, and 297 (5.7%) had predicted risk of more than 4%.
Conclusion
The original NSAID major toxicity risk score demonstrated good model fit characteristics in this external real‐world cohort. These results suggest that such a risk score is valid in typical practice and could be considered for clinical care.
Significance & Innovations.
Nonsteroidal anti‐inflammatory drugs (NSAIDs) are a very common drug in rheumatology and have a variety of major toxicities associated with their use.
We externally validated a previously developed risk prediction score for major NSAID toxicity using real‐world data.
The NSAID risk score should be considered for routine clinical care.
Introduction
Nonsteroidal anti‐inflammatory drugs (NSAIDs) are used by approximately 40% of patients with rheumatoid arthritis (RA) and represent one of the most commonly prescribed drug categories in the world (1, 2). Although these agents are relatively safe, they have the potential for major toxicities; these include major adverse cardiovascular events, gastrointestinal bleeding, acute kidney injury, and death. Although these issues are not specific to NSAIDs, they are among the most concerning potential harms caused by these agents. These adverse events must be considered when discussing the potential benefits and risks of NSAIDs. Morbidity appears to have decreased since the widespread use of proton pump inhibitors (3), but these toxicities are important to consider when prescribing NSAIDs.
In an attempt to personalize NSAID prescribing using clinical variables, we previously derived and validated a risk score for major NSAID toxicity using data from the Prospective Randomized Evaluation of Celecoxib Integrated Safety Versus Ibuprofen or Naproxen (PRECISION) trial, a large randomized controlled trial (RCT) that examined the safety of celecoxib, ibuprofen, and naproxen (4, 5). Risk scores allow for the application of epidemiology in the clinic (6) and include examples such as the Framingham Risk Score, Systematic Coronary Risk Evaluation, American Heart Association/American College of Cardiology Guidelines, and Fracture Risk Assessment Tool (7, 8, 9, 10). To externally validate the risk score, we examined its performance using real‐world data from a large RA registry.
Patients and Methods
Study design and participants
The current study used information derived from Corrona, a large registry based in North America (11). All patients in the registry have signed informed consent for analyses of their treatment and outcomes data, and the Partners HealthCare human ethics board approved the current analyses.
The study population included patients with a clinical diagnosis of RA who initiated an NSAID during follow‐up. All oral NSAIDs, selective and nonselective, were included. NSAID use can be reported by either patients or providers. We required no use reported for at least two consecutive visits, followed by a report of selective or nonselective NSAID use. We did not censor patients after initiation of an NSAID because their risk would have been estimated at the outset.
We followed recommendations of the Transparent Reporting of a Multivariable Prediction Model for Individual Prognosis or Diagnosis (TRIPOD) study group regarding validation of risk scores, including cohort selection, model performance, and assessment of validation (6).
Outcomes
As with the original analyses, the primary outcome for the current analyses was a composite of major toxicity among NSAID users. These outcomes were defined using available data from Corrona and included cardiovascular events, gastrointestinal bleeding, acute kidney injury, and death. These were defined using variables from the Corrona data set. Cardiovascular events were determined based on site confirmation of events reported on the Corrona case report form; they include myocardial infarction, stroke, transient ischemic attack, coronary revascularization, and hospitalization for unstable angina. Prior work has found a positive predictive value above 90% for these reports (12). Gastrointestinal bleeds were also determined based on site confirmation of events reported on the Corrona case report form; they include gastroduodenal hemorrhage, gastric outlet obstruction, perforation of the gastroduodenum (small or large bowel), acute gastrointestinal hemorrhage of unknown origin, and symptomatic gastric or duodenal ulcer. Acute kidney injury was defined as a doubling of the serum creatinine level from the lowest measurement in the year prior to NSAID initiation to the highest measurement in the 2 years after initiation. Death is based on any report of death in the Corrona case report files, augmented by the National Death Index.
Although the original risk score focused on the first year after the start of NSAIDs, the current analyses examined both 1‐year follow‐up as well as 2‐year follow‐up. The 1‐year follow‐up is considered the primary analysis, with the 2‐year follow‐up as a sensitivity analysis. Patients were censored from the analysis at the first of any of the following: withdrawal from Corrona, end of follow‐up, or the first outcome.
Potential risk factors
All of the potential predictors of major NSAID toxicity that were originally considered had been assessed as potential risk factors in prior studies (13, 14, 15, 16). The original analyses also focused on variables that could be easily assessed in clinical practice. We identified 10 risk factors for major NSAID toxicity in the original derivation and validation analyses, including age; male sex; history of cardiovascular disease, hypertension, and diabetes; tobacco use; statin use; elevated serum creatinine and hematocrit values; and RA (5). Variables tested in the original analyses and not found significant include the following: aspirin use, glucocorticoid use, body mass index, history of hyperlipidemia, and disease‐modifying antirheumatic drug use. Because everyone in this study cohort had RA, it was not a relevant risk factor in the current analyses.
Variables were assessed at the visit when NSAIDs were initiated, except for variables not measured at every visit. Age and sex were assessed at the NSAID initiation visit. Chronic comorbid conditions, such as cardiovascular disease, hypertension, and diabetes, are updated in Corrona and thus were assessed during the period up until the start of NSAIDs. Tobacco use is collected at baseline, and this value was assumed constant. Concomitant statin use (as well as other medications) is updated at each visit. Serum creatinine and hematocrit were assessed at the closest visit to the NSAID initiation with these data (median time between laboratory assessment and NSAID initiation was 0 days).
Statistical analyses
After identifying the patients in Corrona who qualify for the current analyses, we identified their baseline characteristics. We then examined their follow‐up to identify any major toxicity outcomes, and the rate of major toxicity with 95% confidence intervals (CIs) was estimated. Models of risk were then calculated, and the predicted risk was compared to observed first toxicity event. Harrell's C‐index was used to assess model discrimination, observed risk curves versus predicted risk curves were assessed for the calibration intercept and slope, and the Akaike information criterion (AIC) and Bayesian information criterion (BIC) were examined as additional model fit statistics (lower values are better). As with the original derivation and internal validation, three categories of risk for major toxicity were defined as the following: low risk as less than 1%; intermediate risk as 1% to 4%; and high risk as more than 4%. Kaplan‐Meier event‐free survival curves were plotted for the three categories, and the risk of outcomes was compared using the log‐rank test (PROC LIFETEST in SAS [SAS Institute, Inc.]).
The first risk model assessed was the original risk score, calculated for each participant, from the PRECISION trial cohort (5). Second, a multivariable Cox proportional hazards regression model was refit using the patient characteristics from the original risk score except for RA, which was not relevant because all patients in the Corrona cohort had RA. Only the first toxicity event was used in these analyses, with the timescale as the days since the start of NSAIDs (PROC PHREG in SAS). This model was assessed for the significance of each variable, model fit statistics, and estimation of 2‐year risk. Finally, we generated a parsimonious model, removing variables that were not significant in the Corrona data, and reassessed the model fit statistics.
All analyses were conducted using SAS version 9.4.
Results
We identified 5231 patients in Corrona with new NSAID use. The median age in the total cohort was 61 years (interquartile range [IQR] 53‐69), and 78% of patients were female (see Table (1). Prior cardiovascular events were reported in 10.7% of patients, 53.7% of patients used drugs for gastrointestinal symptoms, and the baseline serum creatinine level was 0.80 mg/dl. Median follow‐up time was 12 months. Table (2 shows the incidence rates for the components and the composite of major toxicity. During 1 year of follow‐up, there were 79 events for an overall rate of major toxicity of 1.69 events per 100 person‐years (95% CI 1.36‐2.11); during 2 years of follow‐up, there were 2.11 events per 100 person‐years (95% CI 1.81‐2.46).
Table 1.
Patient characteristics from Corrona included in study cohort
| Characteristics | Results |
|---|---|
| N | 5231 |
| Age, median (IQR), y | 61.0 (53.0‐69.0) |
| Male sex, n (%) | 1150 (22.0) |
| BMI, a median (IQR), kg/m2 | 28.9 (24.9‐33.7) |
| Use of tobacco, n (%) | 539 (10.3) |
| History of diabetes, n (%) | 439 (8.4) |
| History of hypertension, n (%) | 1670 (31.9) |
| History of hyperlipidemia, n (%) | 443 (8.5) |
| Prior CV event, n (%) | 561 (10.7) |
| Gastrointestinal drug use, n (%) | 2809 (53.7) |
| Serum creatinine, median (IQR), mg/dl | 0.80 (0.70‐0.92) |
| Hematocrit, median (IQR), % | 40.2 (37.8‐42.8) |
| <43%, n (%) | 3979 (76.1) |
| Use of aspirin, n (%) | 953 (18.2) |
| Use of lipid‐lowering drugs, n (%) | 2078 (39.7) |
| Use of glucocorticoids, n (%) | 1039 (19.9) |
| Use of DMARDs, n (%) | 4050 (77.4) |
| Functional status, b median (IQR) | 0.25 (0.00‐0.63) |
Abbreviation: BMI, body mass index; CV, cardiovascular, DMARD, disease‐modifying antirheumatic drug; IQR, interquartile range.
Six patients were missing data for the modified health assessment questionnaire, but all missing data were imputed using PROC MI.
Eleven patients were missing BMI data, but weights were used to input BMI.
Functional status was measured with the modified health assessment questionnaire (19), range 0 (no limitation) to 3 (unable to perform).
Table 2.
One‐year outcome rates for major toxicity among NSAID users
| Outcomes Among NSAID Users (n = 5231) | 1‐y Follow‐Up | 2‐y Follow‐Up | ||||
|---|---|---|---|---|---|---|
| Events, n | Person‐Years | Rate a (95% CI) | Events, n | Person‐Years | Rate a (95% CI) | |
| Primary outcome b | 79 | 4668 | 1.69 (1.36‐2.11) | 160 | 7578 | 2.11 (1.81‐2.46) |
| Cardiovascular events | 33 | 4680 | 0.71 (0.50‐1.00) | 57 | 7634 | 0.75 (0.58‐0.97) |
| Gastrointestinal events | 8 | 4685 | 0.17 (0.09‐0.34) | 20 | 7654 | 0.26 (0.17‐0.40) |
| Acute kidney injury | 37 | 4678 | 0.79 (0.57‐1.09) | 69 | 7621 | 0.91 (0.72‐1.15) |
| Death | 1 | 4688 | 0.02 (0.00‐0.14) | 15 | 7665 | 0.20 (0.12‐0.33) |
Abbreviation: CI, confidence interval; NSAID, nonsteroidal anti‐inflammatory drug.
Rates are per 100 person‐years.
The primary outcome is a composite of major toxicities among NSAID users that includes four components: major adverse cardiovascular events, gastrointestinal events, acute kidney injury, and death.
The original risk score, refit score, and parsimonious score are compared in Table (3. Variables in the original risk score model with 95% CIs, which excluded one, included age, prior cardiovascular event, and serum creatinine. We also tested a more parsimonious model, removing the variables with 95% CIs that included one. As shown, all models show good fit, with a Harrell's C‐index of 0.70, an AIC of 1313, and a BIC of 1339. Also, the calibration slope for the original risk score (0.24) was lower than anticipated, but the calibration slope in the refit Corrona model (1.03) was excellent (Figure (1).
Table 3.
Multivariable HRs from final multivariable‐adjusted models predicting primary outcome
| Original Risk Score, HR (95% CI) | Refit Model, HR (95% CI) | Parsimonious Model, HR (95% CI) | |
|---|---|---|---|
| Risk Factor | |||
| Age, per y | 1.03 (1.02‐1.04) | 1.03 (1.00‐1.05) | 1.03 (1.00‐1.05) |
| Male sex | 1.31 (1.07‐1.59) | 1.54 (0.91‐2.61) | 1.61 (0.96‐2.72) |
| Use of tobacco | 1.44 (1.17‐1.77) | 1.17 (0.56‐2.45) | NA a |
| History of diabetes | 1.41 (1.20‐1.66) | 0.96 (0.45‐2.06) | NA a |
| History of hypertension | 1.25 (1.01‐1.56) | 0.83 (0.51‐1.36) | NA a |
| Prior cardiovascular event | 2.31 (1.95‐2.72) | 1.90 (1.09‐3.33) | 1.83 (1.07‐3.15) |
| Serum creatinine, mg/dl | 2.99 (2.09‐4.28) | 2.57 (1.00‐6.61) | 2.56 (1.02‐6.43) |
| Hematocrit | |||
| <43% | 0.93 (0.90‐4.28) | 0.97 (0.93‐1.01) | 0.97 (0.93‐1.02) |
| ≥43% | 1.04 (1.00‐1.09) | 0.89 (0.72‐1.09) | 0.89 (0.73‐1.09) |
| Use of statins | 1.20 (1.01‐1.43) | 1.18 (0.73‐1.93) | NA a |
| MHAQ (≥0.6) | NA a | NA a | 1.83 (1.17‐2.87) |
| Model fit statistics | |||
| Harrell's C‐Index | 0.68 (0.45‐0.87) b | 0.70 (0.48‐0.89) | 0.69 (0.46‐0.88) |
| AIC | NA c | 1313 | 1302 |
| BIC | NA c | 1339 | 1318 |
Abbreviation: AIC, Akaike information criterion; BIC, Bayesian Information Criterion; CI, confidence interval; DMARD, disease‐modifying antirheumatic drug; HR, hazard ratio; MHAQ, modified health assessment questionnaire; NA, not applicable.
The variable was not included in the parsimonious model.
The variable was not included in the original risk score model.
Bootstrapped 95% CI.
Not calculated for the original risk score.
Figure 1.

This figure describes the calibration of the predicted versus observed nonsteroidal anti‐inflammatory drug toxicity events over 1 year of follow‐up. A, The calibration slope using the original risk score weights (slope = 0.24). B, The calibration slope using the risk score weights derived in Corrona data (slope = 1.03).
We used the models to estimate a risk score for major toxicity over 1 year. As we had done in the original derivation and validation exercise, we created three risk groups—low risk (less than 1%), intermediate risk (1%‐4%) and high risk (more than 4%)—based on the predicted 1‐year risk probabilities.
Using the original risk score weights, 442 patients (8.5%) had a predicted risk of less than 1%, 3430 (65.6%) had a predicted risk of 1% to 4%, and 1359 (26.0%) had a predicted risk of more than 4% (see Table (4). With the refit Corrona model, 1363 patients (26.1%) had a predicted risk of less than 1%, 3571 (68.3%) had a predicted risk of 1% to 4%, and 297 (5.7%) had a predicted risk of more than 4%. The models also performed well over 2 years of follow‐up. The components of the composite major toxicity outcome demonstrated the expected trends between low, intermediate, and high risk (Table (4). The Kaplan‐Meier survival curves for the three categories of risk over 1‐year separated early for both models (Figure (2), with statistically significant log‐rank tests for both the original risk score weights and the Corrona risk score weights (P < 0.001 for both log‐rank tests).
Table 4.
Risk of major toxicity among NSAID users and component outcomes by risk category
| Risk Category | n (%) | Major NSAID Toxicity, Rate per 100 Patients (95% CI) | Cardiovascular Event, Rate per 100 Patients (95% CI) | Gastrointestinal Bleed, Rate per 100 Patients (95% CI) | Acute Kidney Injury, a Rate per 100 Patients (95% CI) | Death, b Rate per 100 Patients (95% CI) |
|---|---|---|---|---|---|---|
| 1 y (original model) | ||||||
| Low risk (<1%) | 442 (8.5) | 0.75 (0.24‐2.33) | 0.25 (0.04‐1.77) | 0 | 0.50 (0.13‐2.00) | 0 |
| Intermediate risk (1%‐4%) | 3430 (65.6) | 1.24 (0.90‐1.70) | 0.45 (0.27‐0.76) | 0.16 (0.07‐0.38) | 0.62 (0.40‐0.97) | 0 |
| High risk (>4%) | 1359 (26.0) | 3.19 (2.32‐4.38) | 1.51 (0.95‐2.40) | 0.25 (0.08‐0.78) | 1.34 (0.82‐2.19) | 0.08 (0.01‐0.57) |
| 1‐y follow‐up | ||||||
| Low risk (<1%) | 1363 (26.1) | 0.73 (0.38‐1.40) | 0.24 (0.08‐0.74) | 0 | 0.48 (0.22‐1.07) | 0 |
| Intermediate risk (1%‐4%) | 3571 (68.3) | 1.83 (1.41‐2.37) | 0.75 (0.50‐1.12) | 0.22 (0.10‐0.46) | 0.85 (0.58‐1.24) | 0 |
| High risk (>4%) | 297 (5.7) | 4.74 (2.69‐8.35) | 2.36 (1.06‐5.25) | 0.39 (0.05‐2.77) | 1.57 (0.59‐4.18) | 0.39 (0.05‐2.77) |
| 2‐y follow‐up | ||||||
| Low risk (<1%) | 1168 (22.3) | 0.96 (0.60‐1.54) | 0.11 (0.03‐0.44) | 0 | 0.79 (0.47‐1.33) | 0.06 (0.01‐0.43) |
| Intermediate risk (1%‐4%) | 3814 (72.9) | 2.20 (1.84‐2.63) | 0.78 (0.58‐1.05) | 0.32 (0.20‐0.51) | 0.90 (0.68‐1.19) | 0.18 (0.10‐0.33) |
| High risk (>4%) | 249 (4.8) | 7.21(4.75‐10.95) | 3.89 (2.21‐6.85) | 0.64 (0.16‐2.56) | 1.61 (0.67‐3.87) | 1.28 (0.48‐3.41) |
Abbreviation: CI, confidence interval; NSAID, nonsteroidal anti‐inflammatory drug.
Acute kidney injury was defined as development of renal insufficiency or renal failure, including any of the following: serum creatinine level ≥ 2.0 mg/dl and an increase of ≥0.7 mg/dl from baseline, hospitalization for acute renal failure with a doubling of the baseline serum creatinine level or hyperkalemia with ≥50% elevation in the serum creatinine level, or initiation of dialysis.
Death includes all causes.
Figure 2.
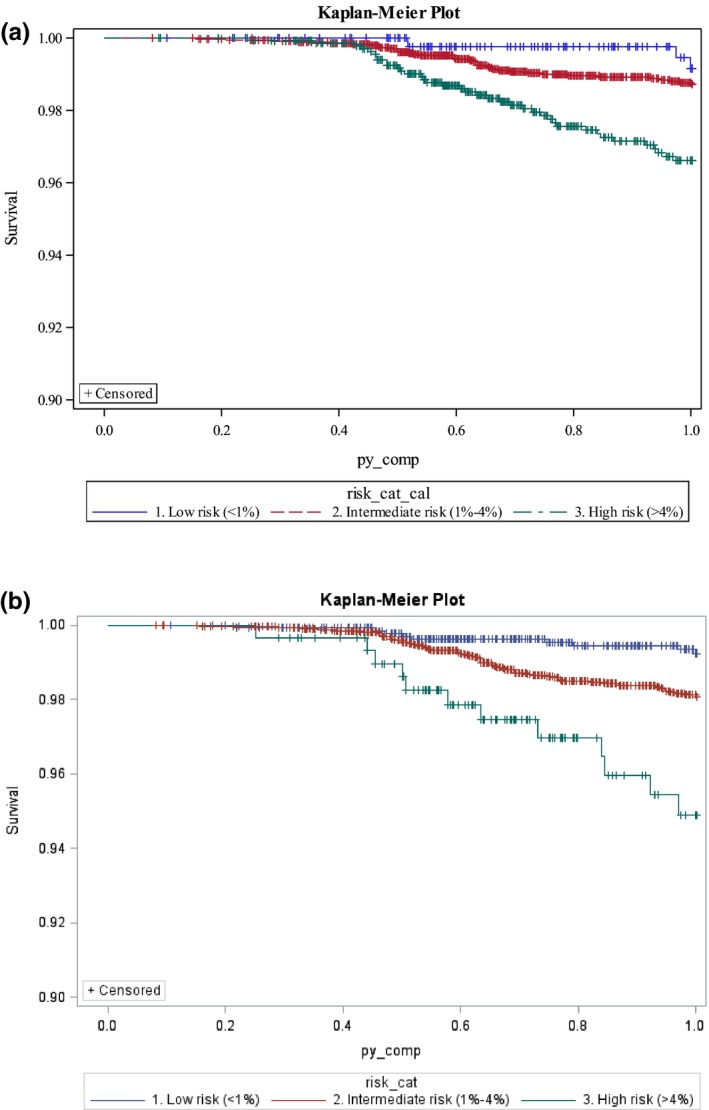
This Kaplan‐Meier survival curve illustrates the 1‐year event‐free survival of subjects in each of the three risk categories of the risk score for major toxicity among nonsteroidal anti‐inflammatory drug users. A, The original risk score weights are used to estimate the survival (log‐rank test; P < 0.001). B, The weights from the Corrona population are used to estimate the survival (log‐rank test; P < 0.001).
Cox proportional hazard regression models showed similar results for the hazard ratios (HRs) generated from the original and the Corrona risk score weights. Using the low‐risk group (less than 1%) as the reference, the 1‐year model using the original risk score weights estimated the intermediate‐risk group (1%‐4%) with an HR of 1.67 (95% CI 0.57‐5.42) and the high‐risk group (more than 4%) with an of HR 4.38 (95% CI 1.35‐14.18). Using the Corrona risk score weights produced similar HRs: the intermediate‐risk group had an HR of 2.55, (95% CI 1.26‐5.15), and the high‐risk group had an HR of 6.75 (95% CI 2.84‐16.03).
Discussion
We tested the external validity of a risk score for major toxicity among NSAID users from the Corrona registry; this risk score had been previously derived and validated in the setting of an RCT (5). We found that the original variables (excluding RA) performed well as a risk score in the real‐world registry cohort; the calibration and discrimination was very similar to the original RCT cohort. The low‐, intermediate‐, and high‐risk groups had significantly different risks for major toxicity. As with the original RCT cohort, most patients fell into the intermediate‐risk category. The current set of analyses also allowed us to examine a more parsimonious model, which also had good model fit statistics. Moreover, the risk score not only performed well over the 1‐year time horizon examined in the original derivation and validation exercise but also had good fit over 2 years of follow‐up.
Several aspects of the current analyses warrant discussion. First, the external validation in a real‐world cohort suggests that this risk score may have value in typical clinical settings. The use of selective and nonselective NSAIDs is widespread in clinical practice, and tools to risk stratify patients would help providers and patients make evidence‐based decisions. We developed a risk calculator for the original risk score (http://www.verityresearch.org/major-toxicity-risk-score/) that can be used in clinics as a decision support tool in the setting of an electronic medical record or as a stand‐alone calculator.
Second, risk models derived in epidemiologic studies take on increased clinical relevance when they are validated and transformed into risk scores (17). Replication has become the standard for genetic and biomarker analyses, and epidemiologists need to consider a similar standard. Validating a model can take two general forms: internal validation within the same data set used for derivation and external validation in a distinct data set (17, 18). In the current study, we have conducted both internal and external validation according to methodologic standards. As expected, the model performs slightly worse in the external validation using typical clinical data; however, it still performs well. More clinical scientists should consider validating models through replication.
Third, further studies with the risk score should be considered. Further external validation in an osteoarthritis cohort would be useful because the original cohort included primarily patients with osteoarthritis. Additionally, studies of optimal risk score implementation would inform best practices. Will clinicians use a computerized clinical decision support system integrated in an electronic medical record or would they rather have a stand‐alone calculator providing risk stratification? In addition, investigators in future NSAID trials focusing on improving safety may want to use the risk score to stratify patients for recruitment. Finally, clinicians and patients might find further stratification of intermediate‐risk patients helpful.
Several strengths of the current analyses should be highlighted. We followed rigorous validation methods using a real‐world clinical cohort. The real‐world cohort complements the prior work using an RCT population. The variables included in the risk score included variables relatively easily accessed in typical clinical records. The risk score results were robust across a second year and using the original regression weights. It is still to be determined which are the optimal weights for the risk score (original trial versus real‐world registry). An important limitation of the current analyses is the need to harmonize the data from the Corrona registry with the original variable definitions from the RCT. This would be the case for any application of an epidemiologic risk score within typical clinical practice. Some also might want to stratify the risk for different NSAIDs. In the original derivation of the score, there was no difference between nonselective NSAIDs (ibuprofen and naproxen) and the selective agent celecoxib. Moreover, this was impossible in the Corrona registry because of sample size. The death rate in Corrona may be lower than expected because of inadequate ascertainment. We examined a subset of our study population with linked data from the US Medicare program and found 14 deaths out of 782 subjects (1.7%) without follow‐up visits in Corrona beyond 1 year of follow‐up, suggesting some misclassification. We did not include a non‐NSAID control group in the original derivation or the current external validation analyses, so the risk of a toxicity outcome is among NSAID users only. Finally, the Corrona registry we used only included patients with RA, whereas NSAIDs are used broadly by patients with many painful conditions. We encourage further external validation in other non‐RA cohorts.
In conclusion, we have externally validated a previously derived risk score for major NSAID toxicity. When applied in clinical practice, this risk score should allow more personalized decision‐making for patients considering initiation of NSAIDs. NSAIDs represent one of the most common drugs used in rheumatology practice (1). Thus, it is important for rheumatologists to consider how to prescribe them most safely; we provide here a validated risk score that may assist providers with this goal.
Author Contributions
All authors were involved in drafting the article or revising it critically for important intellectual content, and all authors approved the final version to be published. Dr. Solomon had full access to all of the data in the study and takes responsibility for the integrity of the data and the accuracy of the data analysis.
Study conception and design
Solomon, Kremer.
Acquisition of data
Kremer.
Analysis and interpretation of data
Solomon, Paynter, Guan, Kremer.
Supported by the Corrona Research Foundation. Dr. Solomon and Mr. Guan's work was supported by funding from VERITY (NIH P30‐AR‐072577).
Daniel H. Solomon, MD, MPH, Nina P. Paynter, PhD, Hongshu Guan, MSc: Brigham and Women's Hospital, Boston, Massachusetts; 2Joel M. Kremer, MD: Corrona Research Foundation.
Dr. Solomon has received support from Pfizer for unrelated analyses. Dr. Kremer is employed by and has equity interest in Corrona. No other disclosures relevant to this article were reported.
References
- 1. Crane MM, Juneja M, Allen J, Kurrasch RH, Chu ME, Quattrocchi E, et al. Epidemiology and treatment of new‐onset and established rheumatoid arthritis in an insured US population. Arthritis Care Res (Hoboken) 2015;67:1646–55. [DOI] [PubMed] [Google Scholar]
- 2. Pilotto A, Franceschi M, Leandro G, Di Mario F, Geriatric Gastroenterology Study Group . NSAID and aspirin use by the elderly in general practice: effect on gastrointestinal symptoms and therapies. Drugs Aging 2003;20:701–10. [DOI] [PubMed] [Google Scholar]
- 3. Straube S, Tramer MR, Moore RA, Derry S, McQuay HJ. Mortality with upper gastrointestinal bleeding and perforation: effects of time and NSAID use. BMC Gastroenterol 2009;9:41. [DOI] [PMC free article] [PubMed] [Google Scholar]
- 4. Nissen SE, Yeomans ND, Solomon DH, Luscher TF, Libby P, Husni ME, et al. Cardiovascular safety of celecoxib, naproxen, or ibuprofen for arthritis. N Engl J Med 2016;375:2519–29. [DOI] [PubMed] [Google Scholar]
- 5. Solomon DH, Shao M, Wolski K, Nissen S, Husni ME, Paynter N. Derivation and validation of a major toxicity risk score among nonsteroidal antiinflammatory drug users based on data from a randomized controlled trial. Arthritis Rheumatol 2019;71:1225–31. [DOI] [PubMed] [Google Scholar]
- 6. Collins GS, Reitsma JB, Altman DG, Moons KG. Transparent reporting of a multivariable prediction model for individual prognosis or diagnosis (TRIPOD): the TRIPOD statement [published erratum appears in Ann Intern Med 2015;162:600]. Ann Intern Med 2015;162:55–63. [DOI] [PubMed] [Google Scholar]
- 7. Lloyd‐Jones DM, Wilson PW, Larson MG, Beiser A, Leip EP, D'Agostino RB, et al. Framingham risk score and prediction of lifetime risk for coronary heart disease. Am J Cardiol 2004;94:20–24. [DOI] [PubMed] [Google Scholar]
- 8. Graham I, Atar D, Borch‐Johnsen K, Boysen G, Burell G, Cifkova R, et al. European guidelines on cardiovascular disease prevention in clinical practice: full text. Eur J Cardiovasc Prev Rehabil 2007;14 Suppl 2:S1–113. [DOI] [PubMed] [Google Scholar]
- 9. Stone NJ, Robinson JG, Lichtenstein AH, Bairey Merz CN, Blum CB, Eckel RH, et al. 2013 ACC/AHA guideline on the treatment of blood cholesterol to reduce atherosclerotic cardiovascular risk in adults: a report of the American College of Cardiology/American Heart Association Task Force on practice guidelines. Circulation 2014;129 Suppl 2:S1–45. [DOI] [PubMed] [Google Scholar]
- 10. Kanis JA, Johnell O, Oden A, Johansson H, McCloskey E. FRAX and the assessment of fracture probability in men and women from the UK. Osteoporos Int 2008;19:385–97. [DOI] [PMC free article] [PubMed] [Google Scholar]
- 11. Kremer JM. The CORRONA database. Autoimmun Rev 2006;5:46–54. [DOI] [PubMed] [Google Scholar]
- 12. Greenberg JD, Kremer JM, Curtis JR, Hochberg MC, Reed G, Tsao P, et al. Tumour necrosis factor antagonist use and associated risk reduction of cardiovascular events among patients with rheumatoid arthritis. Ann Rheum Dis 2011;70:576–82. [DOI] [PubMed] [Google Scholar]
- 13. Wolfe MM, Lichtenstein DR, Singh G. Gastrointestinal toxicity of nonsteroidal antiinflammatory drugs [published erratum appears in New Engl J Med 1999;341:548]. New Engl J Med 1999;340:1888–99. [DOI] [PubMed] [Google Scholar]
- 14. Fries JF. The epidemiology of NSAID gastropathy: the ARAMIS experience. J Clin Rheumatol 1998;4 Suppl:S11–6. [DOI] [PubMed] [Google Scholar]
- 15. Fries JF, Williams CA, Bloch DA, Michel BA. Nonsteroidal anti‐inflammatory drug‐associated gastropathy: incidence and risk factor models. Am J Med 1991;91:213–22. [DOI] [PubMed] [Google Scholar]
- 16. Gabriel SE, Jaakkimainen L, Bombardier C. Risk for serious gastrointestinal complications related to use of nonsteroidal anti‐inflammatory drugs. A meta‐analysis. Ann Intern Med 1991;115:787–96. [DOI] [PubMed] [Google Scholar]
- 17. National Heart, Lung, and Blood Institute: National Institutes of Health . Estimating coronary heart disease (CHD) risk using Framingham heart study prediction score sheets. URL: https://framinghamheartstudy.org/fhs-risk-functions/cardiovascular-disease-10-year-risk/
- 18. McGinn TG, Guyatt GH, Wyer PC, Naylor CD, Stiell IG, Richardson WS, et al. Users’ guides to the medical literature. XXII. How to use articles about clinical decision rules. JAMA 2000;284:79–84. [DOI] [PubMed] [Google Scholar]
- 19. Wolfe F. Which HAQ is best? A comparison of the HAQ, MHAQ and RA‐HAQ, a difficult 8 item HAQ (DHAQ), and a rescored 20 item HAQ (HAQ20): analyses in 2,491 rheumatoid arthritis patients following leflunomide initiation. J Rheumatol 2001;28:982–9. [PubMed] [Google Scholar]