

Abstract
Introduction:
In 2017, Ohio had the second highest rate of drug overdose deaths in the United States. Current opioid related epidemiologic literature has begun to uncover the environmental level influences on the opioid epidemic and how the end results may ultimately manifest over space and time. This work is still nascent however, with most clustering research conducted at a spatial unit such as county level, which (1) can obscure differences between urban and rural communities, (2) does not consider dynamics that cross county lines, and (3) is difficult to interpret directly into strategic and localized intervention efforts. We address this gap by describing, at the Census block level, the spatial-temporal clustering of opioid related events in rural Ohio.
Methods:
We use the outcome of the administration of naloxone emergency medical service (EMS) calls in rural Ohio Census blocks during 2010–16 in a Poisson model of spatial scan statistics.
Results:
We found that naloxone event clustering in rural Ohio in the recent decade was widely dispersed over time and space, with clusters that average 17 times the risk of having an event compared to areas outside the cluster. Many of the larger spatial clusters crossed administrative boundaries (i.e., county lines) suggesting that opioid misuse may be less responsive to county level policies than to other factors.
Discussion:
Timely identification of localized overdose event clustering can guide affected communities toward rapid interventions aimed at minimizing the morbidity and mortality resulting from contagious opioid misuse.
Keywords: rural epidemiology, SatScan spatio-temporal statistics, opioid epidemic, Emergency Medical Services, naloxone, overdoses
1. Introduction
Opioid use disorder, overdose, and death continue to be a public health crisis. In the United States in 2017, there were 47,600 opioid overdose deaths, which accounted for 67.8% of all drug overdose deaths in that year (Center for Disease Control and Prevention, 2017). In 2017, Ohio had a rate of 46.3 drug overdose deaths per 100,000 (age adjusted) people, the second highest rate in the nation (Center for Disease Control and Prevention, 2017).
Research has begun to use geographic information systems (GIS) to examine the environmental correlates of opioid related overdoses and death. Population level factors positively associated with rates of opioid related overdoses and death include lower income (Basak et al., 2019; Cerdá et al., 2017; Hester et al., 2012; Spiller et al., 2009), percent disabled (Cordes, 2018; Hester et al., 2012), and population density (Mair et al., 2018). Percent of population who are African-American or Hispanic has been found to be negatively associated with opioid related death (Cordes, 2018), and population percent African-American is negatively associated with high volume opioid prescription areas (Basak et al., 2019). Other positively correlated ecological factors include number of manual labor industries (Cerdá et al., 2017; Pesarsick et al., 2019) and pharmacy density (Brownstein et al., 2010; Cerdá et al., 2017).
Researchers have more recently begun to consider the spatial and temporal trends in large opioid related epidemiological datasets. Using hierarchical Bayesian space-time models, Mair et al. (2018) determined that in Pennsylvania, from 2004–14, opioid use disorders and opioid poisonings were a largely urban problem, steadily increasing over time. The models correlated areas with many manual labor occupations and lower median incomes to areas of high opioid epidemic burden (Mair et al., 2018). Using similar statistical methods, Cerda et al. (2017) found what they described as a “spatial contagion” in California from 2001–10. Their analysis demonstrated that opioid poisoning events spread from rural and suburban/exurban hot spots to urban areas (Cerdá et al., 2017).
Most recently, three studies published in 2019 have considered how opioid misuse events may cluster spatially and temporally by using spatial scan statistics--a statistical method which finds clusters by comparing rates of the outcome from within a moving window to rates outside said window--with county level data. Romeiser et al. (2019) used publicly available opioid prescription and opioid death rate data from New York State, 2013–15 utilizing SatScan (Kulldorf, 2015), a software that implements spatial scan statistical methods to analyze spatio-temporal data, with a Poisson model. While they found several significant clusters for both outcomes, the prescription clusters and mortality clusters did not overlap much, essentially resulting in a null relationship (Romeiser et al., 2019).
Pesarick et al. also used scan statistics, as well as Ripley’s K function, to model clustering of a case-control dataset of emergency medical service (EMS) calls from southwestern Pennsylvania in 2007–18. The researchers designated EMS events that administrated naloxone as cases and used all other, non-naloxone (and non-traffic accident) administered events as controls. While Ripley’s K function found no clustering in the data, a spatial only Bernoulli model ran in SatScan found one significantly high cluster area. The researchers also noted that the urban and rural (non-significant) clusters differed in cluster size, in that the rural areas tended to have larger diameter clusters than urban areas, reflecting the differences in population density (Pesarsick et al., 2019).
Lastly, Basak et al. (2019) used a space-time Poisson model in SatScan to analyze Medicare paid prescription rates in counties in Virginia, West Virginia, and North Carolina in 2013–15. The researchers found that the top clusters in the 3 states all decreased in size in 2014–15 compared to 2013 but were stable from 2014–15 (Basak et al., 2019). Although these states have large rural areas, the researchers did not note urban-rural differences, perhaps because the data was compiled on the county level, which can be a mix of urban and rural areas.
Existing literature has thus begun to uncover the environmental level influences on the opioid epidemic and how the end results may ultimately manifest over space and time. This work is still nascent however, with most clustering research conducted at a spatial unit such as county level, which, for many counties, obscures rural and urban area differences. County level analysis may also miss dynamics that cross county lines. Further, there is evidence that negative outcomes from non-medical prescription opioid misuse is increasingly concentrated in states with large rural populations. A 2008 study found that while United States opioid analgesic overdose rates increased 52% in large metropolitan counties from 1999 to 2004 and increased 371% in nonmetropolitan counties (Paulozzi and Xi, 2008), suggesting that more research on rural specific opioid epidemic dynamics is needed to address this shift.
Studies of rural specific clustering of opioid overdoses or clustering at a measure smaller than Census tracts (which average about 4 square miles in size and about 4000 in population) are rare. However, the ability to respond and provide resources when overdoses occur are often more limited in rural areas than in urban areas. Without being able to ascertain whether these events cluster and where they cluster, it is more difficult to develop responses to these events. Thus, we aim to address this gap in the current study by describing, at the smallest possible measure, the spatial-temporal clustering of opioid related events in rural Ohio. We use the outcome of the administration of naloxone at an emergency medical service (EMS) call. Naloxone administration reverses the symptoms of opioid overdose—the nexus between opioid misuse and death—and thus could avert a fatality. Naloxone administration events thus provide a local metric of epidemic severity.
We extend and refine the use of a common cluster detection technique, the scan statistic, utilizing SatScan (Kulldorf, 2015), a software that implements spatial scan statistical methods to analyze spatio-temporal data. However, instead of the county, zip code, or Census tract level used in these studies, we uniquely use the Census block as our unit of measurement, and, also uniquely, use the “exact location” technique (further described in the methods) to ensure detection of irregular shaped clusters.
Our study was approved by the Institutional Review Board of The Ohio State University.
2. Methods
2.1. Study area
This study is geographically based in the state of Ohio, a polygon covering 41,000 square miles, of which 3457 square miles comprises Lake Erie and 247 square miles comprises various inland bodies of water (United States Census Bureau, 2019). As of the 2010 Census, Ohio was comprised of 277,807 Census blocks, 172,506 of which were designated as rural (United States Census Bureau, 2019) which combined covered total 33,297 square miles (calculated using Environmental Systems Research Institute’s (ESRI) ArcGIS Pro 10.4 program (Redlands, CA)).
2.2. Dataset
Cases are defined as EMS event calls that occurred between January 1, 2010 and December 31, 2016 and included the dispensing of the medication naloxone. The event call is counted once even if more than one dose of naloxone was dispensed (i.e., multiple distributions in the event that a first dose is not successful), as the data obtained did not contain variables that indicated number of patients or doses per event. The data also did not indicate if the patient survived the event. Data were obtained from the Ohio Department of Public Safety, Division of Emergency Medical Services, EMS Incident Reporting System. Administration of naloxone is not a perfect measure of opioid overdoses, as naloxone could be administered when an individual presents with symptoms similar to an overdose, individuals who overdose may die before medical help arrives, and some individuals who overdose may be taken straight to a hospital by family or friends, or treated with naloxone by a bystander without receiving follow up medical care. Despite this, naloxone administration by EMS personnel can be used as a proxy for opioid overdoses involving either prescription drugs or illicit drugs, such as heroin and fentanyl, making it a more complete measure of opioid overdose than other measures such as fatalities alone (Knowlton et al., 2013; Lindstrom et al., 2015).
2.3. Population
The population files contain the total population per Census block, derived from the 2010 United States Census obtained from the Integrated Public Use Microdata Series (IPUMS) National Historical Geographic Information Systems (IPUMS NHGIS) files, a collaboration that merges available census and survey microdata (IPUMS, 2019), and linked to 2010 United States Census TIGER/Line block shapefile (United States Census Bureau, 2019). Total population for rural Ohio blocks was 2,546,810. Blocks with a zero population values (71,301) were assigned a value of one to allow for nonzero population risks in all blocks.
2.4. Analysis
The address information for each event was geocoded into latitude and longitude coordinates using ArcGIS 10.3 program (Redlands, CA). There was 95.6% success in matching address to coordinate points. ArcGIS was used to link the coordinate points to their corresponding Census block. The case, block, and population data were exported to a comma separated value (csv) file for import into SatScan.
We conducted retrospective space-time analysis scanning for clusters with high rates using the Discrete Poisson model, wherein, the expected number of cases is proportional to the population size in each polygon, (Waller and Gotway, 2004), which in this study are Census blocks. SatScan methods analyze the most likely cluster by laying a grid of points across the study region, then drawing circular windows (or cylinders, when analyzing temporal data) of varying sizes, computing a likelihood ratio function based on the observed and expected observations inside the window (Cromley and McLafferty, 2011). The window with the maximum likelihood ratio is the cluster least likely to have occurred by chance. For each cluster, a relative risk ratio is generated, defined as the estimated risk within the cluster divided by the estimated risk outside the cluster. The p-values for each cluster are obtained through Monte Carlo hypothesis testing, by comparing rank of the maximum likelihood test from the dataset with the maximum likelihoods from randomly generated simulated datasets (Kulldorff, 2015).
Because we were looking for small localized patterns of opioid overdoses (as measured by naloxone administrations), we set the maximum spatial window size to 0.5% of the population and the minimum temporal window size to 2 years. We chose to use the “multiple coordinates per location” option in SatScan (Kulldorff, 2015), which allows the user to specify exact coordinates of each event, (as opposed to the more commonly used method of aggregating events to the geographic centroid of each polygon). While the use of polygon centroids provides more privacy protection, use of exact locations offers improved performance (Olson et al., 2006), increasing the ability to detect irregular shaped clusters (i.e., not round) and minimizing the distortion of the true clustering. Spatial scan statistics result in clusters of general location and size, but with uncertain borders (Oliveira et al., 2018). We therefore ran a spatial only Poisson model utilizing the Oliveira’s F function, which is calculated by SatScan generating M random datasets (we chose M = 1000) with the expected cases in location I set to equal the number of observed cases. The spatial scan statistic is applied to each random dataset using the original population counts, and F(i) is defined as the proportion (a value between [0,1]) of the most likely clusters in M runs that contain the location I (Oliveira et al., 2018). We included the block in the border of the cluster if I > 0.50.
We used the “near” tool in ArcGIS to calculate distance from each block to the nearest major highway or Interstate. T-tests were used to compare the Census block populations with naloxone events to Census block populations without events. For all tests, p-value cutoff was 0.05.
3. Results
The temporal-spatial distribution of naloxone events
There were 58,974 total naloxone events contained in the seven-year dataset, of which 8208 events occurred in blocks designated as rural. The 8208 naloxone events fell into 6172 rural Census blocks in Ohio. For 6172 rural Census blocks that contained events, the average population was 74 people per block, while for the 16,633 rural Census blocks without naloxone events, the average population was 13 people per block, a statistically significant difference.
Cluster analysis found 1132 naloxone events over 7 years for a population of 8341 residing within 29 total significant clusters in 52 of the 88 counties in Ohio. The 29 clusters were contained within 681 rural blocks, with a range of 1 to 91 blocks. Clusters averaged 50 events per cluster, with a range of 4 to 133. Population averaged 367 people per cluster, with a range of 1 to 875. The average relative risk (RR) per cluster was 17.10, with a range of RR=2.35 to RR=82.80. Table 1 summarizes the statistics for the 29 clusters.
Table 1.
Spatio-Temporal Clusters by County
| Spatio-Temporal Clusters by County | |||||
|---|---|---|---|---|---|
| Cluster | Number of Events | Total Population | Average RR | Years | Counties |
| 1 | 133 | 875 | 4.22 | 2010–12 | Allen, Defiance, Hancock, Henry, Paulding, Putnam, Wood |
| 2 | 120 | 758 | 3.73 | 2014–16 | Allen, Auglaize, Darke, Mercer, Van Wert |
| 3 | 52 | 379 | 4.07 | 2013–15 | Defiance, Fulton, Williams |
| 4 | 50 | 432 | 12.18 | 2013–15 | Ottawa |
| 5 | 62 | 450 | 3.00 | 2014–16 | Ashland, Coshocton, Holmes, Knox, Richland, Wayne |
| 6 | 67 | 451 | 3.25 | 2014–16 | Darke, Miami, Preble |
| 7 | 11 | 11 | 15.12 | 2014–16 | Ashtabula |
| 8 | 57 | 419 | 4.76 | 2010–12 | Hancock, Seneca, Wood, Wyandot |
| 9 | 50 | 444 | 2.74 | 2013–15 | Carroll, Harrison, Tuscarawas |
| 10 | 57 | 419 | 4.76 | 2010–12 | Hardin, Wyandot |
| 11 | 6 | 1 | 82.80 | 2014–16 | Franklin |
| 12 | 7 | 21 | 80.56 | 2013–15 | Butler, Warren |
| 13 | 57 | 434 | 2.35 | 2013–15 | Clinton, Fayette, Highland, Ross |
| 14 | 28 | 372 | 3.23 | 2010–12 | Morgan, Muskingum, Perry |
| 15 | 48 | 436 | 2.85 | 2014–16 | Adams, Brown |
| 16 | 31 | 418 | 3.01 | 2011–13 | Erie, Ottawa, Sandusky |
| 17 | 23 | 89 | 4.48 | 2013–15 | Champaign, Logan |
| 18 | 50 | 444 | 2.74 | 2013–15 | Coshocton, Guernsey, Harrison, Tuscarawas |
| 19 | 4 | 1 | 80.16 | 2014–16 | Cuyahoga |
| 20 | 4 | 6 | 63.73 | 2014–16 | Greene |
| 21 | 11 | 64 | 10.55 | 2014–16 | Ashland |
| 22 | 12 | 21 | 12.01 | 2012–13 | Preble |
| 23 | 39 | 272 | 3.46 | 2011–13 | Adams, Brown |
| 24 | 10 | 20 | 15.71 | 2012–14 | Fairfield |
| 25 | 79 | 632 | 4.34 | 2014–16 | Coshocton, Knox, Licking |
| 26 | 4 | 52 | 77.78 | 2010–12 | Belmont |
| 27 | 43 | 406 | 2.51 | 2014–16 | Ottawa |
| 28 | 6 | 2 | 27.59 | 2014–15 | Medina |
| 29 | 11 | 11 | 15.12 | 2014–16 | Ashtabula |
Northwest Region
The Northwest region of Ohio contained 8 clusters (see Figure 1). The clusters diameters were, in kilometers: 0.22; 3.36; 11.37; 12.99; 22.21; 28.78; 34.99; and 35.01. The clusters were in the counties of Williams, Fulton and Defiance, with an average relative risk of 3.97 inside the clusters compared to rural areas outside the clusters.
Figure 1.
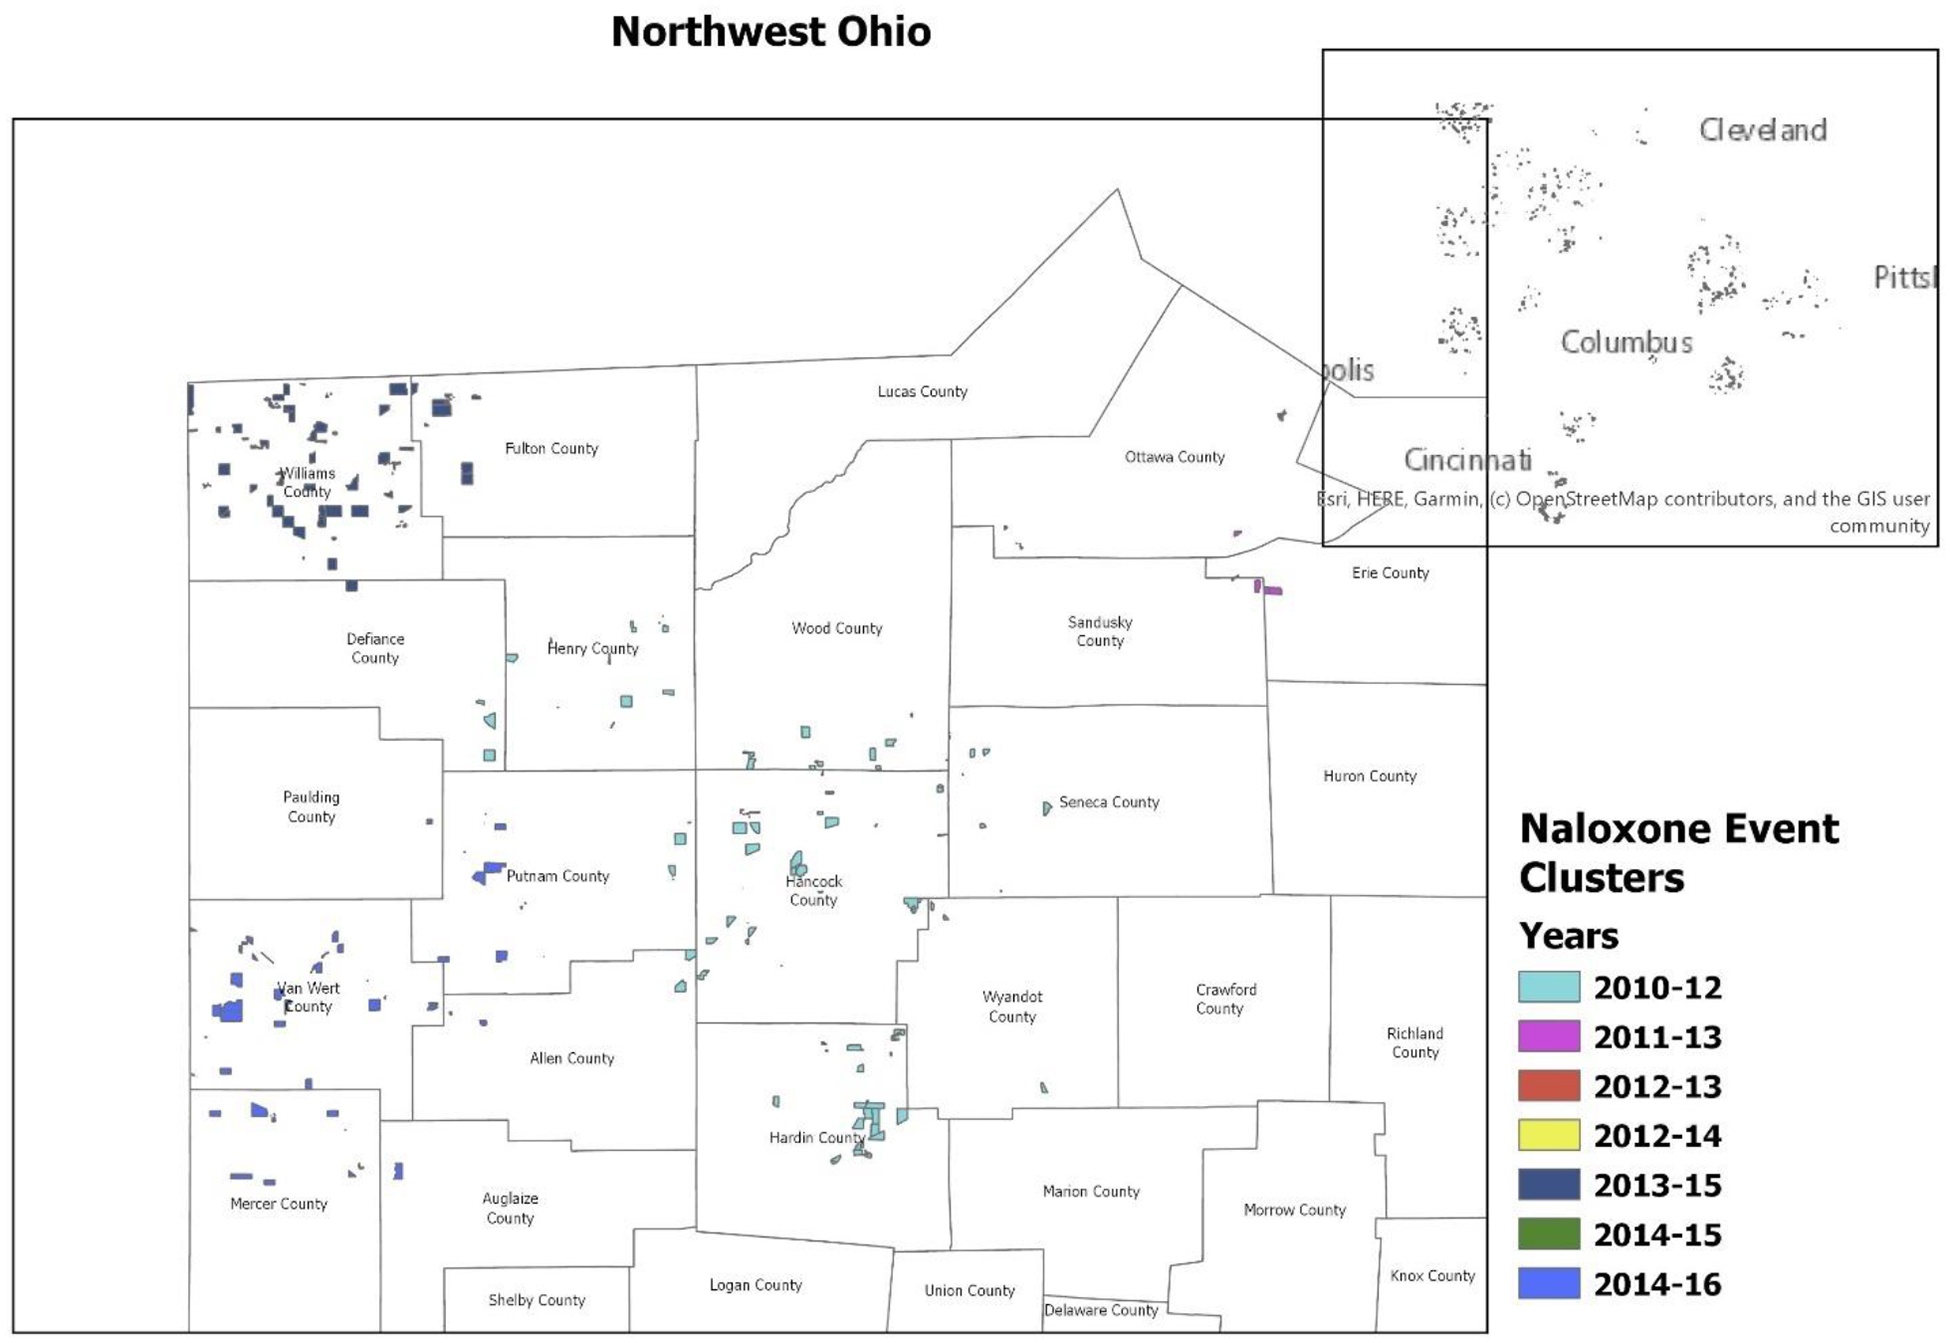
Northwest Ohio
*Census blocks with a total population of less than 10 have been suppressed to protect confidentiality.
Northeast Region
The Northeast region of Ohio contained 5 clusters (see Figure 2). The clusters diameters in kilometers were: 0.53; 4.05; 7.96; 15.47; and one single block with 4 events. The clusters were in the counties of Richland, Ashland, Wayne, Knox, Holmes, Licking, Coshocton, Tuscarawas, Harrison, Guernsey and Ashtabula counties, with an average relative risk of 3.84 inside the clusters compared to rural areas outside the clusters.
Figure 2.

Northeast Ohio
*Census blocks with a total population of less than 10 have been suppressed to protect confidentiality.
Southwest Region
The Southwest region of Ohio contained 8 clusters (see Figure 3). The clusters diameters in kilometers were: 2.75; 3.88; 14.68; 24.12; 24.21; 26.76; 30.75; and one single block with 4 events. The clusters were in the counties of Brown, Adams, Highland, Wilmington, Fayette, and Ross, with an average relative risk of 2.90 inside the clusters compared to rural areas outside the clusters.
Figure 3.
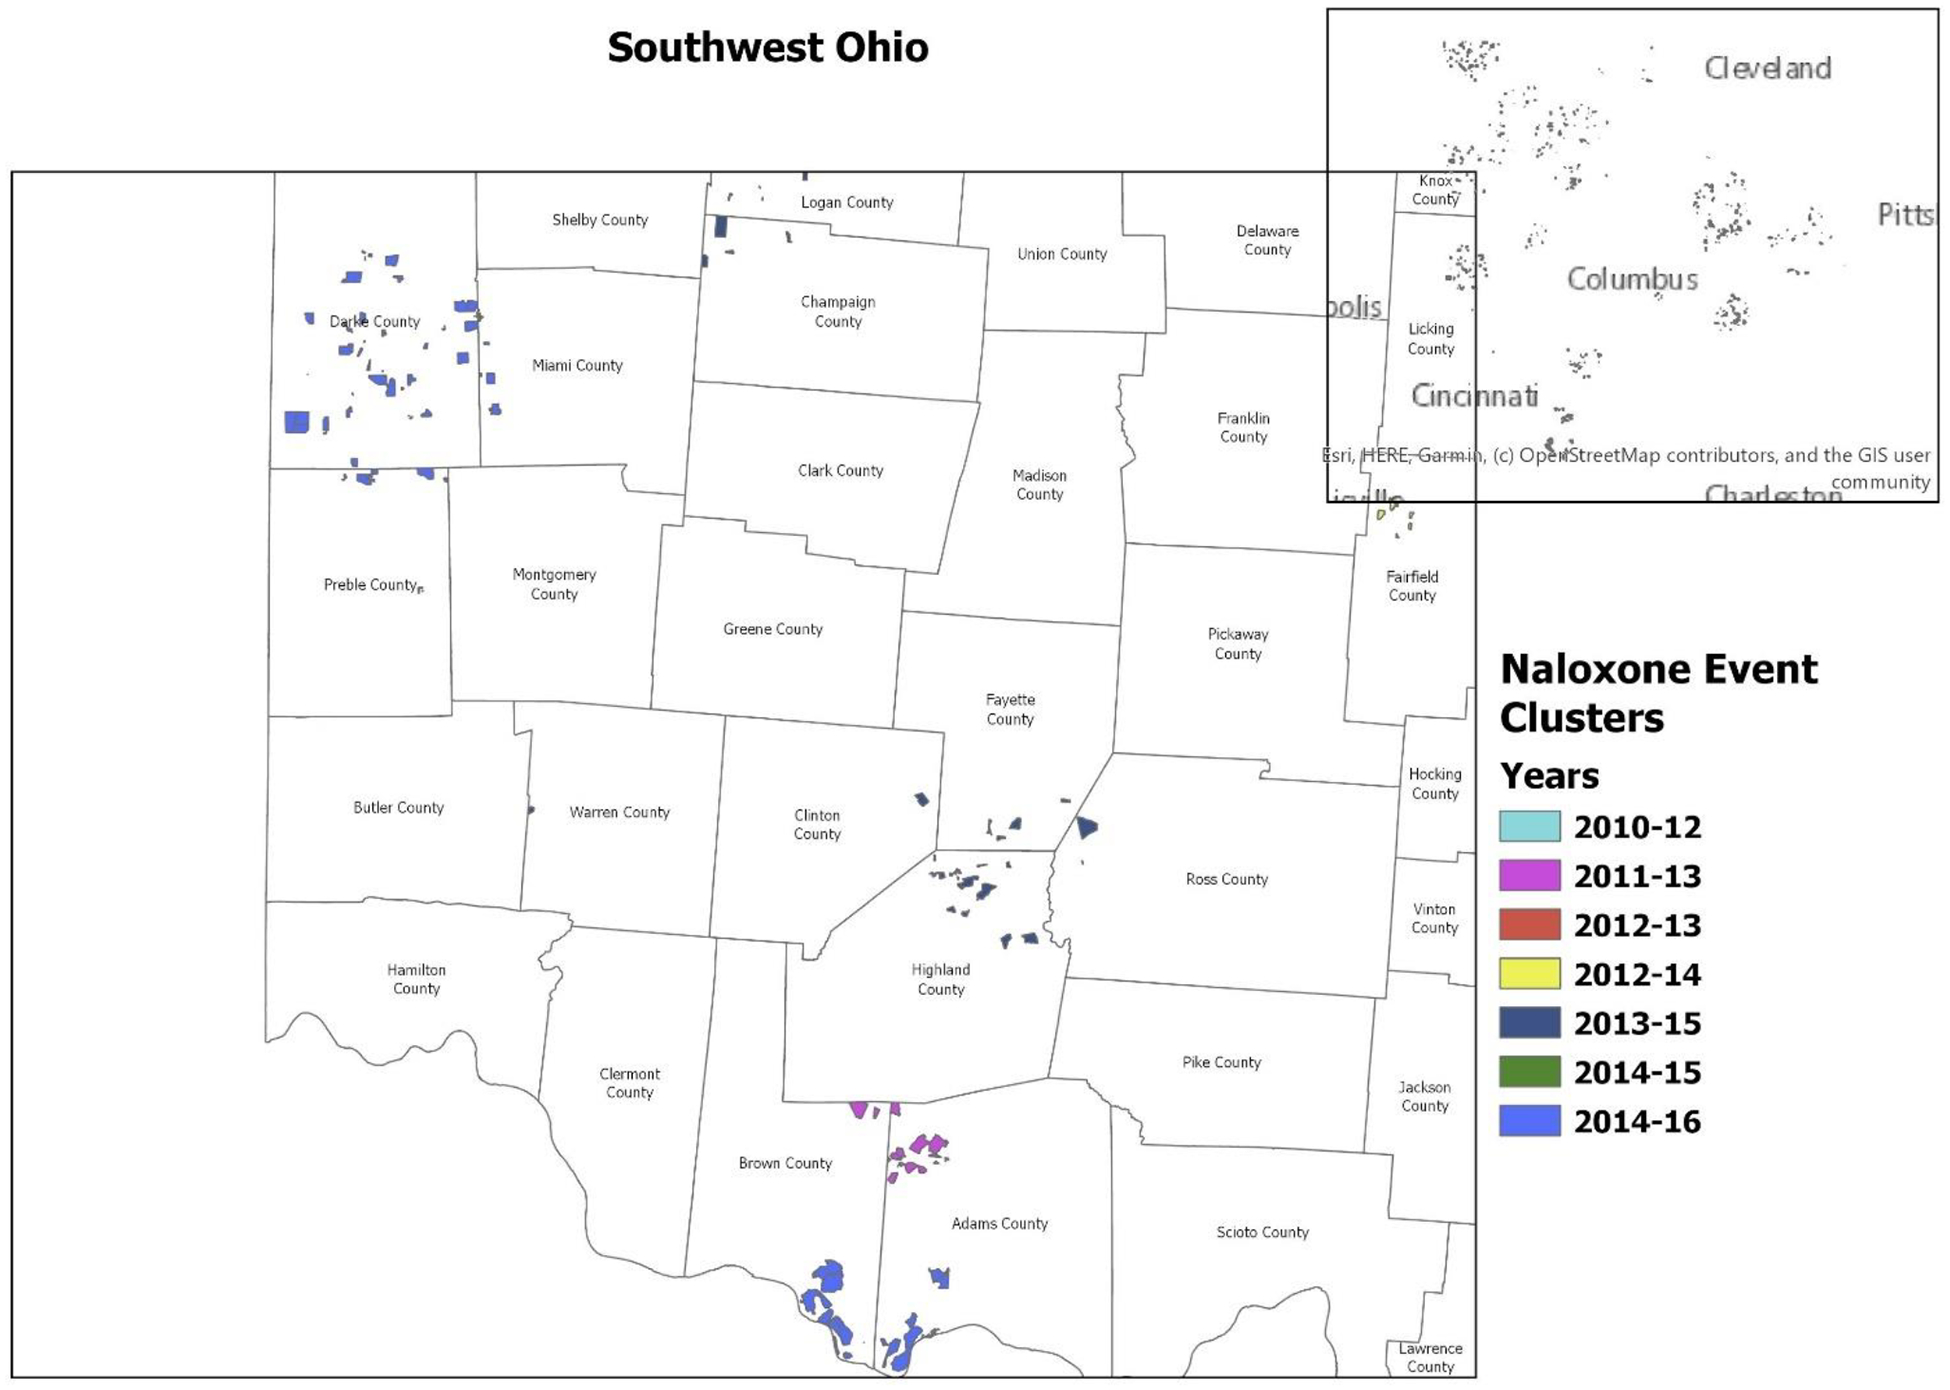
Southwest Ohio
*Census blocks with a total population of less than 10 have been suppressed to protect confidentiality.
Southeast Region
The Southeast region of Ohio contained 6 clusters (see Figure 4). The clusters diameters were, in kilometers: 0.38; 1.45; 8.09; 12.42; 19.66; and 20.86. The clusters were in the counties of Fairfield, Perry, Muskingum and Morgan, with an average relative risk of 23.44 inside the clusters compared to rural areas outside the clusters. The grand average is skewed by the events in low population (non-residential) locations.
Figure 4.
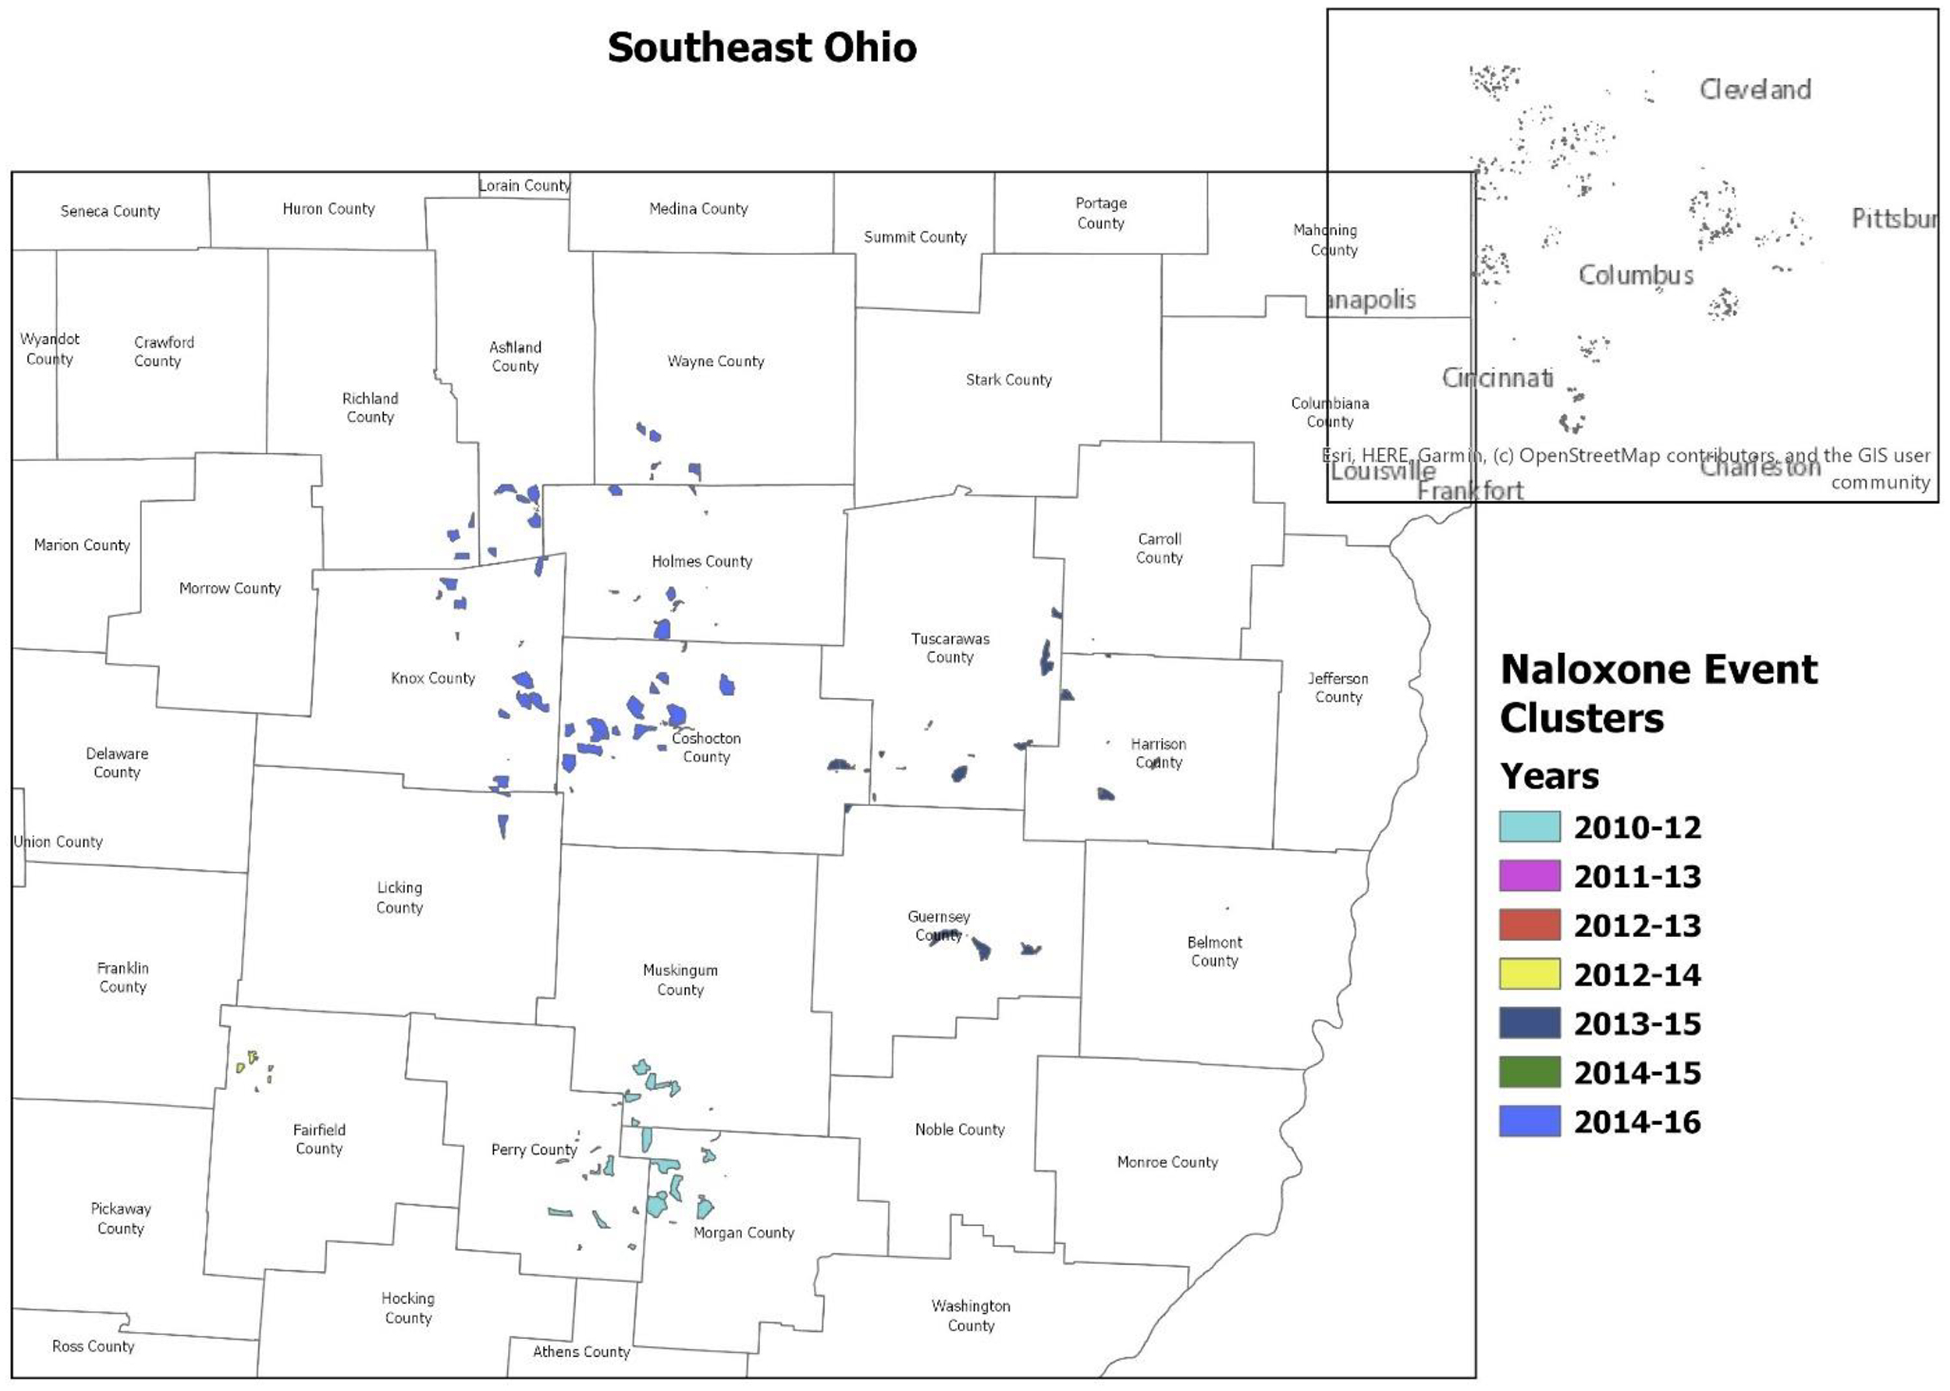
Southeast Ohio
*Census blocks with a total population of less than 10 have been suppressed to protect confidentiality.
Central
The Central region of Ohio contained 2 clusters (see Figure 5). The cluster diameters were 15.30 km and 16.35 km. The clusters were in the counties of Franklin and Fairfield, with an average relative risk of 49.26 inside the clusters compared to rural areas outside the clusters. The grand average is skewed by the events in low population (non-residential) locations.
Figure 5.

Central Ohio
*Census blocks with a total population of less than 10 have been suppressed to protect confidentiality.
Temporal Trends
Temporally, the number of clusters increased in number and size from 2010–13 to 2014–16 (see Figure 6 and time lapsed GIF provided in supplementary materials1). Particularly in the west, clusters dispersed from more central rural regions towards Ohio’s rural border with Indiana.
Figure 6.

Spatio-Temporal Clusters by Years
Proximity to Major Thoroughfares
Clusters were largely near major Interstates and highways, with approximately 51% within 8 kilometers and approximately 65% within 16 kilometers. For small clusters (<5 kilometers in diameter), approximately 91% were within 16 kilometers of a major thoroughfare.
4. Discussion
We find naloxone event clustering in rural Ohio in 2010–16 to be widely dispersed over time and space, though all the 4 “corner” regions experienced clusters in the last 3 years. The latter finding echoes the results of a recent (2019) nationwide study of opioid overdose deaths by counties: all Ohio counties were classified as having higher than average opioid related mortalities, with many of the rural counties in the Northwest, Northeast, and particularly, the Southwest regions having what has been identified as above average and fast growing mortality rates related to synthetic opioids used alone or with prescription opioids (Monnat et al., 2019). The spatial dispersion indicates that the opioid accessibility in rural Ohio is not geographically isolated and demonstrates that although rural opioid related deaths are lower in rural counties than metropolitan ones, between 1999 and 2016, rural rates have seen the largest increases (Rigg et al., 2018).
Temporally, clusters increased in number and total size in the last two years of the dataset (2014–16). This increase may be in part due to the state of Ohio’s 2014 expanded use of naloxone for EMS to include intranasal and prefilled auto-injector administrations (Ohio Public Health Department, 2016). However, this expansion in 2014 also coincides with a large (426%) increase from 2013 to 2014 in drug products tested by law enforcement that contain illicitly manufactured fentanyl (IMF) (Seth et al., 2018). IMF is mixed with white powder heroin or made into counterfeit prescription pills, and users who may not know about these chemical compositions (Fairbairn et al., 2017). From 2013 to 2016, there was a fivefold increase in deaths involving synthetic opioids in the United States, from 3105 to approximately 20,000 (O’Donnell et al., 2017), with one study finding that the surge of fentanyl related deaths in Ohio during this time was closely related to increases in IMF supply in the state (Peterson et al., 2016).
Cluster diameters varied widely, with the largest cluster (35.01km) 194 times the size of the smallest (0.22km). The smallest clusters (< 5k) were in blocks wherein the total number of residents was 3 or less, and these clusters were mostly (91%) located within 16 kilometers of major highways and interstates. Some counties (such as Franklin and Medina) included multiple events despite a population size of one person. These clusters occurred in industrial areas with construction businesses, or non-residential blocks. Public and semi-public illicit drug use (often in restrooms) is common, especially with users who inject (Fozouni et al., 2019), and at least one study found that approximately 16% of EMS calls administering naloxone responded to public places or roadways (Merchant et al., 2006).
Medium and large clusters were also predominately located within 16 kilometers of major thoroughfares (approximately 65%). (see Figure 7) That we found EMS naloxone administration clusters in proximal to major highways supports the theory that illicit drugs move over land to intermediate markets (Weaver et al., 2014) and that the flow of availability diffuses to networks of family and friends as it flows into the rural areas of the state (Draus and Carlson, 2006). An informal network may better explain the cluster found in rural Franklin County, a county that is considerably more urban than rural. The large clustering in the Northwest corner where the Interstate 80 crosses in from Indiana in 2013–15 coincided with a sharp spike in overdose fatalities from fentanyl in the United States (Rudd et al., 2016), It could be that this cluster represented the first point of entry into Ohio of a large influx of synthetic opioids.
Figure 7.

Spatio-Temporal Clusters and Major Thoroughfares
That many of the larger spatial clusters crossed administrative boundaries (i.e., county lines) suggests that opioid misuse is less responsive to county level policies than to other factors. That rural Census blocks with naloxone events, on average, were more populated than those without events suggests that the clustering is likely a confluence of factors operating at the level of providers (i.e., supply, or availability and accessibility), individual users (i.e., demand, chronic pain and/or addiction), and social acceptance/tolerance (i.e., use in the presence of others who alert 9–1-1). The western clusters along the border of Indiana could be indicative of these dynamics playing out across state lines.
In 2019, Hepler et al. used 2013–15 surveillance data to calculate that the highest relative burden area for opioid deaths in Ohio was the southwestern counties. The researchers suggest that resources allocated to the south and southeast to combat these resources should be expanded into the southwest region (Hepler et al., 2019). We did find one naloxone event cluster in Southwest counties (Highland, Fayette, and Wilmington) for the same time period (2013–15), and another partially in the same time period (in the counties of Brown and Adams in 2014–16), suggesting that EMS naloxone administration alone did not mitigate the risk in that region.
Further research is needed to ascertain if EMS naloxone administration is sufficiently addressing the opioid epidemic in rural Ohio. In a national study of EMS naloxone administration data, Faul et al. (2015) found that while the odds of naloxone administration were higher in rural communities (23%), the odds of opioid-related death were also higher (45%) in rural communities than in urban areas. This phenomenon could be an artifact of the shift in drug availability in the United States, with fentanyl and fentanyl analogues increasingly driving overdose deaths, particularly in the Northeast (Jalal et al., 2018). Indeed, a study of unintentional overdose deaths (n=281) in 24 Ohio counties found that 90% involved a form of fentanyl (Daniulaityte et al., 2017). Fentanyl is more potent than heroin—with onset of overdose occurring within minutes (Green and Gilbert, 2016), and sometimes requiring multiple administrations of naloxone to reverse (Somerville et al., 2017). If a rural overdose involved fentanyl or similar analgesic, the increased response time (relative to urban areas) for EMS (Faul et al., 2017) may allow for only one attempt (dose) of naloxone, if any, before the patient dies. Additionally, the type of EMS workers who are more common in rural areas (EMT-basics) are less likely to administer naloxone, and indeed are in some states prohibited from doing so (Faul et al., 2017).
Rural area interventions for opioid and especially fentanyl overdoses may best be addressed by increased community involvement. A study of pharmacies with confirmed availability of naloxone found that those pharmacies were located in zip codes with higher rates of death (7.38 per 100,000) than those zip codes without a pharmacy stocking naloxone (4.84 deaths per 100,000) (Burrell et al., 2017), suggesting that availability alone is insufficient. Accessibility appears to be key: proximity to a lay distribution program has been found to be positively associated with lower opioid related deaths (Rowe et al., 2016), and take-home naloxone programs have likewise been associated with reducing opioid related deaths for both participants and their surrounding communities (McDonald and Strang, 2016).
More research is needed to confirm how the above factors manifest in rural Ohio. Researchers have posited that rural areas are more likely to have older workers in heavy labor occupations, which would drive up demand and increase supply (Keyes et al., 2014). Rural communities place a strong emphasis on relationships with family and neighbors, and this emphasis--while often considered protective against adverse behaviors--can perversely influence behaviors as well, as non-medical users obtain prescription opioids from family and friends (Dew et al., 2007; Keyes et al., 2014). Living in a small isolated population can also mean that those living with addiction will have limited access to addiction resources and will fear for social stigma resulting from use of such resources (Dew et al., 2007).
Our study was limited by the absence of descriptive factors in the dataset. We do not know if the event response was a residence, public venue, or other location. A study of naloxone events administered during EMS calls in Rhode Island found that the most common location was private residences (Merchant et al., 2006), and it would be interesting to compare if the same were true for rural locations. We also do not know if the patient was a resident of the approximate area at or near the event site. We do not know if any of the patients had more than one dose. A recent study national level study of EMS naloxone events found that, perhaps due to increased fentanyl use, multiple naloxone administrations (MNA) are increasing overall, though living in a rural area was found to be protective (Faul et al., 2017). Finally, not included in the data is the specific opioid(s) that precipitated each reversal event. While heroin use is considered more prevalent in urban areas (Cerdá et al., 2013; Cordes, 2018; Green et al., 2011); this has been found to be only partially true in Ohio (Monnat et al., 2019). Conversely, we do not know if any of the naloxone events were false positives.
Our data was also limited in that it contained only naloxone events administered during EMS calls. It does not include naloxone administered by other first responders, by a lay person, or at a hospital and does not include overdose events wherein no naloxone was administered (i.e., deaths). Thus, our data represents only a subset of all naloxone administrations in the rural areas during the time period. More research is needed to determine if non-EMS naloxone administrations might have different spatio-temporal patterns than those we found. Finally, as we did not have the ages of patients, we did not normalize the data with age adjusted population counts for Census blocks; a more refined denominator may produce more accurate results.
In a large epidemiological study of rural Ohio, we found that EMS naloxone events cluster over space and time, with clusters averaging 17 times the risk of having an event compared to areas outside the clusters. Over time, clusters increased in number and size, crossed county lines and, in the western region, were lined along the Indiana border. We demonstrate the utility of analyzing spatio-temporal data to ascertain trends in medical response to the opioid crisis in Ohio. Such information on localized patterns can be collated with surveillance (law enforcement) data to ascertain supply chains and with death data to ascertain intervention effectiveness. Timely identification of localized overdose event clustering could guide affected communities toward rapid interventions aimed at minimizing the morbidity and mortality resulting from contagious opioid misuse.
Supplementary Material
Highlights.
Clustering in rural Ohio was widely dispersed over space and time.
The smallest clusters appeared to be in non-residential districts.
Many clusters crossed county lines.
Risk inside clusters averaged 17 times the risk outside the clusters.
Clusters increased in number and total size in the last two years of the dataset.
Acknowledgements.
This project was supported by grant numbers R01-AA-026850 and P60-AA-006282 from the National Institute on Alcohol Abuse and Alcoholism. The content is solely the responsibility of the authors and does not necessarily represent the National Institute on Alcohol Abuse and Alcoholism or the National Institutes of Health.
Footnotes
Publisher's Disclaimer: This is a PDF file of an unedited manuscript that has been accepted for publication. As a service to our customers we are providing this early version of the manuscript. The manuscript will undergo copyediting, typesetting, and review of the resulting proof before it is published in its final form. Please note that during the production process errors may be discovered which could affect the content, and all legal disclaimers that apply to the journal pertain.
Supplementary material can be found by accessing the online version of this paper.
Disclosures:
The spatio-temporal distribution of naloxone administration events in Rural Ohio 2010–16
The authors responsible for this research have participated in the concept and design, analysis and interpretation of data, drafting or revising the manuscript, and approve the manuscript as submitted.
The authors have no conflicts of interest to declare.
Supplementary material can be found by accessing the online version of this paper.
Contributor Information
Holly Thurston, College of Social Work, The Ohio State University, 1947 College Rd. N, Columbus, OH 43210; Division of Social Work, California State University, Sacramento, 6000 J Street, Sacramento, CA 95819-6090.
Bridget Freisthler, College of Social Work, The Ohio State University, 340C Stillman Hall, 1947 College Rd. N, Columbus, OH 43210.
References
- Basak A, Cadena J, Marathe A, and Vullikanti A (2019). Detection of Spatiotemporal Prescription Opioid Hot Spots With Network Scan Statistics: Multistate Analysis. JMIR public health and surveillance, 5(2), e12110. [DOI] [PMC free article] [PubMed] [Google Scholar]
- Brownstein JS, Green TC, Cassidy TA, and Butler SF (2010). Geographic information systems and pharmacoepidemiology: using spatial cluster detection to monitor local patterns of prescription opioid abuse. Pharmacoepidemiology and drug safety, 19(6), 627–637. [DOI] [PMC free article] [PubMed] [Google Scholar]
- Burrell A, Ethun L, Fawcett JA, Rickard-Aasen S, Williams K, Kearney SM, and Pringle JL (2017). The pharmacist’s role in overdose: Using mapping technologies to analyze naloxone and pharmacy distribution. Journal of the American Pharmacists Association, 57(2), S73–S77.e71. [DOI] [PubMed] [Google Scholar]
- Center for Disease Control and Prevention. (2017). Opioid Overdose Deaths. Retrieved 10/16/19 from https://www.cdc.gov/drugoverdose/data/statedeaths.html
- Cerdá M, Gaidus A, Keyes KM, Ponicki W, Martins S, Galea S, and Gruenewald P (2017). Prescription opioid poisoning across urban and rural areas: identifying vulnerable groups and geographic areas. Addiction, 112(1), 103–112. [DOI] [PMC free article] [PubMed] [Google Scholar]
- Cerdá M, Ransome Y, Keyes KM, Koenen KC, Tardiff K, Vlahov D, and Galea S (2013). Revisiting the role of the urban environment in substance use: the case of analgesic overdose fatalities. American Journal of Public Health, 103(12), 2252–2260. [DOI] [PMC free article] [PubMed] [Google Scholar]
- Cordes J (2018). Spatial Trends in Opioid Overdose Mortality in North Carolina: 1999–2015. Southeastern Geographer, 58(2), 193–211. [Google Scholar]
- Cromley EK, and McLafferty SL (2011). GIS and public health: Guilford Press, New York. [Google Scholar]
- Daniulaityte R, Juhascik MP, Strayer KE, Sizemore IE, Harshbarger KE, Antonides HM, and Carlson RR (2017). Overdose deaths related to fentanyl and its analogs—Ohio, January–February 2017. MMWR. Morbidity and mortality weekly report, 66(34), 904. [DOI] [PMC free article] [PubMed] [Google Scholar]
- Dew B, Elifson K, and Dozier M (2007). Social and environmental factors and their influence on drug use vulnerability and resiliency in rural populations. The Journal of Rural Health, 23, 16–21. [DOI] [PubMed] [Google Scholar]
- Draus PJ, and Carlson RG (2006). Needles in the haystacks: The social context of initiation to heroin injection in rural Ohio. Substance use and misuse, 41(8), 1111–1124. [DOI] [PubMed] [Google Scholar]
- Fairbairn N, Coffin PO, and Walley AY (2017). Naloxone for heroin, prescription opioid, and illicitly made fentanyl overdoses: challenges and innovations responding to a dynamic epidemic. International Journal of Drug Policy, 46, 172–179. [DOI] [PMC free article] [PubMed] [Google Scholar]
- Faul M, Lurie P, Kinsman JM, Dailey MW, Crabaugh C, and Sasser SM (2017). Multiple naloxone administrations among emergency medical service providers is increasing. Prehospital Emergency Care, 21(4), 411–419. [DOI] [PMC free article] [PubMed] [Google Scholar]
- Fozouni L, Buchheit B, Walley AY, Testa M, and Chatterjee A (2019). Public restrooms and the opioid epidemic. Substance abuse, 1–5. [DOI] [PubMed] [Google Scholar]
- Green TC, and Gilbert M (2016). Counterfeit medications and fentanyl. JAMA internal medicine, 176(10), 1555–1557. [DOI] [PubMed] [Google Scholar]
- Green TC, Grau LE, Carver HW, Kinzly M, and Heimer R (2011). Epidemiologic trends and geographic patterns of fatal opioid intoxications in Connecticut, USA: 1997–2007. Drug and alcohol dependence, 115(3), 221–228. [DOI] [PMC free article] [PubMed] [Google Scholar]
- Hepler S, McKnight E, Bonny A, and Kline D (2019). A Latent Spatial Factor Approach for Synthesizing Opioid-Associated Deaths and Treatment Admissions in Ohio Counties. Epidemiology, 30(3), 365–370. [DOI] [PubMed] [Google Scholar]
- Hester L, Shi X, and Morden N (2012). Characterizing the geographic variation and risk factors of fatal prescription opioid poisoning in New Hampshire, 2003–2007. Annals of GIS, 18(2), 99–108. [Google Scholar]
- Jalal H, Buchanich JM, Roberts MS, Balmert LC, Zhang K, and Burke DS (2018). Changing dynamics of the drug overdose epidemic in the United States from 1979 through 2016. Science, 361(6408), eaau1184. [DOI] [PMC free article] [PubMed] [Google Scholar]
- Keyes KM, Cerdá M, Brady JE, Havens JR, and Galea S (2014). Understanding the rural–urban differences in nonmedical prescription opioid use and abuse in the United States. American Journal of Public Health, 104(2), e52–e59. [DOI] [PMC free article] [PubMed] [Google Scholar]
- Knowlton A, Weir BW, Hazzard F, Olsen Y, McWilliams J, Fields J, and Gaasch W (2013). EMS runs for suspected opioid overdose: implications for surveillance and prevention. Prehospital Emergency Care, 17(3), 317–329. [DOI] [PMC free article] [PubMed] [Google Scholar]
- Kulldorff M (2015). SatScan User Guide, Version 9.4. Retrieved 10/2/2019 from www.satscan.org
- Lindstrom HA, Clemency BM, Snyder R, Consiglio JD, May PR, and Moscati RM (2015). Prehospital naloxone administration as a public health surveillance tool: a retrospective validation study. Prehospital and disaster medicine, 30(4), 385–389. [DOI] [PubMed] [Google Scholar]
- Mair C, Sumetsky N, Burke JG, and Gaidus A (2018). Investigating the social ecological contexts of opioid use disorder and poisoning hospitalizations in Pennsylvania. Journal of Studies on Alcohol and Drugs, 79(6), 899–908. [DOI] [PMC free article] [PubMed] [Google Scholar]
- McDonald R, and Strang J (2016). Are take home naloxone programmes effective? Systematic review utilizing application of the Bradford Hill criteria. Addiction, 111(7), 1177–1187. [DOI] [PMC free article] [PubMed] [Google Scholar]
- Merchant RC, Schwartzapfel BL, Wolf FA, Li W, Carlson L, and Rich JD (2006). Demographic, geographic, and temporal patterns of ambulance runs for suspected opiate overdose in Rhode Island, 1997–2002. Substance use and misuse, 41(9), 1209–1226. [DOI] [PubMed] [Google Scholar]
- Monnat SM, Peters DJ, Berg MT, and Hochstetler A (2019). Using Census Data to Understand County-Level Differences in Overall Drug Mortality and Opioid-Related Mortality by Opioid Type. American Journal of Public Health (0), e1–e8. [DOI] [PMC free article] [PubMed] [Google Scholar]
- O’Donnell JK, Halpin J, Mattson CL, Goldberger BA, and Gladden RM (2017). Deaths involving fentanyl, fentanyl analogs, and U-47700—10 states, July–December 2016. MMWR. Morbidity and mortality weekly report, 66(43), 1197. [DOI] [PMC free article] [PubMed] [Google Scholar]
- Ohio Public Health Department (2016). ems-NALOXONE-INTRANASAL-AND-AUTO-INJECTORS-Education-and-Training 1–29-2016. Retrieved on 2/6/2020 from http://www.publicsafety.ohio.gov/links/ems-NALOXONE-INTRANASAL-AND-AUTO-INJECTORS-Education-and-Training%201-29-2016.pptx
- Oliveira FL, Cançado AL, de Souza G, Moreira GJ, and Kulldorff M (2018). Border analysis for spatial clusters. International journal of health geographics, 17(1), 5. [DOI] [PMC free article] [PubMed] [Google Scholar]
- Olson KL, Grannis SJ, and Mandl KD (2006). Privacy protection versus cluster detection in spatial epidemiology. American Journal of Public Health, 96(11), 2002–2008. [DOI] [PMC free article] [PubMed] [Google Scholar]
- Paulozzi LJ, and Xi Y (2008). Recent changes in drug poisoning mortality in the United States by urban–rural status and by drug type. Pharmacoepidemiology and drug safety, 17(10), 997–1005. [DOI] [PubMed] [Google Scholar]
- Pesarsick J, Gwilliam M, Adeniran O, Rudisill T, Smith G, and Hendricks B (2019). Identifying high-risk areas for nonfatal opioid overdose: a spatial case-control study using EMS run data. Ann. Epidemiol, 36, 20–25. [DOI] [PMC free article] [PubMed] [Google Scholar]
- Peterson AB, Gladden RM, Delcher C, Spies E, Garcia-Williams A, Wang Y, Halpin J, Zibbell J, McCarty JL, DeFiore-Hyrmer J, DiOrio M, and Goldberger BA (2016). Increases in fentanyl-related overdose deaths—Florida and Ohio, 2013–2015. Morbidity and Mortality Weekly Report, 65(33), 844–849. [DOI] [PubMed] [Google Scholar]
- Rigg KK, Monnat SM, and Chavez MN (2018). Opioid-related mortality in rural America: geographic heterogeneity and intervention strategies. International Journal of Drug Policy, 57, 119–129. [DOI] [PubMed] [Google Scholar]
- Romeiser JL, Labriola J, and Meliker JR (2019). Geographic patterns of prescription opioids and opioid overdose deaths in New York State, 2013–2015. Drug and alcohol dependence, 195, 94–100. [DOI] [PubMed] [Google Scholar]
- Rowe C, Santos G-M, Vittinghoff E, Wheeler E, Davidson P, and Coffin PO (2016). Neighborhood-level and spatial characteristics associated with lay naloxone reversal events and opioid overdose deaths. Journal of Urban Health, 93(1), 117–130. [DOI] [PMC free article] [PubMed] [Google Scholar]
- Rudd RA, Aleshire N, Zibbell JE, and Gladden MR (2016). Increases in drug and opioid overdose deaths—United States, 2000–2014. American Journal of Transplantation, 16(4), 1323–1327. [DOI] [PubMed] [Google Scholar]
- Seth P, Rudd RA, Noonan RK, and Haegerich TM (2018). Quantifying the epidemic of prescription opioid overdose deaths. American Journal of Public Health 108(4) 500–502. [DOI] [PMC free article] [PubMed] [Google Scholar]
- Somerville NJ, O’Donnell J, Gladden RM, Zibbell JE, Green TC, Younkin M, and Callis BP (2017). Characteristics of fentanyl overdose—Massachusetts, 2014–2016. MMWR. Morbidity and mortality weekly report, 66(14), 382. [DOI] [PMC free article] [PubMed] [Google Scholar]
- Spiller H, Lorenz DJ, Bailey EJ, and Dart RC (2009). Epidemiological trends in abuse and misuse of prescription opioids. Journal of addictive diseases, 28(2), 130–136. [DOI] [PubMed] [Google Scholar]
- Waller LA, and Gotway CA (2004). Applied spatial statistics for public health data (Vol. 368): John Wiley and Sons, Hoboken. [Google Scholar]
- Weaver GS, Corzine J, Huff-Corzine L, McCutcheon JC, and Vrbas J (2014). Highways to homicide: Interstates, drug markets, and violence. International Journal of Contemporary Sociology, 51, 117–145. [Google Scholar]
Associated Data
This section collects any data citations, data availability statements, or supplementary materials included in this article.