Abstract
Temperature is a major environmental cue affecting plant growth and development. Plants often experience higher temperatures in the context of a 24 h day-night cycle, with temperatures peaking in the middle of the day. Here we find that the transcript encoding the bHLH transcription factor PIF7 undergoes a direct increase in translation in response to warmer temperature. Diurnal expression of PIF7 transcript gates this response, allowing PIF7 protein to quickly accumulate in response to warm daytime temperature. Enhanced PIF7 protein levels directly activate the thermomorphogenesis pathway by inducing the transcription of key genes such as the auxin biosynthetic gene YUCCA8, and are necessary for thermomorphogenesis to occur under warm cycling daytime temperatures. The temperature-dependent translational enhancement of PIF7 mRNA is mediated by the formation of an RNA hairpin within its 5’ UTR, which adopts an alternative conformation at higher temperature, leading to increased protein synthesis. We identified similar hairpin sequences that control translation in additional transcripts including WRKY22 and the key heat shock regulator HSFA2, suggesting this is a conserved mechanism enabling plants to respond and adapt rapidly to high temperatures.
Introduction
Temperature is a major cue influencing plant growth and development, a process collectively known as thermomorphogenesis 1, and the distribution and phenology of plants has already altered in response to climate change 2. Known thermosensory pathways converge on the regulation of the bHLH transcription factor PHYTOCHROME INTERACTING FACTOR4 (PIF4). Under short day (SD) photoperiods, PIF4 is transcriptionally activated at night by warm temperature due to reduced evening complex (EC) activity 3–6. In parallel, accelerated phytochrome dark reversion increases the expression of PIF4 target genes at higher temperatures 7,8. Increased PIF4 activity coincides with the peak of elongation growth at the end of the night 9 and PIF4 is essential for increased hypocotyl growth at warm temperature as it induces growth-promoting genes such as ATHB2 and auxin response genes such as INDOLE ACETIC ACID-INDUCIBLE 19 (IAA19) and IAA29 10,11.
In long days (LD), elongation growth occurs mainly during the day 9. While elongation growth under LD is reduced compared to SD 12–14, significant thermomorphogenesis still occurs in warm LD conditions and requires activity of PIF4 10. The mechanisms controlling thermomorphogenesis during daytime are not fully understood, but include stabilization of PIF4 by the transcriptional activator HEMERA (HMR) 15. In addition, high temperatures can promote thermal reversion of phytochromes even in daylight 8 and trigger nuclear accumulation of the E3 ubiquitin ligase CONSTITUTIVELY PHOTOMORPHOGENIC 1 (COP1), which targets growth-inhibiting transcription factors such as ELONGATED HYPOCOTYL 5 (HY5) for proteasomal degradation 16.
Thermosensory pathways have mostly been investigated under constant temperatures; temperate plants however experience warm summer temperatures that cycle over 24 h, peaking in the middle of the day, and Arabidopsis grown under natural temperature cycles shows distinct responses 17. Here we show that the PIF4-related bHLH transcription factor PIF7 is necessary for thermomorphogenesis under cycling temperatures in LD and controls expression of key thermomorphogenesis genes such as the auxin biosynthesis gene YUCCA8 (YUC8) 18. Warm temperature selectively enhances translation of the PIF7 mRNA, and this effect is mediated by the formation of an RNA hairpin within its 5’ UTR. Further, we found that translation of HEAT SHOCK FACTOR A2 (HSFA2), which is essential for heat acclimation 19, also appears to be regulated by this mechanism, indicating that RNA thermoswitches play roles in diverse temperature adaptive responses in plants. RNA thermometers have previously been described in prokaryotes 20 and viruses 21,22, suggesting the temperature responsiveness of RNA secondary structures has been harnessed multiple times during evolution.
Results
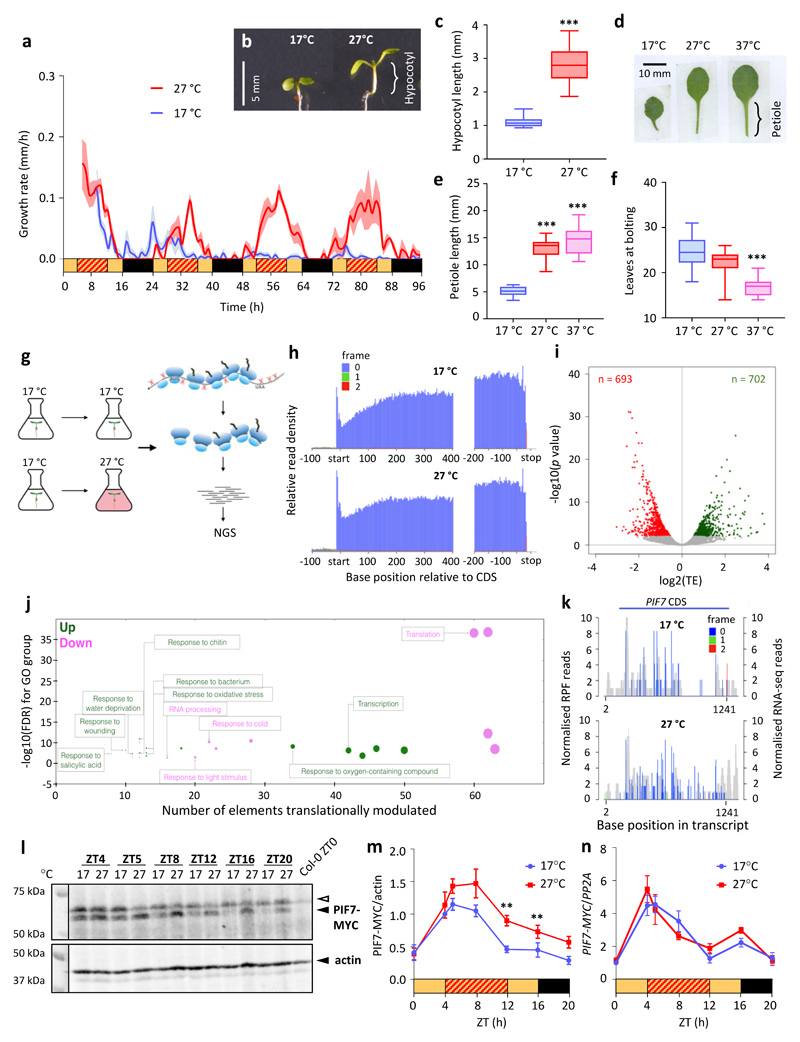
Temperate plants experience high temperatures during the day in the context of long summer photoperiods. We simulated such conditions by growing plants in 16 h LD with an 8 h warm period during the middle of the day. Col-0 shows significant thermomorphogenesis phenotypes in response to high daytime temperatures, including early flowering as well as elongated hypocotyls and petioles, with elongation growth restricted to daytime and commencing rapidly upon exposure to warm temperatures (Fig. 1a-f).
Figure 1. Arabidopsis responds rapidly to daytime warm temperature cycles, and this is mirrored by changes in translational efficiency of genes such as PIF7 within 15 minutes.
a Hypocotyl growth rates of 7-d-old Col-0 wild-type seedlings in long days (LD) at constant 17 °C or with a 27 °C midday (n = 8). Black and yellow bars indicate subjective day and night, respectively, red hatching indicates warm temperatures. The experiment was repeated twice with similar results.
b, c Hypocotyl length of 7-d-old Col-0 seedlings grown as in (a) (n = 22 for 17 °C, n = 24 for 27 °C). The experiment was repeated twice with similar results.
d-f Petiole length of the 4th true leaf (d, e) and total leaf numbers at flowering (f) of 30-d-old adult Col-0 plants grown at constant 17 °C or with a 27 °C and 37 °C midday, respectively (n = 15; n = 13 for 17°C). The experiments were repeated once with similar results.
g Schematic representation of ribosome profiling. Plants grown in liquid media either remained in 17 °C or were shifted to 27 °C for 15 minutes followed by snap-freezing in liquid nitrogen for ribosome profiling.
h Meta-translatome generated by riboSeqR where 5’-end position of all ribosome-protected fragments (RPFs) relative to start and stop codons were mapped to the transcriptome. Red, green and blue bars indicate the proportion of 28-nucleotide RPF reads mapped to frames 0, 1 and 2, respectively. Most RPFs mapped to the 0 position (blue colour).
i Volcano plot of the fold change (FC) in translational efficiency (TE) between 27 °C and 17 °C for transcripts detected in (g) with a cut-off at P < 0.01. Statistical analysis was performed using xtail as described 60.
j Bubble plot of gene ontology (GO) terms significantly enriched among genes with significantly altered TE identified in (i). GO term enrichment calculated from a single replicate using STRING 61. A Fisher’s exact test with multiple testing correction was employed for statistical analysis.
k Histograms of 5′ end positions of normalized 28-nucleotide RPF reads (blue, green and red, left axis) and RNA-Seq reads (grey, right axis) mapped to the PIF7 transcript. Filtered and normalised RPF reads were 66 and 127 at 17 °C and 27 °C, respectively.
l-n PIF7-MYC protein (l, m) and transcript (n) levels in 7-d-old transgenic PIF7::PIF7-MYC (Col-0) seedlings grown as in (a). Actin levels are shown as loading control. Protein levels were quantified from western blots and normalised to actin (n = 4), transcript levels were measured by qPCR and normalised to PP2A (n = 3). The open arrow indicates an unspecific signal. Black and yellow bars indicate subjective day and night, respectively, red hatching indicates warm temperatures.
Shading (a) and error bars (c, e, f, m, n) indicate the standard error of the mean (SEM) around the mean value. Box plots display the 25th and 75th percentile with the median as centre value and whiskers representing 1.5 times the inter-quartile range (IQR). Asterisks indicate significant differences to 17 °C control treatment (Two-sided Students t-test * p < 0.05, ** p < 0.01, *** p < 0.001).
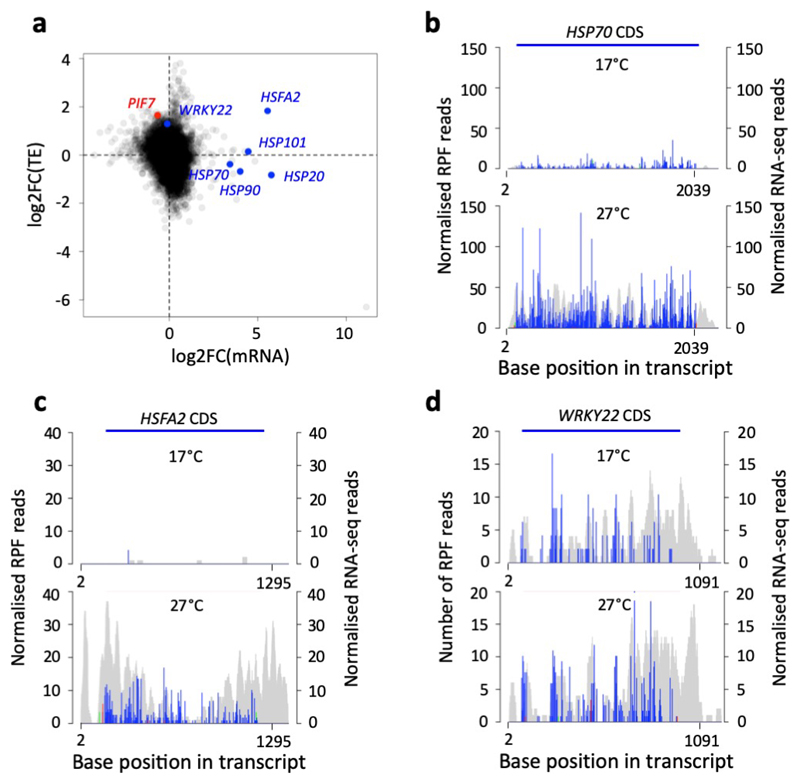
In plants, time of day strongly affects global translation via the circadian clock and light signalling pathways 23–26, both of which are tightly linked to the plant’s temperature response 1. We thus sought to determine if warm daytime temperature directly affects protein synthesis. To test this, we performed ribosome profiling of plants shifted to 27 °C. The high resolution of our ribosome profiling – with >95% of reads mapped to the first codon position in all ORFs – permits sensitive and accurate detection of translation dynamics such as a general enrichment of translation initiation relative to elongation within 15 min upon a shift to warmer temperature (Fig. 1g, h), while parallel RNA-seq allows us to monitor changes in transcript abundance as observed for several genes encoding heat shock proteins (Extended Data Fig. 1a, b). To identify transcripts that show enhanced ribosome occupancy in response to temperature, we calculated translation efficiency (TE) for mRNAs by normalising the ribosome profiling data to parallel RNA-Seq and identified approximately 700 genes with enhanced TE in response to a warm temperature-shift (Fig. 1i, Supplementary Table 1). These genes are enriched for transcription factors as well as stress-related GO terms such as oxidative stress, bacterial infection, water deprivation, and wounding (Fig. 1j). The PIF7 transcript shows enhanced translation in response to 27 °C while its transcript level is not significantly changed in our ribosome profiling data with parallel RNA-seq (Fig. 1k, Extended Data Fig. 1a). This bHLH transcription factor PIF7 is related to the key regulator of thermomorphogenesis PIF4 27,28 and is known to control elongation responses under red light 29 and under a low red:far-red light ratio 30,31.
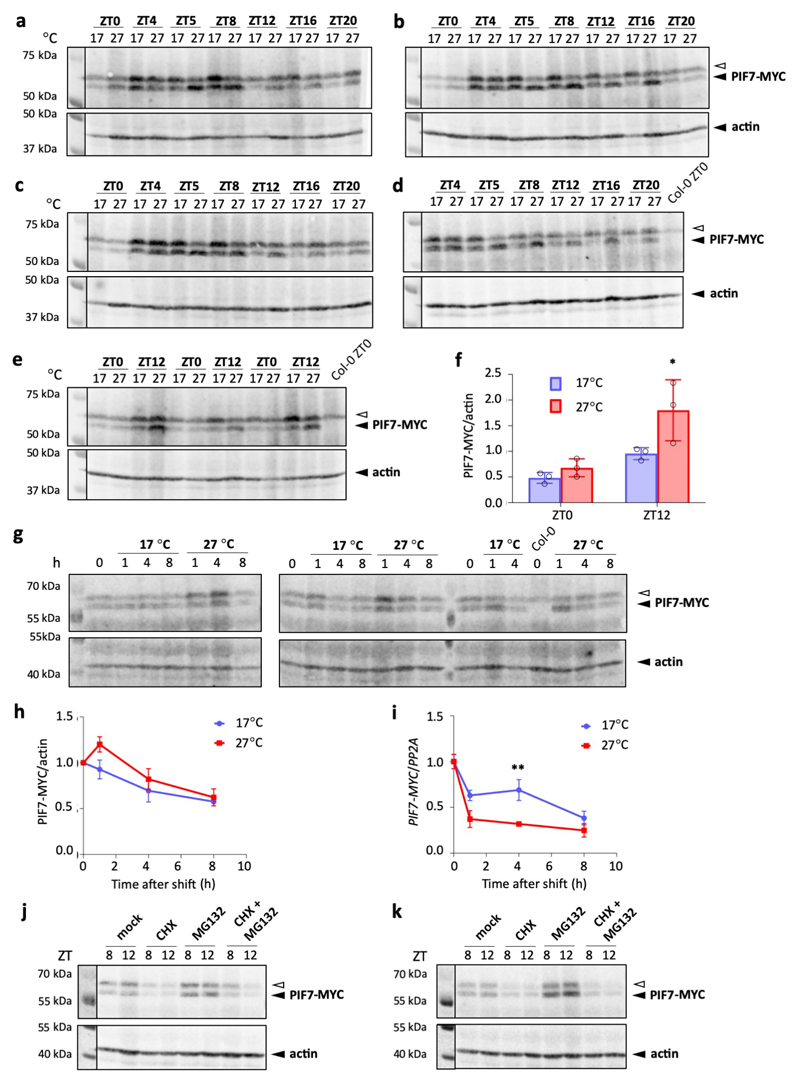
To test whether the observed change in translational efficiency of PIF7 results in robust changes at the protein level, we compared protein and transcript levels of a PIF7-MYC fusion protein in plants grown under cycling warm temperatures and at constant low temperature. In agreement with the ribosome profiling and RNA-seq data, we observed an increase in PIF7-MYC protein levels in warmer temperatures, which occurred independently of transcript abundance (Fig. 1l-n, Extended Data Fig. 2a-f). This increase is clearly evident when plants have been entrained in warm cycling temperatures for several days. When seedlings grown at constant 17 °C are shifted to 27 °C, we detect only a slight increase in PIF7-MYC protein levels, but noticed a sharp drop in PIF7-MYC transcript (Extended Data Fig. 2g-i), which likely counteracts enhanced translation. Thus, while the translational response of PIF7 to temperature is fast, its effect on protein abundance becomes more evident after repeated exposure to warm temperature when steady-state transcript levels are no longer affected.
Treatment with the translation inhibitor cycloheximide (CHX) strongly reduces PIF7-MYC levels within several hours (Extended Data Fig. 2j, k), consistent with translational regulation playing an important role in controlling PIF7 levels. PIF7-MYC levels in CHX-treated seedlings are similar at 17 °C and 27 °C, showing that temperature does not increase stability of PIF7 protein that accumulated prior to CHX treatment. Since several other PIF transcription factors are highly regulated by proteasomal degradation in response to light or temperature signals 32,33, we tested if this is the case for PIF7. Treatment with the proteasome inhibitor MG132 only moderately increases PIF7-MYC levels at both 17 °C and 27 °C and cannot restore high protein levels when translation is inhibited by CHX (Extended Data Fig. 2j, k), indicating that PIF7 does not appear to be under major regulation by the proteasome.
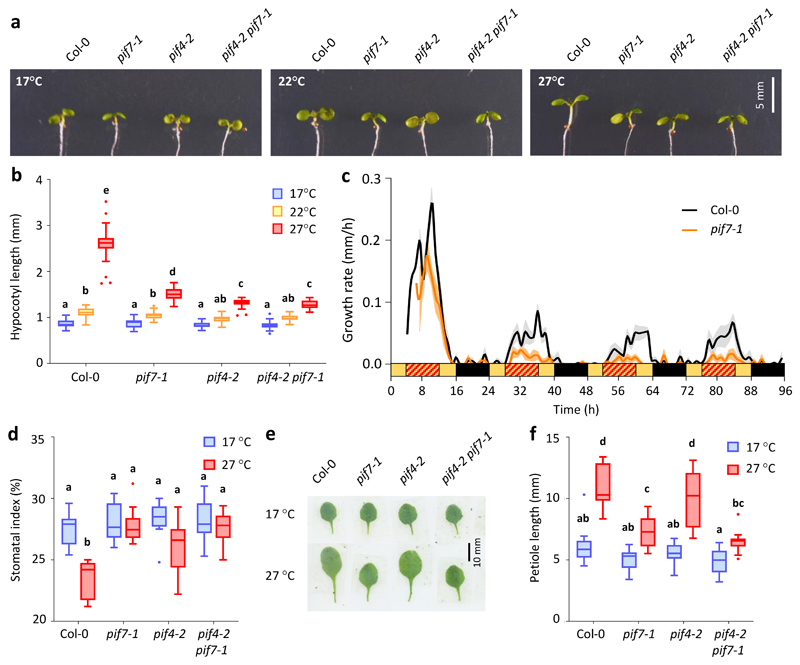
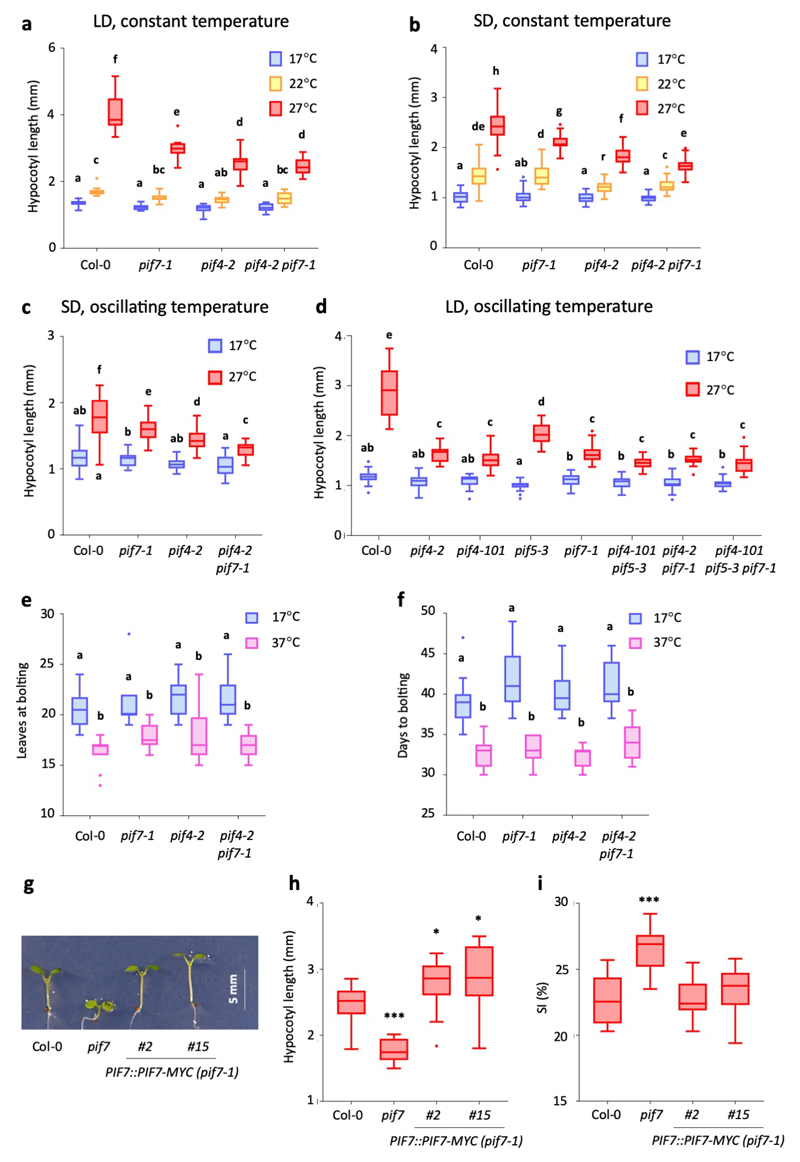
Having identified an increase in PIF7 protein levels at higher temperature, we sought to determine if PIF7 is necessary for thermomorphogenesis. pif7-1 shows strongly reduced hypocotyl elongation in response to oscillating warm temperatures in LD, largely abolishing the warm daytime growth response (Fig. 2a-c). We observe similar phenotypes in pif4-2 mutants, while we detect no additive effects in the pif4 pif7 double mutant; this indicates that PIF4 is also required for thermomorphogenesis in these conditions and that PIF4 and PIF7 may act in concert. When grown under SD, the growth defects of pif7 seedlings were less pronounced (Extended Data Fig. 3a-c), emphasizing the role of PIF7 in LD. In the shade avoidance response, PIF4 and PIF7 control elongation growth redundantly with PIF5 34. Hypocotyl elongation at high temperatures was impaired in the pif5-3 mutant, albeit to a lower extent than in pif4 and pif7 mutants, while pif4 pif5 double and pif4 pif5 pif7 triple mutants showed a response similar to these single mutants (Extended Data Fig. 3d). PIF5 therefore appears to play a minor role in the daytime temperature response alongside PIF4 and PIF7.
Figure 2. PIF7 is necessary for thermomorphogenesis in response to warm daytime temperature cycles.
a, b Hypocotyl length of 7-d-old Col-0 and pif mutant seedlings grown in LD at constant 17 °C or with a 22 °C and 27 °C midday, respectively (n = 24 except for pif7 17 °C with n = 23, pif4 pif7 17 °C with n = 20 and pif4 27 °C with n = 23). The experiment was repeated twice with similar results.
c Hypocotyl growth rates of Col-0 and pif7 mutant seedlings grown in LD with a warm 27 °C midday. Lines represent the mean, shading indicates the SEM (n = 8). Black and yellow bars indicate subjective day and night, respectively, red hatching indicates warm temperatures. The experiment was repeated twice with similar results.
d Stomatal index of the abaxial cotyledon epidermis of 14-d-old Col-0 and pif mutant seedlings grown in LD at constant 17°C or with a 27 °C midday (n = 10). The experiment was repeated once with similar results.
e, f Petiole length of the 4th true leaf of 30-d-old adult Col-0 and pif mutant plants grown as in (d) (n = 15). The experiment was repeated once with similar results.
Box plots display the 25th and 75th percentile with the median as centre value and whiskers representing 1.5 times the IQR. Letters indicate significance groups; samples with the same letters are not significantly different (Two-way ANOVA followed by two-sided Tukey test, p < 0.05).
PIF7 is also required for other thermomorphogenesis phenotypes such as petiole elongation and a reduction in stomatal index (Fig. 2d-f), but is not essential for warm temperature-induced flowering (Fig. 3e, f), consistent with the dominant role of the CO pathway in the floral transition under LD 35. The PIF7::PIF7-MYC transgene complements both the hypocotyl elongation and stomata development phenotypes of the pif7 mutant (Extended Data Fig. 3g-i), confirming that the altered mutant phenotypes are due to lack of PIF7 function.
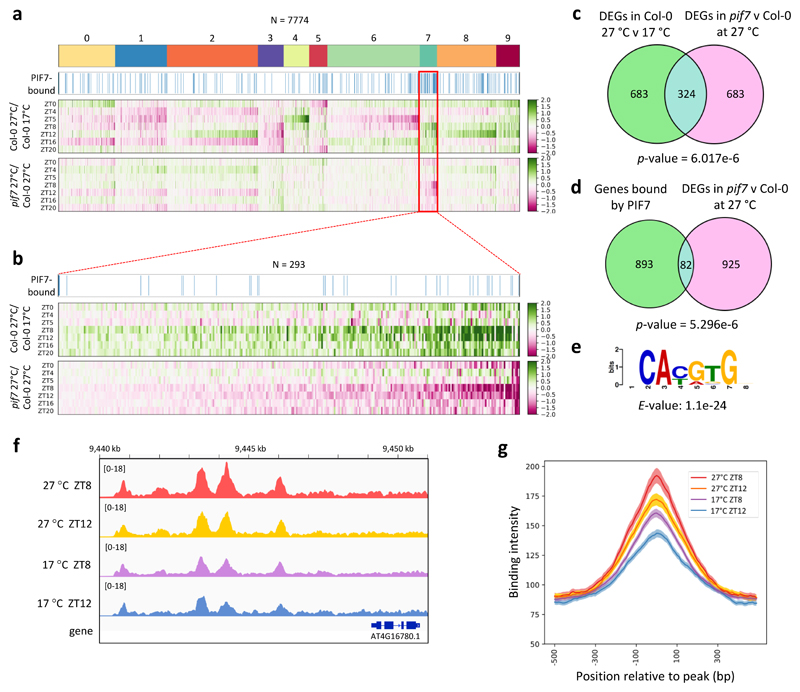
Figure 3. PIF7 directly activates the warm temperature transcriptome in response to daytime thermal cycles.
a Clustering of RNA-seq data of Col-0 and pif7-1 seedlings grown in LD with a 27 °C midday (ZT4-ZT12) compared to Col-0 seedlings grown at 17 °C. Expression profiles of differentially expressed genes (DEGs) in Col-0 at 27 °C compared to 17 °C are shown, with profiles of the same genes in pif7-1 compared to Col-0 at 27 °C slotted in below. Blue bars indicate genes bound by PIF7-MYC in ChIP-seq experiments.
b Zoom-in of cluster 7 shown in (a).
c, d Venn diagrams showing the overlap between genes regulated by temperature and misregulated in pif7-1 (c) and the overlap between genes bound by PIF7-MYC and misregulated in pif7-1 (d). p-values were obtained by Fisher’s exact test for the independence of the two gene sets in comparison with the genomic background (n = 33554).
e De-novo motif under PIF7-MYC ChIP-seq peaks identified using MEME. E-value was calculated as the product of p-values using the MEME package 71.
f IGV browser view of PIF7-MYC binding in the ATHB2 promoter.
g Binding intensity profiles for PIF7-MYC ChIP-seq peaks at ZT8 and ZT12, 17 °C and 27 °C, respectively.
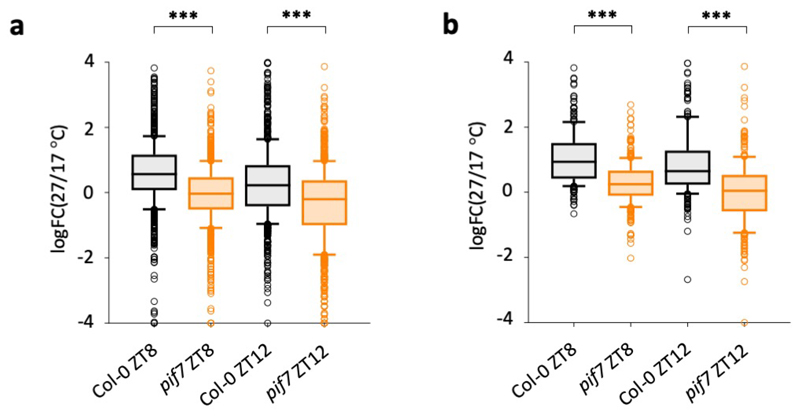
To understand how PIF7 may influence thermomorphogenesis, we compared the transcriptome of pif7 with wild-type Col-0 under LD temperature cycles. Clustering analysis reveals a set of PIF7-dependent genes that are also strongly induced in response to warm photocycles (Fig. 3a. Extended Data Fig. 4a). Among these, cluster 7 is particularly enriched for genes associated with the phytohormone auxin; the induction of this cluster by temperature is PIF7 dependent (Fig. 3a, b, Extended Data Fig. 4b; Supplementary Table 2, 3). Auxin-related genes in this cluster include YUC8 and YUC9, which control rate-limiting steps in the biosynthesis of auxin 18,28, as well as the auxin-inducible genes IAA19 and IAA29. In total, we identified 324 temperature-induced transcripts requiring PIF7 (Fig. 3c, Supplementary Table 4).
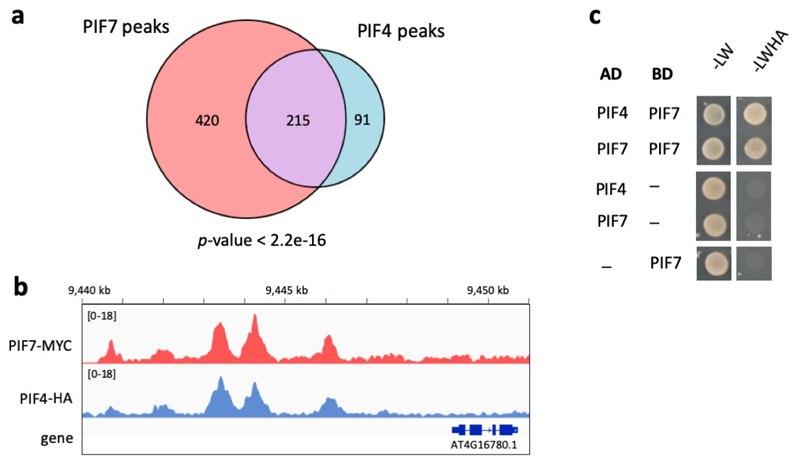
Having identified this set of temperature responsive genes, we sought to identify whether they are directly regulated by PIF7. Through ChIP-Seq we observe binding of natively expressed PIF7-MYC at the promoters of 975 target genes, 82 of which are common with the transcripts perturbed in pif7-1 (Fig. 3d) and 44 are also temperature-responsive (Supplementary Table 4). The bound sequences are strongly enriched with the G-box motif (Fig. 3e). Targets directly bound and transcriptionally perturbed in pif7-1 are enriched for genes associated with cell elongation growth such as ATHB2, a major regulator of photoperiod- and temperature-controlled hypocotyl elongation 11,12, as well as genes associated with auxin biosynthesis and signalling such as YUC8 and YUC9 (Fig. 3f, Extended Data Fig. 5a-d, Supplementary Table 3). Many PIF7-bound genes have also been described as PIF4 targets 36,37. We observe 30 % overlap between PIF4 and PIF7 ChIP-Seq peaks and detected both PIF7-PIF7 and PIF7-PIF4 interaction in yeast-2-hybrid assays (Extended Data Fig. 6). PIF4-PIF7 interaction has previously been observed in planta 38, suggesting these two factors can bind as heterodimers, which is consistent with their genetic interactions. To understand if PIF7 protein levels are rate-limiting for target activation during the day, we compared the ChIP-seq binding of PIF7 at 17 °C and 27 °C at ZT8 and ZT12 (Fig. 3f, g). We observe an increase in PIF7 binding at 27 °C, indicating that the enhancement of PIF7 translation at higher temperature is necessary and sufficient to directly result in a marked up-regulation of genes controlling thermomorphogenesis.
We hypothesized that this temperature-responsive translational regulation occurs during initiation, when scanning by the 40S ribosome subunit can be modulated by RNA secondary structure. We therefore surveyed the 5’ UTR sequences of PIF7 and other responsive transcription factors. We find that the 5’ UTR sequences of a subset of translationally enhanced genes including PIF7 have a minimum free energy (mfe) of folding of -4 to -10 kcal/mol, and are predicted to form a hairpin up to 30 nucleotides upstream of their initiating AUG (Fig. 4a-c, Extended Data Fig. 7a, b, Supplementary Table 5). The presence of an AUG-proximal hairpin appears specific to this subset, since we do not globally observe a reduction in mfe of folding in the 5’ UTRs of transcripts with enhanced TE at high temperature (Fig. 4d). Besides PIF7, we selected HSFA2, a well-known regulator of heat acclimation 19, and WRKY22, a gene linked to responses in fluctuating temperatures 39, for further analyses.
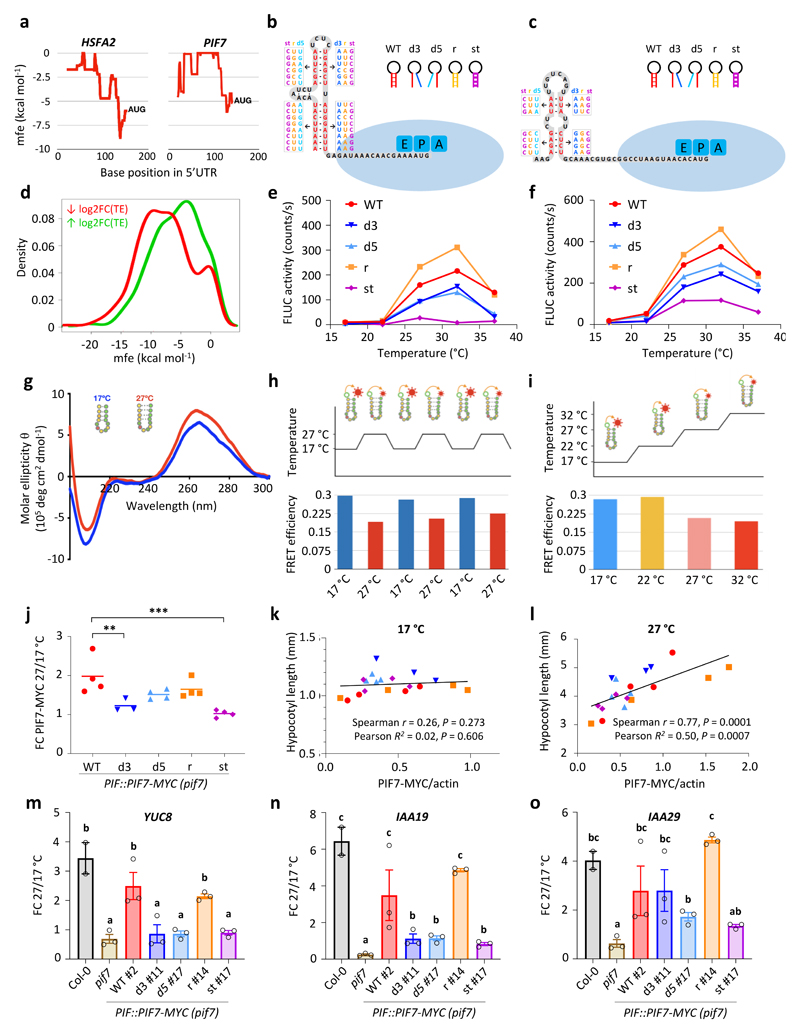
Figure 4. Thermosensitive hairpin structures in the HSFA2 and PIF7 5’UTRs enhance translation in response to warm temperature.
a Minimal free energy (mfe) plot of the HSFA2 and PIF7 5’UTRs using a 40 nt sliding window.
b, c Predicted hairpin structures in the 5’ UTR of HSFA2 (b) and PIF7 (c); mutated sequences used in in vitro studies (see below for details) are indicated in boxes.
d Density plot of lowest mfe in the 5’ UTRs of genes with reduced and enhanced TE.
e, f In vitro translation of HSFA2 (e) and PIF7 (f) 5’UTR hairpin::firefly luciferase (FLUC) RNA fusions at different temperatures, using FLUC activity as read-out. Wild-type (WT), 3’ and 5’ disrupted (d3, d5), reconstituted (r) and stabilised (st) hairpin sequences were tested. Data points represent the mean of two technical replicates. The experiments were repeated three times with similar results.
g Circular dichroism spectrum of an RNA molecule containing the putative PIF7 5’ UTR hairpin sequence shown in (c) at 17 °C and 27 °C. The experiment was repeated once with similar results.
h, i FRET efficiencies of an RNA molecule containing the putative PIF7 5’UTR hairpin sequence shown in (c) tagged with 6-carboxyfluorescein and 6-carboxytetramethylrhodamine fluorophores; FRET was measured during multiple shifts between 17 °C and 27 °C (h) and over a temperature gradient from 17°C to 32°C (i).
j-l Fold change (FC) in PIF7-MYC protein levels between 27 °C and 17 °C (j) as well as correlations between PIF7-MYC levels and hypocotyl length at 17 °C (k) and 27 °C (l) at ZT12 in independent PIF7::PIF7-MYC (pif7-1) transgenic lines harbouring the different hairpin mutants depicted in (c). Asterisks indicate significant differences to WT (One-way ANOVA followed by two-sided Dunnett’s test, * p < 0.05, ** p < 0.01, *** p < 0.001). Lines in j represent the mean in FC obtained from multiple independent transgenic lines (n = 4 except for d3 with n = 3). Data points in k and l represent mean hypocotyl length (n = 20) plotted against mean protein level (n = 3) for each transgenic line. The experiment was repeated once with similar results.
m-o Fold change in YUC8 (m), IAA19 (n) and IAA29 (o) transcript levels between 27 °C and 17 °C at ZT12 in the indicated genotypes. Bars represent the mean, error bars represent the SEM (n = 3). Letters indicate significance groups; samples with the same letters are not significantly different (One-way ANOVA followed by two-sided Tukey test, p < 0.05). The experiment was repeated once with similar results.
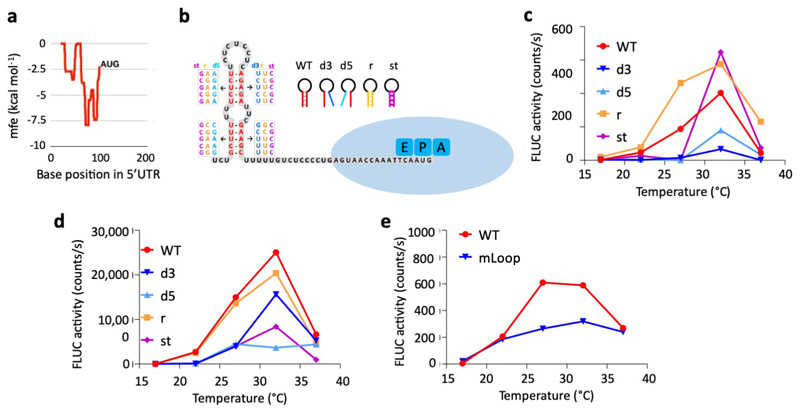
To investigate whether the AUG-proximal hairpins control TE directly, the predicted hairpin sequences were fused 5’ of a firefly luciferase reporter for analysis in vitro. Control sequences, where the hairpins were either disrupted or restored through compensatory base-pairing, were assayed in parallel in the wheat germ cell-free translation system. While no differences were observed at low temperatures, the wild-type and restored hairpin sequences conferred higher translation at warm temperatures compared to the hairpin-disrupting mutations, independently of whether or not the RNA is capped prior to in vitro translation (Fig. 4e, f, Extended Data Fig. 7c, d). These results suggest that it is the formation of a RNA hairpin structure that is responsible for the thermosensing translational response. While the identity of the loop sequence is not conserved between PIF7, HSFA2 and WRKY22, mutation of the PIF7 loop sequence had a negative effect on translation efficiency (Extended Data Fig. 7e). Nevertheless, being able to restore responsiveness with compensatory mutations that recreate the hairpins indicates it is structure rather than sequence identity that enhances temperature-dependent translation. Further, a level of conformational flexibility of the hairpin appears to be necessary as hairpin mutants with additional G-C base-pair substitutions inhibit the warm temperature effect on translation efficiency.
Circular dichroism (CD) spectroscopy confirms formation of a hairpin structure in the 40-nucleotide section of the 5’ UTR of PIF7 at both 17 °C and 27 °C. The lower CD-signal intensity at 210 nm measured at 27 °C (Fig. 4g) suggests weaker RNA base pairing and, therefore, a more-relaxed hairpin conformation being populated at 27 °C. We further quantitated hairpin flexibility at different temperatures by isolating the 31 nt hairpin-forming sequence from the 5’ UTR of PIF7 (see Material and Methods) and performed fluorescence resonance energy transfer (FRET) measurement on a 5’ FAM and 3’ TAMRA functionalised version of this RNA sequence. FRET experiments reveal temperature-dependent conformational changes of the hairpin, where FRET efficiency is suddenly and not linearly lowered upon a shift from 17 °C to warmer temperatures – indicative of a new structural conformation with a larger distance between the fluorophores, and thus a more relaxed secondary structure, populated at temperatures higher than 22 °C and stable up to 32 °C (Fig 4g, i). FRET experiments further showed that such a conformational transition is reversible (Fig. 4h), which is consistent with a role for RNA-secondary structures to control translation in response to temperature. This transition occurs between 22 °C and 27 °C, which is when the main physiological PIF7-dependent response occurs (Fig. 2b; Fig. 4f), confirming that the 5’ UTR hairpin sequence adopts two distinct conformations in a temperature-dependent manner.
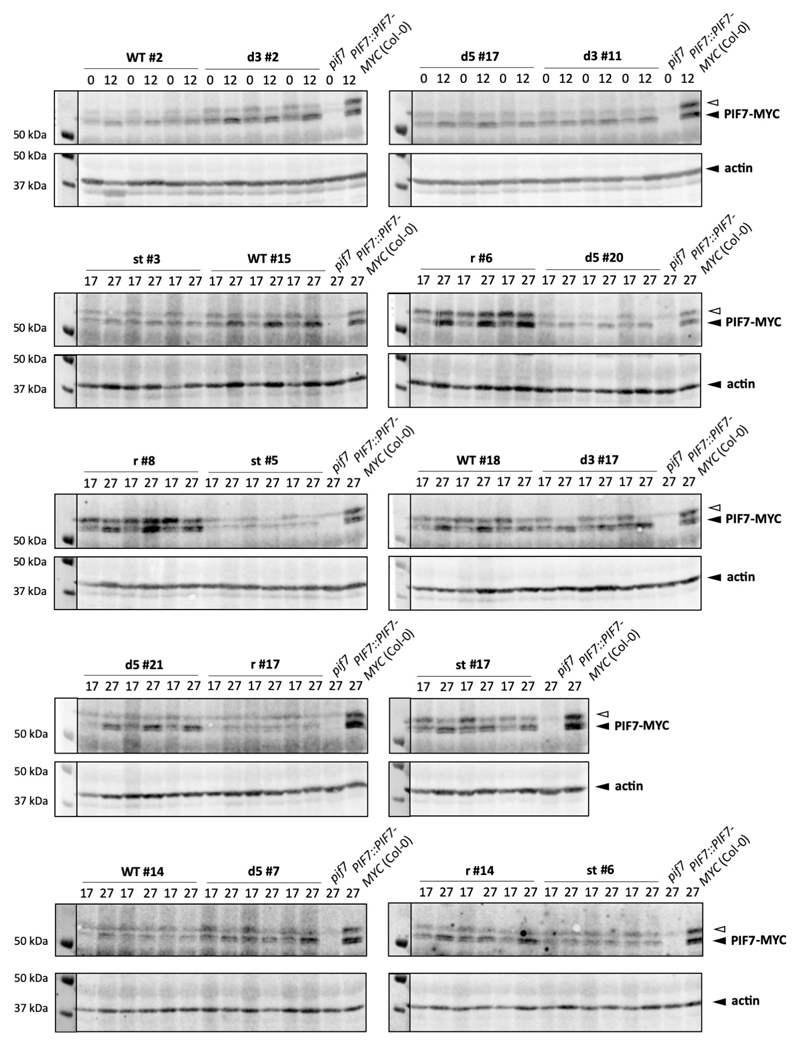
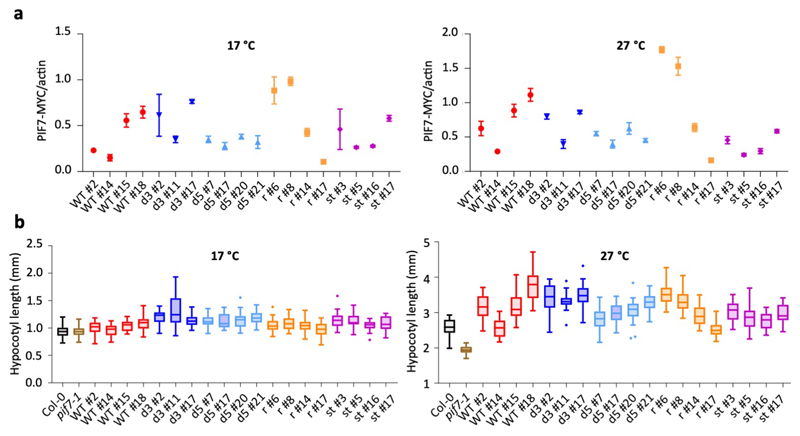
To confirm a role for the PIF7 5’ UTR hairpin sequence in planta, we analysed genomic PIF7-MYC constructs harbouring the different hairpin mutations in the pif7 mutant background. We detected the biggest fold change in PIF7-MYC protein levels between 17 °C and 27 °C in lines carrying the wild-type and reconstituted hairpin sequences (Fig. 4j, Extended Data Fig. 8, 9a). This warm temperature-dependent increase was significantly reduced in lines containing one of the disrupted hairpin sequences and virtually abolished in lines expressing PIF7-MYC with a stabilized hairpin (Fig. 4j, Extended Data Fig. 8, 9a), indicating that the hairpin sequence controls protein accumulation in planta.
There is variation in PIF7-MYC abundance in independent lines assayed at 17 °C, consistent with position effects arising from random insertion events, which represents a limitation of our experiment as it also affects protein abundance at 27 °C. This confounding effect means that PIF7 levels at 27 °C cannot be compared directly to infer the effect of the different hairpin sequences. However, PIF7-MYC levels are clearly correlated with hypocotyl length at 27 °C, while no such correlation is observed at 17 °C, where even lines with high PIF7-MYC accumulation remained short (Fig. 4k, l, Extended Data Fig. 9b). Thus, PIF7 protein abundance affects thermomorphogenesis and represents a limiting factor for elongation growth at 27 °C, but not 17 °C, where other pathways may restrict PIF7 activity.
All lines investigated showed complementation of the pif7 hypocotyl phenotype at 27 °C (Extended Data Fig. 9b), suggesting that protein levels present in these lines at 17 °C may already be sufficient to induce thermomorphogenesis under permissive conditions. We sought to further investigate functional relevance of the 5’ UTR hairpin at the molecular level by analysing the transcript abundance of several temperature-responsive genes in the complementation lines. Induction of YUC8, IAA19 and IAA29 at 27 °C was completely absent in the pif7 mutant in our RNA-seq experiments. We investigated their transcript level in selected PIF7-MYC complementation lines with roughly similar PIF7-MYC levels at 17 °C (Figure 4m-o). While IAA29 induction at 27 °C was similar across most lines, YUC8 and IAA19 induction was highest in lines harbouring wild-type and reconstituted hairpin sequences, confirming that the hairpin structure is relevant for the level of target gene induction.
Discussion
RNA thermometers that regulate translation have been found predominantly in viruses 21,22, and bacteria 20, where they control accessibility of ribosomal binding sites for the small ribosomal subunit. Most studies of eukaryotic temperature-dependent RNA elements have examined 3’ UTRs, where they mainly control RNA stability as observed for HSP83 in Leishmania 40 or globally in rice 41. In this study, we have identified regulatory RNA thermoswitches for plant translation initiation. In contrast to many zipper-like bacterial RNA thermometers, which restrict translation at low temperatures and then melt upon a temperature increase 20, the secondary structure of the PIF7 RNA thermoswitch has a positive effect on translation. This molecular switch adopts a more relaxed, yet distinct conformation at warmer temperatures, resulting in enhanced translation.
The PIF class of transcription factors has been extensively implicated in thermomorphogensis. PIF4 in particular is regulated at multiple levels in response to temperature, transcriptionally via temperature-dependent EC activity 4–6, and post-translationally via the activity of phytochromes 7,8 as well as through interaction with other transcriptional regulators such as EARLY FLOWERING 3 (ELF3) 42, HMR 15 and TCP transcription factors 43,44. Furthermore, PIF activity is increased in response to the phytohormone gibberellin (GA), mediated via the degradation of inhibitory DELLA proteins 45,46, and GA levels are themselves influenced by temperature 28. Together with recently published findings 47, our results reveal a key role for PIF7 during thermomorphogenesis. Both reports find that warm temperature increases PIF7 protein levels independently of transcription, although the observed dynamics differ. This is likely due to differences in experimental setup, such as the temperature regimes used and the time of day when heat treatment is applied. We further reveal that the observed post-transcriptional increase in PIF7 accumulation is a direct result of enhanced translation, which provides an additional way to integrate temperature information into growth and development.
While PIF4 is an essential regulator of thermomorphogenesis under both SD and LD, PIF7 appears to be particularly relevant for daytime growth under long photoperiods. PIF functions correlate with their respective expression patterns: PIF4 transcript level peaks during the day, but displays an additional peak at the end of the night in SD 10,11,48, coinciding with the growth phase under both photoperiods. In contrast, the pattern of PIF7 transcript is not strongly affected by photoperiod and displays a single peak during the day 38,49. Warm temperature may enhance PIF7 translation at any time of day, but will cause high protein accumulation particularly during daytime. High PIF7 levels would therefore coincide with daytime growth in LD, but not with end-of-night growth in SD, when PIF7 transcript level is lowest.
Temperature affects PIF7 function at levels other than translation. We observe that a shift to warm temperatures causes a short-term drop in PIF7 transcript abundance. In addition, boosting PIF7 protein levels does not promote hypocotyl elongation at 17 °C, suggesting that another pathway represses PIF7 activity at low temperatures. Phytochrome B (phyB) controls PIF7 function in response to light quality, inducing PIF7 phosphorylation and thereby altering its subcellular localisation 50,51. Since temperature also affects phyB thermal reversion during daytime 8, it is likely that phyB controls PIF7 post-translationally in response to temperature. Other interactors of PIF7 include HMR 52 and DE-ETIOLATED 1 (DET1) 53, both of which are positive regulators of thermomorphogenesis 15,54 and can potentially promote PIF7 function at warm temperatures. These different layers of PIF7 regulation may represent a means to buffer its response to temperature, an intrinsically noisy environmental signal.
It is standard experimental practice to grow plants under constant temperature conditions over the 24 h cycle. Plants grown in the field however experience temperature as a strongly oscillating signal varying with sunlight levels. It will be interesting to see if the use of more environmentally relevant oscillating temperature conditions will further improve our understanding of how plants adapt to a changing natural environment. Since the temperature signals a plant receives are highly context-dependent, the integration of diurnal and circadian information to modulate the response is likely to be important. RNA thermoswitches in genes such as PIF7 and HSFA2, which are essential for diverse temperature responses, may thus provide a flexible mechanism for plants to adapt to a variable temperature environment.
Material and Methods
No statistical methods were used to predetermine sample size. Investigators were not blinded to allocation during experiments and outcome assessment.
Plant material and growth conditions
All mutant and transgenic lines used in this study were in the Arabidopsis thaliana Col-0 wild-type background. The T-DNA insertion mutants pif4-2 55, pif4-101 34, pif5-3 56, pif7-1 55, pif4-101 pif5-3 34, pif4-2 pif7-1 55, pif4-101 pif5-3 pif7-1 31 and the 35S::PIF4-HA 34 transgenic line have been described previously.
For experiments involving seedlings, seeds were surface-sterilised and sown on ½ Murashige and Skoog (MS) agar plates at pH5.7 without sucrose. They were stratified for 3 days at 4 °C in the dark and then allowed to germinate for 16-24 h at 20 °C under cool-white fluorescent light at 75-85 μmol m-2 s-1. After this period, seeds displaying a slightly protruding radicle were selected to ensure even germination, transferred to new ½ MS plates and grown at light intensities of 35-40 μmol m-2 s-1 under long (16 h light, 8 h dark) or 80 μmol m-2 s-1 under short (8 h light, 16 h dark) photoperiods. Temperatures were either kept constant or cycled daily with a warm phase during the day (ZT4-12 in long photoperiods, ZT0-8 in short photoperiods) and a cool 17 °C phase for the remainder of the day/night cycle. For shift experiments, seedlings were grown at 17 °C for 6 d and then shifted to 27 °C at ZT4 on day 7.
For experiments involving adult plants, seeds were stratified for 3 days at 4 °C in the dark and then sown on Levington® Advance Seed & Modular F2 compost. They were grown under cool-white fluorescent light at 170 μmol m-2 s-1 in long photoperiods (16 h light, 8 h dark) under the indicated temperature regimes.
For picloram (PIC) treatments, seeds were germinated on ½ MS plates for 16-24 h at 20 °C and then transferred to ½ MS plates containing 100 or 500 nM PIC or an equivalent amount of 20 mM MOPS buffer for mock treatment and grown for additional 6 d.
Ribosome profiling and parallel RNA-seq
Col-0 wild-type seeds were surface sterilised and stratified as above but in 50 ml ½ MS liquid media at pH5.7 without sucrose. Two-week-old seedlings were grown at constant light under agitation at 17 °C prior to temperature shift to 27 °C for 15 min and snap frozen with liquid nitrogen followed by cryo-grinding with frozen ribosome profiling buffer containing: Tris-Cl pH7.5 (20 mM), KCl (140 mM), MgCl2 (5 mM), NP40 (0.5%), Triton-X100 (1%), sucrose (5%), DTT (0.5mM), cycloheximide (100 μg/μl), chloramphenicol (100 μg/μl), TURBO™ DNase (0.5μl/ml, Thermo Fisher) and protease inhibitor (Roche, complete EDTA-free). The homogenised samples were thawed and clarified by centrifugation at 4 °C and the lysates were processed according to previously described procedures for foot-printing and library generation 57,58. Libraries were sequenced with either the Illumina HiSeq2000 or NextSeq® 500/550 platform and data were trimmed and mapped as previously described. A single replicate containing approximately 100 seedlings was analysed per condition.
Prior to differential expression analysis, mapped data were processed using RiboSeqR 57 where only genes with de novo ORF detected by RiboSeqR that matches annotated ORFs were utilised for further processing. Differential expression of RNA abundance and Ribosome-protected fragments (total translation) were processed with BaySeq 59 while Xtail 60 was utilised for TE analysis and STRING 61 was used for gene ontology analysis. All plots were generated with a mixture of R-studio and PRISM.
Generation of PIF7::PIF7-MYC transgenic plants
A 4.75 kb genomic PIF7 fragment including the promoter region and gene body was amplified using primers 10157 and 10158, a 572 bp PIF7 3’ fragment was amplified using primers 10161 and 10162 and a 5xMYC tag was amplified from pJHA212K-5xMYC using primers 10159 and 10160. Primer sequences are listed in Supplementary Table 6. The binary vector pJHA212B was digested with EcoRI and BamHI and subsequently assembled with the above-described fragments using the NEBuilder® Hifi DNA Assembly Cloning Kit (New England Biolabs). To introduce mutated sequences in the PIF7 5’ UTR the complete plasmid was amplified with primers listed in Supplementary Table 6 and religated. The constructs were transformed into Arabidopsis thaliana Col-0 and pif7-1 plants using the floral dip method. Transformants were identified by BASTA resistance and propagated to the T3 generation to obtain homozygous single insertion lines.
Hypocotyl length measurement
Seedlings were grown on ½ MS plates under the indicated light and temperature regimes for 7 days and then photographed. Hypocotyls were measured using ImageJ, with 20-25 seedlings being analysed per genotype and condition.
Infrared time-lapse imaging of hypocotyl growth
Seedlings were grown under the conditions described above, but vertical plates with the upper half of agar removed were used to allow unobstructed imaging of hypocotyls in air. Infrared imaging was performed as described previously 62. Images were taken every 30 min for 96 hours. Hypocotyl length was measured using ImageJ, growth rates were calculated from length differences between subsequent images and were averaged per hour. Four to eight seedlings were analysed per genotype and condition.
Quantification of stomatal index
Seedlings were grown on ½ MS plates under the indicated light and temperature regimes for 14 days. Cotyledons were then removed from the seedling, stained in 10 μg/mL propidium iodide for several minutes, rinsed briefly and mounted in water. They were visualised using a Leica SP8 confocal laser-scanning microscope (Leica Microsystems). Epidermal cell types (stomata and non-stomatal cells) in the abaxial epidermis were quantified in fields of 400 μm x 400 μm using ImageJ. Two fields were counted per cotyledon, and ten cotyledons were analysed per genotype and condition. The stomatal index was calculated as number of stomata / (number of stomata + non-stomatal cells) * 100.
Petiole length measurement
Plants were grown on soil for 10 days at 17 °C before being shifted to the indicated temperature regimes. On day 30, the 4th leaf of each plant was removed from the shoot, glued onto paper using transparent adhesive tape and imaged using a high-resolution flat-bed scanner. Petiole length was measured using the ImageJ plug-in LeafJ. Twelve to fifteen leaves were analysed per genotype and condition.
Flowering time measurement
Plants were grown on soil for 10 days at 17 °C before being shifted to the indicated temperature regimes. Flowering was scored as number of days and total number of leaves at the time of bolting, i.e. when the inflorescence stem became visible. Fifteen plants were analysed per genotype and condition.
Cycloheximide and MG132 treatment
For treatment with cycloheximide (CHX) and/or MG132, seedlings were grown on ½ plates for 6 d, then transferred to liquid ½ MS 24 h prior to treatment. CHX, MG132 or the corresponding volume of DMSO for mock treatment were added at ZT4 on day 7 and seedlings were incubated for additional 4-8 hours. Final concentrations of 100 μM CHX and 50 μM MG132 were used.
Protein extraction and immunodetection
Seedlings were grown on ½ MS plates for 7 days. Approximately 100 mg of tissue were collected per sample by snap-freezing in liquid nitrogen and ground to a fine powder using mortar and pestle. For protein extraction, 150 μL 2 x Laemmli buffer (120 mM Tris/HCl pH 6.8, 4% SDS, 20% glycerol, 0.02% bromophenol blue, 200 mM DTT) were added to frozen tissue, mixed until thawed and heated for 10 min at 96°C. Proteins were separated on 10% SDS-PAGE and blotted onto nitrocellulose membranes (Trans-Blot® Turbo™ RTA Nitrocellulose Transfer Kit). Commercial antibodies used included anti-cMyc antibody clone 9E10 (Merck Millipore 05-724), anti-actin antibody clone 10-B3 (Sigma A0480) and IRDye® 800CW goat anti-mouse IgG antibody (LI-COR Biosiences). Near-infrared fluorescence signal was visualised on an Odyssee Imaging System (LI-COR Biosciences). Protein bands were quantified using ImageJ, and three to four biological replicates were used for quantification.
Yeast-2-hybrid
PIF4 and PIF7 coding sequences were amplified from cDNA using primer combinations 11798 + 11799/11885 for PIF4 and 14006 + 14007/14008 for PIF7. Primer sequences are listed in Supplementary Table 6. Fragments were cloned into pGADT7 and pGBKT7 (Clontech) using EcoRI/XhoI and EcoRI/SalI restriction sites, respectively. Plasmids were co-transformed into the yeast strain AH109 using the LiAc method as described in the Clontech Yeast Protocols Handbook. Transformants were selected on synthetic drop-out (SD) medium lacking leucine and tryptophan (-LW). To test for interactions, 10 μL of serial dilutions of yeast cell suspensions (OD600 1.0-0.001) were dropped onto SD medium lacking leucine, tryptophan, histidine and adenine (-LWHA) and onto -LW as control.
RNA isolation and quantitative PCR (qPCR)
For expression analysis of the PIF7-MYC transgene, seedlings were grown on ½ MS plates for 7 days. Approximately 30 mg of tissue were collected per sample by snap-freezing in liquid nitrogen, disrupted using a TissueLyser II (Qiagen) and RNA was extracted using the MagMax™-96 Total RNA Isolation Kit (Thermo Fisher Scientific). The RNA was reverse transcribed into cDNA using the Transcriptor First Strand cDNA Synthesis Kit (Roche). Transcript levels were determined by qPCR on a LightCycler® 480 II instrument (Roche) using LightCycler® 480 SYBR Green I Master Mix (Roche) and primers listed in Supplementary Table 6. Data were analysed by the ΔΔCT method and three biological replicates were used.
RNA-seq
Seedlings were grown on ½ MS plates for 7 d. On day seven, samples were collected at ZT0, 4, 5, 8, 12, 16 and 20 and RNA was extracted as described above. RNA quality and integrity was assessed on an Agilent 2200 TapeStation. Library preparation was performed with 1 μg of high integrity total RNA using the NEBNext® Ultra™ Directional RNA Library Prep Kit for Illumina® (New England Biolabs). The libraries were sequenced on a NextSeq® 500 (Illumina) using paired-end sequencing of 75 bp with a NextSeq® 500/550 High Output v2 Kit for 150 cycles. A single replicate was analysed per genotype, time point and condition.
For analysis, we used "TAIR10" from Phytozome 63 as reference genome throughout the study. Raw reads were mapped with the hisat2+stringtie pipeline: adapters were trimmed off from raw reads with Trimmomatic64 with argument ”ILLUMINACLIP:${{FA_ADAPTER}}:6:30:10 LEADING:3 TRAILING:3 MINLEN:36 SLIDINGWINDOW:4:15". Raw reads were mapped to the transcriptome using HISAT265 with argument:"--no-mixed --rna-strandness RF --dta --fr". Duplicate reads were removed with Picard (https://github.com/broadinstitute/picard) using default setting. Transcripts were quantified according to this alignment with StringTie 66 in TPM values (Transcripts per Million mapped transcripts) with argument "--rf".
The TPM values were transformed into log abundances through
(g indexes genes while c indexes conditions).
Any gene with a maximum log abundance smaller than 2.0 was discarded from downstream analysis to avoid introducing noisy variation. The detailed TPM table can be found in Supplementary Table 2. Out of 33554 reference genes, 20132 were kept. The following perturbation were calculated: 1) Temperature perturbation = A[ 27C_Col-0 ] - A[ 17C_Col-0 ] for all time points available; 2) Genotype perturbation = A[ 27C_pif7-1] - A[ 27C_Col-0 ] for all time points available.
For clustering, a von Mises-Fisher mixture of increasing concentration was fitted to the concatenation of temperature perturbation and genotype perturbation 67. Optimal concentration was manually selected to be 8.80 according to the diagnostic plot and clusters with an average uncertainty higher than 2.0 were considered non-significant. Out of 20132 genes included, 7774 were assigned a significant cluster.
For marker-based target calling, perturbation profiles of 3 marker genes (ATHB2, ATHB4, YUC8) were selected and averaged to generate a signature for each of the perturbation matrices. Within each perturbation matrix, a similarity score was calculated for each gene as the dot product of its profile and the signature profile. The best 5% of the genes were then claimed as transcriptionally perturbed.
ChIP-seq
Seedlings were grown on ½ MS plates for 10 d. On day seven, samples were collected at ZT0, 8 and 12 by snap-freezing in liquid nitrogen. Three grams of seedlings per sample were fixed under vacuum for 20 min in 1 x PBS containing 1% formaldehyde. The reaction was quenched by adding glycine to a final concentration of 62 mM. Chromatin immunoprecipitation (ChIP) was performed as described (Jaeger et al., 2013), with the exception that 100 μl A7470 anti-c-Myc Agarose Affinity Gel (Sigma) or 100 μl anti-HA agarose (Millipore) were used per sample. Sequencing libraries were prepared using the TruSeq ChIP Sample Preparation Kit (Illumina) and sequenced on a NextSeq® 500 (Illumina) using single-end sequencing of 75 bp with a NextSeq® 500/550 High Output v2 Kit for 75 cycles. Two replicates were analysed in independent experiments.
For mapping, adapters were trimmed off from raw reads with Trimmomatic 64 with argument "ILLUMINACLIP:${{FA_ADAPTER}}:6:30:10 LEADING:3 TRAILING:3 MINLEN:36 SLIDINGWINDOW:4:15". Raw reads were mapped to the genome “TAIR10” with Bowtie2 68 under argument:"--no-mixed --no-discordant --no-unal -k2". Any read that mapped to more than one genomic location was discarded. Duplicate reads were removed with Picard using default setting.
The genomic binding profile was quantified in RPKM (Reads Per Kilobase per Million mapped reads) using a bin-size of 10 bp.
For each treated ChIP-Seq library, peaks were called against a control using MACS2 69 with argument "--keep-dup 1 -p 0.1". Peaks from all ChIP-Seqs were filtered for FC > 3.0.
PIF7 binding sites were called from sample 186CS12_ZT12-27C as described. A gene is classified as a bound target if there is a peak summit within +/- 3000bp of its start codon. For pile-up, the RPKM profile was extracted for each peak around the MACS2-reported summit position. Per-position average and standard deviation was calculated across the target peaks and visualised.
Two peaks were considered overlapping if their summits were closer than a cut-off of 600 bp. For the Venn diagram, peaks from PIF4-HA chip and from PIF7-MYC ChIP were filtered for FC > 5.0 and overlapped. Bedtools 70 was used for intersection of peaks and making genomic windows.
For binding motif analysis, functional peaks were defined to be near (+/- 3000 bp of start codon) a transcriptionally perturbed gene according to the genotype perturbation matrix. Sequences were extracted around the peak summit for a window of 100 bp. Non-novo enrichment was performed using AME 71 against database “ArabidopsisPBM_20140210.meme” with argument “ame --kmer 2 --control --shuffle-- -- hit-lo-fraction 0.25 --evalue-report-threshold 10.0”. De-novo inference of motif was performed using MEME 71 with argument “meme -mod anr -dna -nmotifs 3”.
5’ UTR structure analysis
Five prime UTR analysis was performed using the ViennaRNA package 72 in combination with custom scripts where a 40 nt window was scanned from 5’ to 3’ end at 3 nt resolution.
Hairpin temperature dependent FRET
100 μM stock solutions of oligonucleotides were prepared in molecular biology grade RNase-free water. Further dilutions were carried out in 60 mM potassium cacodylate buffer, pH 7.4. FRET experiments were carried out with a 200 nM oligonucleotide concentration. The labelled RNA oligonucleotide was supplied by IBA® GmbH. The dual fluorescently labeled RNA oligonucleotides used in this experiment is: 5’-FAM-AAG AGA GCU UAA UUG UCA GUU UAU UCU CUG-3'-TAMRA. The donor fluorophore was 6-carboxyfluorescein (FAM) and the acceptor fluorophore was 6-carboxytetramethylrhodamine (TAMRA). The dual-labeled oligonucleotide was annealed at a concentration of 200 nM by heating at 94 °C for 10 min followed by slow cooling to room temperature at a controlled rate of 0.1 °C/min. Measurements were made in triplicate with an excitation wavelength of 483 nm and a detection range of 500 to 700 nm, with sample final concentration of 200 nM and temperature equilibration of 5 minutes under cuvette stirring. FAM emission was measured at 533 nm and TAMRA emission at 590 nm. Final analysis of the data was carried out using Prism 5 data analysis and graphing software (Prism®).
Circular Dichroism
CD spectra were recorded on an Applied Photo-physics Chirascan circular dichroism spectropolarimeter using a 1 mm path length quartz cuvette. CD measurements were performed over a range of 180-260 nm using a response time of 0.5 s, 1 nm pitch and 0.5 nm bandwidth, with oligonucleotides final concentration of 10 μM. CD spectra were recorded at the specified temperature prior 5 minutes equilibration. The recorded spectra represent a smoothed average of three scans, zero-corrected at 260 nm (Molar ellipticity θ is quoted in 105 deg cm2 dmol−1). The CD absorbance of the buffer was subtracted from the recorded spectra.
Generation of 5’-UTR::FLUC constructs
The pTNT™ vector (Promega) was amplified with 5’-phosphorylated primers 12151 and 12318 and the resulting product was re-ligated to obtain a modified pTNT vector lacking the translation-enhancing beta-globine leader sequence. The firefly luciferase (FLUC) coding sequence was amplified from pBGWL7 using primers 12325 and 12320 and was cloned into the modified pTNT vector via SalI and NotI restriction sites, generating pLUCKY. To insert short 5’-UTR fragments in front of the FLUC coding sequence, two strategies were followed. For WRKY22 WT, b3 and b5, primers containing the respective sequences were annealed to generate inserts, which were subsequently cloned into pLUCKY using SalI and XhoI restriction sites. For all other constructs, pLUCKY was amplified with 5’-phosphorylated primers containing the desired UTR sequences as a 5’-extension and the resulting products were re-ligated. All primer sequences are listed in Supplementary Table 6.
In vitro transcription
Plasmid DNA was linearised, purified by conventional phenol:chloroform extraction and resuspended in RNase-free water. The linearised plasmid (0.5-1 μg) was transcribed in vitro using T7 RNA polymerase (Thermo Fisher Scientific) and ARCA CAP (NEB), for synthesis of capped mRNA, following the manufacturer’s instructions. Plasmid DNA was subsequently removed by addition of RNase-free DNase I (Qiagen), RNA was purified by conventional phenol:chloroform extraction and resuspended in 10 mM Tris/HCl pH 7.5. RNA integrity was assessed on a 1% agarose gel. Capped mRNA was further purified with NucAway Spin Column (Thermo Fisher Scientific) prior to assay.
In vitro translation assays
For luciferase assays, 300-400 ng of RNA were translated in wheat germ extract (Promega). Reactions were assembled on ice according to the manufacturer’s instructions, except that they were scaled down to 10 μL. Reactions were pre-incubated at 17°C for 5 min and then shifted to the assay temperature for another 15 min. Reaction was stopped by addition of 40 μL stopping solution (1 x PBS, 0.1 μM cycloheximide, 1 x protease inhibitor cocktail). An equal volume of luciferin solution (2 mM D-luciferin, 0.1 mM ATP) was added and FLUC activity was subsequently monitored using a TriStar LB 941 microplate reader (Berthold Technologies).
Statistical analysis
For pairwise comparison, two-sided t-test was performed. For multiple comparisons, a one-way or two-way ANOVA was conducted followed by two-sided Dunnett’s test (for comparison to a control mean) or Tukey test (for comparison of all means), when significant differences were detected. The Shapiro-Wilk test was used to exclude strong deviations from normality. Fisher’s exact test was employed to test for independence of gene sets in Venn diagrams. GO term enrichments were identified using the STRING database (https://string-db.org/) 61. Supplementary Table 7 contains all p-values not stated in the Figures.
Data availability
Raw and processed data are available from Ribo-seq/RNA-seq series E-MTAB-7717, RNA-Seq series GSE124003 and ChIP-Seq series GSE127745.
Code is available from this Github repository: https://github.com/shouldsee/thermoPIF7.
Extended Data
Extended Data Fig. 1. PIF7, HSFA2 and WRKY22 show enhanced translation at warm temperature.
a Scatter plot of log fold changes in TE and mRNA abundance observed in Ribo-seq with parallel RNA-seq.
b-d Histograms of 5′ end positions of normalized 28-nucleotide RPF reads (blue, green and red for frames 0, 1 and 2, left axis) and RNA-Seq reads (grey, right axis) mapped to the HSP70 (b), HSFA2 (c) and WRKY22 (d) transcript.
Extended Data Fig. 2. PIF7-MYC protein accumulation in response to warm temperature.
a-d Western blots of PIF7-MYC protein used for the quantification shown in Fig. 1m. The PIF7::PIF7-MYC line is in the Col-0 background. Actin levels are shown as loading control.
e, f Western blot (e) and quantification (f) of PIF7-MYC protein of an independent transgenic PIF7:: PIF7-MYC line in Col-0 background at ZT0 (dawn) and ZT12; seedlings were grown in LD at constant 17°C or with a 27 °C midday for 7 d. Protein levels were normalised to actin. Bars represent the mean, error bars indicate the SEM (n = 3). The experiment was repeated once with similar results.
g-i Western blots (g) and quantification (h) of PIF7-MYC protein as well as PIF7-MYC transcript levels (i) of PIF7::PIF7-MYC (Col-0) seedlings grown at constant 17 °C for 7 d and then either shifted to 27 °C at ZT4 (= 0 h) or kept at 17 °C for the indicated amount of time. Actin levels are shown as loading control. Protein levels were normalised to actin and expressed relative to levels at 0 h, transcript levels were normalised to PP2A and expressed relative to levels at 0 h. Data points represent the mean, error bars indicate the SEM (n = 3). The experiment was repeated once with similar results.
j, k Western blot of PIF7-MYC protein at ZT8 and ZT12 of PIF7::PIF7-MYC (Col-0) seedlings grown in LD at constant 17°C (j) or with a 27°C midday (k). Seedlings were treated with 100 μM cyclo-heximide (CHX), 50 μM MG132, a combination of the two or mock-treated at ZT4 on the day of sampling. Actin levels are shown as loading control. Two biological replicates are shown. The experiment was repeated once with similar results.
The open arrow indicates an unspecific signal. Asterisks indicate significant differences to 17 °C control treatment (Two-sided Student’s t-test, * p < 0.05, ** p < 0.01, *** p < 0.001).
Extended Data Fig. 3. Additional thermomorphogenesis phenotypes in pif mutants.
a-d Hypocotyl length of 7-d-old Col-0 and pif mutant seedlings grown in LD at constant 17 °C, 22 °C and 27 °C (a) (n = 15), in SD at constant 17 °C, 22 °C and 27 °C (b) (n = 23, except for pif4 17 °C and 22 °C with n = 21 and pif7 27 °C with n = 22), in SD at constant 17 °C or with a daytime temperature at 27 °C (c) (n = 24 except for Col-0 27 °C with n= 19 and pif7 27 °C with n = 22) and in LD at constant 17 °C or with a warm midday of 27 °C (d) (n = 20 except for Col-0 17 °C and pif7 27 °C with n = 22), respectively. Seedlings were grown at 40 μmol m-2 s-1 in LD and 80 μmol m-2 s-1 in SD.
e, f Flowering time of Col-0 and pif mutant plants grown in LD at constant 17 °C or with a warm 37 °C midday (n = 12 except for pif4 pif7 with n = 11). Flowering time was scored as leaves at bolting (e) and days to bolting (f).
g-i Hypocotyl length (g, h; n = 20-25) and stomatal index (SI) (i; n = 12) of 7-d-old and 14-d-old seedlings of two independent PIF7::PIF7-MYC complementation lines in the pif7-1 background, respectively. Seedlings were grown in LD at 17 °C with a warm midday of 27 °C.
Box plots display the 25th and 75th percentile with the median as centre value and whiskers representing 1.5 times the IQR. Letters indicate significance groups; samples with the same letters are not significantly different (2-way ANOVA followed by two-sided Tukey test, p < 0.05). Asterisks indicate samples that are significantly different to Col-0 wild type (One-way ANOVA followed by two-sided Dunnett’s test, * p < 0.05, ** p < 0.01, *** p < 0.001). All experiments were repeated once with similar results.
Extended Data Fig. 4. The pif7 mutant lacks induction of a subset of temperature-responsive genes.
a, b Average log fold change between expression at 27 °C and 17 °C for genes differentially expressed in pif7-1 (n = 1007) (a) and genes of cluster 7 identified in Fig. 3b (n = 293) (b). Box plots display the 25th and 75th percentile with the median as centre value and whiskers representing 1.5 times the IQR. Asterisks indicate significant differences (Two-sided Student’s t-test, * p < 0.05, ** p < 0.01, *** p < 0.001).
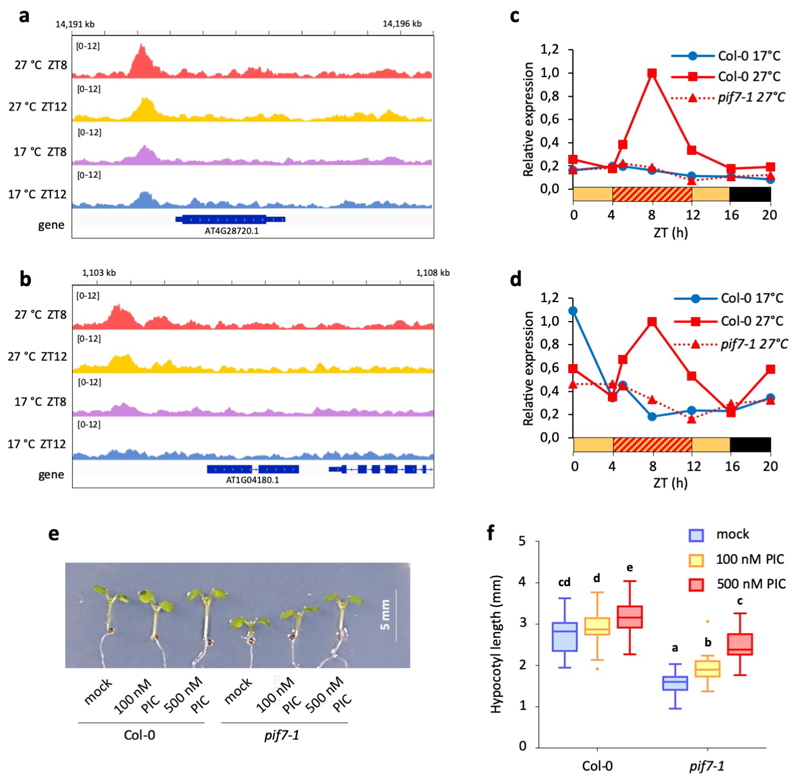
Extended Data Fig. 5. PIF7 affects auxin biosynthesis.
a, b IGV browser view of PIF7-MYC binding at the YUC8 (a) and YUC9 (b) promoters.
c, d Relative expression of YUC8 (c) and YUC9 (d) observed in the RNA-seq experiment displayed in Fig. 3. Data are expressed relative to Col-0 27 °C at ZT8.
e, f Hypocotyl length of 7-d-old Col-0 or pif7-1 seedlings treated with 100 or 500 nM picloram (PIC) or mock-treated (n = 24). Box plots display the 25th and 75th percentile with the median as centre value and whiskers representing 1.5 times the IQR. Letters indicate significance groups; samples with the same letters are not significantly different (2-way ANOVA followed by two-sided Tukey test, p < 0.05). The experiment was repeated once with similar results.
Extended Data Fig. 6. PIF7 and PIF4 are likely to interact.
a Venn diagram showing the overlap between PIF7-MYC and PIF4-HA ChIP-seq peaks. p-value was obtained by Fisher’s exact test for the independence of the two gene sets in comparison with the genomic background (n = 33554).
b IGV browser view of PIF7-MYC and PIF4-HA binding in the ATHB2 promoter.
c Yeast-2-hybrid assay testing interaction of PIF4 and PIF7 proteins expressed as fusions to a GAL4 binding domain (BD) or activation domain (AD). Empty vectors expressing BD and AD served as negative controls. The experiment was repeated once with similar results.
Extended Data Fig. 7. Hairpin structures in the 5’ UTR confer responsiveness to warm temperature.
a mfe plot of the WRKY22 5’UTR using a 40 nt sliding window.
b Predicted hairpin structure in the WRKY22 5’ UTR; mutated sequences used in in vitro studies are indicated in boxes.
c-e In vitro translation of 5’UTR hairpin::FLUC RNA fusions at different temperatures, using FLUC activity as read-out. Translation assays with WRKY22 (c) and 5’-capped PIF7 (d) wild-type (WT), 3’ and 5’ disrupted (d3, d5), reconstituted (r) and stabilised (st) hairpin constructs as well as with PIF7 WT and mutated hairpin loop (mLoop) constructs (e) were performed. Data points represent the mean of two technical replicates. The experiments were repeated twice with similar results.
Extended Data Fig. 8. Mutations in the 5’ UTR hairpin affect PIF7-MYC protein accumulation.
Western blots of PIF7-MYC protein of independent PIF7::PIF7-MYC transgenic lines harbouring wild-type (WT), 3’ and 5’ disrupted (d3, d5), reconstituted (r) and stabilised (st) hairpin sequences. Seedlings were grown in LD at constant 17°C or with a 27°C midday. Actin levels are shown as loading control. Blots were used for quantifications shown in Fig. 4j-l and Supplementary Figure 9b. The experiment was repeated once with similar results.
Extended Data Fig. 9. PIF7-MYC protein accumulation and hypocotyl elongation of transgenic PIF7::PIF7-MYC lines harbouring mutant hairpin sequences.
a Quantification of PIF7-MYC protein at ZT12 in independent PIF7::PIF7-MYC transgenic lines harbouring wild-type (WT), 3’ and 5’ disrupted (d3, d5), reconstituted (r) and stabilised (st) hairpin sequences. Seedlings were grown in LD at constant 17°C (left) or with a 27°C midday (right). Protein levels were normalised to actin and levels were expressed relative to the levels of the PIF7::PIF7-MYC (Col-0) line used in previous experiments to allow for comparisons across blots. Data points represent the mean, error bars indicate the SEM (n = 3).
b Hypocotyl length of the transgenic lines analysed in (a) (n = 25). Seedlings were grown in LD at constant 17°C (left) or with a 27°C midday (right) for 7 d. Box plots display the 25th and 75th percentile with the median as centre value and whiskers representing 1.5 times the IQR. The experiment was repeated once with similar results.
Supplementary Material
One Sentence Summary.
Translation of the bHLH transcription factor PIF7 is controlled by a thermoresponsive hairpin.
Acknowledgements
We thank Christian Fankhauser for discussions of unpublished results. This work was supported by a Wellcome grant [096082] and Medical Research Council grant [MR/R021821/1] to B.Y.W.C.; EMBO long-term postdoctoral fellowship [ALTF 1418-2015] to M.B.; Wellcome trust [106207] to A.E.F.; Gates Foundation Studentship to K.F.; BBSRC David Phillips Fellowship [BB/R011605/1] to M.D.A.; P.A.W’s laboratory was supported by a Fellowship from the Gatsby Foundation [GAT3273/GLB]. P.A.W’s Department is supported by the Leibniz Association.
Footnotes
Authors contribution:
B.Y.W.C. and P.A.W. conceived the research, B.Y.W.C, M.B. and P.A.W designed experiments and wrote the manuscript, B.Y.W.C. and M.B. performed most of the experiments. B.Y.W.C. performed ribosome profiling and RNA-seq B.Y.W.C., M.B., and P.A.W. performed RNA structure analysis, identified and characterised RNA thermometers, M.B. performed RNA-seq, phenotypic and molecular analyses, M.D.A. performed CD and FRET analysis, K.E.J. performed ChIP-Seq, M.B. and P.M. generated tagged PIF7 transgenic plants, B.Y.W.C., K.F. and F.G. performed bioinformatics analysis, A.E.F, M.D.A. and I.B. commented and revised the manuscript.
Conflict of interest:
The authors declared that they have no conflict of interest.
References
- 1.Quint M, et al. Molecular and genetic control of plant thermomorphogenesis. Nature Plants. 2016;2:15190. doi: 10.1038/nplants.2015.190. [DOI] [PubMed] [Google Scholar]
- 2.Scheffers BR, et al. The broad footprint of climate change from genes to biomes to people. Science. 2016;354:aaf7671. doi: 10.1126/science.aaf7671. [DOI] [PubMed] [Google Scholar]
- 3.Nusinow DA, et al. The ELF4-ELF3-LUX complex links the circadian clock to diurnal control of hypocotyl growth. Nature. 2011;475:398–402. doi: 10.1038/nature10182. [DOI] [PMC free article] [PubMed] [Google Scholar]
- 4.Mizuno T, et al. Ambient Temperature Signal Feeds into the Circadian Clock Transcriptional Circuitry Through the EC Night-Time Repressor in Arabidopsis thaliana. Plant & cell physiology. 2014;0:1–19. doi: 10.1093/pcp/pcu030. [DOI] [PubMed] [Google Scholar]
- 5.Box MS, et al. ELF3 Controls Thermoresponsive Growth in Arabidopsis. Current Biology. 2014 doi: 10.1016/j.cub.2014.10.076. [DOI] [PubMed] [Google Scholar]
- 6.Ezer D, et al. The evening complex coordinates environmental and endogenous signals in Arabidopsis. Nature Plants. 2017;3:17087. doi: 10.1038/nplants.2017.87. [DOI] [PMC free article] [PubMed] [Google Scholar]
- 7.Jung J-H, et al. Phytochromes function as thermosensors in Arabidopsis. Science. 2016;354 doi: 10.1126/science.aaf6005. [DOI] [PubMed] [Google Scholar]
- 8.Legris M, et al. Phytochrome B integrates light and temperature signals in Arabidopsis. Science. 2016;354 doi: 10.1126/science.aaf5656. [DOI] [PubMed] [Google Scholar]
- 9.Nozue K, et al. Rhythmic growth explained by coincidence between internal and external cues. Nature. 2007;448:358–361. doi: 10.1038/nature05946. [DOI] [PubMed] [Google Scholar]
- 10.Nomoto Y, et al. Circadian clock and PIF4-mediated external coincidence mechanism coordinately integrates both of the cues from seasonal changes in photoperiod and temperature to regulate plant growth in Arabidopsis thaliana. Plant Signaling & Behavior. 2013;8:e22863. doi: 10.4161/psb.22863. [DOI] [PMC free article] [PubMed] [Google Scholar]
- 11.Nomoto Y, Kubozono S, Yamashino T, Nakamichi N, Mizuno T. Circadian Clock- and PIF4-Controlled Plant Growth: A Coincidence Mechanism Directly Integrates a Hormone Signaling Network into the Photoperiodic Control of Plant Architectures in Arabidopsis thaliana. Plant Cell Physiol. 2012;53:1950–1964. doi: 10.1093/pcp/pcs137. [DOI] [PubMed] [Google Scholar]
- 12.Kunihiro A, et al. PHYTOCHROME-INTERACTING FACTOR 4 and 5 (PIF4 and PIF5) Activate the Homeobox ATHB2 and Auxin-Inducible IAA29 Genes in the Coincidence Mechanism Underlying Photoperiodic Control of Plant Growth of Arabidopsis thaliana. Plant Cell Physiol. 2011;52:1315–1329. doi: 10.1093/pcp/pcr076. [DOI] [PubMed] [Google Scholar]
- 13.Michael TP, et al. A Morning-Specific Phytohormone Gene Expression Program underlying Rhythmic Plant Growth. PLOS Biology. 2008;6:e225. doi: 10.1371/journal.pbio.0060225. [DOI] [PMC free article] [PubMed] [Google Scholar]
- 14.Niwa Y, Yamashino T, Mizuno T. The Circadian Clock Regulates the Photoperiodic Response of Hypocotyl Elongation through a Coincidence Mechanism in Arabidopsis thaliana. Plant Cell Physiol. 2009;50:838–854. doi: 10.1093/pcp/pcp028. [DOI] [PubMed] [Google Scholar]
- 15.Qiu Y, Li M, Kim RJ-A, Moore CM, Chen M. Daytime temperature is sensed by phytochrome B in Arabidopsis through a transcriptional activator HEMERA. Nature Communications. 2019;10 doi: 10.1038/s41467-018-08059-z. 140. [DOI] [PMC free article] [PubMed] [Google Scholar]
- 16.Park Y-J, Lee H-J, Ha J-H, Kim JY, Park C-M. COP1 conveys warm temperature information to hypocotyl thermomorphogenesis. New Phytologist. 2017;215:269–280. doi: 10.1111/nph.14581. [DOI] [PubMed] [Google Scholar]
- 17.Song YH, et al. Molecular basis of flowering under natural long-day conditions in Arabidopsis. Nature Plants. 2018;4:824–835. doi: 10.1038/s41477-018-0253-3. [DOI] [PMC free article] [PubMed] [Google Scholar]
- 18.Sun J, Qi L, Li Y, Chu J, Li C. Pif4-mediated activation of yucca8 expression integrates temperature into the auxin pathway in regulating arabidopsis hypocotyl growth. PLoS Genetics. 2012;8 doi: 10.1371/journal.pgen.1002594. [DOI] [PMC free article] [PubMed] [Google Scholar]
- 19.Charng YY, et al. A heat-inducible transcription factor, HsfA2, is required for extension of acquired thermotolerance in Arabidopsis. Plant Physiol. 2007;143:251–262. doi: 10.1104/pp.106.091322. [DOI] [PMC free article] [PubMed] [Google Scholar]
- 20.Kortmann J, Narberhaus F. Bacterial RNA thermometers: molecular zippers and switches. Nature Reviews Microbiology. 2012;10:255–265. doi: 10.1038/nrmicro2730. [DOI] [PubMed] [Google Scholar]
- 21.Morita MT, et al. Translational induction of heat shock transcription factor sigma32: evidence for a built-in RNA thermosensor. Genes & development. 1999;13:655–65. doi: 10.1101/gad.13.6.655. [DOI] [PMC free article] [PubMed] [Google Scholar]
- 22.Altuvia S, Kornitzer D, Teff D, Oppenheim AB. Alternative mRNA structures of the cIII gene of bacteriophage lambda determine the rate of its translation initiation. Journal of molecular biology. 1989;210:265–80. doi: 10.1016/0022-2836(89)90329-x. [DOI] [PubMed] [Google Scholar]
- 23.Hartwig R, Schweiger R, Schweiger H. Circadian rhythm of the synthesis of a high molecular weight protein in anucleate cells of the green alga Acetabularia. Eur J Cell Biol. 1986;41:139–141. [Google Scholar]
- 24.Juntawong P, Bailey-Serres J. Dynamic Light Regulation of Translation Status in Arabidopsis thaliana. Front Plant Sci. 2012;3:66. doi: 10.3389/fpls.2012.00066. [DOI] [PMC free article] [PubMed] [Google Scholar]
- 25.Floris M, Bassi R, Robaglia C, Alboresi A, Lanet E. Post-transcriptional control of light-harvesting genes expression under light stress. Plant Mol Biol. 2013;82:147–154. doi: 10.1007/s11103-013-0046-z. [DOI] [PubMed] [Google Scholar]
- 26.Missra A, et al. The Circadian Clock Modulates Global Daily Cycles of mRNA Ribosome Loading. Plant Cell. 2015;27:2582–2599. doi: 10.1105/tpc.15.00546. [DOI] [PMC free article] [PubMed] [Google Scholar]
- 27.Koini MA, et al. High temperature-mediated adaptations in plant architecture require the bHLH transcription factor PIF4. Curr Biol. 2009;19:408–413. doi: 10.1016/j.cub.2009.01.046. [DOI] [PubMed] [Google Scholar]
- 28.Stavang JA, et al. Hormonal regulation of temperature-induced growth in Arabidopsis. Plant J. 2009;60:589–601. doi: 10.1111/j.1365-313X.2009.03983.x. [DOI] [PubMed] [Google Scholar]
- 29.Leivar P, et al. The Arabidopsis phytochrome-interacting factor PIF7, together with PIF3 and PIF4, regulates responses to prolonged red light by modulating phyB levels. Plant Cell. 2008;20:337–352. doi: 10.1105/tpc.107.052142. [DOI] [PMC free article] [PubMed] [Google Scholar]
- 30.Li L, et al. Linking photoreceptor excitation to changes in plant architecture. Genes & development. 2012;26:785–90. doi: 10.1101/gad.187849.112. [DOI] [PMC free article] [PubMed] [Google Scholar]
- 31.de Wit M, Ljung K, Fankhauser C. Contrasting growth responses in lamina and petiole during neighbor detection depend on differential auxin responsiveness rather than different auxin levels. New Phytologist. 2015;208:198–209. doi: 10.1111/nph.13449. [DOI] [PubMed] [Google Scholar]
- 32.Leivar P, Quail PH. PIFs: pivotal components in a cellular signaling hub. Trends in Plant Science. 2011;16:19–28. doi: 10.1016/j.tplants.2010.08.003. [DOI] [PMC free article] [PubMed] [Google Scholar]
- 33.Xu X, Paik I, Zhu L, Huq E. Illuminating Progress in Phytochrome-Mediated Light Signaling Pathways. Trends in Plant Science. 2015;20:641–650. doi: 10.1016/j.tplants.2015.06.010. [DOI] [PubMed] [Google Scholar]
- 34.Lorrain S, Allen T, Duek PD, Whitelam GC, Fankhauser C. Phytochrome-mediated inhibition of shade avoidance involves degradation of growth-promoting bHLH transcription factors. The Plant Journal. 2008;53:312–323. doi: 10.1111/j.1365-313X.2007.03341.x. [DOI] [PubMed] [Google Scholar]
- 35.Fernández V, Takahashi Y, Le Gourrierec J, Coupland G. Photoperiodic and thermosensory pathways interact through CONSTANS to promote flowering at high temperature under short days. The Plant Journal. 2016;86:426–440. doi: 10.1111/tpj.13183. [DOI] [PubMed] [Google Scholar]
- 36.Oh E, Zhu J-Y, Wang Z-Y. Interaction between BZR1 and PIF4 integrates brassinosteroid and environmental responses. Nature cell biology. 2012;14:802–9. doi: 10.1038/ncb2545. [DOI] [PMC free article] [PubMed] [Google Scholar]
- 37.Ezer D, et al. The G-Box Transcriptional Regulatory Code in Arabidopsis. Plant physiology. 2017;175:628–640. doi: 10.1104/pp.17.01086. [DOI] [PMC free article] [PubMed] [Google Scholar]
- 38.Kidokoro S, et al. The Phytochrome-Interacting Factor PIF7 Negatively Regulates DREB1 Expression under Circadian Control in Arabidopsis. Plant Physiol. 2009;151:2046–2057. doi: 10.1104/pp.109.147033. [DOI] [PMC free article] [PubMed] [Google Scholar]
- 39.Yao Y, Kovalchuk I. Multiple roles of WRKY22 in Arabidopsis thaliana. 19TH INTERNATIONAL CONFERENCE ON ARABIDOPSIS RESEARCH; 2008. [Google Scholar]
- 40.David M, et al. Preferential translation of Hsp83 in Leishmania requires a thermosensitive polypyrimidine-rich element in the 3′ UTR and involves scanning of the 5′ UTR. RNA. 2010;16:364–374. doi: 10.1261/rna.1874710. [DOI] [PMC free article] [PubMed] [Google Scholar]
- 41.Su Z, et al. Genome-wide RNA structurome reprogramming by acute heat shock globally regulates mRNA abundance. PNAS. 2018;115:12170–12175. doi: 10.1073/pnas.1807988115. [DOI] [PMC free article] [PubMed] [Google Scholar]
- 42.Nieto C, López-Salmerón V, Davière J-M, Prat S. ELF3-PIF4 Interaction Regulates Plant Growth Independently of the Evening Complex. Current Biology. 2015;25:187–193. doi: 10.1016/j.cub.2014.10.070. [DOI] [PubMed] [Google Scholar]
- 43.Han X, et al. Arabidopsis Transcription Factor TCP5 Controls Plant Thermomorphogenesis by Positively Regulating PIF4 Activity. iScience. 2019;15:611–622. doi: 10.1016/j.isci.2019.04.005. [DOI] [PMC free article] [PubMed] [Google Scholar]
- 44.Zhou Y, et al. TCP Transcription Factors Associate with PHYTOCHROME INTERACTING FACTOR 4 and CRYPTOCHROME 1 to Regulate Thermomorphogenesis in Arabidopsis thaliana. iScience. 2019;15:600–610. doi: 10.1016/j.isci.2019.04.002. [DOI] [PMC free article] [PubMed] [Google Scholar]
- 45.Feng S, et al. Coordinated regulation of Arabidopsis thaliana development by light and gibberellins. Nature. 2008;451:475–479. doi: 10.1038/nature06448. [DOI] [PMC free article] [PubMed] [Google Scholar]
- 46.de Lucas M, et al. A molecular framework for light and gibberellin control of cell elongation. Nature. 2008;451:480–484. doi: 10.1038/nature06520. [DOI] [PubMed] [Google Scholar]
- 47.Fiorucci A-S, et al. PHYTOCHROME INTERACTING FACTOR 7 is important for early responses to elevated temperature in Arabidopsis seedlings. New Phytologist. in press;n/a doi: 10.1111/nph.16316. [DOI] [PMC free article] [PubMed] [Google Scholar]
- 48.Yamashino T, et al. Verification at the protein level of the PIF4-mediated external coincidence model for the temperature-adaptive photoperiodic control of plant growth in Arabidopsis thaliana. Plant Signaling & Behavior. 2013;8:e23390. doi: 10.4161/psb.23390. [DOI] [PMC free article] [PubMed] [Google Scholar]
- 49.Lee C-M, Thomashow MF. Photoperiodic regulation of the C-repeat binding factor (CBF) cold acclimation pathway and freezing tolerance in Arabidopsis thaliana. PNAS. 2012;109:15054–15059. doi: 10.1073/pnas.1211295109. [DOI] [PMC free article] [PubMed] [Google Scholar]
- 50.Li L, et al. Linking photoreceptor excitation to changes in plant architecture. Genes Dev. 2012;26:785–790. doi: 10.1101/gad.187849.112. [DOI] [PMC free article] [PubMed] [Google Scholar]
- 51.Huang X, et al. Shade-induced nuclear localization of PIF7 is regulated by phosphorylation and 14-3-3 proteins in Arabidopsis. eLife Sciences. 2018;7:e3163. doi: 10.7554/eLife.31636. [DOI] [PMC free article] [PubMed] [Google Scholar]
- 52.Qiu Y, et al. HEMERA Couples the Proteolysis and Transcriptional Activity of PHYTOCHROME INTERACTING FACTORs in Arabidopsis Photomorphogenesis. Plant Cell. 2015;27:1409–1427. doi: 10.1105/tpc.114.136093. [DOI] [PMC free article] [PubMed] [Google Scholar]
- 53.Dong J, et al. Arabidopsis DE-ETIOLATED1 Represses Photomorphogenesis by Positively Regulating Phytochrome-Interacting Factors in the Dark. Plant Cell. 2014;26:3630–3645. doi: 10.1105/tpc.114.130666. [DOI] [PMC free article] [PubMed] [Google Scholar]
- 54.Delker C, et al. The DET1-COP1-HY5 Pathway Constitutes a Multipurpose Signaling Module Regulating Plant Photomorphogenesis and Thermomorphogenesis. Cell Reports. 2014;9:1983–1989. doi: 10.1016/j.celrep.2014.11.043. [DOI] [PubMed] [Google Scholar]
- 55.Leivar P, et al. The Arabidopsis Phytochrome-Interacting Factor PIF7, Together with PIF3 and PIF4, Regulates Responses to Prolonged Red Light by Modulating phyB Levels. The Plant Cell. 2008;20:337–352. doi: 10.1105/tpc.107.052142. [DOI] [PMC free article] [PubMed] [Google Scholar]
- 56.Fujimori T, Yamashino T, Kato T, Mizuno T. Circadian-controlled basic/helix-loop-helix factor, PIL6, implicated in light-signal transduction in Arabidopsis thaliana. Plant Cell Physiol. 2004;45:1078–1086. doi: 10.1093/pcp/pch124. [DOI] [PubMed] [Google Scholar]
- 57.Chung BY, et al. The use of duplex-specific nuclease in ribosome profiling and a user-friendly software package for Ribo-seq data analysis. RNA. 2015;21:1731–1745. doi: 10.1261/rna.052548.115. [DOI] [PMC free article] [PubMed] [Google Scholar]
- 58.Chung BY-W, Deery MJ, Groen AJ, Howard J, Baulcombe DC. Endogenous miRNA in the green alga Chlamydomonas regulates gene expression through CDS-targeting. Nature Plants. 2017;3:787. doi: 10.1038/s41477-017-0024-6. [DOI] [PMC free article] [PubMed] [Google Scholar]
- 59.Hardcastle TJ, Kelly KA. baySeq: Empirical Bayesian methods for identifying differential expression in sequence count data. BMC Bioinformatics. 2010;11:422. doi: 10.1186/1471-2105-11-422. [DOI] [PMC free article] [PubMed] [Google Scholar]
- 60.Xiao Z, Zou Q, Liu Y, Yang X. Genome-wide assessment of differential translations with ribosome profiling data. Nature Communications. 2016;7 doi: 10.1038/ncomms11194. 11194. [DOI] [PMC free article] [PubMed] [Google Scholar]
- 61.Szklarczyk D, et al. The STRING database in 2017: quality-controlled protein–protein association networks, made broadly accessible. Nucleic Acids Res>. 2017;45:D362–D368. doi: 10.1093/nar/gkw937. [DOI] [PMC free article] [PubMed] [Google Scholar]
- 62.Box MS, et al. ELF3 Controls Thermoresponsive Growth in Arabidopsis. Current Biology. 2015;25:194–199. doi: 10.1016/j.cub.2014.10.076. [DOI] [PubMed] [Google Scholar]
- 63.Goodstein DM, et al. Phytozome: a comparative platform for green plant genomics. Nucleic Acids Research. 2011;40:D1178–D1186. doi: 10.1093/nar/gkr944. [DOI] [PMC free article] [PubMed] [Google Scholar]
- 64.Bolger AM, Lohse M, Usadel B. Trimmomatic: a flexible trimmer for Illumina sequence data. Bioinformatics. 2014;30:2114–2120. doi: 10.1093/bioinformatics/btu170. [DOI] [PMC free article] [PubMed] [Google Scholar]
- 65.Kim D, Langmead B, Salzberg SL. HISAT: a fast spliced aligner with low memory requirements. Nature methods. 2015;12:357–360. doi: 10.1038/nmeth.3317. [DOI] [PMC free article] [PubMed] [Google Scholar]
- 66.Pertea M, et al. StringTie enables improved reconstruction of a transcriptome from RNA-seq reads. Nature Biotechnology. 2015;33:290. doi: 10.1038/nbt.3122. [DOI] [PMC free article] [PubMed] [Google Scholar]
- 67.Banerjee A. Clustering on the Unit Hypersphere using von Mises-Fisher Distributions. 2005;6:1345–1382. [Google Scholar]
- 68.Langmead B, Salzberg SL. Fast gapped-read alignment with Bowtie 2. Nature methods. 2012;9:357–359. doi: 10.1038/nmeth.1923. [DOI] [PMC free article] [PubMed] [Google Scholar]
- 69.Zhang Y, et al. Model-based analysis of ChIP-Seq (MACS) Genome biology. 2008;9:R137. doi: 10.1186/gb-2008-9-9-r137. [DOI] [PMC free article] [PubMed] [Google Scholar]
- 70.Quinlan AR, Hall IM. BEDTools: a flexible suite of utilities for comparing genomic features. Bioinformatics. 2010;26:841–842. doi: 10.1093/bioinformatics/btq033. [DOI] [PMC free article] [PubMed] [Google Scholar]
- 71.Bailey TL, et al. MEME Suite: tools for motif discovery and searching. Nucleic Acids Res. 2009;37:W202–W208. doi: 10.1093/nar/gkp335. [DOI] [PMC free article] [PubMed] [Google Scholar]
- 72.Lorenz R, et al. ViennaRNA Package 2.0. Algorithms for Molecular Biology. 2011;6:26. doi: 10.1186/1748-7188-6-26. [DOI] [PMC free article] [PubMed] [Google Scholar]
Associated Data
This section collects any data citations, data availability statements, or supplementary materials included in this article.
Supplementary Materials
Data Availability Statement
Raw and processed data are available from Ribo-seq/RNA-seq series E-MTAB-7717, RNA-Seq series GSE124003 and ChIP-Seq series GSE127745.
Code is available from this Github repository: https://github.com/shouldsee/thermoPIF7.


