

Abstract
Drug overdoses involving opioid analgesics have increased dramatically since 1999, representing one of the United States’ top public health crises. Opioids have legitimate medical functions, but they are often diverted, suggesting a tradeoff between improving medical access and nonmedical abuse. We provide causal estimates of the relationship between the medical opioid supply and drug overdoses using Medicare Part D as a differential shock to the geographic distribution of opioids. Our estimates imply that a 10% increase in opioid medical supply leads to a 7.1% increase in opioid-related deaths among the Medicare-ineligible population, suggesting substantial diversion from medical markets.
JEL codes: I11, I12, I13
1. Introduction
Drug overdose deaths have risen steadily for the past two decades and are the leading cause of death from injuries in the United States. Overdoses involving opioids have been the dominant driver of this epidemic. In 2017, opioids were involved in 47,600 overdose deaths (Scholl et al., 2019), six times the number of opioid overdoses in 1999. The current level of opioid misuse is a “public health crisis” and the Centers for Disease Control and Prevention (CDC) label it the “fastest growing drug problem in the United States” (CDC, 2012).
A growing economics literature evaluates mechanisms to curb the rising overdose rate such as adoption of “must access” prescription drug monitoring programs (PDMPs) (e.g., Buchmueller and Carey, 2018), the introduction of abuse-deterrent opioids (e.g., Alpert et al., 2018), and improving access to substance abuse treatment (Swensen, 2015). Less research is dedicated to understanding the underlying causes of the opioid epidemic, which is critical information when designing policies to address this crisis. In this paper, we focus on the striking rise in opioid supply as a driving force of the sharp growth in overdoses, especially for the “first wave” of the opioid crisis, preceding the transition to heroin and fentanyl. There are three main motivations for this focus on supply and diversion. First, the role of large increases in the medical opioid supply is generally unknown. While additional access to opioids is often implicated as a potential reason for the opioid crisis (e.g., Ruhm, 2019), others have hypothesized that abuse is driving the rise in supply.1 This latter hypothesis is more consistent with the “deaths of despair” argument (Case and Deaton 2015, 2017), suggesting that opioid supply plays a role but that the primary causes of the rise in overdoses and corresponding reductions in life expectancy are due to changes in underlying cultural and economic conditions.
Second, the United States is unique in its level of access to opioids. The United States is the largest consumer of opioid pain relievers, consuming twice as much per capita as the second largest consumer (International Narcotics Control Board, 2011). The CDC estimates that there were 82.5 opioid prescriptions per 100 people in the U.S. in 2012 and 12 states had more opioid prescriptions than people (Paulozzi et al., 2014).
Third, reduced opioid supply is not necessarily a policy goal, which differentiates opioids from drugs typically studied in the substance use literature. Unlike most drugs associated with overdose deaths and other harms, opioids remain an important medical tool which, in certain cases, are even believed to be underprescribed.2 Opioid therapy is an effective instrument for acute pain management, although the efficacy of opioids for chronic non-cancer pain is limited (Dowell et al., 2016). While these drugs have legitimate medical functions, they are also highly-addictive, prone to abuse, and frequently diverted from their intended medical use. Despite clear concurrent national trends in overdoses and medical distribution of opioids since 1999 (Bohnert et al., 2011) as well as geospatial correlations (Paulozzi and Ryan, 2006), there is little empirical evidence of the causal relationship between the increasing supply of medically-intended opioids and spillovers to the nonmedical market. Understanding the nature of this connection is critical for considering appropriate policies to address this epidemic. This paper helps fill that void.
Despite the United States’ unprecedented opioid supply, little is known about the broader non-medical spillovers caused by increasing access to opioids for medical use or the role of these spillovers in explaining the high rate of drug overdoses. What is known is that two-thirds of people who report nonmedical use of prescription pain relievers get them from a friend or relative (SAMHSA, 2015), suggesting significant scope for increases in medical opioid supply to explain proportional rises in overdoses. Khan et al. (2019) find that overdose rates increased for people without an opioid prescription when a family member received an opioid prescription. In this paper, we focus on the role of diversion in explaining national overdose trends. We study the spillovers of increasing opioid supply on a population that did not gain additional medical access to opioids. Diversion itself is difficult to measure, but we provide indirect evidence of its importance.
The economics literature has studied the abuse of illegal drugs (Becker, Grossman and Murphy, 1991; Grossman and Chaloupka, 1998; Jacobson, 2004), shocks to the supply of illegal drugs (Dobkin and Nicosia, 2009; Galenianos, Pacula, and Persico, 2012), and misuse of legal drugs (Carpenter and Dobkin, 2009; Chaloupka, 1991; Manning et al., 1989). There is surprisingly little work on negative spillovers associated with increasing medical access to prescription drugs. Despite the public health and economic importance of the opioid crisis, there is little quasi-experimental research dedicated to understanding its underlying causal mechanisms. While the crisis has recently transitioned such that illicit opioids (heroin and fentanyl) have more prominent roles, deaths involving prescription opioids remain staggering and nonmedical use of prescription opioids strongly predicts subsequent heroin use (Compton et al., 2016). This paper studies the interaction of medical drug markets with non-medical drug use. In contrast to cocaine and heroin markets, reduced opioid access is not a clear policy goal given that such actions may require diminishing access to patients with legitimate medical needs.
While research on the opioid crisis has established a host of characteristics which predict individual-level opioid abuse, few correlates have the potential to explain the dramatic rise in abuse over time. However, access to opioids has increased at levels proportional to the rise in overdoses and there is evidence of a positive correlation between opioid prescribing and opioid abuse (Dart et al., 2016; Bohnert et al., 2011). We calculate a 274% increase in medically-intended opioid distribution between 2000 and 2011 in the United States. This increase coincides with a substantial drop in the cost of opioids. Consumers paid 56% of the total costs for opioid prescriptions in 2000 and only 19% in 2011.3 Recent work calculates out-of-pocket price trends for opioids and estimates that the price of a morphine equivalent dose4 to the consumer decreased from $2.64 in 2001 to $0.54 in 2012 (Zhou et al., 2016).
The correlation between opioid supply and overdoses does not necessarily provide useful information about the causal effect of increasing supply. Areas with faster growth in opioid misuse will experience sharper increases in overdoses and that rise in misuse may drive an expansion in the state opioid supply. Alternatively, physicians may be less prone to overprescribe in states with high rates of opioid diversion,5 suggesting the fast growth in opioid supply is associated with slower growth in misuse. The direction of bias is unknown.
We exploit large and differential geographic changes in opioid supply caused by the implementation of the Medicare Prescription Drug Benefit Program (“Part D”) in 2006, a prescription drug insurance expansion targeting older segments of the population. Part D provides voluntary outpatient prescription drug coverage to millions of Medicare beneficiaries. Several studies have shown that passage of Part D increased access and utilization of prescription drugs among the elderly (Duggan and Morton, 2010, 2011; Zhang et al., 2009; Ketcham and Simon, 2008).
At a more aggregate level, this expansion differentially affected states based on the proportion of the population eligible for Medicare. States with a relatively large fraction of individuals gaining prescription drug coverage due to Part D experienced a relative increase in opioid supply. The resulting shifts in opioid supply are large and mimic the national growth in opioid access. This has the potential to affect the Medicare-ineligible population if a primary access point is either (1) elderly relatives or friends with multiple concurrent opioid prescriptions, or (2) diverted opioids from medical facilities, pain clinics, and pharmacies that care for elderly patients. While the elderly have a modest rate of unintentional opioid overdose deaths (Paulozzi et al., 2011), they are the legitimate medical users of more opioid prescriptions than any other age group (Volkow et al., 2011), which makes studying an insurance expansion targeting older age groups ideal.
We leverage the differential effects of the implementation of Part D on states based on pre-Part D variation in elderly shares. Our approach permits us to account for national effects associated with Part D and other secular trends while also controlling for fixed differences across states. Drawing on evidence presented below that states with higher elderly shares have higher Part D enrollment and that enrollment in Part D increased the amount of opioids prescribed to individuals 65 years and older, we test whether the overall supply of opioids increased disproportionately in high elderly share states. Once we establish that the medical distribution of opioids is higher to states with a higher elderly share after implementation of Part D, we examine whether this differential increase in opioid supply led to disparate growth in opioid abuse rates among the under-65 population as measured by overdose deaths and using a complementary measure of opioid substance abuse treatment admissions. Part D also potentially affected prescription drug access for the Social Security Disability Insurance (SSDI) population since SSDI beneficiaries are eligible for Medicare, but we show that our results are not driven by systematic behavioral changes among under-65 individuals covered by Medicare.
We assess the differential impact of Part D on under-65 opioid-related treatment admissions and overdose deaths. We find significant effects on both outcomes and there is no evidence of differential pre-existing trends. Our estimates imply that a 10% increase in medical access to opioids leads to a 7.1% increase in opioid-related mortality and a 9.6% increase in opioid-involved treatment admissions among the under-65 population. We do not find corresponding evidence that opioid prescriptions increased among the under-65 population disproportionately in high elderly share states, consistent with diversion as the driving mechanism and ruling out alternative mechanisms such as physician prescribing spillovers or systematically related changes in opioid access for the SSDI population. While our measure of diversion is indirect, we consider a wide range of alternative causal pathways but the evidence strongly suggests that Part D increased opioid abuse among the under-65, non-SSDI population through diversion. Extrapolating our results to the full 2000–2011 time series, our evidence suggests that 74% of the dramatic growth in opioid-related overdose deaths over this time period can be attributed to spillovers resulting from increased medical access. We conclude that diversion has played a key role in the opioid crisis.
The rest of the paper is organized as follows. In Section 2, we provide background on Medicare Part D, detail the data that we use to estimate our models, and discuss our underlying theoretical framework. Section 3 describes our empirical approach. We present results in Section 4. In Section 5, we discuss interpretation of the findings. We close in Section 6 with a summary of our main findings and the policy implications.
2. Background
2.1. Medicare Part D
On December 8, 2003, President George W. Bush signed the Medicare Modernization Act (MMA), which created Medicare Part D. Part D was implemented in 2006 and provided voluntary coverage of prescription drugs for those eligible for Medicare. The introduction of Part D was the largest expansion to Medicare since its creation and accounted for $89.8 billion in expenditures in 2015.6 Safran et al. (2005) estimated that approximately 25% of Medicare beneficiaries did not have any prescription drug coverage prior to 2006. Part D substantially reduced the out-of-pocket price of prescription drugs for the Medicare population, and empirical evidence has found that these reduced prices increased use of prescription drugs.
A large literature has studied the ramifications of Part D on prescription drug utilization (e.g., Ketcham and Simon, 2008; Zhang et al. 2009) and drug prices (e.g., Duggan and Morton, 2010) as well as effects on nondrug medical care utilization (McWilliams et al., 2011). Most of this research focuses on the targeted population. There is far less work considering spillovers to the Medicare-ineligible population, which are potentially important given the large size of the program.7 This paper provides evidence that Part D had important spillovers on the health of the population not covered by the program.
Health insurance expansions, more generally, may affect opioid abuse through several different and potentially off-setting channels. Health insurance increases medical care utilization (Manning et al., 1988), which could lead to more prescriptions of pain relievers for new conditions diagnosed. Alternatively, health insurance could improve access to substance abuse treatment (Maclean and Saloner, 2018, 2019). A key advantage of studying Medicare Part D, unlike recent Medicaid expansions, is that it only altered prescription drug access, not medical care utilization directly, allowing us to isolate the effects of opioid supply from changes in substance abuse treatment access and other factors.8 By primarily studying outcomes among the Medicare-ineligible, we further disentangle the consequences of increased opioid supply from other causal impacts of prescription drug coverage.
2.2. Data
In this section, we discuss the sources for our data. We conduct all analyses at the state-level since our four primary measures of opioid supply and misuse can be calculated at this level. More granular metrics are also possible, but the data sets do not share any common sub-state identifiers. While it is possible to impute metrics to one uniform geography, these imputations require assumptions,9 which we do not have to impose at the state level. The main cost of using state-level data is that we lose some variation in our measure of exposure to Part D, which may reduce power.10 We rely on the 2000–2011 time period to narrow the sample period closer to the implementation of Part D and remain consistent across all data sets.
2.2.1. Opioid Supply
To measure supply, we rely on data which records the distribution of opioids to each state. Using prescriptions would miss a critical source of diversion given that opioids can be diverted before they are received by patients through fraud or theft. Information regarding the supply of prescribed opioids within the state is captured in the Drug Enforcement Administration’s (DEA) Automation of Reports and Consolidated Orders System (ARCOS). The Controlled Substance Act of 1970 requires all manufacturers and distributors to report their transactions and deliveries of all Scheduled II (and selected Scheduled III and IV) substances to the Attorney General. ARCOS is the system that monitors and records the flows of these controlled substances as they move from manufacturers to retail distributors. We construct an aggregate measure of “opioid supply” from twelve reported opioid analgesics: fentanyl, hydrocodone, hydromorphone, meperidine, methadone, morphine, oxycodone, codeine, dihydrocodeine, levorphanol, oxymorphone, and tapentadol.11 We convert to morphine equivalent doses drawing on standard multipliers.12,13 A morphine equivalent dose is equivalent to one 40mg OxyContin pill.
2.2.2. Mortality
Information on opioid overdose deaths comes from the National Vital Statistics System (NVSS), a census of deaths in the United States. We code deaths as related to prescription opioid pain relievers using the ICD-10 external cause of injury codes (X40-X44, X60–64, X85, or Y10-Y14) and drug identification codes (T40.2-T40.4), which indicate death by any opioid analgesic. We aggregate the data based on state of occurrence and year. Our primary results will focus on ages 0–64, but we will also present estimates for smaller age groups and the 65+ population.
2.2.3. Substance Abuse Treatment Admissions
For complementary evidence, we use the Treatment Episode Data Set (TEDS) to study substance abuse treatment admissions. The TEDS is collected annually by state substance abuse agencies at the request of the Substance Abuse and Mental Health Service Administration (SAMHSA). The data contain the majority of all publicly funded substance abuse treatment admissions that occur within the United States, as all facilities that receive any government funding (federal block grant funding, state treatment dollars, or even insurance dollars from Medicaid, Medicare, or Tricare) are required to provide basic information.
Some facilities are excluded, but these exclusions are unlikely to cause problems for our empirical strategy for two reasons. First, our specifications include state fixed effects which account for persistent differences in state reporting over time. Second, it is unlikely that states more “exposed” (defined below) to Part D experienced systematic changes in the share of unobserved facilities missed by TEDS or changes in reporting beginning in 2006. In our analyses, we test this assumption by removing particularly problematic reporting states and by studying treatment admissions for other substances (e.g., alcohol or heroin), which would be also be affected by reporting changes.
We aggregate annual case-level data on admissions for the period 2000–2011. TEDS provides age in broad categories: 12–14, 15–17, 18–20, 21–24, 25–29, 30–34, 35–39, 40–44, 45–49, 50–54, 55+. Consequently, to study the impact of Part D on under-65 age groups, we rely on analyses of the 12–54 age group. We will also show results for smaller age groups as well as the 55+ group. TEDS includes information on whether the individual is retired or disabled, so we are able to remove any non-elderly with disabilities (i.e., the SSDI population) and test the sensitivity of our results to excluding this group. More details about the TEDS and the construction of our outcome variable are included in Appendix A.
2.2.4. Medical Expenditure Panel Survey (MEPS)
We also make use of data from the MEPS to empirically test alternative hypotheses. The MEPS is a set of large-scale surveys of individuals, families, and their medical providers/payers that is maintained by the Agency for Healthcare Research and Quality (AHRQ). The household data are a nationally-representative longitudinal data set which surveys households about demographics, income, health insurance, and medical claims. We use the geocoded version available in the AHRQ Research Data Center to study state-level changes over time. The Prescribed Medicines Data Files include prescription drug claims data for each person in the household surveys. These files were linked to the Multum Lexicon database to obtain therapeutic class variables. We follow Stagnitti (2015) in categorizing prescriptions as opioids.14
2.2.5. Other Variables
We study changes in opioid abuse as a function of the percentage of the state population ages 65+ in 2003. We choose 2003 because Medicare Part D was signed into law at the end of that year, and hence 2003 is likely free of any possible anticipation effects (Alpert, 2016). We use population data from the Census to construct our population variables. We also control for state-level demographics using data from the Census and American Community Survey, including the percent of the population that is white, percent of the population ages 25+ with no college (i.e., high school degree or less), percent of the population ages 25+ with some college but no college degree, and 6 age shares (0–11, 12–17, 18–24, 25–44, 45–64, 65+). We also account for the state unemployment rate from the Bureau of Labor Statistics.
In analyses using our full set of controls, we also condition on a set of policy variables. The policy variables include whether the state has a prescription drug monitoring program (Prescription Drug Abuse Policy Surveillance),15,16 medical marijuana laws, active and legally-protected medical marijuana dispensaries (RAND Marijuana Policy database; see Powell et al., 2018; Williams et al., 2019), and laws regulating pain clinics (National Alliance of Model State Drug Laws). In Appendix Table A.1, we report the first full year17 that each state had these policies (as of 2011).
2.2.6. Descriptive Statistics
The percent elderly in 2003 was 12.4% with a state-level standard deviation of 1.9%. This percent ranges from 6.2% in Alaska and 8.5% in Utah to 15.4% in West Virginia and 17.0% in Florida, representing a significant amount of variation across states. The geographic distribution of the percent elderly is mapped in Figure A.1.
There was substantial growth in opioid supply and abuse, as shown in Figure 1, throughout our analysis period. Distribution of opioid analgesics grew during this period, rising 274% from 2000 to 2011. Per capita opioid overdose deaths also show a significant rise, increasing by 248% between 2000 and 2011. During the same time period, substance abuse treatment admissions for opioids increased by 369%.
Figure 1:
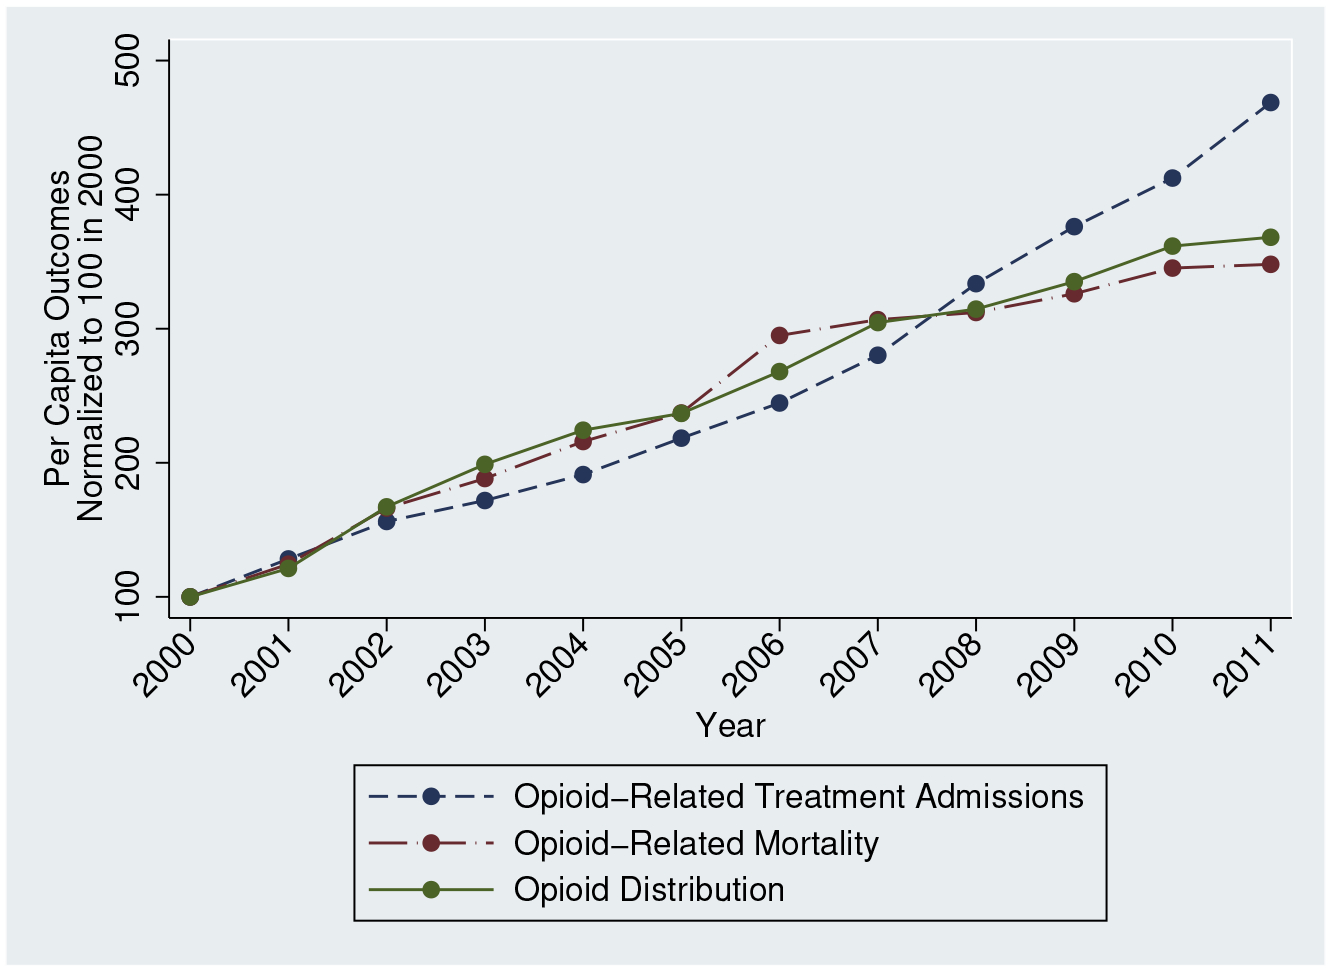
Opioid Use and Abuse
Notes: We use ARCOS data to generate per capita opioid distribution, NVSS to create per capita opioid-related mortality, and TEDS to calculate per capita substance abuse treatments for opiates. We normalize each time series to 100 in 2000.
There appears to be a greater rise in opioid distribution and opioid deaths in the period preceding the implementation of Medicare Part D than in the period following Medicare Part D. Baseline differences account for some of this, but it is also possible that state- and national-level policies (as well as broader recognition of the dangers of lax opioid prescribing) intended to curb opioid abuse altered these trends. For example, between 2005 and 2007, an additional 14% of the U.S. population was covered by a PDMP and the first pill mill regulations were adopted, suggesting that these years represented an especially active time for meaningful changes in policy. More generally, the opioid literature has often struggled to reconcile dramatic time series trends with the widespread adoption of policies shown to alter overdose rates, often in the opposite direction. Consequently, in order to isolate the effect of changes in opioid supply from the dramatic secular trends which define the opioid crisis, it is important to account for time fixed effects while employing an empirical strategy which exploits differential geographic shocks to opioid access.
We include means for our outcomes and other variables for the pre-period in Table 1, separated by 2003 elderly share. There are some noticeable differences between the two sets of states, motivating our use of a fixed effects framework to account for these initial differences. However, opioid-related mortality is similar across the two sets of states. Before Part D, low elderly share states had 3.00 fatal opioid overdoses per 100,000 people ages 0–64. High elderly share states had 2.99 fatal overdoses per 100,000 ages 0–64.
Table 1:
Summary Statistics for 2000–2005
| Low Elderly Share | High Elderly Share | P-Value | |
|---|---|---|---|
| Outcomes | |||
| Opioid Deaths per 100,000 | 2.75 | 2.63 | 0.805 |
| Opioid Deaths per 100,000, Ages 0–64 | 3.00 | 2.99 | 0.981 |
| Substance Abuse Treatment Admissions per 100,000 | 31.4 | 49.7 | 0.043 |
| Substance Abuse Treatment Admissions per 100,000, Ages 12–54 | 40.7 | 67.7 | 0.026 |
| Morphine Equivalent Doses per capita | 6.13 | 7.47 | 0.009 |
| Covariates | |||
| Unemployment Rate | 5.41 | 4.94 | 0.033 |
| % Ages 0–11 | 17.2% | 15.7% | 0.000 |
| % Ages 12–17 | 8.9% | 8.5% | 0.003 |
| % Ages 18–24 | 10.2% | 9.5% | 0.001 |
| % Ages 25–44 | 29.6% | 28.2% | 0.001 |
| % Ages 45–64 | 23.0% | 24.1% | 0.007 |
| % Ages 65+ | 11.1% | 14.0% | 0.000 |
| % No College | 43.0% | 43.6% | 0.639 |
| % Some College | 28.0% | 26.5% | 0.129 |
| % White | 63.3% | 74.1% | 0.064 |
| % Ages 65+ in 2003 | 11.3% | 13.3% | 0.000 |
Notes: All statistics are weighted by the population. States are divided into groups based on 2003 elderly share. “P-Value” refers to the hypothesis that the means in the low and high elderly share states are equal (adjusted for clustering at the state level).
2.3. Theoretical Framework
A primary motivation of this paper is to understand the interaction of medical and illicit markets for opioids and the scope for diversion into nonmedical use to explain national trends in overdoses. Given a large shock to the medical distribution of opioids, the supply on the illicit market will also increase assuming that there are nontrivial rates of diversion. This supply shock drives down the costs (monetary and non-monetary) of obtaining opioids for non-medical use. Typically, such a shock to opioid access could also shift the illicit market demand curve since opioids are now easier to obtain in medical settings. However, our empirical approach shuts down this simultaneous demand shift by studying a population unaffected by the change in legal access.
We do not observe prices or quantities in illicit markets. Instead, we study the consequences of a shift in the illicit supply curve on downstream outcomes. We might suspect that a shock to the availability of opioids could have immediate effects on overdose rates if it increases initiation rates and naïve users, given a lack of sophistication and tolerance, have some propensity to overdose. Alternatively, for addictive goods, the utility of consumption is a function or prior consumption such that dependence may evolve over time and require escalation of dosages, eventually leading to lethal doses. Unfortunately, given our source of variation, there are limits to our ability to uncover specific mechanisms beyond quantifying the overall role of diversion. However, this theoretical framework suggests that the timing of the effect is especially interesting in this context, motivating our empirical model. Moreover, we may conjecture that the timing of the effects of such a supply shock may be different for treatment admissions than fatal overdoses. We study the timing of both.
3. Empirical Framework
Medicare Part D was implemented as a national program in 2006, but states were affected differentially based on the fraction of their population eligible for Medicare benefits. We use cross-state variation in the percentage of the population ages 65+ and find that this serves as a useful predictor. We fix our population share variable in 2003; identification originates solely from the introduction of Part D interacted with fixed state elderly shares. This strategy allows us to non-parametrically control for the independent effects of Part D (through year fixed effects) and fixed elderly share (through state fixed effects).18
3.1. Using Elderly Share as the Main Predictor
While elderly share is not a “perfect” predictor of changes in prescription drug coverage due to Part D, it does not need to be for our purposes and it has advantages over the alternatives. First, we do not exploit the predictable gains in Part D coverage for the SSDI population since this population typically had generous prescription drug coverage prior to Part D.19 In fact, if we replicate our “first stage” analysis below (Table 2) while also including 2003 non-elderly SSDI share interacted with post-2006, we find that this variable does not predict growth in state supply.20
Table 2:
Medical Supply of Opioids
| Outcome: | Morphine Equivalent Doses Per Capita | |||
|---|---|---|---|---|
| % Elderly2003 × Post | (1) | (2) | (3) | (4) |
| 0.824*** (0.202) |
1.042*** (0.122) |
0.966*** (0.119) |
0.953*** (0.255) |
|
| State time-varying controls × Year Fixed Effects | No | Yes | Yes | Yes |
| No | No | No | Yes | |
| Policy Variables | No | No | Yes | Yes |
| N | 612 | 612 | 612 | 612 |
Notes:
Significance 1%,
Significance 5%,
Significance 10%.
Standard errors in parentheses adjusted for clustering at state level. All regressions weighted by population. Mean outcome = 9.67. Controls included in all models but not shown: state fixed effects and year fixed effects. State time-varying controls include the unemployment rate, % white, 6 age group shares, % no college, and % some college (but no degree). When these covariates are interacted with year indicators, the age group shares are not due to collinearity concerns (given the interaction term of interest). Instead, we also include the 2003 share ages 25–44 interacted with year indicators. Policy variables include whether the state has a PDMP, a medical marijuana law, legal and operational medical marijuana dispensaries, and pain clinic regulations.
Second, in principle, we could also exploit pre-Part D prescription drug coverage rates for the older population (similar to Dunn and Shapiro, 2019). Constructing state-specific prescription drug coverage rates for the elderly population can be difficult, typically involving small sample sizes and injecting a level of noise that can be avoided by simply relying on elderly shares. In principle, pre-Part D state-level prescription drug coverage rates among the elderly could be systematically and inversely related to elderly share such that they would unravel our first stage. However, we test the relationship between elderly share and opioid supply growth empirically and rely on the empirical relationship as our test of the appropriateness of using elderly share. There is little loss in simply using 2003 elderly share given that it predicts state-level growth in opioid supply.
3.2. Main Specification
We use the timing of Part D and cross-sectional differences in elderly share across states for identification. We estimate the specification
| (1) |
where yst is a measure of opioid-related distribution, abuse, or mortality for state s in year t. X is the vector of time-varying covariates which includes percentage white, 6 age group shares, percent with no college, percent with some college (but no degree), and the unemployment rate. We will also include policy variables: PDMPs, medical marijuana laws, legal and operational medical marijuana dispensaries, and pain clinic regulations.
We will show results which do not include the time-varying covariates because of concerns that some of these variables may themselves be outcomes related to opioid diversion. In addition, these covariates may themselves predict differential trends in the outcomes so we will also provide results in which we permit the relationship between the covariates and outcomes to vary by year.21 We are interested in the estimate of δ, the differential change in the outcome experienced by high elderly share states relative to low elderly share states. We expect this estimate to be positive if Part D increased opioid access and, consequently, opioid-related substance abuse.
In addition, we will present event study estimates, which lets the relationship between 2003 elderly share and the outcomes to vary by year. For these results, we will also allow the relationship between the covariates and outcomes to vary by year given recent work suggesting that this flexibility is important in such designs (Jaeger et al., 2018). Event study estimates will provide evidence about the importance of pre-existing trends while also testing for the timing of the effect. The timing of the effect is interesting here given the dynamics of addiction and substance use.
Our outcome measures will be specified as per capita morphine equivalent doses, deaths per 100,000 people, or substance abuse treatments per 100,000. We weight all regressions by state population, and standard errors are adjusted for clustering at the state level.
4. Results
4.1. Part D Enrollment & Prescription Opioid Use Among the Elderly
Our empirical strategy relies on the assumption that elderly share predicts changes in state opioid supply due to Part D implementation. We will test this assumption explicitly in the next section but, here, we explore intermediate outcomes which are consistent with an increase in supply. First, we test whether high elderly share states have higher Part D enrollment per capita. We use Part D enrollment data from the CMS aggregated by state and year to study this relationship. Part D may impact access by providing prescription drug coverage to part of the population which would not have had any coverage otherwise or by providing more generous coverage to people who would have had coverage even in the absence of Part D. Both of these mechanisms are potentially important determinants of the overall increase in opioid supply. Here, we simply verify that high elderly share states have higher Part D enrollment rates after implementation.
Figure A.2 quantifies the relationship between elderly share and the Part D enrollment rate (Part D enrollment divided by state population). It shows coefficient estimates from cross-sectional year-by-year regressions of the Part D enrollment rate on 2003 elderly share between 2006 and 2011, indicating that each additional percentage point of the state population ages 65+ predicts an additional 0.4 to 0.6 percentage points of the population enrolled in Medicare Part D. This relationship grows over time, which suggests that we might expect the relationship between 2003 elderly share and our measures of opioid supply and abuse to grow over time as well. Our graphical analyses will generally find that this is the case.
Second, our empirical strategy assumes that enrollment in Medicare Part D increased the amount of opioids prescribed to individuals 65 years and older. While several papers have identified an impact of Medicare Part D on prescription drug utilization for the 65+ population, we are unaware of any published analyses looking specifically at the effects on opioid utilization.22 To verify previous findings hold for opioids specifically, we conducted our own examination of the impact of Medicare Part D insurance on the number of opioids prescribed by comparing opioid prescriptions filled by a group of newly insured (those 66–71 years of age) to a sample of near elderly (those 59–64 years of age) in the 2002–2009 MEPS. This strategy replicates the empirical strategy found in the literature on the Part D effects on utilization. A complete description of this analysis is included in Appendix Section B. The main results and numerous sensitivity analyses demonstrate that Medicare Part D decreased the out-of-pocket price of opioids substantially (by 48%) and increased the number of annual prescriptions by 0.174 relative to the 59–64 age group (representing a 28% increase), implying an elasticity of −0.6. Alpert (2016) estimates that acute drug prescriptions increased by 23.6% for the elderly after implementation of Part D, similar in magnitude to the estimated increase in opioid prescriptions here.
This relationship suggests that Part D had the potential to increase the supply of opioids in states with high elderly share. We do not necessarily expect that the increase in prescriptions due to Part D reflects the full growth in opioid supply since opioids may be diverted before they are prescribed. However, an increase in number of prescriptions is consistent with an increase in supply.
4.2. State-Level Increases in Opioid Supply
We now turn to our main models to examine whether state elderly share is associated with an increased state supply of opioids. We estimate equation (1) using morphine equivalent doses per capita from the ARCOS data as our outcome variable and present our estimates in Table 2. We estimate that a one percentage point increase in the 2003 elderly share is associated with additional 0.8 morphine equivalent doses per person after Part D. This estimate is robust to the inclusion of the unemployment rate and demographics (Column 2). In Column (3), we add policy variable controls and the estimated effect is unaffected. Finally, in Column 4, we permit the time-varying controls to have different effects in each year. We estimate a similar relationship. The consistency of the estimates across models is suggestive that there are no time-varying confounders biasing our estimates.
Figure 2 provides the event study equivalent. While there is some evidence of a pre-existing trend prior to 2003, we observe little differential change in opioid supply between 2003 and 2005. This is followed by a sharp rise beginning in 2006 and continuing to 2010. Overall, we find convincing evidence that the introduction of Medicare Part D differentially affected the geographic supply of opioids based on elderly share. As discussed before, we do not necessarily expect that the increase in distribution to each state solely reflects increases in prescriptions to the 65+ population. For example, pharmacy theft is common,23 and opioids are also known to be stolen at other points of the supply chain. Consequently, the ARCOS data provide a useful measure of opioid supply that would not be captured by prescriptions. Next, we analyze harms associated with this broader opioid availability.
Figure 2:
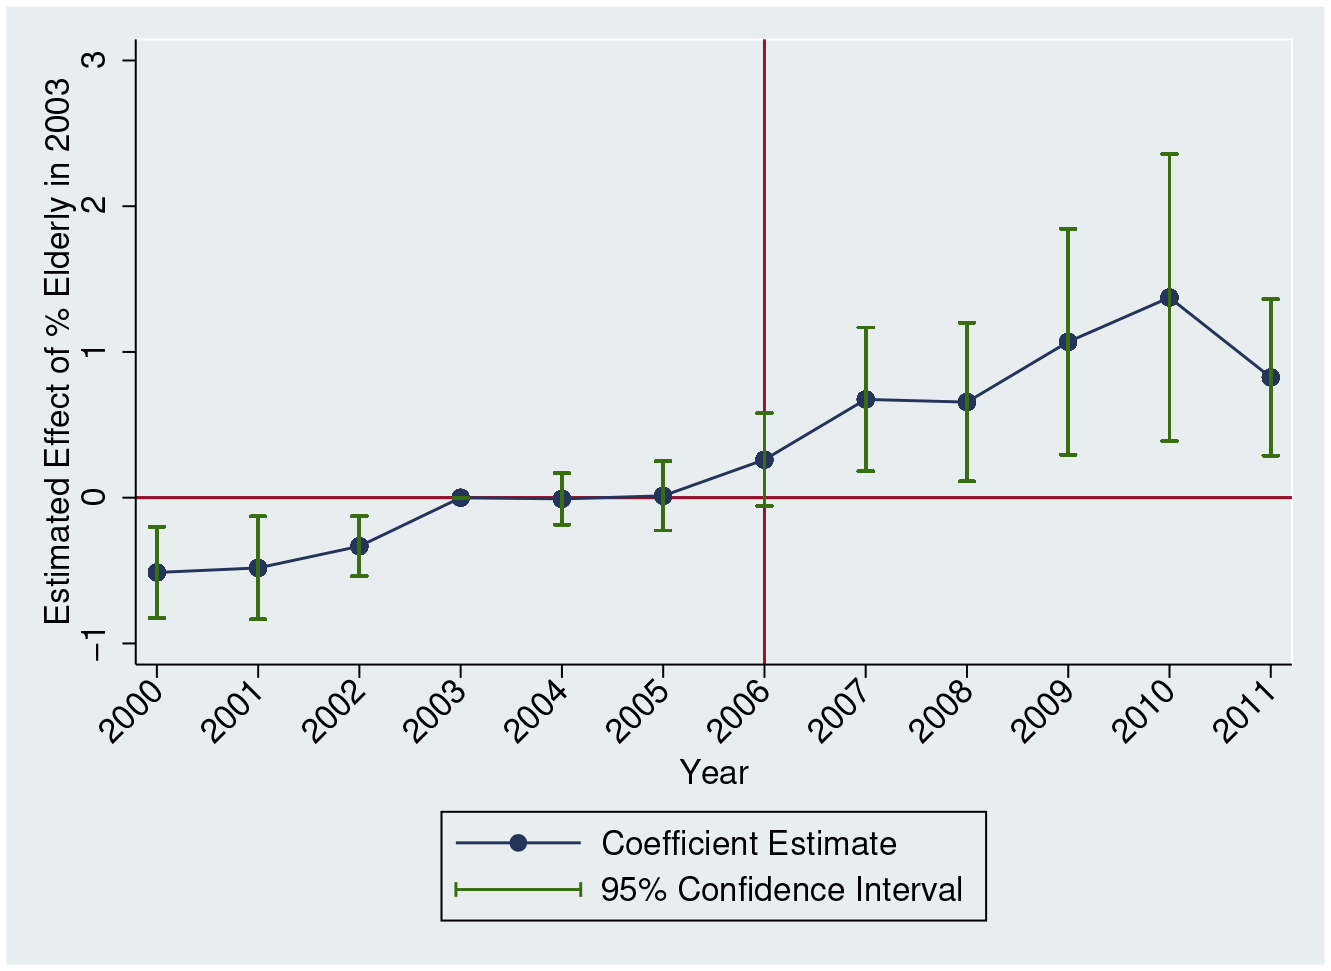
Opioid Distribution: Event Study
Notes: We estimate equation (1) but allow the effect of Elderly Share in 2003 to vary by year, normalizing the coefficient for 2003 to zero. The outcome is morphine equivalent doses per capita. State and time fixed effects included. We also include all controls used in Table 2, Column 4. 95% confidence intervals adjusted for clustering at the state level.
4.3. Mortality Regression Estimates
We present our regression estimates of the differential impact of Medicare Part D on non-elderly opioid-related mortality in Table 3. The outcome variable is opioid-related deaths per 100,000 (ages 0–64). We estimate that each additional percentage point of the percentage elderly is associated with 0.28 additional deaths per 100,000 people after the enactment of Part D (Column 1), statistically significant from zero at the 5% level. In Column (2), we add state-specific time-varying controls and find that the estimate is robust to accounting for these factors. We control for additional policy variables in Column (3) and estimate that each additional percentage point of the percentage elderly is associated with 0.35 additional deaths per 100,000 after 2006. In Column (4), we interact the time-varying covariates with year indicators. The estimate increases further.
Table 3:
Opioid-Related Mortality, Ages 0–64
| Outcome: | Opioid-Related Mortality per 100,000 | By Age | |||
|---|---|---|---|---|---|
| % Elderly2003 × Post | (1) | (2) | (3) | (4) | (5) |
| 0.282** (0.120) |
0.330*** (0.117) |
0.354*** (0.130) |
0.445*** (0.141) |
0.357*** (0.124) |
|
| State time-varying controls × Year Fixed Effects | No | Yes | Yes | Yes | Yes |
| No | No | No | Yes | No | |
| Policy Variables | No | No | Yes | Yes | Yes |
| N | 612 | 612 | 612 | 612 | 39,780 |
Notes:
Significance 1%,
Significance 5%,
Significance 10%.
State and year fixed effects included in all models. Standard errors in parentheses adjusted for clustering at state level. Mean outcome = 4.33 in all columns. All regressions weighted by population. In Column (5), observations are defined by state-year-age and the outcome is the number of opioid-related deaths per 100,000 in that cell. State time-varying controls include the unemployment rate, % white, 6 age group shares, % no college, and % some college (but no degree). When these covariates are interacted with year indicators, the age group shares are not included due to collinearity concerns (given the interaction term of interest). Instead, we also include the 2003 share ages 25–44 interacted with year indicators. Policy variables include whether the state has a PDMP, a medical marijuana law, legal and operational medical marijuana dispensaries, and pain clinic regulations. The last column also include state-age and age-year fixed effects.
Next, we consider the independent effects of variation in age composition by accounting flexibly for differences in age structure. We create opioid-related deaths per 100,000 for each age under 65 (0, 1, 2,…, 64); observations are defined by state-year-age. The specification includes age-year interactions as well as state-age interactions, flexibly accounting for the effects of age composition changes in each state and the time-varying propensities of abuse by age. The estimate, presented in Column (5) of Table 3, is similar to the Column (3) estimate which uses the more aggregated approach. In general, we find that the results of this paper are insensitive to flexible controls for state age structure.
We also include an event study equivalent of equation (1) in Figure 3, permitting the effect of the 2003 elderly share to vary by year. There is little evidence of pre-existing trends. It is also worth remembering that the pre-2006 levels are also similar across states (as shown in Table 1). Post-implementation of Part D, there is a steady rise in mortality, generally following a similar path as the opioid distribution event study estimates (Figure 2).
Figure 3:
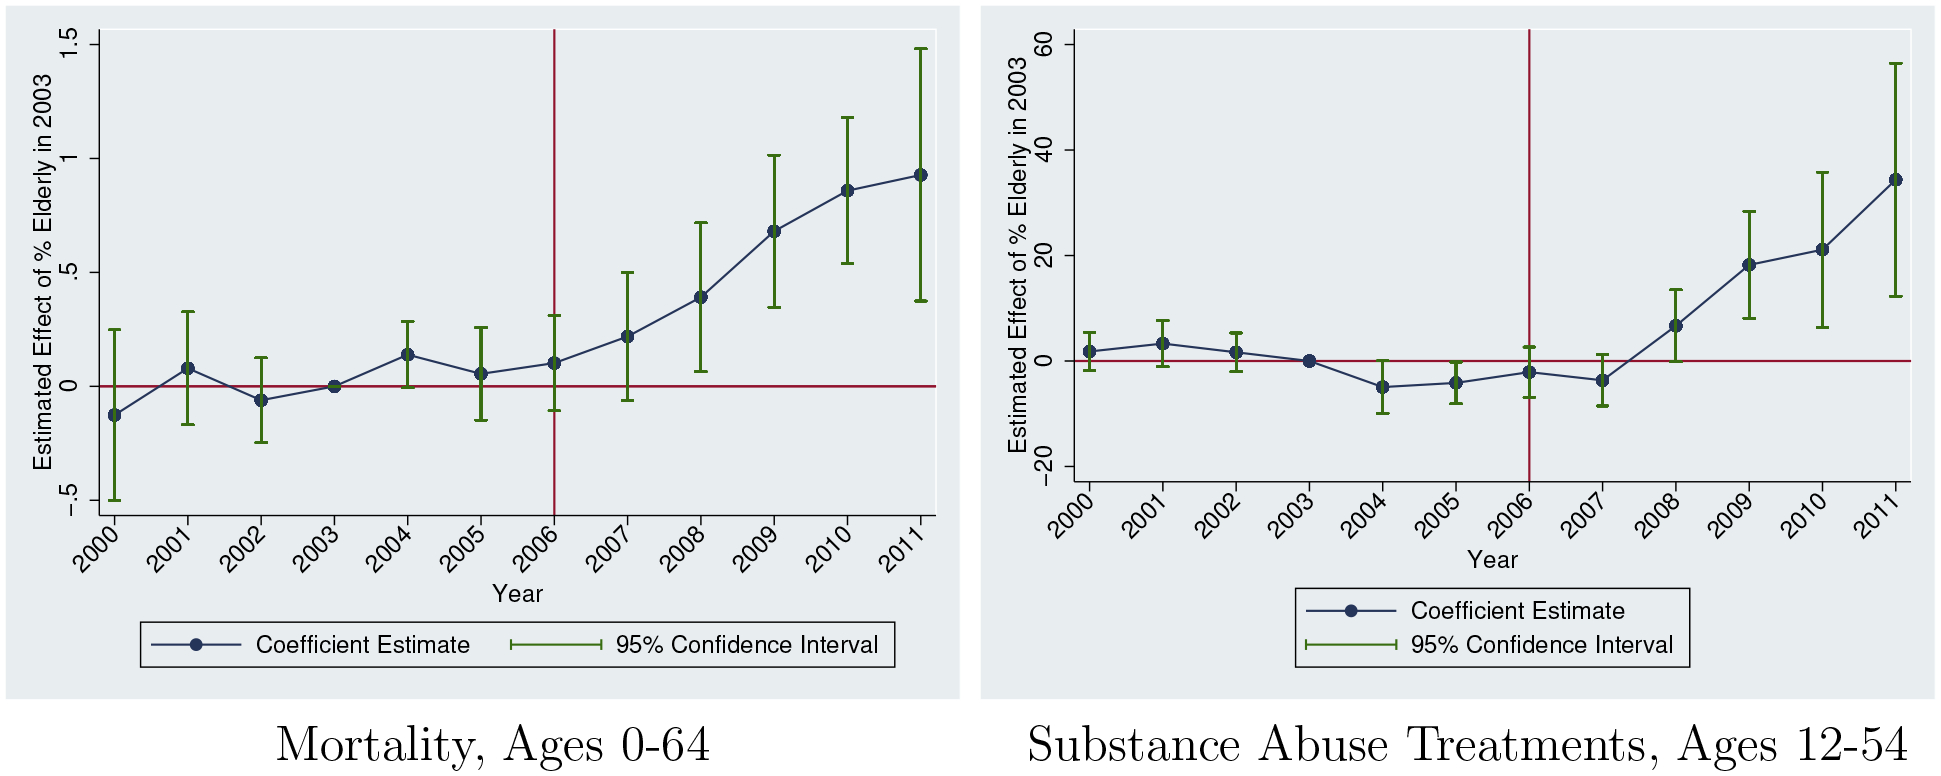
Main Event Study Estimates
Sources: National Vital Statistics System (2000–2011) and Treatment Episode Data Set (2000–2011)
Notes: Outcomes are specific to opioid-related mortality and opioid-related substance abuse treatments (per 100,000). Each estimate refers to the effect of 2003 Elderly Share in that year. All specifications include controls for time and state fixed effects. We also include all controls used in Table 3, Column 4. Regressions are population-weighted. Estimates are normalized to 0 in 2003. 95% confidence intervals adjusted for clustering at the state level.
Table 4 disaggregates the relationship between Part D expansion and opioid-related mortality by sex and age group. The results show that the effect is larger for men across most age groups. For men, the largest estimate is for the 30–39 age group, implying that each percentage point of elderly share leads to 0.99 additional opioid-related deaths per 100,000 people, almost three times as large as the aggregate effect shown in Table 3, Column (3). For women, the largest estimate is for the 40–49 age group. In the last row of Table 4, we present the p-value from a test of whether the estimate for men is equal to the estimate for women for the same age group.24 At the 5% level, we can reject that the 50–59 age group estimates are the same across gender as well as the 30–39 age group estimates.
Table 4:
Opioid-Related Mortality by Age Group
| Outcome: | Opioid-Related Mortality per 100,000 | ||||||
|---|---|---|---|---|---|---|---|
| Panel A: Men | |||||||
| Age Group: | 10–19 | 20–29 | 30–39 | 40–49 | 50–59 | 60–64 | 65+ |
| % Elderly2003 × Post | −0.008 (0.048) |
0.547** (0.208) |
0.985*** (0.309) |
0.497* (0.264) |
0.596*** (0.221) |
0.217* (0.109) |
−0.002 (0.024) |
| Mean Outcome: | 1.13 | 7.02 | 7.83 | 9.79 | 7.15 | 2.72 | 0.82 |
| Panel B: Women | |||||||
| Age Group: | 10–19 | 20–29 | 30–39 | 40–49 | 50–59 | 60–64 | 65+ |
| % Elderly2003 × Post | −0.007 (0.018) |
0.421*** (0.155) |
0.413** (0.167) |
0.603** (0.270) |
0.269* (0.148) |
0.171** (0.078) |
0.023 (0.035) |
| Mean Outcome: | 0.35 | 2.52 | 4.34 | 6.89 | 5.52 | 2.53 | 0.87 |
| P-Value (Men=Women) | 0.922 | 0.434 | 0.042 | 0.384 | 0.008 | 0.816 | 0.450 |
Notes:
Significance 1%,
Significance 5%,
Significance 10%.
N=612 for all cells. Standard errors in parentheses adjusted for clustering at state level. All regressions weighted by population. Other controls included: state fixed effects, year fixed effects, the unemployment rate, % white, 6 age group shares, % no college, % some college, PDMP, medical marijuana law, legal and operational medical marijuana dispensaries, and pain clinic regulations.
We estimate large effects for the age groups highlighted by Case and Deaton (2015), and the age profile generally follows an inverse-U shape. At ages 65+, we observe no statistically significant effects at the 5% level, suggesting no spillovers to this population. Note that even for this age group, the estimate only reflects the effect of spillovers, not the direct effect of Part D. Our variation does not originate from individual-level variation in Part D eligibility but, instead, from cross-state variation in the proportion of other people eligible for Part D. A 65 year old in a high elderly share state experiences the same gain in Part D eligibility in 2006 as a 65 year old in a low elderly share state so the direct effects of access through Part D are similar.
The age pattern of the results is consistent with pain reliever misuse rates from the 2004 National Survey on Drug Use and Health (NSDUH), shown in Appendix Figure A.3. The additional access to opioids translates to different rates of overdoses by age, and this pattern reflects differences in self-reported rates of misuse. We observe very low rates of misuse for the 65+ population, consistent with the lack of mortality effects for this age group. Appendix Figure A.4 shows the estimates for each age graphically.
4.4. Opioid Abuse Treatment Admissions
Opioid mortality, while extremely important from a public health perspective, is also a relatively rare outcome. A more common outcome indicative of problematic use or abuse of opioids is treatment admissions. In Table 5, we present estimates for opioid-related substance abuse treatment admissions for ages 12–54. The outcome variable is the number of treatment admissions per 100,000. In Column (1), we use the full sample and estimate that a one percentage point increase in the percentage of the state population ages 65+ in 2003 leads to an additional 11.5 treatments per 100,000 people after Part D. As we add controls and account for policy adoption, the estimate remains relatively consistent in Columns (2) and (3). In Column (4), we permit the effects of the covariates to vary by year. The standard errors noticeably increase, but the point estimate remains about the same.
Table 5:
Opioid-Related Substance Abuse Treatments, Ages 12–54
| Outcome: | Opioid-Related Treatment Admissions Per 100,000 | |||||
|---|---|---|---|---|---|---|
| % Elderly2003 × Post | (1) | (2) | (3) | (4) | (5) | (6) |
| 11.540** (4.699) |
11.925*** (2.679) |
10.918*** (2.880) |
9.852** (4.825) |
9.849*** (3.375) |
8.571*** (3.098) |
|
| State time-varying controls × Year Fixed Effects | No | Yes | Yes | Yes | Yes | Yes |
| No | No | No | Yes | No | No | |
| Policy Variables | No | No | Yes | Yes | Yes | Yes |
| Sample | Full | Full | Full | Full | Balanced | Balanced |
| Population | All | All | All | All | All | No SSDI |
| Mean Outcome: | 86.69 | 86.69 | 86.69 | 86.69 | 87.91 | 82.13 |
| N | 587 | 587 | 587 | 587 | 516 | 516 |
Notes:
Significance 1%,
Significance 5%,
Significance 10%.
Standard errors in parentheses adjusted for clustering at state level. All regressions weighted by population. Controls included in all models but not shown: state fixed effects and year fixed effects. State time-varying controls include the unemployment rate, % white, 6 age group shares, % no college, and % some college (but no degree). When these covariates are interacted with year indicators, the age group shares are not included due to collinearity concerns (given the interaction term of interest). Instead, we also include the 2003 share ages 25–44 interacted with year indicators. Policy variables include whether the state has a PDMP, a medical marijuana law, legal and operational medical marijuana dispensaries, and pain clinic regulations. “Balanced” uses the sample of states reporting to TEDS in all years 2000–2011. The “No SSDI” population excludes individuals reporting labor force participation of “Retired/Disabled.”.
In Column (5), we select on states reporting in all years (i.e., the “balanced sample”) and find a similar result. The consistency of the estimates between Columns (3) and (5) should reduce concerns that our estimates are driven by changes in the states reporting information to TEDS over time. In Column (6), we further adjust the sample and exclude admissions which list that the person is “Retired/Disabled.” These selection criteria should exclude the SSDI population. The estimate is relatively unaffected (eliminating the SSDI population reduces the mean of the outcome variable -- the estimates are similar in proportional terms). In this more narrowly defined population, we estimate that a one percentage point increase in the elderly population (65+) is significantly associated with 8.6 additional substance abuse treatments per 100,000 people after 2006.
As with the mortality results, we include event study estimates in Figure 3. As before, we find little evidence of pre-existing trends, followed by a rise in treatment admissions. This rise is delayed relative to the fatal overdose effect discussed above. This postponed effect relative to the mortality effect could reflect that fatal overdoses rise immediately due to unsophisticated users initiating in response to a supply shock, leading to some immediate deaths. However, those not overdosing in the short-term may take time to develop dependence issues before seeking treatment.
In Table 6, we examine the relationship across different age groups and gender, using the available age groupings in the TEDS. We observe statistically significant effects throughout the age distribution. Here, we find less evidence of differences by gender. The age heterogeneity is generally consistent with the age trajectory estimated for mortality. For both men and women, the estimates are largest for the 21–29 age group and at least twice the size of the estimated aggregate effect for ages 12–54 (Column 3 in Table 5). The point estimates steadily decrease at older ages, again consistent with Figure A.3.
Table 6:
Opioid-Related Substance Abuse Treatments by Age Group
| Outcome: | Opioid-Related Treatment Admissions Per 100,000 | |||||
|---|---|---|---|---|---|---|
| Panel A: Men | ||||||
| Age Group | 12–20 | 21–29 | 30–39 | 40–49 | 50–54 | 55+ |
| % Elderly2003 × Post | 4.857* (2.718) |
23.827** (8.964) |
15.669*** (4.496) |
3.728** (1.577) |
2.157** (0.930) |
0.060 (0.339) |
| Mean Outcome: | 58.14 | 182.37 | 107.62 | 73.43 | 47.82 | 9.90 |
| Panel B: Women | ||||||
| Age Group | 12–20 | 21–29 | 30–39 | 40–49 | 50–54 | 55+ |
| % Elderly2003 × Post | 5.703*** (1.428) |
30.068*** (6.554) |
15.156*** (3.114) |
3.422** (1.302) |
1.610** (0.762) |
−0.094 (0.139) |
| Mean Outcome: | 36.13 | 143.68 | 95.89 | 58.32 | 29.20 | 4.69 |
| P-Value (Men=Women) | 0.716 | 0.588 | 0.696 | 0.696 | 0.458 | 0.616 |
Notes:
Significance 1%,
Significance 5%,
Significance 10%.
N=587 for all cells. Standard errors in parentheses adjusted for clustering at state level. All regressions weighted by population. Other controls included: state fixed effects, year fixed effects, the unemployment rate, % white, 6 age group shares, % no college, % some college, PDMPs, medical marijuana laws, legal and operational medical marijuana dispensaries, and pain clinic regulations.
Given our concern that reporting issues may obfuscate the useful information in the TEDS, we briefly summarize why we believe that the estimates in this section reflect true changes in substance abuse. First, our results are consistent when we select the sample on states that are supplying a less noisy measure of substance abuse treatments. Second, in Section 4.6.1 below, we replicate our analysis using measures of non-opioid treatments as the dependent variable. We never observe patterns similar to the trajectory observed for opioid treatment admissions. If reporting issues were the driving mechanism, then we would expect to observe similar effects on other types of treatments. While treatment admissions can also reflect treatment access, this evidence suggests that we are finding changes in demand for treatment.
4.5. Parameterizing the Relationship between Opioid Supply and Abuse
In this section, we parameterize the relationship between opioid supply and abuse. In the first column of Table 7, we use OLS to estimate the relationship between state morphine equivalent doses (MED) per capita and the state opioid mortality rate for ages 0–64. We find that each additional morphine equivalent dose per capita is associated with an increase in the number of deaths by 0.327 per 100,000 people ages 0–64.
Table 7:
Relationship Between Opioid Supply and Harms
| Outcome: | Deaths Per 100,000 | Admissions Per 100,000 | ||||
|---|---|---|---|---|---|---|
| MED Per Capita | (1) | (2) | (3) | (4) | (5) | (6) |
| 0.327*** (0.061) |
0.355*** (0.130) |
0.287** (0.113) |
6.567*** (2.183) |
11.359*** (3.181) |
6.921*** (2.130) |
|
| Ages | 0–64 | 0–64 | All | 12–54 | 12–54 | 12+ |
| Estimator | OLS | IV | IV | OLS | IV | IV |
| Mean Outcome (2006–2011) | 5.61 | 5.61 | 5.03 | 121.71 | 121.71 | 89.23 |
| N | 612 | 612 | 612 | 587 | 587 | 587 |
Notes:
Significance 1%,
Significance 5%,
Significance 10%.
Standard errors in parentheses adjusted for clustering at state level. All regressions weighted by population. Other controls included: state fixed effects, year fixed effects, log unemployment rate, % white, 6 age group shares, % no college, % some college, PDMPs, medical marijuana laws, legal and operational medical marijuana dispensaries, and pain clinic regulations. The excluded instrument is % Elderly2003 × Post. MED = morphine equivalent doses. The mean MED per capita in 2006–2011 was 12.4.
This relationship is potentially confounded by many unobserved factors and, as discussed in the introduction, the direction of the bias is unknown. To account for these possible confounders, we instrument opioid supply with our interaction term (). The IV estimate is similar to the OLS estimate. The similarity in these estimates does not imply the absence of confounding factors but does suggest that any confounding factors cancel each other out for mortality. In Column (3), we present the 2SLS estimate for the full population (including the elderly) and estimate a coefficient of 0.287, implying that an additional morphine equivalent dose per person in a state leads to an additional 0.287 overdoses per 100,000. This estimate is smaller than the Column (2) estimate given the low abuse response of the 65+ population to additional opioid access (as shown in Table 4), but the effect size is similar in proportional terms.
In the last three columns of Table 7, we present estimates for substance abuse treatment admissions. With OLS, we estimate that each morphine equivalent dose is associated with 6.6 additional treatment admissions per 100,000 people ages 12–54. When we estimate using 2SLS, the effect increases to 11.4.
In the final column, when we estimate the relationship for the population ages 12+, we find that each additional per capita morphine equivalent dose increases the substance abuse treatments by 6.9 treatments per 100,000 people. This effect is similar in proportional terms to the estimate for the 12–54 population. The Table 7 estimates imply that a 10% increase in opioid supply increases opioid-related mortality rates (for ages 0–64) by 7.1% and substance abuse treatment admission rates (for ages 12–54) by 9.6%.25
4.6. Robustness Tests
We test the sensitivity of our results to several factors. We previously addressed concerns about state age composition (Table 3, Column 5). Here, we consider other possible mechanisms, such as concurrent shocks in the demand for opioids, state insurance expansions during this time period, and confounding reporting trends.
4.6.1. Concurrent Supply-Side and Demand-Side Shocks
In this section, we study whether we observe similar results for other substances. If our opioid results are driven by some other concurrent confounding supply or demand shock affecting substance use more generally, then this shock should influence consumption of other substances. For example, if high elderly share states were disproportionately affected by the Great Recession and economic downturns are associated with increases in drug abuse, then we should observe relative rises in other drugs as well.
While our main motivation in this section is to test whether we observe similar changes in actual abuse of other drugs, these results also support the prior evidence that the rise in opioid-related treatment admissions is not an artifact of systematic changes in reporting. We find that the large and statistically significant rise in substance abuse treatment admissions is unique to opioids. Figure A.5 present event study estimates for alcohol, marijuana, heroin, and total admissions not involving opioids. There is some evidence of a differential decline in admissions in 2004, which may suggest systematic reporting changes. However, none of the other substances replicate the post-2006 jump in admissions followed by a steady increase over time. Instead, this pattern is unique to opioid-specific treatment admissions.
Figure A.6 presents event study estimates for fatal overdoses involving other substances. First, we study heroin overdoses. We do not find similar differential increases in heroin overdoses. In principle, a shock to prescription opioid availability could decrease substitution to heroin, but we observe little evidence of such substitution either. Next, we examine cocaine overdose rates and again find no evidence of differential increases beginning in 2006. We also examine all overdoses not involving prescription opioids. We exclude overdoses involving only unspecified drugs (T50.9) in this measure due to concerns that we may inadvertently include unspecified opioid overdoses in this measure. Again, we do not estimate a similar pattern of results. Instead, only opioid-related mortality (and treatment admissions) appear to differentially rise post-2006 and gradually increase over time, consistent with the differential gradual increase in Part D enrollment and opioid supply. In addition, we also study alcohol-related poisonings in Figure A.6.26 There is little relationship between changes in alcohol-related poisonings and state elderly share.
Finally, we analyze other deaths of despair studied in Case and Deaton (2017). These event study estimates are presented in Figure A.7. We study these outcomes to test for the possibility that elderly share is correlated with some systematic shock to “despair” (i.e., economic conditions, cultural institutions, etc.) beginning in 2006. First, we study suicides, excluding overdoses. Second, we study alcohol-related liver disease mortality. In both cases, we do not estimate similar relationships with elderly share. The results in this section generally suggest that high elderly share states were not differentially impacted by other factors beginning in 2006 which would independently increase substance use or other risky behaviors which may increase mortality.
4.6.2. Insurance Expansions and Pill Mill Crackdowns
We study a large prescription drug expansion and its differential effects at the state-level. During our time period, there were also large state-level health insurance expansions. In 2006, Massachusetts enacted a health care reform law which expanded health insurance to nearly the entire population. In 2008, Oregon expanded its Medicaid program. In the other direction, Tennessee disenrolled a large number of Medicaid enrollees in 2005. In addition, Florida had a unique rise in opioid abuse due to the prevalence of pill mills in the state before the 2011 crackdown.27 We test whether any specific state is driving our estimates. Figure A.8 provides mortality estimates while excluding one state at a time. While there is some variability in the estimates, they are rather consistent in magnitude and always statistically significant from zero at the 5% level. We find little evidence that any specific state is driving our results.
4.6.3. Buprenorphine Access
We interpret our estimates as reflecting the consequences of a shock to prescription opioid supply given that Part D only affected prescription drugs. One possible confounding shock is that buprenorphine, often used in medication-assisted treatment (MAT), is a prescribed drug. If this treatment was also diverted, then our results would reflect the net effect of a shock to prescription opioid supply and MAT. Given the low rate of misuse by the 65+ population, we expect that Part D had limited effects on buprenorphine supply. We test this assumption explicitly by replicating our event study specification for per capita buprenorphine grams. We present these results in Figure A.9. As expected, we observe little evidence of any relationship with elderly share over time.
4.7. Mechanisms
We interpret the relationships estimated in this paper as evidence of economically-meaningful levels of diversion, though we do not measure diversion directly. An alternative mechanism would be that Part D led to differential changes in physician prescribing patterns, generating similar increases in opioid prescribing to the under-65 population as was observed for the 65+ population. In principle, there is little support for this interpretation given that opioids were already heavily-prescribed before Part D. We would also likely expect most physician prescribing spillovers to disproportionately affect older age groups, but our age-specific results suggest stronger abuse responses at younger ages.
We test this possibility more explicitly using the geocoded MEPS (accessed at the AHRQ Data Facility). Following Stagnitti (2015) in classifying opioid prescriptions, we constructed the number of opioid prescription per person for ages 0–64 at the state level and estimated our main specification.28 The results are presented in Table 8. When we include all of our control variables, we estimate that a state with an additional percentage of elderly experienced a decline of 0.249 prescriptions among the 0–64 population after Part D. This estimate is not statistically different from zero. Because opioid prescriptions are relatively rare for younger age groups, we replicate this analysis for the 18–64 population and present the estimates in the last column. Again, we estimate a negative and statistically insignificant effect.
Table 8:
Geocoded MEPS Analysis
| Prescriptions for Under-65 Population | ||||
|---|---|---|---|---|
| Outcome: | Prescriptions Per Person | |||
| % Elderly2003 × Post | 0.410 (1.397) |
0.096 (1.602) |
−0.249 (1.651) |
−1.417 (2.129) |
| State time-varying controls | No | Yes | Yes | Yes |
| PDMP Laws | No | No | Yes | Yes |
| Ages | 0–64 | 0–64 | 0–64 | 18–64 |
| N | 609 | 609 | 609 | 609 |
Notes:
Significance 1%,
Significance 5%,
Significance 10%.
Standard errors in parentheses adjusted for clustering at state level. All regressions weighted by population. Not all states have data in each year so we have 609 observations, instead of 612. Controls also included but not shown: state fixed effects and year fixed effects.
These tests also support our prior evidence that SSDI is not confounding our main estimates. One alternative hypothesis is that elderly share predicts additional opioid prescriptions among the under-65 population after Part D through SSDI, resulting in more drug overdoses from direct medical access. However, we do not observe differential increases in prescriptions to the under-65 population in Table 8.
Overall, our analysis strongly suggests that the rise in abuse operates through nonmedical acquisition. We find large effects on opioid-related harms for the under-65 population without corresponding increases in prescriptions. Alternative mechanisms such as systematic price changes,29 SSDI enrollment, and physician-prescribing spillovers are inconsistent with the available evidence.
5. Discussion
5.1. Externalities
We find that overdoses increase among a population that does not directly gain medical access to these drugs. We can interpret the costs of misuse of these diverted opioids in the same manner as the costs of cigarette smoking, as studied in Gruber and Köszegi (2001), due to time-inconsistent preferences. Gruber and Köszegi (2001) refer to the “internalities” of smoking. Our estimates refer to the harms incurred by the population that is not directly prescribed the opioids so the “internalities” of additional medical access are experienced by an “external” population. Assuming that overdoses represent evidence of time-inconsistent preferences, this combination (time-inconsistent preferences plus an external population) could lead us to interpret these results as evidence of externalities resulting from increased medical opioid access. Recent work suggests that a calculation of internalities must also factor in the utility gains of using the addictive product (Levy et al., 2018; Cutler et al., 2015). This insight would also impact any externality calculation made using these estimates. We do not pursue this calculation here.
5.2. Tradeoffs
This paper examines the negative spillovers resulting from increased medical access to opioids. Understanding these harms is critical for designing policy to curb overdoses. It is also important to consider the benefits of expanded access to pain relievers, such as reductions in severe pain among the Medicare Part D population. Given the necessary reliance on coarse self-reported measures of pain, this exercise is difficult in our context and generally beyond the scope of the paper.30
As policymakers and medical professionals consider guidelines and regulations governing appropriate opioid prescribing, it is important to consider the benefits of opioids as an effective pain management tool. However, it is also critical for policy to internalize the spillovers to the rest of the population.
6. Conclusion
According to the CDC, 130 people die each day from an opioid overdose in the United States and at least half of those involve a prescription opioid.31 While many federal, state and community strategies have been offered to try to counteract the tide, empirical evidence for what caused the rise of the opioid crisis in the first place has been relatively rare. This paper is the first to evaluate the extent to which policy-driven expansions in medical access, specifically insurance that reduced the cost of prescription drugs to patients, may have contributed to the opioid epidemic. By exploiting geographic variation in the location of the elderly, who were the primary beneficiaries of Medicare Part D implementation, we are able to evaluate how expansion of prescription drug benefits (independent of expansions in access to medical care) might have influenced the dramatic rise in drug overdoses. Part D provides a rare opportunity to mimic dramatic national trends in medical opioid supply and observe the spillover effects while conditioning on time fixed effects.
Evidence from SAMHSA (2015) indicates that friends and relatives are the primary source of prescription opioid medication, and elderly with multiple concurrent prescriptions are an easy target for some individuals interested in diverting opioids into the black market. Our results are consistent with these stylized facts and provide evidence about its causal relationship with opioid-related overdoses. It is important to acknowledge that our findings are most relevant to the first wave of the opioid crisis. Given the wider availability of heroin and illicitly-manufactured fentanyl (Pardo et al., 2019), a large increase in the supply of prescription opioids could have very different effects today. It may increase initiation rates which, due to the existence of mature illicit opioid markets, leads to even larger increases in overdoses. Alternatively, additional access to prescription opioids for nonmedical use may substitute for more potent illicit opioids, minimizing the rise in overdoses.
We interpret our results as indirect but clear evidence of diversion from the medical market to the illegal nonmedical use market. Opioid distribution in the United States increased between 2000 and 2011 by 274% while opioid-related overdose mortality rates increased by 248% over the same time period. Extrapolating our results to the national context should be done with caution and we highlight that our estimates reflect the effects of increases in opioid access for the 65+ population, which may involve a higher diversion rate than similar changes to opioid supply for other populations. With this caveat, our Table 7 (Column 3) estimates imply that the increased access to opioids explains 74% of the rise through diversion. Our treatment admission results (Table 7, Column 6) imply that the national growth in opioid supply explains 75% of the national rise in opioid treatment admissions. Attributing these magnitudes to unintentional spillovers does not rule out the importance of more direct, complementary mechanisms. Opioid overprescribing may lead to high addiction rates which are then exacerbated by nonmedical opioid access through diversion. Our results imply that the diversion component is a critical driver of the opioid epidemic. It also suggests that opioid supply is an important driver of this crisis.
The implications of these findings is that, unless supply side mechanisms become more effective at reducing the opportunities for diversion of these prescription opioids from patients (by reducing overprescribing, enforcing PDMPs, educating physicians on inappropriate prescribing, and managing utilization), the opioid crisis will continue to worsen. While the opioid crisis has recently transitioned to heroin and illicit fentanyl, there is still great interest in understand the role of prescription opioids in the crisis, especially since prescription opioids remain a crucial component of the current rate of overdoses, involved in almost 15,000 overdoses per year. Optimal policy must account for the spillovers of improving medical care access to drugs that are easy to abuse and divert.
Acknowledgments
This paper was supported by grants from the National Institute on Drug Abuse to the RAND Corporation (R21DA041653; P50DA046351). We are grateful for helpful comments from Abby Alpert, Chris Ruhm, seminar participants at USC, the 2014 Conference of the American Society for Health Economists, the Southern California Conference in Applied Microeconomics, the Midwest Health Economics Conference, the Annual Conference on Taxation, and the NBER Summer Institute. We received especially valuable suggestions from discussants Thomas Buchmueller, Vilsa Curto, Marisa Domino, and Mireille Jacobson.
APPENDIX
Appendix A: Additional Details for TEDS Data
The TEDS data contain the majority of all publicly funded substance abuse treatment admissions that occur within the United States, as all facilities that receive any government funding (federal block grant funding, state treatment dollars, or even insurance dollars from Medicaid, Medicare, or Tricare) are required to provide basic information. Private facilities that only treat non-publicly insured individuals and that receive no federal or state grant monies are the only facilities that are supposed to be excluded. However, states differ in the scope of facilities covered due to differences in agencies responsible for licensing, certification and accreditation, and disbursement of public funds for treatment. Moreover, the scope of admissions captured by those facilities that do report to TEDS also varies across states, as some states only report admissions for clients that were treated with public funds while others report all admissions from within the facility (SAMHSA, 2013). In the main text, we provide several reasons why these differences across states should not affect our results.
The unit of observation in the TEDS is an admission, and information is retained on the primary, secondary, and tertiary substances reported at the time of the admission, as well as client demographics, expected source of payment, treatment setting, and treatment characteristics. We include two substance categories in our metric of opioid abuse: “non-prescription methadone” and “other opiates and synthetics.” The latter category includes “buprenorphine, codeine, hydrocodone, hydromorphone, meperidine, morphine, opium, oxycodone, pentazocine, propoxyphene, tramadol, and any other drug with morphine-like effects.” We include all admissions in which one of these drugs is included as primary, secondary, or tertiary substances. Our results do not change meaningfully if we only count primary substance or if we exclude non-prescription methadone.
Appendix B: Did Part D increase opioid prescriptions among the 65+ population?
Several papers compare changes in prescription drug utilization for the 65+ population after the implementation of Medicare Part D to utilization changes for individuals under 65. This approach isolates the effect of Part D from other secular trends in drug utilization. The literature consistently finds that Part D increased overall prescription drug utilization, but there is no research focusing specifically on opioid prescriptions. A necessary condition for our empirical strategy is that Medicare Part D increased opioid prescriptions for the 65+ population.
We use the Medical Expenditure Panel Survey (MEPS) to study changes in the number of opioid prescription for ages 66–71 relative to ages 59–64. We exclude age 65 in this analysis since those individuals are partially-treated. We follow Stagnitti (2015) by defining opioid prescriptions as those with therapeutic subclasses “narcotic analgesics” and “narcotic analgesic combinations.” We use the 2002–2009 data files and consider each claim as a prescription, which is standard in this literature (see Alpert, 2016). The MEPS surveys households for two consecutive years so we account for the panel structure by adjusting standard errors for clustering. We estimate the following specification:
| (2) |
where yiat represents the number of opioid prescriptions filled by individual i at age a in year t. The specification includes age and year fixed effects. The parameter of interest is the coefficient on the interaction of the implementation of Part D and an indicator for ages 65+.
We present the main estimates in Column 1 of Table A.1. The estimate implies that individuals ages 65+ increased the number of annual prescriptions by 0.174 more prescriptions than individuals ages 59–64. This estimate is statistically significant at the 5% level. While the literature often uses large data sets of pharmacy claims, we are able to statistically reject that there was no effect even with our relatively small sample.
We replicate this analysis in Column 2 but exclude ages 63 and 64. Alpert (2016) provides evidence of important anticipation effects with respect to Medicare Part D. Excluding these ages should reduce concerns that the control group is also “treated” by Part D because they defer some treatments until they are eligible for Medicare. We find similar estimates when we exclude 63–64 year olds. Alpert (2016) shows that the anticipation effects occurred in 2004–2005 since Part D was announced at the end of 2003, providing individuals the opportunity to alter prescription drug utilization given the intertemporal price changes. In Column 3, we exclude 2004 and 2005 from the analysis and estimate a similar effect. In Column 4, we exclude 2004–2004 and ages 63–64. Again, we observe similar effects.
We have also estimated the above models using Poisson regression to estimate proportional effects. The evidence (not shown) is consistent with the estimates presented in Table A.1, which is not surprising given that the pre-Part D utilization rates between these two groups are relatively similar.
In Panel B of Table A.1, we present corresponding estimates of the effect of Part D on the price of opioids. Part D decreased out-of-pocket prices for the 65+ population, driving the increased utilization. We estimate
| (3) |
where pidat is the out-of-pocket price of National Drug Code (NDC) d purchased by individual i of age a in year t. We control for interactions based on NDC-age and NDC-year. Each observation is an opioid prescription purchased in the sample for ages 59–71 (excluding 65). We adjust our standard errors using two-way clustering (Cameron et al., 2011) by individual and by NDC.
The estimates are consistent whether we account for anticipation effects. Our main estimate (Column 1 in Panel B) implies that individuals ages 65+ experienced a 48% reduction in out-of-pocket payments relative to the 59–64 population after the implementation of Part D.
Thus, we find evidence that Part D decreased the price of opioids for the Medicare-eligible population and that this price decrease led to an increase in the number of prescriptions. In Section 4.2, we study whether this individual-level increase in opioid access can be observed at a more aggregate level by studying whether elderly share predicts increases in state opioid supply. We find that higher elderly share states experienced relative increases in opioid supply after Part D implementation.
Overall, using multiple data sets and empirical strategies, the evidence strongly suggests that the supply of opioids increased faster in high elderly share states after Medicare Part D.
References (included in Appendix but not in main paper):
Cameron, A. Colin, Jonah B. Gelbach, and Douglas L. Miller, “Robust Inference With Multiway Clustering,” Journal of Business & Economic Statistics, 29 (2011), 238–249.
Substance Abuse and Mental Health Services Administration (SAMHSA) Center for Behavioral Health Statistics and Quality, “Treatment Episode Data Set (TEDS): 2001–2011. State Admissions to Substance Abuse Treatment Services,” (Rockville, MD: Substance Abuse and Mental Health Services Administration, 2013).
Appendix Figures and Tables
Figures
Figure A.1:

Elderly Share in 2003
Figure A.2:
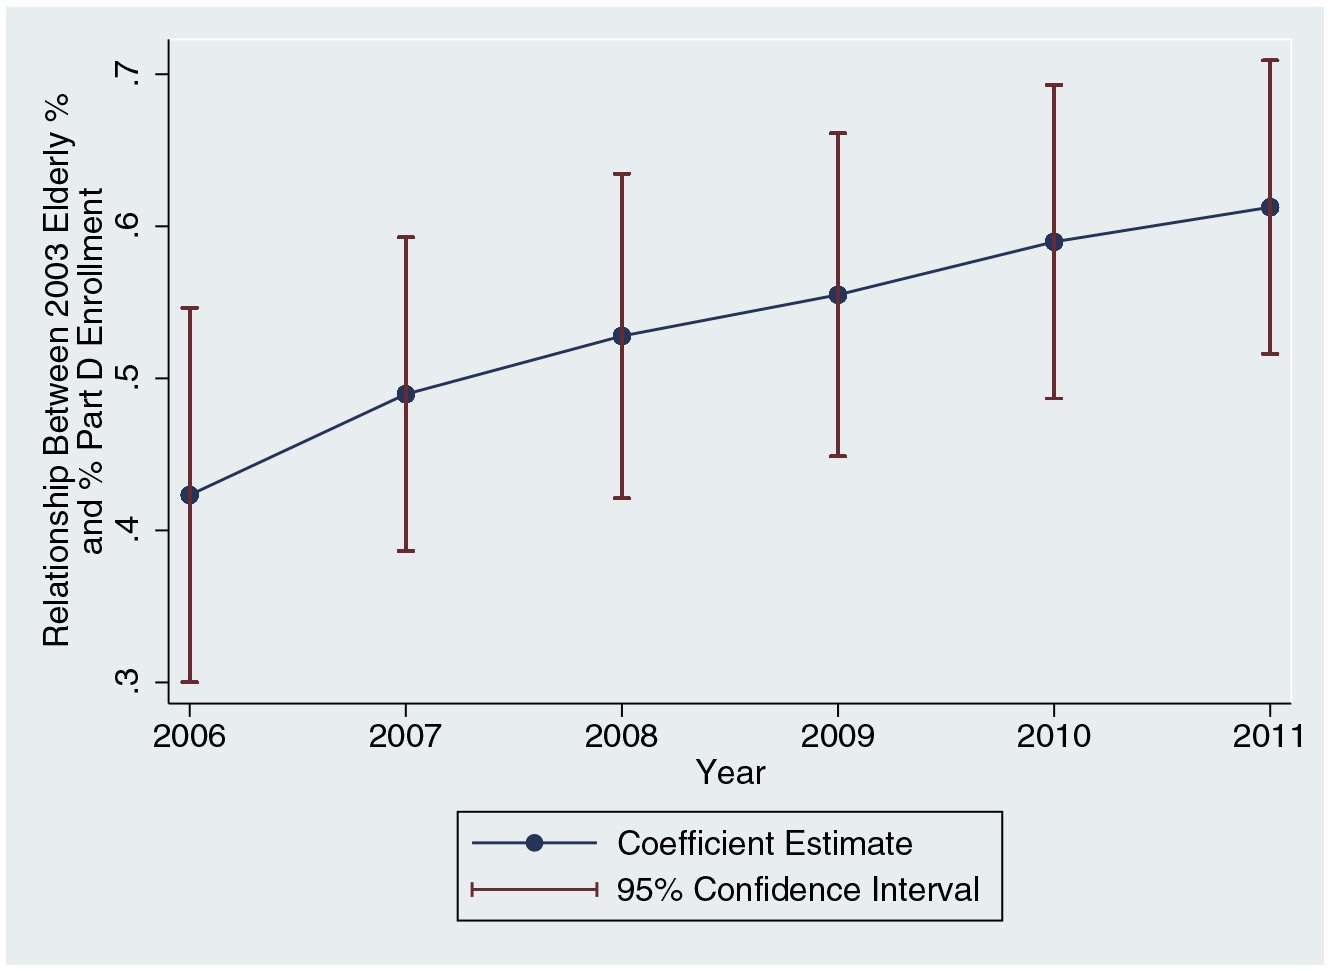
Relationship between % Elderly in 2003 and % Enrolled in Part D
Notes: We regress the percentage of the population enrolled in Part D on the percentage of the 2003 population ages 65+. We perform this cross-sectional regression by year.
Figure A.3:
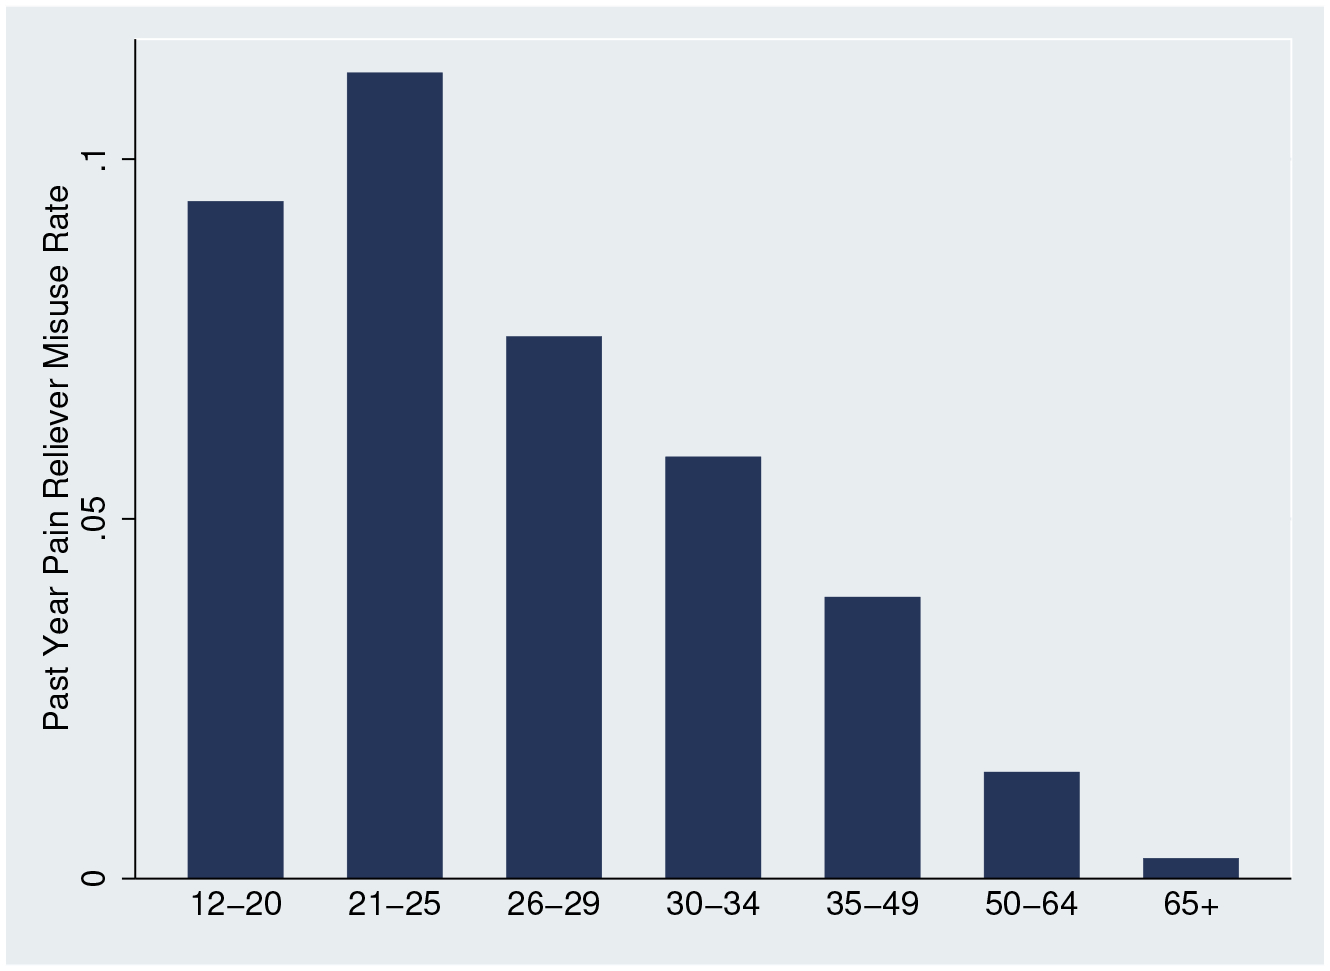
Pain Reliever Misuse Rate in 2004 by Age Group
Source: 2004 National Survey on Drug Use and Health
Figure A.4:

Relationship between % Elderly in 2003 and Mortality Rate by Age
Notes: We estimate equation (1) for each age between ages 1 and 85. The models include all covariates, including the policy variables. Confidence intervals are adjusted for within-state clustering.
Figure A.5:
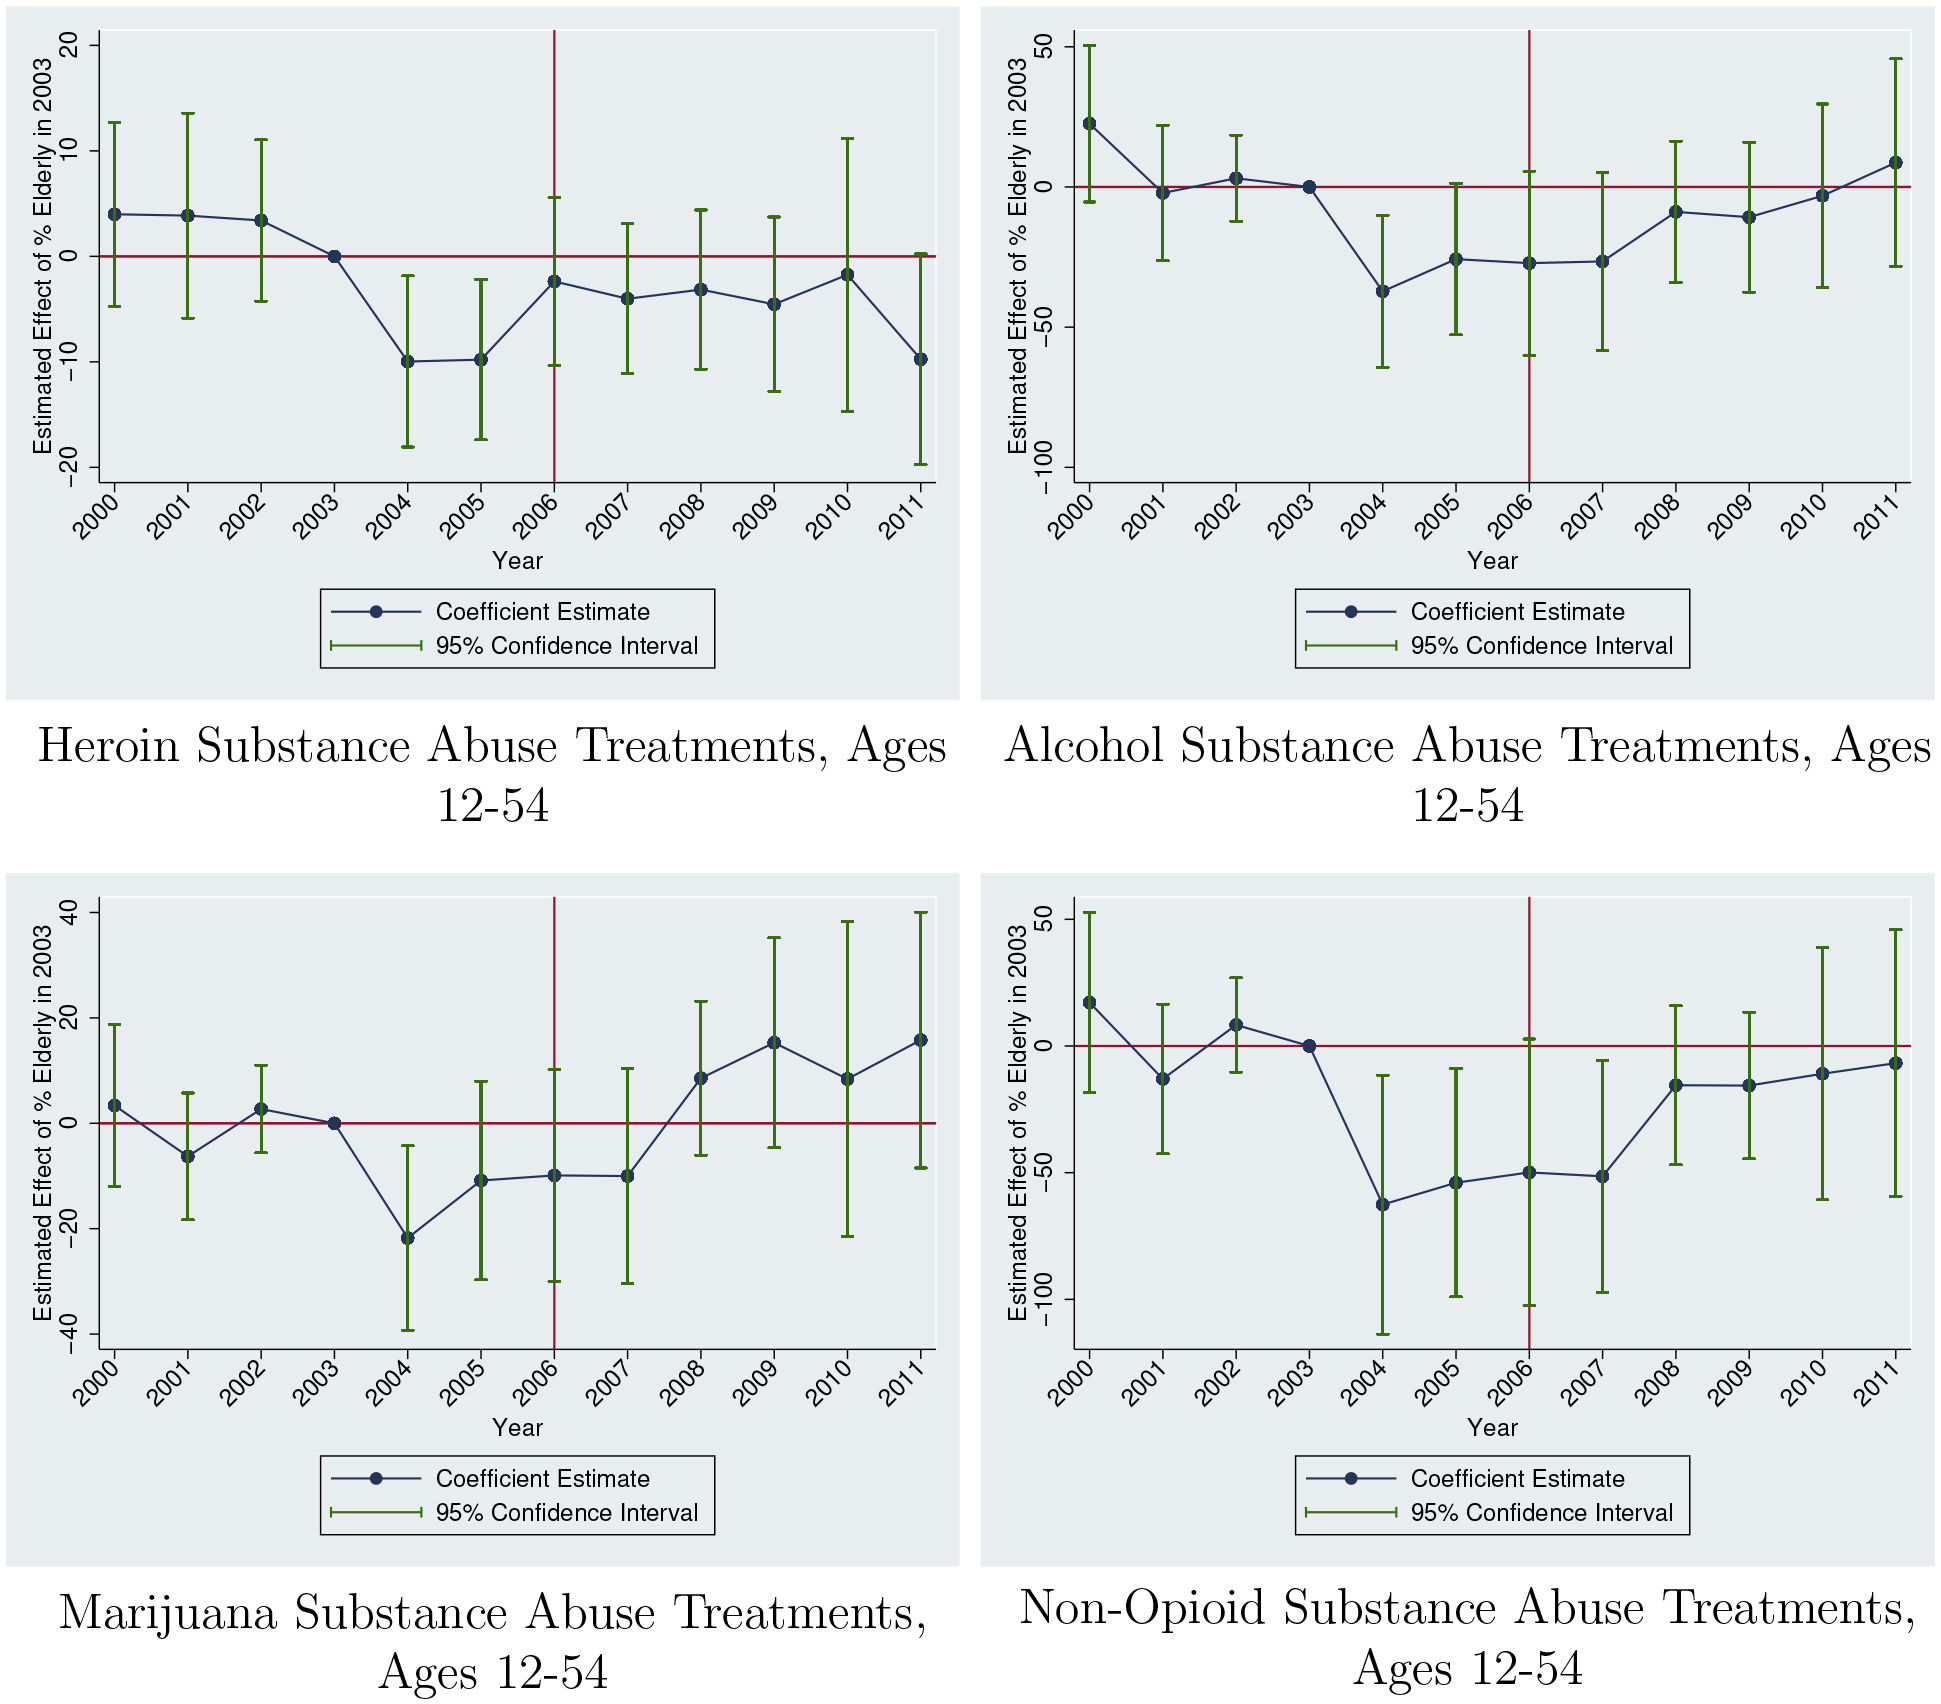
Placebo Event Studies using TEDS
Sources: Treatment Episode Data Set (2000–2011)
Notes: Outcomes are defined as per 100,000 people. Each estimate refers to the effect of 2003 Elderly Share in that year. All specifications include controls for time and state fixed effects. We also include all controls used in Table 3, Column 4. Regressions are population-weighted. Estimates are normalized to 0 in 2003. 95% confidence intervals adjusted for clustering at the state level.
Figure A.6:

Event Studies for Overdoses not involving Prescription Opioids and Alcohol Poisoning Deaths
Sources: National Vital Statistics System
Notes: Mortality is defined as per 100,000 people. Each estimate refers to the effect of 2003 Elderly Share in that year. All specifications include controls for time and state fixed effects. We also include all controls used in Table 3, Column 4. Regressions are population-weighted. Estimates are normalized to 0 in 2003. Non-opioid overdoses exclude overdoses involving opioids and unspecified drugs. 95% confidence intervals adjusted for clustering at the state level.
Figure A.7:

Event Studies for Other Deaths of Despair
Sources: National Vital Statistics System
Notes: Mortality is defined as per 100,000 people. Each estimate refers to the effect of 2003 Elderly Share in that year. All specifications include controls for time and state fixed effects. We also include all controls used in Table 3, Column 4. Regressions are population-weighted. Estimates are normalized to 0 in 2003. 95% confidence intervals adjusted for clustering at the state level.
Figure A.8:
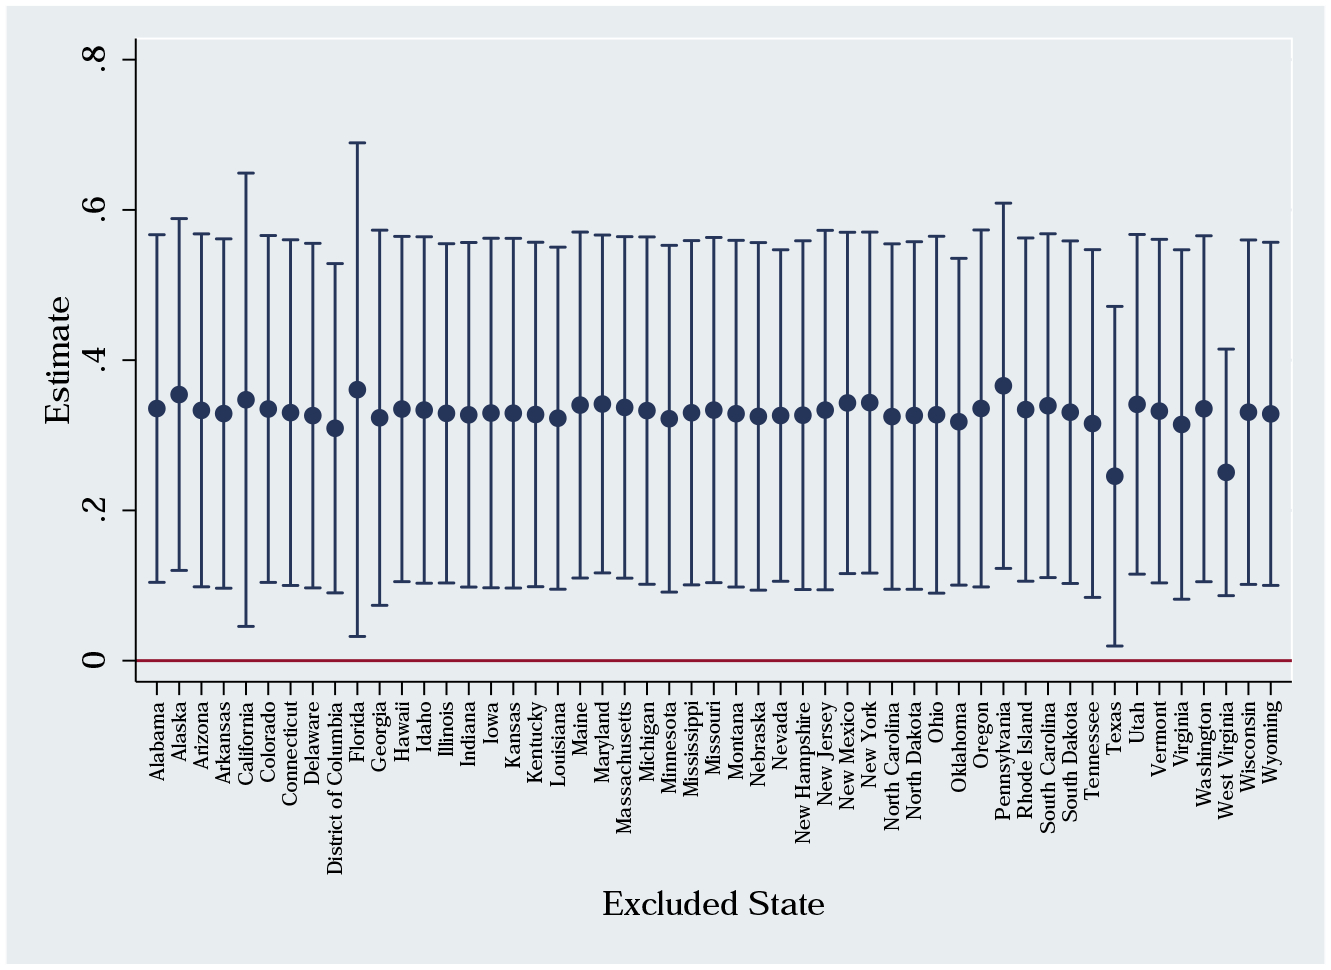
Mortality Estimates When Excluding One State
Notes: We replicate our main mortality result while excluding one state at a time. Each estimate above is marked by the state that is excluded. 95% confidence intervals adjusted for clustering at the state level.
Figure A.9:
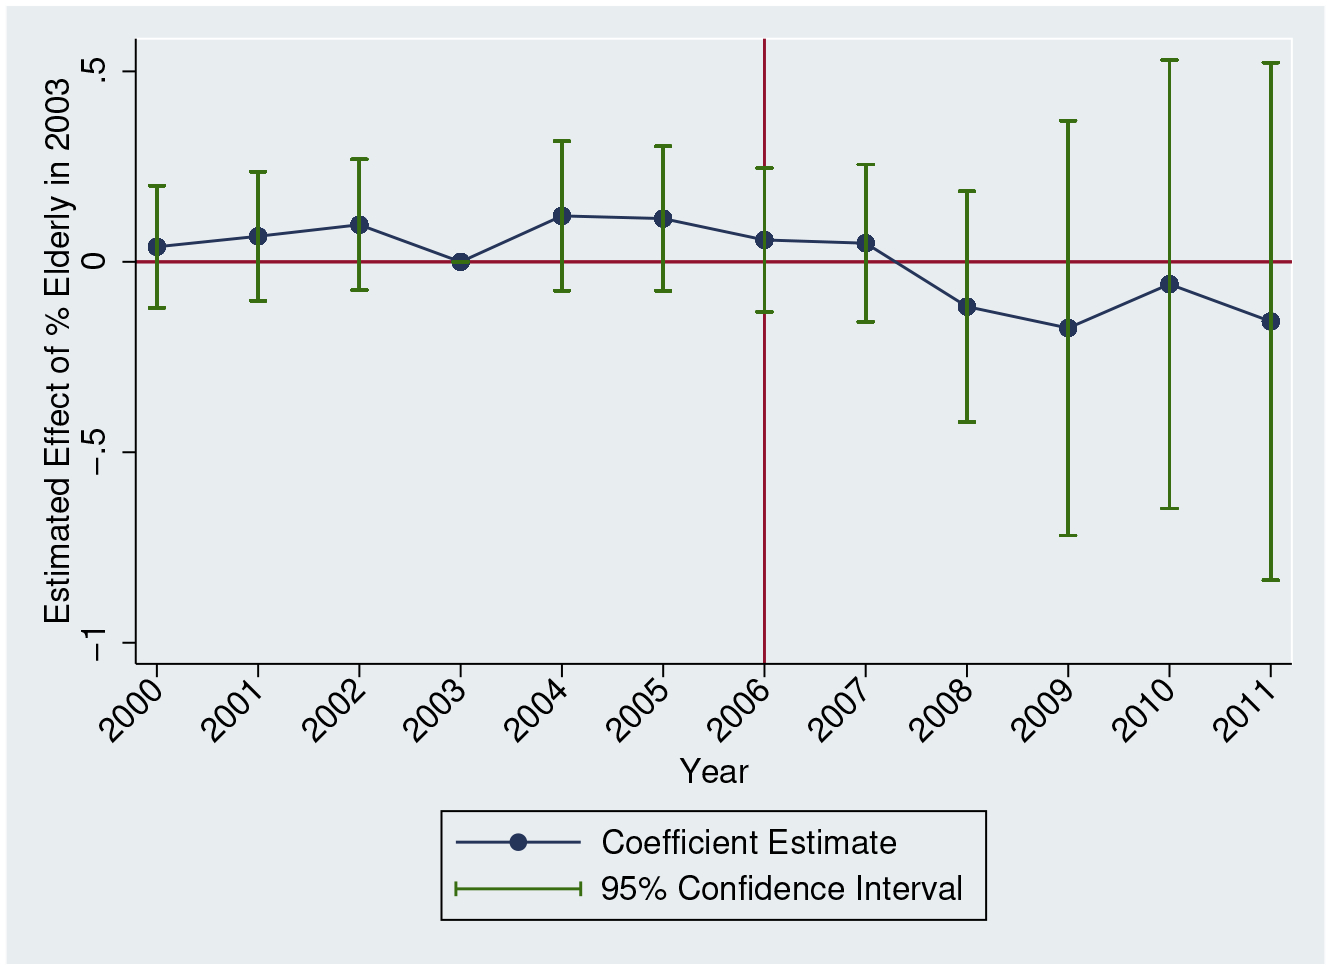
Event Study Estimates for Buprenorphine Distribution
Sources: ARCOS
Notes: The outcome is buprenorphine grams per capita. Each estimate refers to the effect of 2003 Elderly Share in that year. All specifications include controls for time and state fixed effects. We also include all controls used in Table 3, Column 4. Regressions are population-weighted. Estimates are normalized to 0 in 2003. 95% confidence intervals adjusted for clustering at the state level.
Tables
Table A.1:
State Policies: First Full Active Year (up to 2011)
| State | PDMP | MML | Active and Legal Dispensaries | Pain Clinic Regulations |
|---|---|---|---|---|
| Alabama | 2005 | |||
| Alaska | 2009 | 2000 | ||
| Arizona | 2008 | 2011 | ||
| Arkansas | ||||
| California | 1997 | 1997 | 2004 | |
| Colorado | 2006 | 2001 | 2011 | |
| Connecticut | 2007 | |||
| Delaware | 2011 | |||
| District Of Columbia | 2011 | |||
| Florida | 2010 | 2011 | ||
| Georgia | ||||
| Hawaii | 1997 | 2001 | ||
| Idaho | 2001 | |||
| Illinois | 2001 | |||
| Indiana | 1994 | |||
| Iowa | 2007 | |||
| Kansas | 2009 | |||
| Kentucky | 1999 | |||
| Louisiana | 2007 | 2006 | ||
| Maine | 2004 | 2000 | ||
| Maryland | 2004 | |||
| Massachusetts | 1992 | |||
| Michigan | 2002 | 2009 | ||
| Minnesota | 2008 | |||
| Mississippi | 2007 | |||
| Missouri | ||||
| Montana | 2005 | |||
| Nebraska | ||||
| Nevada | 1996 | 2002 | ||
| New Hampshire | ||||
| New Jersey | 2011 | 2011 | ||
| New Mexico | 2005 | 2008 | 2010 | |
| New York | 1998 | |||
| North Carolina | 2006 | |||
| North Dakota | 2008 | |||
| Ohio | 2006 | |||
| Oklahoma | 1991 | |||
| Oregon | 2010 | 1999 | ||
| Pennsylvania | 2002 | |||
| Rhode Island | 1997 | 2006 | ||
| South Carolina | 2007 | |||
| South Dakota | 2011 | |||
| Tennessee | 2003 | |||
| Texas | 1998 | 2010 | ||
| Utah | 1996 | |||
| Vermont | 2007 | 2005 | ||
| Virginia | 2004 | |||
| Washington | 2008 | 1999 | ||
| West Virginia | 1996 | |||
| Wisconsin | 2011 | |||
| Wyoming | 2004 |
We list the first full year that the state has an active law. If a state adopted a law in January, then we count that year as the first full year. If a state enacted a policy after 2011 (the end of our sample period) or never adopted the policy, then we do not list an adoption date.
Table A.2:
Did Part D Increase Opioid Prescriptions Among the 65+ Population?
| Panel A: Opioid Prescriptions | ||||
|---|---|---|---|---|
| (Age ≥ 65) x (Year ≥ 2006) | (1) | (2) | (3) | (4) |
| 0.174** (0.089) |
0.191** (0.096) |
0.181* (0.094) |
0.177* (0.099) |
|
| Age Fixed Effects | Yes | Yes | Yes | Yes |
| Year Fixed Effects | Yes | Yes | Yes | Yes |
| Years (2002–2009) | All | All | No 2004–2005 | No 2004–2005 |
| Ages (59–71) | All | No 63–64 | All | No 63–64 |
| N | 23,190 | 19,205 | 17,754 | 14,694 |
| Panel B: ln(Price) | ||||
| (Age ≥ 65) x (Year ≥ 2006) | (1) | (2) | (3) | (4) |
| −0.476*** (0.121) |
−0.459*** (0.114) |
−0.491*** (0.142) |
−0.488*** (0.142) |
|
| NDC x Year Fixed Effects | Yes | Yes | Yes | Yes |
| NDC x Age Fixed Effects | Yes | Yes | Yes | Yes |
| Years (2002–2009) | All | All | No 2004–2005 | No 2004–2005 |
| Ages (59–71) | All | No 63–64 | All | No 63–64 |
| N | 11,995 | 9,978 | 9,230 | 7,697 |
Notes:
Significance 1%,
Significance 5%,
Significance 10%.
In Panel A, each observation is an individual-year and standard errors in parentheses are adjusted for clustering at individual level. In Panel B, each observation is a prescription and standard errors are adjusted for two-way clustering at individual- and NDC-level. Age 65 excluded in all regressions.
Footnotes
Publisher's Disclaimer: This is a PDF file of an unedited manuscript that has been accepted for publication. As a service to our customers we are providing this early version of the manuscript. The manuscript will undergo copyediting, typesetting, and review of the resulting proof before it is published in its final form. Please note that during the production process errors may be discovered which could affect the content, and all legal disclaimers that apply to the journal pertain.
For example, the Florida “pill mills” likely causally increased the state supply of opioids by attracting individuals intending to acquire opioids for nonmedical use to purchase more opioids.
Greco et al. (2014) provides evidence that undertreatment of pain through opioid therapy is frequent for patients with cancer. Chaparro et al. (2014) finds systematic evidence in the literature of the efficacy of short-term opioid therapy.
Authors’ calculations using the Medical Expenditure Panel Survey (MEPS).
A morphine equivalent dose is equal to 60 morphine milligram equivalent (MME) units. Opioids vary in strength so conversion factors are applied to convert a milligram of each type of opioid into morphine equivalent units.
Schnell (2018) studies how physicians respond to the existence of secondary markets.
The 2016 Annual Report of the Boards of Trustees of the Federal Hospital Insurance and Federal Supplementary Medicare Insurance Trust Funds: https://www.cms.gov/Research-Statistics-Data-and-Systems/Statistics-Trends-and-Reports/ReportsTrustFunds/downloads/tr2016.pdf (accessed August 27, 2016)
One exception is Alpert et al. (2015) which shows that Part D increased direct-to-consumer drug advertising (DTCA). The rise in DTCA increased prescription drug utilization in several chronic drug classes among the population ages 40–60.
One possible exception is access to buphrenorphine. Buphrenorphine prescribing during our time period was relatively uncommon. We will show that there was no systematic change in buprenorphine prescribing.
The three sub-state geographies across the data sets are county, 3-digit zip code, and CBSA. One data set does not include any sub-state identifiers.
We doubt that states represent appropriate boundaries to define markets for diverted prescription opioids but defining our markets too broadly (i.e., aggregating together multiple markets) should not be problematic as long as there is still adequate variation to detect reasonably-sized effects. Our standard errors will reflect whether there is adequate variation.
Our results are not meaningfully changed if we limit this metric to the seven most commonly-misused opioids.
See Piper et al. (2018) and https://www.cms.gov/Medicare/Prescription-Drug-Coverage/PrescriptionDrugCovContra/Downloads/Opioid-Morphine-EQ-Conversion-Factors-March-2015.pdf (last accessed October 5, 2019)
Tramadol was not a controlled substance during this time period and, thus, is not reported in ARCOS.
This coding does not include tramadol during our time period, which is widely-prescribed to older individuals. However, in terms of potency, tramadol is relatively weak. According to the CMS conversion factors, a milligram of oxycodone is 15 times more powerful than a milligram of tramadol.
The first “must access” PDMP was adopted after our sample period.
We use PDAPS coding as of December 2017.
If a state adopted a policy in January, we consider that year as the first “full year.”
We do not use a time-varying elderly share measure in the interaction term because there may be migration correlated with opioid abuse. For example, opioid abuse may be related to local economic downturns (Hollingsworth et al., 2017). If declining economic conditions cause younger people to disproportionately migrate out of the state (i.e., increasing the percentage of the population 65+), then this source of variation is problematic in principle. In practice, the results are similar if we use a time-varying measure of state elderly share.
Individuals who have received Social Security Disability Insurance benefits for 24 consecutive months receive Medicare benefits, but many also receive benefits from Medicaid; these beneficiaries are called “dual eligible.” Prior to Medicare Part D, these dual eligible generally received prescription drug benefits through their state Medicaid program.
It is estimated to have a negative (though small and statistically insignificant from zero) effect.
We interact the unemployment rate and demographic characteristics with year indicators with the exception of the age share variables. Since our variable of interest is 2003 elderly share interacted with the Post dummy, including age share variables interacted with time dummies creates collinearity issues. Instead, we also include the 2003 25–44 age share interacted with time dummies. We selected this age group because it includes the population most vulnerable to the opioid crisis.
In a recent working paper, Soni (2018) adopts a similar approach as the one that we use in this section to provide a more comprehensive analysis. She estimates an elasticity of −0.89, which is reasonably close to our estimate here.
In 2014, there were over 1000 federal burglary reports of controlled substances according to https://www.deadiversion.usdoj.gov/21cfr_reports/theft/maps/DTL_Burglary_By_State_CY2014.pdf (last accessed November 13, 2017).
We estimate this p-value through a clustered bootstrap.
To calculate these estimates, we use the mean value in 2006–2011 for each outcome as the baseline. The mean for per capita morphine equivalent doses during this time period is 12.4.
Because code F10.0 was discontinued in 2007 and thereafter coded as an external cause, it is necessary to include F10.0 and F10.1 in our measure of alcohol poisoning deaths.
It is not clear that we would want to exclude the Florida pill mills given that it has been suggested that Part D aided the creation of the pill mills in Florida (since it is a high elderly share state) and the state’s rise in abuse (e.g., Meinhofer, 2016).
When this same model is estimated for the 65+ population, we find no evidence of any spillover effects for this population.
While not shown, we also find no evidence of differential price changes. In principle, the increased demand for opioids could have increased opioid prices more in high elderly share areas. This result would work against the effects that we are finding. However, given that we do not find utilization differences among the non-elderly, it is not surprising that we do not find price differences either.
Using self-reported pain measures in the Health and Retirement Study (HRS) and the same empirical strategy used in Section A.1, we find no evidence of reductions in pain resulting from Medicare Part D (in fact, we estimate rather precise zero effects).
https://www.drugabuse.gov/drugs-abuse/opioids/opioid-overdose-crisis (last accessed on March 21, 2019)
References
- Alpert Abby, “The Anticipatory Effects of Medicare Part D on Drug Utilization,” Journal of Health Economics, 49 (2016), 28–45. [DOI] [PMC free article] [PubMed] [Google Scholar]
- Alpert Abby, Lakdawalla Darius, and Sood Neeraj, “Prescription Drug Advertising and Drug Utilization: The Role of Medicare Part D. NBER Working Paper 21714,” (2015). [DOI] [PMC free article] [PubMed]
- Alpert Abby, Powell David, and Pacula Rosalie Liccardo. “Supply-Side Drug Policy in the Presence of Substitutes: Evidence from the Introduction of Abuse-Deterrent Opioids.” American Economic Journal: Economic Policy (2018). [DOI] [PMC free article] [PubMed] [Google Scholar]
- Barnett Michael L., Olenski Andrew R., and Jena Anupam B.. “Opioid-prescribing patterns of emergency physicians and risk of long-term use.” New England Journal of Medicine 376, no. 7 (2017): 663–673. [DOI] [PMC free article] [PubMed] [Google Scholar]
- Becker Gary S., Grossman Michael, and Murphy Kevin M., “Rational Addiction and the Effect of Price on Consumption,” The American Economic Review, 81 (1991), 237–241. [Google Scholar]
- Bohnert Amy S., Valenstein Marcia, Bair Matthew J., Ganoczy Dara, McCarthy John F., Ilgen Mark A., and Blow Frederic C., “Association Between Opioid Prescribing Patterns and Opioid Overdose-Related Deaths,” JAMA, 305 (2011), 1315–1321. [DOI] [PubMed] [Google Scholar]
- Buchmueller Thomas C., and Carey Colleen. “The effect of prescription drug monitoring programs on opioid utilization in Medicare.” American Economic Journal: Economic Policy 10, no. 1 (2018): 77–112. [Google Scholar]
- Carpenter Christopher, and Dobkin Carlos, “The Effect of Alcohol Consumption on Mortality: Regression Discontinuity Evidence from The Minimum Drinking Age,” American Economic Journal: Applied Economics, 1 (2009), 164–182. [DOI] [PMC free article] [PubMed] [Google Scholar]
- Case Anne, and Deaton Angus, “Rising Morbidity and Mortality in Midlife Among White Non-Hispanic Americans in the 21st Century,” Proceedings of the National Academy of Sciences of the United States of America, 112 (2015), 15078–15083. [DOI] [PMC free article] [PubMed] [Google Scholar]
- Case Anne, and Deaton Angus, 2017. Mortality and morbidity in the 21st century. Brookings Papers on Economic Activity, p. 397. [DOI] [PMC free article] [PubMed] [Google Scholar]
- Centers for Disease Control and Prevention, “CDC Grand Rounds: Prescription Drug Overdoses – a U.S. Epidemic. MMWR 61(01): 10–13,” (Atlanta, GA: Centers for Disease Control and Prevention, 2012). [PubMed] [Google Scholar]
- Chaloupka Frank J., “Rational Addictive Behaviour and Cigarette Smoking,” Journal of Political Economy, 99 (1991), 722–742. [Google Scholar]
- Chaparro Luis Enrique, Furlan Andrea D., Deshpande Amol, Angela Mailis-Gagnon Steven Atlas, and Turk Dennis C.. “Opioids compared with placebo or other treatments for chronic low back pain: an update of the Cochrane Review.” Spine 39 7 (2014): 556–563. [DOI] [PubMed] [Google Scholar]
- Compton WM, Jones CM and Baldwin GT, 2016. Relationship between nonmedical prescription-opioid use and heroin use. New England Journal of Medicine, 374(2), pp. 154–163. [DOI] [PMC free article] [PubMed] [Google Scholar]
- Cutler David M., Jessup Amber, Kenkel Donald, and Starr Martha A.. “Valuing regulations affecting addictive or habitual goods.” Journal of Benefit-Cost Analysis 6, no. 2 (2015): 247–280. [Google Scholar]
- Dart Richard C., Surratt Hilary L., Cicero Theodore J., Parrino Mark W., Severtson S. Geoff, Bucher-Bartelson Becki, and Green Jody L., “Trends in Opioid Analgesic Abuse and Mortality in the United States,” New England Journal of Medicine, 372 (2015), 241–248. [DOI] [PubMed] [Google Scholar]
- Dobkin Carlos, and Nicosia Nancy, “The War on Drugs: Methamphetamine, Public Health, and Crime,” American Economic Review, 99 (2009), 324–349. [DOI] [PMC free article] [PubMed] [Google Scholar]
- Dowell Deborah, Haegerich Tamara M., and Chou Roger, “CDC Guideline for Prescribing Opioids for Chronic Pain--United States, 2016,” JAMA, 315 (2016), 1624–1645. [DOI] [PMC free article] [PubMed] [Google Scholar]
- Duggan Mark, and Morton Fiona S., “The Effect of Medicare Part D on Pharmaceutical Prices and Utilization,” American Economic Review, 100 (2010), 590–607. [DOI] [PubMed] [Google Scholar]
- Duggan Mark, and Morton Fiona S., “The Medium-Term Impact of Medicare Part D on Pharmaceutical Prices,” American Economic Review, 101 (2011), 387–392. [DOI] [PubMed] [Google Scholar]
- Dunn Abe, and Shapiro Adam Hale. “Does Medicare Part D Save Lives?” American Journal of Health Economics 5, no. 1 (2019): 126–164. [Google Scholar]
- Galenianos Manolis, Pacula Rosalie L., and Persico Nicola, “A Search-Theoretic Model of the Retail Market for Illicit Drugs,” Review of Economic Studies, 79 (2012), 1239–1269. [Google Scholar]
- Greco Maria Teresa, Roberto Anne, Corli Oscar, Deandrea Silvia, Bandieri Elena, Cavuto Silvio, and Apolone Giovanni. “Quality of cancer pain management: an update of a systematic review of undertreatment of patients with cancer.” Journal of Clinical Oncology 32 36 (2014): 4149–4154. [DOI] [PubMed] [Google Scholar]
- Grossman Michael, and Chaloupka Frank J., “The Demand for Cocaine by Young Adults: A Rational Addiction Approach,” Journal of Health Economics, 17 (1998), 427–474. [DOI] [PubMed] [Google Scholar]
- Gruber Jonathan, and Botond Köszegi. “Is Addiction” Rational”? Theory and Evidence.” The Quarterly Journal of Economics 116, no. 4 (2001): 1261–1303. [Google Scholar]
- Hollingsworth Alex, Ruhm Christopher J., and Simon Kosali. “Macroeconomic conditions and opioid abuse.” Journal of Health Economics 56 (2017): 222–233. [DOI] [PubMed] [Google Scholar]
- International Narcotics Control Board. Report of the International Narcotics Control Board on the availability of internationally controlled drugs: ensuring adequate access for medical and scientific purposes. United Nations: (2011). [Google Scholar]
- Jacobson Mireille, “Baby Booms and Drug Busts: Trends in Youth Drug Use in the United States, 1975–2000,” Quarterly Journal of Economics, 119 (2004), 1481–1512. [Google Scholar]
- Jaeger David A., Joyce Theodore J., and Kaestner Robert. “A Cautionary Tale of Evaluating Identifying Assumptions: Did Reality TV Really Cause a Decline in Teenage Childbearing?” Journal of Business & Economic Statistics (2018): 1–10. [Google Scholar]
- Jena Anupam B., Goldman Dana, Weaver Lesley, and Karaca-Mandic Pinar, “Opioid Prescribing by Multiple Providers in Medicare: Retrospective Observational Study of Insurance Claims,” BMJ, 348 (2014), g1393. [DOI] [PMC free article] [PubMed] [Google Scholar]
- Ketcham Jonathan D., and Simon Kosali I., “Medicare Part D’s Effects on Elderly Patients’ Drug Costs and Utilization,” The American Journal of Managed Care, 14 (2008), SP14–22. [PubMed] [Google Scholar]
- Khan Nazleen F., Bateman Brian T., Landon Joan E., and Gagne Joshua J.. “Association of Opioid Overdose With Opioid Prescriptions to Family Members.” JAMA Internal Medicine (2019). [DOI] [PMC free article] [PubMed] [Google Scholar]
- Levy Helen G., Norton Edward C., and Smith Jeffrey A.. “Tobacco regulation and cost-benefit analysis: How should we value foregone consumer surplus?” American Journal of Health Economics 4, no. 1 (2018): 1–25. [DOI] [PMC free article] [PubMed] [Google Scholar]
- Maclean Johanna Catherine, and Saloner Brendan. “The effect of public insurance expansions on substance use disorder treatment: evidence from the Affordable Care Act.” Journal of Policy Analysis and Management 38, no. 2 (2019): 366–393. [PMC free article] [PubMed] [Google Scholar]
- Maclean Johanna Catherine, and Saloner Brendan. “Substance use treatment provider behavior and healthcare reform: Evidence from Massachusetts.” Health Economics 27, no. 1 (2018): 76–101. [DOI] [PubMed] [Google Scholar]
- Manning WG, Keeler EB, Newhouse JP, Sloss EM, and Wasserman J, “The taxes of sin. Do smokers and drinkers pay their way?,” JAMA, 261 (1989), 1604–1609. [DOI] [PubMed] [Google Scholar]
- Manning Willard G., Newhouse Joseph P., Duan Naihua, Keeler Emmett, Benjamin Bernadette, Leibowitz Arleen, Marquis M. Susan, and Zwanziger Jack, “Health Insurance and the Demand for Medical Care: Evidence from a Randomized Experiment. RAND Report R-3476-HHS,” (Santa Monica, CA: RAND Corporation, 1988). [Google Scholar]
- McWilliams J. Michael, Zaslavsky Alan M., and Huskamp Haiden A., “Implementation of Medicare Part D and Nondrug Medical Spending for Elderly Adults with Limited Prior Drug Coverage,” JAMA, 306 (2011), 402–409. [DOI] [PubMed] [Google Scholar]
- Meinhofer Angélica. “The War on Drugs: Estimating the Effect of Prescription Drug Supply-Side Interventions.” Working Paper (2016). [Google Scholar]
- Pardo Bryce, Caulkins Jonathan P., Kilmer Beau, Pacula Rosalie Liccardo, Reuter Peter, and Stein Bradley D.. “The Synthetic Opioid Surge in the United States.” (2019).
- Paulozzi Leonard J., Jones Christopher M., Mack Karin A., and Rudd Rose A., “Vital Signs: Overdoses of Prescription Opioid Pain Relievers – United States, 1999–2008,” Morbidity and Mortality Weekly Report, 60 (2011), 1487–1492. [PubMed] [Google Scholar]
- Paulozzi Leonard J., Mack Karin A., and Hockberry Jason M., “Vital Signs: Variation Among States in Prescribing of Opioid Pain Relievers and Benzodiazepines – United States, 2012,” Morbidity and Mortality Weekly Report, 63 (2014), 563–568. [PMC free article] [PubMed] [Google Scholar]
- Paulozzi Leonard J., and Ryan George W., “Opioid Analgesics and Rates of Fatal Drug Poisoning in the United States,” American Journal of Preventive Medicine, 31 (2006), 506–511. [DOI] [PubMed] [Google Scholar]
- Piper Brian J., Shah Dipam T., Simoyan Olapeju M., McCall Kenneth L., and Nichols Stephanie D.. “Trends in medical use of opioids in the US, 2006–2016.” American Journal of Preventive Medicine 54, no. 5 (2018): 652–660. [DOI] [PubMed] [Google Scholar]
- Powell David, Pacula Rosalie Liccardo, and Jacobson Mireille. “Do medical marijuana laws reduce addictions and deaths related to pain killers?” Journal of Heath Economics, 58 (2018), 29–42. [DOI] [PMC free article] [PubMed] [Google Scholar]
- Ruhm Chris J., 2019. “Deaths of Despair or Drug Problems?” Journal of Health Economics, 64 (2019), 25–42. [DOI] [PubMed] [Google Scholar]
- Safran Dana G., Neuman Patricia, Schoen Cathy, Kitchman Michelle S., Wilson Ira B., Cooper Barbara, Li Angela, Chang Hong, and Rogers William H., “Prescription Drug Coverage and Seniors: Findings from a 2003 National Survey,” Health Affairs, Suppl Web Exclusives (2005), W5-152–W155-166. [DOI] [PubMed] [Google Scholar]
- Schnell Molly. “Physician Behavior in the Presence of a Secondary Market: The Case of Prescriptions Opioids.” Working paper (2018) found here: https://scholar.princeton.edu/schnell/files/schnell_jmp.pdf (last accessed August 26, 2018)
- Scholl L, Seth P, Kariisa M, Wilson N and Baldwin G, 2019. Drug and opioid-involved overdose deaths—United States, 2013–2017. Morbidity and Mortality Weekly Report, 67(5152), p. 1419. [DOI] [PMC free article] [PubMed] [Google Scholar]
- Soni Aparna. “Health Insurance, Price Changes, and the Demand for Pain Relief Drugs: Evidence from Medicare Part D.” Price Changes, and the Demand for Pain Relief Drugs: Evidence from Medicare Part D (September 25, 2018) (2018). [Google Scholar]
- Stagnitti Marie N., “Trends in Prescribed Outpatient Opioid Use and Expenses in the U.S. Civilian Noninstitutionalized Population, 2002–2012. Statistical Brief #478.” (Rockville, MD: Agency for Healthcare Research and Quality, 2015). [PubMed] [Google Scholar]
- Substance Abuse and Mental Health Services Administration (SAMHSA) Center for Behavioral Health Statistics and Quality, “2014 National Survey on Drug Use and Health: Detailed Tables,” (Rockville, MD: Substance Abuse and Mental Health Services Administration, 2015). [Google Scholar]
- Swensen Isaac D. “Substance-abuse treatment and mortality.” Journal of Public Economics 122 (2015): 13–30. [Google Scholar]
- Volkow Nora D., McLellan Thomas A., Cotto Jessica H., Karithanom Meena, and Weiss Susan R. B., “Characteristics of Opioid Prescriptions in 2009,” JAMA, 305 (2011), 1299–1301. [DOI] [PMC free article] [PubMed] [Google Scholar]
- Williams Jenny, Pacula Rosalie Liccardo, and Smart Rosanna. De Facto or De Jure? Ethnic Differences in Quit Responses to Legal Protections of Medical Marijuana Dispensaries. No. w25555. National Bureau of Economic Research, 2019. [Google Scholar]
- Zhang Yuling, Donohue Julie M., Lave Judith R., O’Donnell Gerald, and Newhouse Joseph P., “The Effect of Medicare Part D on Drug and Medical Spending,” New England Journal of Medicine, 361 (2009), 52–61. [DOI] [PMC free article] [PubMed] [Google Scholar]
- Zhou Chao, Florence Curtis S., and Dowell Deborah. “Payments For Opioids Shifted Substantially To Public And Private Insurers While Consumer Spending Declined, 1999–2012.” Health Affairs 35 5 (2016): 824–831. [DOI] [PMC free article] [PubMed] [Google Scholar]