

Summary
22q11.2 deletion syndrome (22q11.2DS) is characterized by a heterogeneous phenotype, including alterations in phospho‐calcium metabolism and immunodeficiency. We analyzed vitamin D status and the immune assessment, focusing on T cell subpopulations and dendritic cells (DCs) in a cohort of 17 pediatric 22q11.2DS patients and 17 age‐matched healthy subjects. As antigen‐presenting cells, DCs are the main target of vitamin D, promoting a tolerogenic T cell response. Patients were subdivided into three groups according to the parameters of phospho‐calcium metabolism and serum levels of 25OHD: normal values, vitamin D deficiency and hypoparathyroidism. Different degrees of T cell deficiency, ranging from normal to partial T cell numbers, were observed in the cohort of patients. The group with vitamin D deficiency showed a significant reduction of naive T cells and a significant increase of central memory T cells compared to controls. In this group the number of circulating DCs was significantly reduced. DC decrease affected both myeloid and plasmacytoid DC subsets (mDCs and pDCs), with the most relevant reduction involving pDCs. A direct correlation between 25OHD levels and recent thymic emigrant (RTE) and DC number was identified. Despite the limited cohort analyzed, our results show that deficiency of the pDC subset in patients with 22q11.2DS may be included among the causative factors of the progressive increase of risk of autoimmune diseases in these patients. As most patients suffer from increased susceptibility to infections and heightened prevalence of autoimmune disorders, we suggest a potential role of vitamin D supplementation in preventing autoimmune or proinflammatory diseases in 22q11.2DS.
Keywords: 22q11.2DS, dendritic cells, immunodeficiency, vitamin D
This study analyzes vitamin D status and the immune assessment in patients with 22q11.2 deletion syndrome (22q11.2DS), with the main focus on dendritic cells (DCs). Patients with vitamin D deficiency show a significant reduction of DCs number, with the most relevant decrease observed in plasmacytoid DCs (pDCs). As most patients suffer from increased susceptibility to infections and heightened prevalence of autoimmune disorders, we suggest that the pDC defect could be contributing to the progressive risk of autoimmune diseases in patients with 22q11.2DS. A potential role of vitamin D supplementation in preventing autoimmune or pro‐inflammatory diseases in these patients is discussed.
Introduction
Chromosome 22q11.2 deletion syndrome (22q11.2DS), also known as DiGeorge syndrome (DGS), is a congenital disorder due to a hemizygous microdeletion on the q arm of chromosome 22, in 11.2. Approximately 90% of patients have a common‐sized ~3 million base pair (Mb) deletion, but smaller deletions have also been reported. The deletion, irrespective of deletion size, induces a developmental defect in the third pharyngeal pouch and fourth pharyngeal arch that affects the parathyroid glands, thymus, heart, face and palate. Furthermore, this syndrome is characterized by an extremely heterogeneous phenotype with variable expression of different features, with cardiac anomalies and palate/velopharyngeal insufficiency or dysfunction being the most prominent features [1, 2, 3, 4, 5, 6, 7].
The deleted region harbors several genes, some of which have a very wide spectrum of expression. TBX1 is a gene that has been shown to be crucial for thymic development, resulting in thymic hypoplasia [8, 9, 10]. In childhood, immunodeficiency, secondary to thymic hypoplasia, is one of the more relevant features of this syndrome (~75% of patients) [7]. Recently, it has been demonstrated that a perturbed distribution of thymocytes and an altered cortical/medullary thymic organization, entailing a variable degree of thymic tissue immaturity, contributes to abnormalities in central and peripheral immunity, providing novel insights into thymic defects associated with 22q11.2DS [11]. The syndrome is associated with different degrees of T cell deficiency, ranging from normal/partial T cell numbers and function to a complete absence of T lymphocytes [with a severe combined immunodeficiency‐like (SCID) appearance] [11]. T cell lymphopenia and decrease of thymic output with low naive T cells and recent thymic emigrant (RTE) T cells have been widely reported, but humoral defects (hypogammaglobulinemia, impaired response to vaccination and dysfunctional maturation of B cells) have also been described [12, 13, 14, 15]. T cell defects are more apparent in early infancy, when the number of T cells reflects the thymic output [16].
Clinical consequences of the immunodeficiency mainly include recurrent infections, such as prolonged viral infections and frequent superinfections of the upper and lower respiratory tracts, the incidence of which contributes anomalies of the anatomical deviations and functional impairment of the pharynx and ear [2]. While the increased susceptibility to infections subsides during early childhood [17], autoimmune diseases, mainly thrombocytopenia, thyroiditis and idiopathic juvenile arthritis [12, 18, 19], tend to appear with increasing age due to a homeostatic expansion of self‐reactive T cells and a reduced production of regulatory T cells (Treg) [2].
Hypoparathyroidism associated with hypocalcemia is found in a significant percentage of infants with 22q11.2DS (~50% of patients). It may be transient, resolving during the first year of life or, as recently suggested, continuing into adulthood [12, 20]. Among the different mechanisms by which hypoparathyroidism contributes to hypocalcemia, there is inadequate renal conversion of 25‐hydroxyvitamin D to 1,25‐dihydroxyvitamin D (calcitriol), the active metabolite of vitamin D, which is necessary for intestinal absorption of calcium [21]. Therefore, these patients require treatment with calcium carbonate and calcitriol to correct hypocalcemia [20, 22, 23].
Vitamin D [1,25(OH)2D3] is a hormone with a central role in calcium‐phosphate homeostasis through the regulation of bone turnover and circulating levels of calcium and phosphate. Moreover, it has several extra‐skeletal actions, which have been extensively studied, playing a crucial role in the regulation of a wide spectrum of functions, including the immune response [24]. As various immune cells express the vitamin D receptor (VDR), vitamin D can influence both the innate and the adaptive response [25]. Several studies have demonstrated that it acts as an immunomodulator with multiple mechanisms: on the different T cell subtypes by modulating activation, differentiation and cytokine secretion, and on B cells by suppressing differentiation and immunoglobulin secretion [24, 26]. As antigen‐presenting cells (APCs), dendritic cells (DCs) are a crucial target of vitamin D because modulation of their levels of co‐stimulatory molecules and of inhibitory receptors finely orchestrate the immune response and the balance between pro‐ and anti‐inflammatory states [27, 28]. Based on this, vitamin D deficiency is thought to be related to immune dysregulation and to a more proinflammatory state. Although its causal relationship has not been clearly proved, it has been associated with an increased risk and greater severity of infections, particularly of the respiratory tract, and autoimmune diseases [25, 29].
The effects of vitamin D deficiency and supplementation on patients suffering from immune dysregulation disorders have been investigated [24, 30, 31]. However, data on the levels of vitamin D and its potential immune effects in primary immunodeficiencies have been scarcely investigated.
Therefore, given the frequency of infections and autoimmune diseases in patients with primary immunodeficiencies and the role of vitamin D in the immune response, this study aimed to analyze the relationship between vitamin D status and immune assessment, focusing on T cell subpopulations and DCs in patients with 22q11.2DS. This pathological condition appears to be of interest (the presence of an immunodeficiency and/or altered calcium‐phosphate metabolism) for this purpose. In particular, this work has investigated for the first time, to our knowledge, the DCs which represent the most important family of professional APCs, able to efficiently prime naive T cells, a process that leads to two distinct outcomes: generation of a protective immune response or induction of tolerance [32].
Materials and methods
Patient selection
In total, 17 patients with 22q11.2 DS diagnosis were included (seven males and 10 females), aged 2–18 years. Patients aged > 18 years were excluded from the study. Chromosome 22q11.2 deletion was detected by multicolor fluorescent in‐situ hybridization (FISH) or comparative genomic hybridization (CGH) array, as previously described [33]. None of the patients had acute infections at the time of sample collection.
25‐hydroxyvitamin D (25OHD) levels were determined during the spring season; vitamin D was considered deficient for values of 25OHD < 20 ng/ml, according to the Institute of Medicine (IOM), the American Academy of Pediatrics (AAP) and the European Society for Paediatric Gastroenterology, Hepatology and Nutrition (ESPGHAN) recommendations [34, 35, 36].
The demographic data and clinical and endocrine features of the patients are summarized in Table 1.
Table 1.
Clinical and laboratory features of 22q11.2DS patients
| Case | Gender/age (years) | 25OHD (ng/ml) | Phospho‐calcium metabolism | WBC (×103/μl) | Lymphocytes (×103/μl) | Morbidity | Autoimmunity |
|---|---|---|---|---|---|---|---|
| 1 | F/7·8 | 34·5 | 5·03 | 1·38 | RRI | ||
| 2 | M/13·5 | 34·2 | 6·3 | 1·92 | Alopecia | ||
| 3 | M/17 | 34·5 | Neonatal hypocalcemia | 4·51 | 1·82 | Severe RLRI + thyroid tumor | |
| 4 | F/8 | 30·3 | 7·53 | 2·90 | RRI | ||
| 5 | F/2 | 35·3 | Neonatal hypocalcemia | 10·11 | 2·75 | RRI | |
| 6 | M/10 | 30·6 | 9·0 | 3·91 | RRI | Thyroiditis | |
| 7 | M/8 | 13·6 | 6·91 | 2·19 | RRI | ||
| 8 | M/5 | 11·9 | 7·75 | 3·04 | RRI | ||
| 9 | M/7 | 11·6 | 8·30 | 2·61 | |||
| 10 | F/9 | 19·5 | 7·35 | 3·26 | RRI | Thyroiditis | |
| 11 | F/4 | 18·6 | 4·18 | 1·29 | Psoriasis | ||
| 12 | F/15 | 15·7 | 8·97 | 3·45 | Thrombocytopenia | ||
| 13 | F/18 | 10·2* | Hypoparathyroidism | 10·9 | 1·75 | ||
| 14 | F/18 | 15·1* | Hypoparathyroidism | 4·81 | 1·12 | Thyroiditis + thrombocytopenia | |
| 15 | M/5 | 22·8* | Neonatal hypocalcemia + hypoparathyroidism | 12·0 | 1·10 | Thyroiditis | |
| 16 | F/13·5 | 23·5* | Hypoparathyroidism | 6·0 | 1·11 | ||
| 17 | F/17 | 21·1* | Hypoparathyroidism | 9·88 | 2·48 | Thyroiditis |
RRI = recurrent respiratory infections; RLRI = recurrent lower respiratory infections; M = male; F = female; WBC = white blood cells; 22q11.2DS = 22q11.2 deletion syndrome; 25OHD = 25‐hydroxyvitamin D.
25OHD values at diagnosis. Horizontal lines represent division into groups (as described in Material and methods).
Patients were distributed into three groups according to 25OHD levels: group A (25OHD ≥ 20 ng/ml; n = 6), group B (vitamin D deficiency: 25OHD < 20 ng/ml; n = 6) and group C (hypoparathyroidism; n = 5). At enrollment, patients with hypoparathyroidism had been receiving treatment with calcium carbonate (50–100 mg/kg/day) and calcitriol (20–40 ng/kg/day) for at least 2 years.
The diagnosis of complete athymia was made based on the absence of T cells with a naive phenotype (< 50/mm3). It is characterized by a T‐negative SCID‐like appearance [8] and identifies the complete form of 22q11.2DS; it was identified in one patient, included in group A (no. 3).
Two patients (no. 7 and no. 11 of Table 1) who received vitamin D supplementation (cholecalciferol 25 000 UI/month) during this study were analyzed separately.
Seventeen sex‐ and age‐matched children (nine males and eight females, aged 1·8–21 years), whose blood samples were collected during routine examinations, were recruited as healthy controls (HC). They did not present clinical signs of infections during the preceding 4 weeks or abnormal laboratory parameters indicative of inflammation, history of immunodeficiency, cancer, inflammatory or autoimmune diseases. Demographic and laboratory features of healthy subjects are summarized in Table 2.
Table 2.
Demographic and laboratory features of controls
| Case | Gender/age (years) | 25OHD (ng/ml) | WBC (×103/μl) | Lymphocytes (×103/μl) |
|---|---|---|---|---|
| 1 | F/1·8 | 45·0 | 12·30 | 8·43 |
| 2 | M/2 | 31·8 | 8·47 | 3·37 |
| 3 | F/2·2 | 28·9 | 9·55 | 5·14 |
| 4 | M/3·4 | 35·0 | 8·80 | 2·24 |
| 5 | M/4·5 | 34·5 | 11·54 | 3·92 |
| 6 | M/5 | 41·0 | 10·07 | 4·53 |
| 7 | F/6 | 30·0 | 13·20 | 1·82 |
| 8 | F/7 | 32·5 | 6·59 | 2·24 |
| 9 | M/7·5 | 33·6 | 7·29 | 2·66 |
| 10 | F/9·5 | 41·6 | 4·85 | 3·44 |
| 11 | F/11 | 29·0 | 6·71 | 2·53 |
| 12 | M/12 | 36·5 | 5·89 | 2·25 |
| 13 | M/14 | 31·0 | 6·75 | 2·11 |
| 14 | M/16·5 | 35·5 | 4·58 | 2·18 |
| 15 | F/17 | 38·0 | 6·32 | 2·12 |
| 16 | F/18 | 29·5 | 5·88 | 2·20 |
| 17 | M/21 | 30·4 | 9·80 | 2·81 |
M = male; F = female; WBC = white blood cells; 25OHD = 25‐hydroxyvitamin D.
Ethics approval
This study was approved by the Pediatric Committee of the Tuscany Region, Anna Meyer Hospital, Firenze, Italy.
Flow cytometry
Eight‐color flow immunophenotyping of T and B lymphocytes was performed on fresh peripheral whole blood anti‐coagulated with ethylenediamine tetracetic acid (EDTA), according to standard protocols. Peripheral blood was stained with surface antibodies against CD3, CD4, CD8, CD19 and CD16/56. CD3+CD4+ (helper) and CD3+CD8+ (cytotoxic) lymphocytes were also analyzed for expression of CD45RA, CD62L and CD31 to identify naive (CD45RA+CD62L+), central memory (CD45RA−CD62L+), effector memory (CD45RA−CD62L−), terminal effector cells (CD45RA+CD62L−) and RTE (CD45RA+CD62L+CD31+) [37]. Circulating Treg cells were identified as a CD4+CD25+/++CD127low/− cell population, as described previously [38]. The expression of CD45RA was evaluated to estimate the amount of naive Treg cells. All antibodies were purchased from BD Biosciences (San Jose, CA, USA).
Circulating dendritic cells were enumerated and phenotypically characterized directly into the two major subsets, myeloid (mDCs) and plasmacytoid (pDCs), in whole blood [38]. Because of the lack of a specific marker to detect DCs, we used a mixture of monoclonal antibodies specifically established to identify DCs, purchased from Immunotech (Beckman Coulter Inc., Brea, CA, USA). Cells were stained with the following antibodies: CD14+CD16, CD85k, CD33 or CD123 for the mDC and pDC subsets, respectively. Dendritic cells were identified as CD14low/−CD16low/−CD85k+ and CD33+ or CD123+. The DC gating strategy chosen in our experimental approach allowed us to analyze the expression level of the CD85k antigen on these cells. This antigen, known also as immunoglobulin‐like transcript 3 (ILT3), is a transmembrane protein selectively expressed by APCs, including DCs, monocytes and macrophages, and is involved in antigen processing [39]. Estimates of absolute numbers of DCs were calculated by multiplying the percentage of DCs in the mononuclear cell (MNC) gate by the absolute peripheral blood MNC count determined using a standard hemocytometer (Abbott Laboratories, Abbott Park, IL, USA).
Data acquisition and analysis were performed on a dual laser BD FACSCanto (Becton Dickinson Immunocytometry Systems, San Jose, CA, USA) using the FACSDiva software (San Jose, CA, USA).
Statistical analysis
Continuous data were described by median and interquartile range (IQR).
To compare the group as a dichotomous variable (control category; experimental category), the Mann–Whitney test (two‐tailed) was applied, while to compare the group when the experimental category was divided into subgroups (25OHD ≥ 20 ng/ml, 25OHD < 20 ng/ml and hyparathyroidism) with the quantitative variables, the Kruskal–Wallis test was used followed by multiple comparisons (by the Bonferroni method).
The relationship between 25OHD levels and either T cell subsets or DC numbers was examined using Spearman’s correlation test analysis; all graphics show the regression line (black line) and 95% confidence interval (CI) (dotted line). From the correlation test analysis, patients with hypoparathyroidism were excluded, as at the time of enrollment they were receiving vitamin D treatment. Significance was fixed at 0·05. All analyses were carried out by spss version 25 and GraphPad Prism technologies.
Results
Patients with 22q11.2DS and age‐matched controls were recruited. A comparative genomic hybridization (CGH) array revealed the presence of the classic of ~3 Mb in all patients.
The immunological assessment was evaluated both in the overall cohort of patients and the three subgroups identified according to 25OHD levels: group A (normal values), group B (25OHD deficiency) and group C (patients with hypoparathyroidism). Parameters of phospho‐calcium metabolism [parathormone (PTH), calcium, phosphate, alkaline phosphatase] of both A and B groups were in the normal age range; in these groups, analyses were limited to patients who did not receive vitamin D supplementation, to avoid the influence of previous treatment on immune parameters. At the time of diagnosis, patients of group C had hypocalcemia (median = 5·57 mg/dl, IQR = 4·5–6·6 mg/dl), elevated serum phosphorous concentration (median = 8·6 mg/dl, IQR = 7·9–8·8 mg/dl), lowered 25OHD level (median = 21·1 ng/ml, IQR = 12·7–23·2 ng/ml) and overt defective concentration of the parathyroid hormone (median = 7·2 pg/ml, IQR = 3·7–8·8 pg/ml). At enrollment, they were receiving treatment with calcium carbonate (50–100 mg/kg/day) and calcitriol (20–40 ng/kg/day) for at least 2 years.
Eight of 17 patients (47%) had an autoimmune disease (alopecia, thyroiditis, psoriasis and thrombocytopenia). In patients with hypoparathyroidism the frequency of autoimmunity (60%) was higher than that observed in the groups with normal 25OHD levels (33·3%) and vitamin D deficiency (50%). Recurrent infections were observed in 47% of the overall patient population, the highest number (83·3%) being in the group with normal levels of 25OHD displayed.
Low naive T cells in patients with vitamin D deficiency and hypoparathyroidism
The patients’ immunological values were compared with age‐matched controls. Table 3a and 3b show the levels of total white blood cells (WBC), lymphocytes and their subpopulations in the control group, in the total cohort of patients and in the three groups identified according to 25OHD status. Analysis of the immune data showed that they did not depend on gender and age variables (P = 0·620 and P = 0·420). The absolute numbers of lymphocytes in the overall cohort did not differ from the controls (P = 0·0688); a significant reduction only in group C was observed (P = 0·023). As expected, the overall patient group showed a significant reduction of T lymphocytes (P < 0·0001), involving both CD4+ and CD8+ subsets, compared to age‐matched healthy controls (P = 0·0335 and P = 0·0004). In addition, the naive CD4+ and CD8+ T cells were significantly reduced in patients compared to controls (P = 0·0118 and P = 0·0105), as shown in Table 3a. Table 3c shows the groups which were related to the significant results observed in Table 3b. A significant reduction of CD3 T cells, which involved the subset CD8, was observed in group A compared to controls (P = 0·002 and P = 0·004, respectively). Interestingly, a significant impairment of both naive compartments was shown in the patient group with 25OHD deficiency compared to controls (P = 0·027 and P = 0·044, respectively), whereas in the group A patients, the percentage of naive T cell subsets was comparable to that of the control group. Differences in naive T cell subsets, although not significant, were also observed between the group with hypoparathyroidism and the group of healthy subjects.
Table 3.
Immunological parameters according to vitamin D status in patients with 22q11.2DS
| Panel (a) | |||||
|---|---|---|---|---|---|
| Characteristics | HC (n = 17) | Overall patients (n = 17) | P | ||
| Age (years) | 7·5 (4·0–15·3) | 9 (6·4–15·8) | 0·4584 | ||
| 25OHD (ng/ml) | 33·6 (30·2–37·3) | 24·9 (14·1–34·4)* | 0·0160 | ||
| WBC (×103/μl) | 7·3 (6·1–9·9) | 7·5 (5·5–9·4) | 0·7084 | ||
| Lymphocytes (×103/μl) | 2·5 (2·2–3·7) | 2·2 (1·3–3·0) | 0·0688 | ||
| T lymphocytes (%) | 74 (67·9–79·9) | 59·6 (45·1–67·6) | <0·0001 | ||
| Helper T cells (%) | 44·4 (40·0–46·7) | 38·4 (28·9–45·4) | 0·0335 | ||
| Naive T cells a | 63·6 (55·0–78·0) | 32·7 (44·6–81·2) | 0·0118 | ||
| Recent thymic emigrants a | 58 (38·0–63·6) | 30·1 (14·8–44·5) | 0·0007 | ||
| Effector T cells a | 3·1 (1·9–14) | 6·5 (1·1–10·8) | 0·5229 | ||
| Central memory T cells a | 21·8 (16·2–27·3) | 30·8 (20·8–34–9) | 0·0235 | ||
| Effector memory T cells a | 11·3 (5·6–16) | 19·3 (9·6–32·4) | 0·0578 | ||
| Cytotoxic T cells (%) | 22·6 (19·5–26·2) | 15 (13·1–20·4) | 0·0004 | ||
| Naive T cells b | 58·6 (57·0–75·8) | 43 (18·9–61·6) | 0·0105 | ||
| Effector T cells b | 15·2 (10·6–33·0) | 13·2 (6·3–22·5) | 0·2203 | ||
| Central memory T cells b | 8 (5·8–11·5) | 11·7 (6·2–31·7) | 0·1164 | ||
| Effector memory T cells b | 21 (11·2–25·1) | 18·2 (5·7–36·7) | 0·8306 | ||
| Regulatory T cells a | 8·1 (7·7–9·9) | 8·5 (7·1–9·8) | 0·8833 | ||
| B cells | 13·3 (11·1–16·5) | 23·1 (16·3–27·7) | 0·0013 | ||
| NK cells | 8·2 (5·7–10·3) | 15·7 (8·0–22·5) | 0·0307 | ||
| Panel (b) | |||||
| Characteristics | HC (n = 17) | Group A (n = 6) (25OHD ≥ 20 ng/ml) | Group B (n = 6) (25OHD < 20 ng/ml) | Group C (n = 5) (hypoparathyroidism) | P |
| Age (years) | 7·5 (4·0–15·3) | 9 (6·5–14·3) | 8·6 (4·9–10·5) | 16·5 (9·3–16·9) | 0·4204 |
| 25OHD (ng/ml) | 33·6 (30·2–37·3) | 34·4 (30·5–34·7) | 14·7 (11·8–18·9) | n.d.* | 0·0010 |
| WBC (×103/μl) | 7·3 (6·1–9·9) | 6·9 (4·9–9·3) | 7·6 (6·2–8·5) | 9·9 (5·4–11·5) | 0·7769 |
| Lymphocytes (×103/μl) | 2·5 (2·2–3·7) | 2·3 (1·7–3·2) | 2·8 (2·0–3·3) | 1·1 (1·1–2·1) | 0·0340 |
| T lymphocytes (%) | 74 (67·9–79·9) | 45·8 (40·2–62·4) | 57·3 (46·1–75·1) | 66·1 (59·8–68–3) | 0·0009 |
| Helper T cells (%) | 44·4 (40·0–46·7) | 43·7 (36·2–45·7) | 30·4 (25·6–41) | 43·4 (33·9–46) | 0·1136 |
| Naive T cells a | 63·6 (55·0–78·0) | 63·7 (44·6–81·2) | 27·1 (22·9–52·8) | 27·5 (24·2–54·2) | 0·0103 |
| Recent thymic emigrants a | 58 (38·0–63·6) | 41·5 (23·6–50·4) | 19·0 (13·9–29·1) | 37·2 (17·4–57) c | 0·0022 |
| Effector T cells a | 3·1 (1·9–14) | 3·9 (0·6–8·5) | 2·6 (1·4–4·7) | 9·4 (2·5–16·1) | 0·4563 |
| Central memory T cells a | 21·8 (16·2–27·3) | 25 (10·4–31·7) | 33 (28·3–43·5) | 31·8 (22·6–39) | 0·0316 |
| Effector memory T cells a | 11·3 (5·6–16) | 11 (6·6–21·3) | 23·5 (13·8–42·0) | 26 (11·8–32·4) | 0·0607 |
| Cytotoxic T cells (%) | 22·6 (19·5–26·2) | 12·1 (9·6–16·1) | 17 (13·9–22·5) | 18·4 (14·7–20·4) | 0·0036 |
| Naive T cells b | 58·6 (57·0–75·8) | 61·4 (48·0–80·2) | 36·3 (22·1–47·7) | 18·9 (9·2–63) | 0·0094 |
| Effector T cells b | 15·2 (10·6–33·0) | 14·4 (10·2–23·2) | 4·5 (0·7–17·4) | 21·4 (14·4–27·5) | 0·1192 |
| Central memory T cells b | 8 (5·8–11·5) | 6·3 (1·8–10·5) | 36 (21·2–43·3) | 11·3 (5·2–14·8) | 0·0036 |
| Effector memory T cells b | 21 (11·2–25·1) | 14·9 (4·0–21·8) | 22·9 (4·2–36·6) | 45·6 (8·6–58·9) | 0·3695 |
| Regulatory T cells a | 8·1 (7·7–9·9) | 7·8 (7·1–8·8) | 9·8 (6·6–10·2) | n.d. | 0·6021 |
| B cells | 13·3 (11·1–16·5) | 31·7 (16·6–39·6) | 19·7 (15·1–23·8) | 23·9 (15·4–27·5) | 0·0030 |
| NK cells | 8·2 (5·7–10·3) | 10·3 (8·2–26·3) | 18·2 (8·5–32·1) | 8·3 (5·1–18·6) | 0·0947 |
| Panel (c) | |||||
| Variable | Comparison | P | |||
| 25OHD (ng/ml) | Group B versus HC | 0·002 | |||
| Group B versus group A | 0·032 | ||||
| Lymphocytes (×103/μl) | Group C versus HC | 0·023 | |||
| T lymphocytes (%) | Group A versus HC | 0·002 | |||
| Naive T cells a | Group B versus HC | 0·027 | |||
| Recent thymic emigrants a | Group B versus HC | 0·003 | |||
| Central memory T cells a | Group B versus HC | 0·057 | |||
| Cytotoxic T cells (%) | Group A versus HC | 0·004 | |||
| Naive T cells b | Group B versus HC | 0·044 | |||
| Central memory T cells b | Group B versus HC | 0·006 | |||
| Group B versus A | 0·006 | ||||
| B cells | Group A versus HC | 0·006 | |||
NK = natural killer; HC = healthy controls; WBC = white blood cells; blood cells; 22q11.2DS = 22q11.2 deletion syndrome; 25OHD = 25‐hydroxyvitamin D.
25OHD = 25‐hydroxyvitamin D; cholecalciferol.
Continuous data are described by median and interquartile range (IQR). Percentages are given in reference to total lymphocyte population.
% of CD4+ T lymphocytes;
% of CD8+ T lymphocytes; n.d. = not determined.
Determined in two patients: median (values in brackets).
Patients with hypoparathyroidism are excluded, as at the moment of enrollment they were receiving calcium carbonate and calcitriol treatment.
Panel (a): Comparison between healthy controls (HC) and cohort of patients by Mann–Whitney (two‐tailed) test. Panel (b): comparisons among groups, when experimental category is divided into A (25OHD ≥ 20 ng/ml), B (25OHD < 20 ng/ml) and C (hyparathyroidism) subgroups, are performed with the Kruskal–Wallis test followed by multiple comparisons (by Bonferroni method). Panel (c): significative multiple comparisons are shown.
In order to distinguish RTE from proliferated, peripheral naive T cells, we evaluated the expression of the surface molecule CD31 on naive CD4+ cells. In agreement with a low thymic output, in the overall patient group we demonstrated that the number of RTE was significantly reduced compared to controls (P = 0·0007). The total number of RTE also significantly differed between the group of patients with 25OHD deficiency and controls (P = 0·003), whereas group A did not show thymic impairment. RTE was analyzed in only two cases in the group of patients with hypoparathyroidism.
Based on these results, to verify if 25OHD could influence RTE numbers, we analyzed the relationship between 25OHD levels and the proportion of RTE in CD4+ patient cells. We found a direct correlation (rho = 0·618, P = 0·048), after exclusion of the patient with complete 22q11.2DS (Table 4 and Fig. 1). We did not find any other relationship between vitamin D levels and T cell subsets (data not shown).
Table 4.
Spearman’s correlation analysis between 25OHD levels and other quantitative variables
| Variable | Rho | P‐value |
|---|---|---|
| RTE* | 0·618 | 0·048 |
| Total DC (%WBC) | 0·546 | 0·059 |
| pDC/μl | 0·592 | 0·046 |
| pDC (%WBC) | 0·726 | 0·010 |
RTE = recent thymic emigrants; DC = dendritic cells; mDC = myeloid dendritic cells; pDC = plasmacytoid dendritic cells; WBC = white blood cells; 25OHD = 25‐hydroxyvitamin D.
% of CD4+ T lymphocytes.
Fig. 1.

Relationship between 25‐hydroxyvitamin D (25OHD) levels and relative numbers of recent thymic emigrants (RTE) as a percentage of CD4+ T cells. The graphic shows the linear regression line (black line) and 95% confidence interval (dotted line).
Regarding these findings, as shown in Table 3 a, b and c), we also observed more central memory CD4+ T cells in the overall patient group (P = 0·0235) and in patients of subgroup B (P = 0·0057) compared to healthy controls. However, only the patients with 25OHD deficiency had a significantly elevated proportion of central memory cells within the compartment of CD8+ T cells compared to controls and patients with normal 25OHD values (P = 0·006 and P = 0·006, respectively). B cells were significantly higher in the overall cohort of patients (P = 0·0013) and only in group A (P = 0·006) compared to the control subjects.
In 12 patients (six in group B, five in group A and one in group C) the frequency of Treg, estimated as the percentage of CD25+CD127low cells among CD4‐positive cells, did not differ from those of the healthy subjects (P = 0·6201). When Treg cells were evaluated as a percentage of CD4+CD25+CD127low cells among lymphocytes, a significant reduction was found compared to controls (P = 0·00436). The proportion of naive cells, evaluated as the expression of CD45RA among Treg cells, was significantly decreased in the overall patient group compared with controls (P = 0·00436).
Reduction of circulating dendritic cells
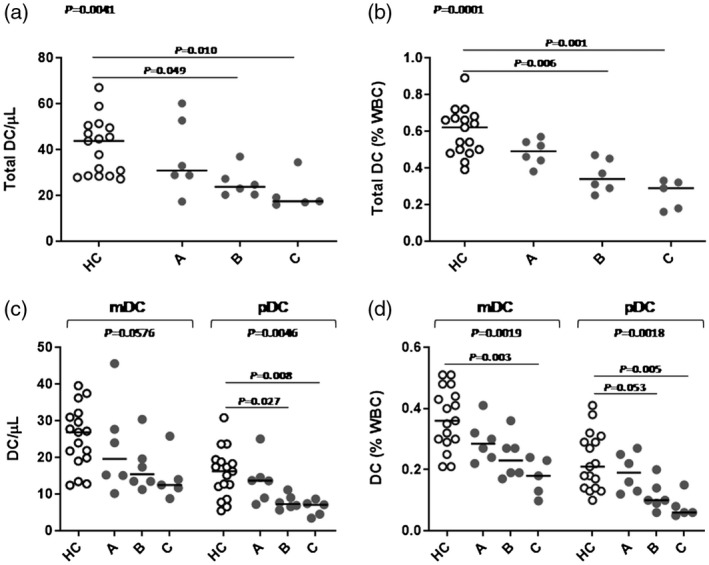
The numbers of circulating DCs were determined in all enrolled patients and in healthy subjects, as shown in Fig. 2. The cohort of patients exhibited a significant decrease of circulating DCs, in both absolute numbers and percentages of WBC, in comparison to healthy controls (P < 0·043 and P < 0·0001, respectively). This reduction affected both mDC and pDC subsets, the major decrease being observed for the pDC count when they were analyzed individually (39·7% of reduction in the absolute count and 42·1% in the relative count compared to control values).
Fig. 2.

(a) Absolute and (b) relative [percentage of white blood cells (WBC)] numbers of DCs, mDCs and pDCs in 22q11.2DS patients (no. 17, grey symbols) compared to age‐matched healthy donors (no. 17, white symbols). Lines denote medians. The P‐values derived from two‐tailed Mann–Whitney U‐test. HC = healthy controls; mDC = myeloid dendritic cells; pDC = plasmacytoid dendritic cells.
Both mDC and pDC subsets were significantly decreased in number and proportion when compared to age‐matched healthy controls (mDCs: P = 0·0216 and P = 0·0005, respectively; pDCs: P = 0·0061 and P = 0·0005, respectively).
Subsequently, the numbers of total DCs, mDCs and pDCs were analyzed by subdividing the patients on the basis of their 25OHD status and parathyroid dysfunction into the three above‐described groups (Fig. 3).
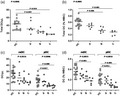
Fig. 3.
Circulating dendritic cell (DC) numbers in 22q11.2 deletion syndrome (22q11.2DS) patients (grey symbols) compared to healthy age‐matched controls (white symbols). (a) Absolute number of total DCs; (b) relative number [percentage of white blood cell (WBC)] of total DC; (c) absolute number of myeloid dendritic cells (mDCs) and plasmacytoid dendritic cells (pDCs); (d) relative (percentage of WBC) number of mDCs and pDCs. Lines denote medians. HC = healthy controls; group A [25‐hydroxyvitamin D (25OHD) ≥ 20 ng/ml], group B (vitamin D deficiency: 25OHD < 20 ng/ml) and group C (hypoparathyroidism); comparisons among groups were performed by Kruskal–Wallis test followed by multiple comparisons (by Bonferroni method).
From these results it emerged that the significant DC reduction, in absolute and relative counts observed in the overall patient cohort, was due to the patient group with hypoparathyroidism (P = 0·010 and P = 0·001) and to the group with 25OHD deficiency (P = 0·049 and P = 0·006). Similar results were obtained by analyzing DC subsets (mDCs and pDCs) in the three groups investigated.
Their relationship was analyzed to verify if 25OHD could correlate with DC numbers. In this experiment, the group of patients with hypoparathyroidism was excluded from the analysis, as they were treated with vitamin D. As shown in Table 4 and Fig. 4, a significant correlation was found between the levels of 25OHD and both the relative and absolute pDC numbers (rho = 0·726, P = 0·010 and rho = 0·592, P = 0·046). Interestingly, a similar correlation was not observed in the myeloid subset.
Fig. 4.

Relationship between 25‐hydroxyvitamin D (25OHD) levels and (a) relative [percentage of white blood cells (WBC)] number of total dendritic cells (DCs); (b) relative plasmacytoid dendritic cell (pDC) number; (c) absolute pDC number. All these graphics show the linear regression line (black line) and 95% confidence interval (dotted line).
Reduction of CD85k expression on DCs of patients with 25OHD deficiency
As we have previously reported in healthy subjects [38], the mean fluorescence intensity (MFI) of the antigen CD85k on pDCs of patients was significantly higher than that of mDCs (median MFI = 4147 versus 2568, P = 0·0003). Its expression on both mDC and pDC subsets was significantly higher in patients than in controls (P = 0·0043 and P = 0·0018). Furthermore, the DCs of group A patients showed higher CD85k expression than group B, with significant differences only observed in the myeloid subset (P = 0·026).
Increase of DC numbers following vitamin D supplementation
The two patients analyzed pre‐ and post‐vitamin D supplementation (cholecalciferol = 25 000 UI/month) showed a numerical increase of total DC and of both DC subsets during follow‐up (two steps), compared with age‐matched normal controls (Fig. 5). Conversely, vitamin D supplementation did not increase T cell subsets (data not shown); the effect on Treg cells was not examined.
Fig. 5.

Effect of 25‐hydroxyvitamin D (25OHD) supplementation on dendritic cells (DCs) in two patients. Total DC (a,d), myeloid dendritic cells (mDC) (b,e) and plasmacytoid dendritic cells (pDC) (c,f) values are plotted against the age of the individual. Each black symbol represents the normal values of healthy controls; white symbols represent DC numbers of two patients (no. 1: a, b and c; no. 5: d, e and f) before and after vitamin D supplementation. Black lines represent linear regression analysis and 95% confidence interval (dotted line).
Discussion
22q11.2DS is a syndrome featured by a clinical constellation of manifestations that are variously associated, resulting in a very wide phenotypical spectrum. The disease is characterized by different degrees of parathyroid involvement, ranging from severe hypoparathyroidism to normal endocrine function; therefore, patients often receive vitamin D treatment. The immunological features of 22q11.2DS are widely variable, ranging from normal/partial T cell number and function to a complete absence of T lymphocytes (SCID‐like appearance) [11]. However, the presence of immunodeficiency and/or altered phospho‐calcium metabolism makes 22q11.2DS a pathological condition thought‐provoking for the opportunity to investigate the influence of vitamin D on the immune system.
Vitamin D affects immune function by modulating activation, cytokine secretion and differentiation of various T cell populations, as widely reviewed by Dankers et al. [24]. It influences the pattern of differentiation of T helper (Th) cells, suppressing Th1‐mediated responses, with a consequent reduction of circulating proinflammatory cytokines, and promotes Th2 differentiation and interleukin (IL)‐4 production [24]. The function and differentiation of the Th17 cell subset, considered an important driver of autoimmune disease pathogenesis, is also inhibited [24]. In contrast to inhibition of the proinflammatory T helper cell functions, vitamin D stimulates T regulatory activity [24]. CD8+ cytotoxic T cells, presenting a higher expression of VDR than CD4+ cells [40], may also be a target for 1,25(OH)2D3, playing a role with CD4+ in the suppression of autoimmunity [24]. DCs, as well as being the other main target of vitamin D, also provide a local source of bioactive vitamin D for regulation of the T cell response [27], as their ability to generate and present the hormone to T cells has been demonstrated [27, 41]. Vitamin D interacts directly with DCs to inhibit their migration, differentiation and maturation, promoting a tolerogenic T cell response [26, 27, 42, 43] by the induction of Treg cells and the release of high amounts of anti‐inflammatory cytokines [28, 44]. Most studies that have explored the immunomodulatory effects of vitamin D in vitro have focused on the use of 1,25(OH)2D3 or synthetic analogues [45]. Interestingly, it has been demonstrated that macrophages and DCs are also capable of responding to 25OHD [45].
As expected, a significantly reduced thymic output was demonstrated in our cohort, with the main reduction observed in patients with 25OHD deficiency. Hypoplasia of the thymus, together with the co‐occurrence of an altered structure, underlies the defect of thymic function [11]. The decline of naive, and the increase of memory T cell populations, observed in our cohort could be due not only to impaired thymic output but also to accelerated conversion of naive to memory phenotype, secondary to multiple mechanisms such as infectious exposures or homeostatic expansion, as reported [46]. The observed low RTE levels in patients with 25OHD deficiency in comparison with that of patients with normal vitamin D status might suggest that vitamin D could influence thymic output through a putative differentiating effect on T lymphopoiesis.
Several different types of DC have been identified, each specialized in responding to particular pathogens and interacting with specific subsets of T cells, expanding the ability of the immune system to react appropriately to a wide range of different pathogens and danger signals [47]. Two major and intrinsically different subpopulations of DCs have been described: mDCs, also referred to as conventional DCs (cDCs, typically classified into two subtypes with different functional abilities), and pDCs, which differ in their transcriptional program, development, phenotypical markers and immunological functions [32, 47, 48, 49]. Both mDC and pDC cells are effective T cell stimulators by directing T helper responses (Th1, Th2, Th17, Treg), suggesting in‐vivo functional plasticity, towards initiation of the protective immune response or of the promotion of tolerance [32, 48, 50]. mDCs acquire a strong immunoregulatory phenotype, producing IL‐10, soluble CD25 and indoleamine 2,3‐dioxygenase (IDO), as demonstrated after Escherichia coli stimulation [51, 52]. pDCs produce high levels of interferon (IFN)‐α, a pleiotropic cytokine with not only anti‐viral properties but is also important for pDC survival, mDC differentiation and mDC‐mediated T cell responses [53, 54, 55]. Additionally, pDCs play a role in humoral immunity by supporting B cell functions [50].
As DCs, ranking between innate and adaptive immunity, play a pivotal role in the maintenance of both protective immunity and self‐tolerance, their deficiency or dysfunction would be expected to have a clinical impact on infection, autoimmunity and malignancy. Human dendritic cell deficiency disorders, related to GATA‐binding factor 2 (GATA2) haploinsufficiency [50] and IFN regulatory factor 8 (IRF8) mutations [56], both involved in the development of the myeloid lineage, have highlighted the importance of dendritic cells in the domain of primary immunodeficiencies [50]. Functional DC deficiencies have been described in Wiskott–Aldrich syndrome (WAS), where WAS protein deficiency impairs cytoskeletal‐associated functions of DCs such as migration [57] and cross‐presentation [58]. The same defect has been described in dedicator of cytokinesis 8 (DOCK8) deficiency [59], where aberrant signal transducer and activator of transcription 3 (STAT‐3) function alters the signal transduction of cytokines involved in DC autocrine regulation, resulting in an impaired IL‐10 response in DCs [60]. Moreover, in CD40/CD40L deficiency, the failure of CD40‐CD40L signaling in DCs impacts DC induction of T cell activation and proliferation [61].
Adaptive immunity has been extensively investigated in 22q11.2 DS, but the innate immune response remains largely unknown. In this regard, with the aim of exploring the field of innate immunity, our study first investigated the number of circulating DCs by showing that both DC subsets are significantly reduced in patients with 22q11.2DS. Moreover, analysis performed on the three patient groups, selected by their 25OHD levels, revealed that this decrease was attributable to patients with 25OHD deficiency and those with hypoparathyroidism, highlighting that the DC impairment was primarily due to changes in the pDC population.
The mechanism underlying this quantitative DC defect remains to be elucidated: mutations in genes related to DC differentiation or function or an impaired DC migration with subsequent DC sequestration in peripheral tissues could contribute to their deficiency.
The observed significant positive correlation found between levels of 25OHD and the plasmacytoid DC subset could reflect the intracrine/paracrine effects between the hormone and DCs, although it has been demonstrated that the degree to which DCs can produce 1,25(OH)2D3 in vitro varies with their activation and differentiation status [62].
In the particular case of patients with hypoparathyroidism who received treatment with calcium carbonate and calcitriol, 25OHD levels are usually below the normal values when explored during follow‐up, due the negative feedback of 1,25(OH)2D3. This may explain the observed lack of evidence of DC increase in this group of patients.
Interestingly, according to Lima et al., who described the association between hypoparathyroidism and an increased risk of autoimmunity [63], our results suggest that pDC deficiency may represent an additional mechanism to explain the susceptibility to the breakdown of the immune tolerance.
Additionally, we analyzed the expression of the inhibitory receptor ILT3 on DCs, as it is known to be down‐regulated following DC activation and up‐regulated in tolerogenic DCs [64]. In our work, the observed higher expression of the inhibitory receptor ILT3 on DCs of patients with normal levels of 25OHD than that of 25OHD deficiency suggests the immunomodulatory role of vitamin D in induction of the tolerogenic pattern. This result is in accordance with the seminal study by Penna, who demonstrated that the induction of DCs with tolerogenic properties by 1,25(OH)2D3 is associated with increased selective expression of ILT3 [39]. Therefore, we suggest that the immunomodulatory role of vitamin D in induction of the tolerogenic pattern could also occur through this pathway.
An impaired central tolerance due to an altered thymic maturation and a reduced autoimmune regulator (AIRE) expression, leading to the escape of autoreactive T cells, has been recently demonstrated in 22q11.2DS patients [11]. Therefore, peripheral tolerance is crucial for the maintenance of immune homeostasis throughout life: Tregs of thymic origin and peripheral DCs are critical in inducing tolerance to antigens under steady state conditions [65, 66]. Our work identifies the presence of a numerical dendritic cell defect in 22q11.2DS patients, markedly in the DC subset displaying tolerogenic properties, suggesting an additional mechanism contributing to the high susceptibility to infections and autoimmune diseases described in these patients. In our cohort, the patient with the clinical phenotype comparable to a SCID‐like appearance showed the lowest thymic output, as expected, but also the lowest number of DCs. Our preliminary data suggest that deficiency of the pDC subset in patients with 22q11.2DS may be included among the causative factors (homeostatic expansion selecting for self‐reactive T cells and decrease in Tregs) of the progressive increase in the risk of autoimmune diseases in these patients. Therefore, the investigation of DC function is necessary to support this assumption.
Despite the limited cohort analyzed, the immune assessment of patients with 22q11.2DS showed different values in relation to different levels of vitamin D, showing a higher immunological impairment in the presence of vitamin D deficiency. Interestingly, the significant reduction of naive and increase of central memory T cell populations found in our cohort was observed in the group of patients with vitamin D deficiency in whom the highest prevalence of autoimmunity was identified. Vitamin D has long been proposed as an immunomodulator with a central role in the maintenance of both protective immunity and self‐tolerance. The overall recognized immunomodulatory effect of vitamin D has been followed by a large number of studies that have investigated the correlation of vitamin D with immune‐related diseases. In humans, an increased incidence of autoimmune diseases has been reported in subjects with low serum 25OHD in comparison to healthy controls [67, 68, 69]. A higher disease activity has also been reported in patients affected by autoimmune diseases with vitamin D deficiency [70, 71, 72]. Furthermore, a causal link between vitamin D and autoimmune disease risk and severity has not been proved and the hormone is currently proposed to be a putative environmental contributor to autoimmunity, adding to the underlying genetic component of these diseases [73]. Knowledge of the mechanism underlying its interaction with the immune system and the role of its supplementation in the prevention or treatment of autoimmune or proinflammatory diseases has been partially elucidated. Further research, including the investigation of DC function, is needed for a clearer understanding of the effects of vitamin D deficiency in a larger sample of individuals with 22q11.DS. Furthermore, as infections and susceptibility to autoimmune diseases represent the major concern in children with 22q11.2DS, it appears reasonable that vitamin D supplementation may have a role in the rationale of preventing autoimmune or proinflammatory diseases in these patients, and potentially in the extended field of primary immunodeficiencies.
Conclusions
DC numbers have been investigated in 22q11.2DS patients. Despite the limited cohort of patients analyzed, their defect, markedly in the pDC subset, was significantly higher in patients with vitamin D deficiency, suggesting an immunomodulatory role of the hormone through the DC pathway. A DC defect could be contributing to the progressive risk of autoimmunity in these patients, and vitamin D supplementation may be suggested as an additional strategy in maintaining immune homeostasis in 22q11.2DS patients.
Acknowledgements
No funding to declare.
Disclosures
The authors declare that the research was conducted in the absence of any commercial or financial relationship that could be construed as a potential conflict of interest.
Author contributions
A. L. designed the study, performed the experiments, analyzed and interpreted results, wrote part of the manuscript and contributed to the discussion. V. B. and A. V. performed the CGH array, interpreted results and contributed to the discussion. G. C. provided clinical information and co‐wrote the manuscript. G. I. B. provided clinical information. R. M. critically re‐analyzed results. R. C. contributed to funding acquisition, provided clinical information, designed the study and supervised, conceptualized and wrote the manuscript. All authors contributed to manuscript revision, read and approved the submitted version.
References
- 1. Zemble R, Luning Prak E, McDonald K, McDonald‐McGinn D, Zackai E, Sullivan K. Secondary immunologic consequences in chromosome 22q11.2 deletion syndrome (DiGeorge syndrome/velocardiofacial syndrome). Clin Immunol 2010; 136:409–18. [DOI] [PMC free article] [PubMed] [Google Scholar]
- 2. McDonald‐McGinn DM, Sullivan KE. Chromosome 22q11.2 deletion syndrome (DiGeorge syndrome/velocardiofacial syndrome). Medicine 2011; 90:1–18. [DOI] [PubMed] [Google Scholar]
- 3. Matsuoka R, Takao A, Kimura M et al Confirmation that the conotruncal anomaly face syndrome is associated with a deletion within 22q11.2. Am J Med Genet Part A 1994; 53:285–9. [DOI] [PubMed] [Google Scholar]
- 4. Bassett AS, Chow EW, Husted J et al Clinical features of 78 adults with 22q11 deletion syndrome. Am J Med Genet A 2005; 138:307–13. [DOI] [PMC free article] [PubMed] [Google Scholar]
- 5. Ryan AK, Goodship JA, Wilson DI et al Spectrum of clinical features associated with interstitial chromosome 22q11 deletions: a European collaborative study. J Med Genet 1997; 34:798–804. [DOI] [PMC free article] [PubMed] [Google Scholar]
- 6. Oskarsdottir S, Persson C, Eriksson BO, Fasth A. Presenting phenotype in 100 children with the 22q11 deletion syndrome. Eur J Pediatr 2005; 164:146–53. [DOI] [PubMed] [Google Scholar]
- 7. McDonald‐McGinn DM, Sullivan K E, Marino B et al. 22q11.2 deletion syndrome. Nat Rev Disease Primers 2015; 1:1–19. [DOI] [PMC free article] [PubMed] [Google Scholar]
- 8. Davies EG. Immunodeficiency in DiGeorge syndrome and options for treating cases with complete athymia. Front Immunol 2013; 4:322. [DOI] [PMC free article] [PubMed] [Google Scholar]
- 9. Smith J. T‐box genes: what they do and how they do it. Trends Genet 1999; 15:154–8. [DOI] [PubMed] [Google Scholar]
- 10. Papangeli I, Scambler P. The 22q11 deletion: DiGeorge and velocardiofacial syndromes and the role of TBX1. Wiley Interdiscip Rev Dev Biol 2013; 2:393–403. [DOI] [PubMed] [Google Scholar]
- 11. Marcovecchio GE, Bortolomai I, Ferrua F et al Thymic epithelium abnormalities in DiGeorge and Down syndrome patients contribute to dysregulation in T cell development. Front Immunol 2019; 10:447. [DOI] [PMC free article] [PubMed] [Google Scholar]
- 12. McLean‐Tooke A, Spickett GP, Gennery AR. Immunodeficiency and autoimmunity in 22q11.2 deletion syndrome. Scand J Immunol 2007; 66:1–7. [DOI] [PubMed] [Google Scholar]
- 13. Gennery AR. Immunological aspects of 22q11.2 deletion syndrome. Cell Mol Life Sci 2012; 69:17–27. [DOI] [PMC free article] [PubMed] [Google Scholar]
- 14. Gennery AR, Barge D, O’Sullivan JJ, Flood TJ, Abinun M, Cant AJ. Antibody deficiency and autoimmunity in 22q11.2 deletion syndrome. Arch Dis Child 2002; 86:422–5. [DOI] [PMC free article] [PubMed] [Google Scholar]
- 15. Finocchi A, Di Cesare S, Romiti ML et al Humoral immune responses and CD27+ B cells in children with DiGeorge syndrome (22q11.2 deletion syndrome). Pediatr Allergy Immunol 2006; 17:382–8. [DOI] [PubMed] [Google Scholar]
- 16. Crowley B, Ruffner M, McDonald McGinn DM, Sullivan KE. Variable immune deficiency related to deletion size in chromosome 22q11.2 deletion syndrome. Am J Med Genet A 2018; 176:2082–6. [DOI] [PMC free article] [PubMed] [Google Scholar]
- 17. Lima K, Folling I, Eiklid KL, Natvig S, Abrahamsen TG. Age‐dependent clinical problems in a Norwegian national survey of patients with the 22q11.2 deletion syndrome. Eur J Pediatr 2010; 169:983–9. [DOI] [PubMed] [Google Scholar]
- 18. Montin D, Marolda A, Licciardi F et al Immunophenotype anomalies predict the development of autoimmune cytopenia in 22q11.2 deletion syndrome. J Allergy Clin Immunol Pract 2019; 77:2369–76. [DOI] [PubMed] [Google Scholar]
- 19. Tison BE, Nicholas SK, Abramson SL et al Autoimmunity in a cohort of 130 pediatric patients with partial DiGeorge syndrome. J Allergy Clin Immunol 2011; 128:1115–7.e1–3. [DOI] [PubMed] [Google Scholar]
- 20. Kelley L, Sanders AF, Beaton EA. Vitamin D deficiency, behavioral atypicality, anxiety and depression in children with chromosome 22q11.2 deletion syndrome. J Dev Origins Health Disease 2016; 7:616–25. [DOI] [PMC free article] [PubMed] [Google Scholar]
- 21. Gafni RI, Collins MT. Hypoparathyroidism. N Engl J Med 2019; 380:1738–47. [DOI] [PubMed] [Google Scholar]
- 22. Cheung EN, George SR, Costain GA et al Prevalence of hypocalcaemia and its associated features in 22q11.2 deletion syndrome. Clin Endocrinol 2014; 81:190–6. [DOI] [PMC free article] [PubMed] [Google Scholar]
- 23. Bassett AS, McDonald‐McGinn DM, Devriendt K et al Practical guidelines for managing patients with 22q11.2 deletion syndrome. J Pediatrics 2011; 159:332–9.e1. [DOI] [PMC free article] [PubMed] [Google Scholar]
- 24. Dankers W, Colin EM, van Hamburg JP, Lubberts E. Vitamin D in autoimmunity: molecular mechanisms and therapeutic potential. Front Immunol 2016; 7:697. [DOI] [PMC free article] [PubMed] [Google Scholar]
- 25. Gunville CF, Mourani PM, Ginde AA. The role of vitamin D in prevention and treatment of infection. Inflamm Allergy Drug Targets 2013; 12:239–45. [DOI] [PMC free article] [PubMed] [Google Scholar]
- 26. Hewison M. An update on vitamin D and human immunity. Clin Endocrinol 2012; 76:315–25. [DOI] [PubMed] [Google Scholar]
- 27. Bscheider M, Butcher EC. Vitamin D immunoregulation through dendritic cells. Immunology 2016; 148:227–36. [DOI] [PMC free article] [PubMed] [Google Scholar]
- 28. Karthaus N, van Spriel AB, Looman MWG et al Vitamin D controls murine and human plasmacytoid dendritic cell function. J Invest Dermatol 2014; 134:1255–64. [DOI] [PubMed] [Google Scholar]
- 29. de Haan K, Groeneveld AB, de Geus HR, Egal M, Struijs A. Vitamin D deficiency as a risk factor for infection, sepsis and mortality in the critically ill: systematic review and meta‐analysis. Crit Care 2014; 18:660. [DOI] [PMC free article] [PubMed] [Google Scholar]
- 30. Goldsmith JR. Vitamin D as an immunomodulator: risks with deficiencies and benefits of supplementation. Healthcare 2015; 3:219–32. [DOI] [PMC free article] [PubMed] [Google Scholar]
- 31. Sassi F, Tamone C, D’Amelio P. Vitamin D: nutrient, hormone, and immunomodulator. Nutrients 2018; 10: pii: E1656. [DOI] [PMC free article] [PubMed] [Google Scholar]
- 32. Legitimo A, Consolini R, Failli A, Orsini G, Spisni R. Dendritic cell defects in the colorectal cancer. Hum Vaccine Immunother 2014; 10:3224–35. [DOI] [PMC free article] [PubMed] [Google Scholar]
- 33. Bertini V, Azzara A, Legitimo A et al Deletion extents are not the cause of clinical variability in 22q11.2 deletion syndrome: does the interaction between DGCR8 and miRNA‐CNVs play a major role? Front Genet 2017; 8:47. [DOI] [PMC free article] [PubMed] [Google Scholar]
- 34. Ross AC, Manson JE, Abrams SA et al The 2011 report on dietary reference intakes for calcium and vitamin D from the Institute of Medicine: what clinicians need to know. J Clin Endocrinol Metab 2011; 96:53–8. [DOI] [PMC free article] [PubMed] [Google Scholar]
- 35. Wagner CL, Greer FR. Prevention of rickets and vitamin D deficiency in infants, children, and adolescents. Pediatrics 2008; 122:1142–52. [DOI] [PubMed] [Google Scholar]
- 36. Braegger C, Campoy C, Colomb V et al Vitamin D in the healthy European paediatric population. J Pediatr Gastroenterol Nutr 2013; 56:692–701. [DOI] [PubMed] [Google Scholar]
- 37. Kohler S, Thiel A. Life after the thymus: CD31+ and CD31– human naive CD4+ T‐cell subsets. Blood 2009; 113:769–74. [DOI] [PubMed] [Google Scholar]
- 38. Orsini G, Legitimo A, Failli A, Massei F, Biver P, Consolini R. Enumeration of human peripheral blood dendritic cells throughout the life. Int Immunol 2012; 24:347–56. [DOI] [PubMed] [Google Scholar]
- 39. Penna G, Roncari A, Amuchastegui S et al Expression of the inhibitory receptor ILT3 on dendritic cells is dispensable for induction of CD4+Foxp3+ regulatory T cells by 1,25‐dihydroxyvitamin D3. Blood 2005; 106:3490–7. [DOI] [PubMed] [Google Scholar]
- 40. Veldman CM, Cantorna MT, DeLuca HF. Expression of 1,25‐dihydroxyvitamin D(3) receptor in the immune system. Arch Biochem Biophys 2000; 374:334–8. [DOI] [PubMed] [Google Scholar]
- 41. Merad M, Sathe P, Helft J, Miller J, Mortha A. The dendritic cell lineage: ontogeny and function of dendritic cells and their subsets in the steady state and the inflamed setting. Annu Rev Immunol 2013; 31:563–604. [DOI] [PMC free article] [PubMed] [Google Scholar]
- 42. Penna G, Adorini L. 1 Alpha, 25‐dihydroxyvitamin D3 inhibits differentiation, maturation, activation, and survival of dendritic cells leading to impaired alloreactive T cell activation. J Immunol 2000; 164:2405–11. [DOI] [PubMed] [Google Scholar]
- 43. Adorini L, Penna G, Giarratana N, Uskokovic M. Tolerogenic dendritic cells induced by vitamin D receptor ligands enhance regulatory T cells inhibiting allograft rejection and autoimmune diseases. J Cell Biochem 2003; 88:227–33. [DOI] [PubMed] [Google Scholar]
- 44. Berer A, Stockl J, Majdic O et al 1,25‐Dihydroxyvitamin D(3) inhibits dendritic cell differentiation and maturation in vitro . Exp Hematol 2000; 28:575–83. [DOI] [PubMed] [Google Scholar]
- 45. Medrano M, Carrillo‐Cruz E, Montero I, Perez‐Simon JA. Vitamin D: effect on haematopoiesis and immune system and clinical applications. Int J Mol Sci 2018; 19:2663. [DOI] [PMC free article] [PubMed] [Google Scholar]
- 46. Piliero LM, Sanford AN, McDonald‐McGinn DM, Zackai EH, Sullivan KE. T‐cell homeostasis in humans with thymic hypoplasia due to chromosome 22q11.2 deletion syndrome. Blood 2004; 103:1020–5. [DOI] [PubMed] [Google Scholar]
- 47. Collin M, Bigley V. Human dendritic cell subsets: an update. Immunology 2018; 154:3–20. [DOI] [PMC free article] [PubMed] [Google Scholar]
- 48. Amodio G, Gregori S. Dendritic cells a double‐edge sword in autoimmune responses. Front Immunol 2012; 3:233. [DOI] [PMC free article] [PubMed] [Google Scholar]
- 49. Belz GT, Nutt SL. Transcriptional programming of the dendritic cell network. Nat Rev Immunol 2012; 12:101–13. [DOI] [PubMed] [Google Scholar]
- 50. Bigley V, Cytlak U, Collin M. Human dendritic cell immunodeficiencies. Semin Cell Dev Biol 2019; 86:50–61. [DOI] [PubMed] [Google Scholar]
- 51. Kassianos AJ, Hardy MY, Ju X et al Human CD1c (BDCA‐1)+ myeloid dendritic cells secrete IL‐10 and display an immuno‐regulatory phenotype and function in response to Escherichia coli . Eur J Immunol 2012; 42:1512–22. [DOI] [PubMed] [Google Scholar]
- 52. Macri C, Pang ES, Patton T, O’Keeffe M. Dendritic cell subsets. Semin Cell Dev Biol 2018; 84:11–21. [DOI] [PubMed] [Google Scholar]
- 53. Mathan TS, Figdor CG, Buschow SI. Human plasmacytoid dendritic cells: from molecules to intercellular communication network. Front Immunol 2013; 4:372. [DOI] [PMC free article] [PubMed] [Google Scholar]
- 54. Le Bon A, Etchart N, Rossmann C et al Cross‐priming of CD8+ T cells stimulated by virus‐induced type I interferon. Nat Immunol 2003; 4:1009–15. [DOI] [PubMed] [Google Scholar]
- 55. Montoya M, Schiavoni G, Mattei F et al Type I interferons produced by dendritic cells promote their phenotypic and functional activation. Blood 2002; 99:3263–71. [DOI] [PubMed] [Google Scholar]
- 56. Hambleton S, Salem S, Bustamante J et al IRF8 mutations and human dendritic‐cell immunodeficiency. N Engl J Med 2011; 365:127–38. [DOI] [PMC free article] [PubMed] [Google Scholar]
- 57. Malinova D, Fritzsche M, Nowosad CR et al WASp‐dependent actin cytoskeleton stability at the dendritic cell immunological synapse is required for extensive, functional T cell contacts. J Leukoc Biol 2016; 99:699–710. [DOI] [PMC free article] [PubMed] [Google Scholar]
- 58. Baptista MA, Keszei M, Oliveira M et al Deletion of Wiskott–Aldrich syndrome protein triggers Rac2 activity and increased cross‐presentation by dendritic cells. Nat Commun 2016; 7:12175. [DOI] [PMC free article] [PubMed] [Google Scholar]
- 59. Keles S, Jabara HH, Reisli I et al Plasmacytoid dendritic cell depletion in DOCK8 deficiency: rescue of severe herpetic infections with IFN‐alpha 2b therapy. J Allergy Clin Immunol 2014; 133:1753–5.e3. [DOI] [PMC free article] [PubMed] [Google Scholar]
- 60. Corinti S, Albanesi C, la Sala A, Pastore S, Girolomoni G. Regulatory activity of autocrine IL‐10 on dendritic cell functions. J Immunol 2001; 166:4312–8. [DOI] [PubMed] [Google Scholar]
- 61. Yin W, Gorvel L, Zurawski S et al Functional specialty of CD40 and dendritic cell surface lectins for exogenous antigen presentation to CD8(+) and CD4(+) T cells. EBioMedicine 2016; 5:46–58. [DOI] [PMC free article] [PubMed] [Google Scholar]
- 62. Kundu R, Chain BM, Coussens AK, Khoo B, Noursadeghi M. Regulation of CYP27B1 and CYP24A1 hydroxylases limits cell‐autonomous activation of vitamin D in dendritic cells. Eur J Immunol 2014; 44:1781–90. [DOI] [PubMed] [Google Scholar]
- 63. Lima K, Abrahamsen TG, Wolff AB et al Hypoparathyroidism and autoimmunity in the 22q11.2 deletion syndrome. Eur J Endocrinol 2011; 165:345–52. [DOI] [PubMed] [Google Scholar]
- 64. Waschbisch A, Sanderson N, Krumbholz M et al Interferon beta and vitamin D synergize to induce immunoregulatory receptors on peripheral blood monocytes of multiple sclerosis patients. PLOS ONE 2014; 9:e115488. [DOI] [PMC free article] [PubMed] [Google Scholar]
- 65. Iberg CA, Jones A, Hawiger D. Dendritic cells as inducers of peripheral tolerance. Trends Immunol 2017; 38:793–804. [DOI] [PMC free article] [PubMed] [Google Scholar]
- 66. Devi KS, Anandasabapathy N. The origin of DCs and capacity for immunologic tolerance in central and peripheral tissues. Semin Immunopathol 2017; 39:137–52. [DOI] [PMC free article] [PubMed] [Google Scholar]
- 67. Shen L, Zhuang QS, Ji HF. Assessment of vitamin D levels in type 1 and type 2 diabetes patients: results from meta‐analysis. Mol Nutr Food Res 2016; 60:1059–67. [DOI] [PubMed] [Google Scholar]
- 68. Duan S, Lv Z, Fan X et al Vitamin D status and the risk of multiple sclerosis: a systematic review and meta‐analysis. Neurosci Lett 2014; 570:108–13. [DOI] [PubMed] [Google Scholar]
- 69. Feng R, Li Y, Li G et al Lower serum 25 (OH) D concentrations in type 1 diabetes: a meta‐analysis. Diabetes Res Clin Pract 2015; 108:e71–5. [DOI] [PubMed] [Google Scholar]
- 70. Lin J, Liu J, Davies ML, Chen W. Serum vitamin D level and rheumatoid arthritis disease activity: review and meta‐analysis. PLOS ONE 2016; 11:e0146351. [DOI] [PMC free article] [PubMed] [Google Scholar]
- 71. Sadeghian M, Saneei P, Siassi F, Esmaillzadeh A. Vitamin D status in relation to Crohn’s disease: meta‐analysis of observational studies. Nutrition 2016; 32:505–14. [DOI] [PubMed] [Google Scholar]
- 72. Sahebari M, Nabavi N, Salehi M. Correlation between serum 25(OH)D values and lupus disease activity: an original article and a systematic review with meta‐analysis focusing on serum VitD confounders. Lupus 2014; 23:1164–77. [DOI] [PubMed] [Google Scholar]
- 73. Adorini L, Penna G. Control of autoimmune diseases by the vitamin D endocrine system. Nat Clin Pract Rheumatol 2008; 4:404–12. [DOI] [PubMed] [Google Scholar]