Abstract
Domestication has resulted in reduced salt tolerance in tomato. To identify the genetic components causing this deficiency, we performed a genome‐wide association study (GWAS) for root Na+/K+ ratio in a population consisting of 369 tomato accessions with large natural variations. The most significant variations associated with root Na+/K+ ratio were identified within the gene SlHAK20 encoding a member of the clade IV HAK/KUP/KT transporters. We further found that SlHAK20 transports Na+ and K+ and regulates Na+ and K+ homeostasis under salt stress conditions. A variation in the coding sequence of SlHAK20 was found to be the causative variant associated with Na+/K+ ratio and confer salt tolerance in tomato. Knockout mutations in tomato SlHAK20 and the rice homologous genes resulted in hypersensitivity to salt stress. Together, our study uncovered a previously unknown molecular mechanism of salt tolerance responsible for the deficiency in salt tolerance in cultivated tomato varieties. Our findings provide critical information for molecular breeding to improve salt tolerance in tomato and other crops.
Keywords: domestication, Na+‐K+ transporter, salt tolerance, SlHAK20, tomato
Subject Categories: Genetics, Gene Therapy & Genetic Disease; Membrane & Intracellular Transport; Plant Biology
A genome‐wide association study links reduced sodium ion uptake by SlHAK20 transporter to diminished salt tolerance and increased fruit weight in cultivated tomato.

Introduction
Soil salinization is one of the major threats to crop productivity worldwide (Munns & Tester, 2008). As a predominant ion in saline soils, sodium (Na+) is absorbed from roots and accumulated in photosynthetic tissues, resulting in ionic imbalance, cellular toxicity, and thus reduced productivity. Plants possess a series of tolerance mechanisms to cope with salt stress, which includes limiting Na+ uptake, enhancing Na+ exclusion, adjusting cellular ionic balance (especially Na+/K+ ratio), and redistributing Na+ in leaves (Zhu, 2002, 2016; Ishikawa & Shabala, 2019). A number of membrane transporters are involved in Na+ and K+ influx and efflux processes and control the accumulation of Na+ and K+. Salinity‐induced K+ transport and circulation in specific tissues lead to excess K+ accumulation that balances excess Na+ and thus confers salt tolerance in plants (Shabala & Cuin, 2008; Alvarez‐Aragon et al, 2016; Wu et al, 2018). K+ could serve as a messenger for salt stress to inhibit energy‐dependent biosynthesis processes but promote cell‐ and tissue‐specific metabolism for the production of compounds in defense and repair of cellular systems during salt stress (Anschutz et al, 2014; Shabala & Pottosin, 2014; Shabala, 2019). K+ has even been considered as a determinant of cell fate by triggering programmed cell death via K+ leakage and generation of reactive oxygen species under salinity stress (Shabala, 2017; Rubio et al, 2019; Shabala et al, 2020). Identification and functional studies of these transporter genes regulating K+ and Na+ homeostasis will provide valuable resources for improvement of salt tolerance in crops.
Ion homeostasis under salt stress is maintained by adjusting K+ and Na+ acquisition and distribution in plants (Wu et al, 2018; Isayenkov & Maathuis, 2019; Rubio et al, 2019). HKT1 (high‐affinity potassium transporter 1) was first identified as a Na+/K+ symporter in wheat that contributes to salt tolerance by unloading Na+ from the transpiration stream (Schachtman & Schroeder, 1994), while its homologs, AtHKT1 and SKC1, were found to selectively transport Na+ in root cells and affect Na+ distribution between root and shoot (Berthomieu et al, 2003; Ren et al, 2005). The Na+/H+ antiporter SOS1 (Salt Overly Sensitive 1) is a plasma membrane transporter mediating Na+ extrusion and thus reducing cytosolic Na+ accumulation and toxicity. SOS1 was also suggested to load Na+ from parenchyma cells into xylem sap, whereas HKT1 mediates unloading of Na+ from xylem vessels to prevent Na+ overaccumulation in photosynthetic tissues (Shi et al, 2002; Berthomieu et al, 2003; An et al, 2017). The tonoplast‐localized NHX‐type Na+/H+ exchangers were reported to sequestrate Na+ into vacuoles but also play a role in K+ homeostasis (Blumwald, 2000; Bassil et al, 2011; Barragan et al, 2012).
The HAK/KUP/KT (high‐affinity K+/K+ uptake/K+ transporter) family transporters primarily mediate K+ fluxes, but some members of this family also play important roles in Na+ and Cs+ transport (Benito et al, 2012; Nieves‐Cordones et al, 2017). In addition to maintaining K+ and Na+ homeostasis in plant tissues, these transporters are even involved in other cellular processes such as auxin movement and adenylate cyclase activation (Vicente‐Agullo et al, 2004; Al‐Younis et al, 2015). The HAK/KUP/KT transporters are classified into five major clades, clade I to clade V: Clade I is further divided into two (a and b), and the clade II is divided into three (a, b, and c) subclades (Nieves‐Cordones et al, 2016). Among all the five clades, only three transporters in the clade IV have been characterized so far. LjKUP from Lotus japonicus complements K+ uptake deficiency in bacteria and responds to late nodulation development (Desbrosses et al, 2004). PhaHAK5 from salt‐sensitive Phragmites australis shows Na+ permeability under high sodium stress (Takahashi et al, 2007). PpHAK13 from Physcomitrella patens is a high‐affinity Na+ transporter with low K+ permeability, and its K+ transport capability is inhibited by high Na+ concentrations (Benito et al, 2012).
GWAS is a powerful approach for uncovering the molecular basis of mineral composition in crops because more historical recombination, a larger number of alleles, and wider genetic variations can be investigated in an association study as compared to linkage analysis (Baxter et al, 2010; Chao et al, 2012; Yang et al, 2018; Kang et al, 2019). Tomato as a worldwide leading vegetable crop has publicly available sequences and an assembled genome (Sato et al, 2012; Lin et al, 2014). GWAS has been employed to resolve several traits in tomato, including fruit size, peel color, flavor, and metabolites (Lin et al, 2014; Tieman et al, 2017; Zhu et al, 2018). However, the genetic basis underlying natural variations in Na+ and K+ accumulation and salt tolerance in tomato remains to be identified. Here, we report a GWAS for root Na+/K+ ratio in a population with large natural variations. The most significant variation associated with root Na+/K+ ratio appeared to be within the gene SlHAK20 encoding a member of the clade IV HAK/KUP/KT transporters. We further revealed that SlHAK20 transports Na+ and K+ and regulates Na+/K+ balance under salt stress conditions. One major variant in the coding sequence of SlHAK20 was identified to be associated with Na+/K+ homeostasis and mediate salt tolerance in tomato. Knockout mutations in SlHAK20 in tomato and its homologous genes OsHAK4 and OsHAK17 in rice resulted in a sensitive phenotype to high salinity.
Results
Cultivated tomato varieties are substantially more sensitive to salt stress than wild ancestors
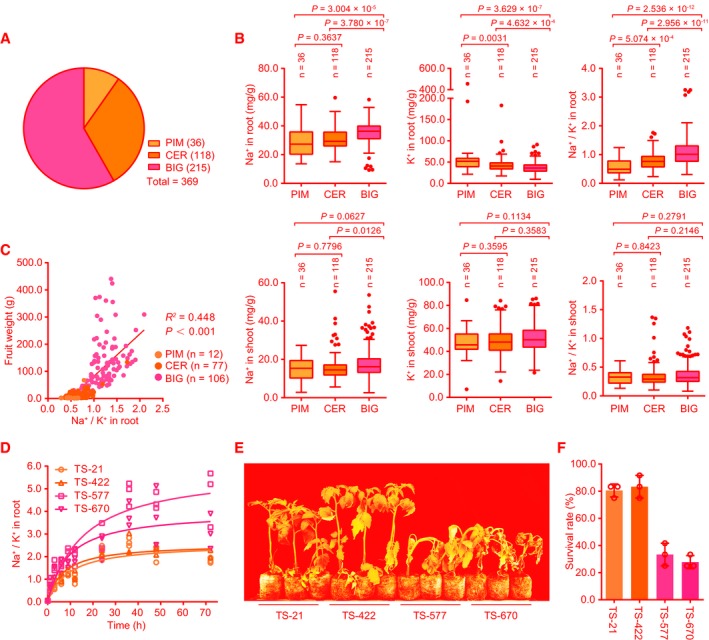
To identify natural genetic variations associated with Na+ and K+ accumulation and salt tolerance in tomato germplasm, we measured Na+ and K+ contents in roots and shoots of 369 tomato accessions representing various geographical origins and improvement status. This population consists of 36 wild accessions of S. pimpinellifolium (PIM), 118 domesticated accessions of S. lycopersicum var. cerasiforme (CER), and 215 improved accessions of S. lycopersicum (BIG) (Figs 1A and EV1, Dataset EV1). We found that, after salt treatment for 1 day, the Na+ contents and Na+/K+ ratios in roots of the accessions in BIG group were significantly higher than those of the accessions in PIM and CER groups, whereas K+ contents in the accessions of the BIG group were notably lower than those in the accessions of PIM and CER groups. Both Na+ and K+ contents in roots showed no significant difference between PIM and CER groups, although the Na+/K+ ratios in the accessions of the CER group were comparatively higher than those in the PIM group. In shoots, no significant difference was identified among these three groups, although there was a higher Na+ content in the accessions of the BIG group than in the accessions of the CER group (Fig 1B, Table EV1). Interestingly, a strong positive correlation between fruit weight and root Na+/K+ ratio was found among the 195 accessions in these three groups (Fig 1C). This is coincided with the fact that tomato domestication and improvement have been focused on fruit appearance and yield rather than salt tolerance (Bolger et al, 2014; Tieman et al, 2017). Collectively, these data suggest that domestication and improvement processes for larger fruits in tomato have resulted in an increased ratio of Na+/K+ in roots under salt stress conditions. We further measured Na+/K+ ratio in the roots of four representative accessions including two PIM (TS‐21 and TS‐422) and two BIG (TS‐577 and TS‐670) accessions. The roots of TS‐21 and TS‐422 exhibited a lower Na+/K+ ratio than TS‐577 and TS‐670 (Fig 1D), which is consistent with the results obtained from the population. Since decreased Na+/K+ ratio is associated with increased salt tolerance (Munns & Tester, 2008), while vacuolar accumulation of Na+ resulting in higher Na+/K+ ratio has also been considered as a salt tolerance mechanism in plants (Wu et al, 2019), we thus evaluated the intracellular Na+ accumulation at the elongation zone of roots of these four accessions. Our results showed that TS‐21 and TS‐422 plants accumulated less cytosolic Na+ and were more resistant to high salinity than TS‐577 and TS‐670 plants (Fig 1E, Appendix Fig S1A). However, vacuolar accumulation of Na+ showed no significant difference among these four accessions (Appendix Fig S1B), suggesting that vacuolar Na+ sequestration is not the contributing factor for salt tolerance in these four contrasting accessions. Approximately 80% of the TS‐21 and TS‐422 plants survived the salt stress treatment as opposed to 30% of the TS‐577 and TS‐670 plants (Fig 1F), which supports a negative correlation between salt resistance and root Na+/K+ ratio in tomato. These results suggest that selection for large fruits in the process of domestication and improvement in tomato may be associated with a reduction in salt tolerance.
Figure 1. Correlation of root Na+/K+ ratio with salt resistance during tomato domestication.
-
ADistribution of 369 accessions, including PIM (36 S. pimpinellifolium accessions), CER (118 S. lycopersicum var. cerasiforme accessions), and BIG (215 S. lycopersicum accessions).
-
BThe Na+ and K+ contents and Na+/K+ ratio in roots and shoots of three groups of 369 accessions after treatment with 150 mM NaCl for 1 day.
-
CLinear regression of root Na+/K+ ratio under salt stress (150 mM NaCl for 1 day) and fruit weight in 195 accessions from three groups. R 2, coefficient of determination. n is the accession number of the three groups.
-
DThe Na+/K+ ratios in roots of TS‐21, TS‐422, TS‐577, and TS‐670 after treatment with 150 mM NaCl for the indicated time (n = 3 biological repeats).
-
E, FSalt resistance assay of two PIM accessions (TS‐21 and TS‐422) and two BIG (TS‐577 and TS‐670). 20‐day‐old seedlings grown in soil were treated with 200 mM NaCl for 3 weeks (E). The survival rates were obtained from at least 12 plants in three repeated experiments (F).
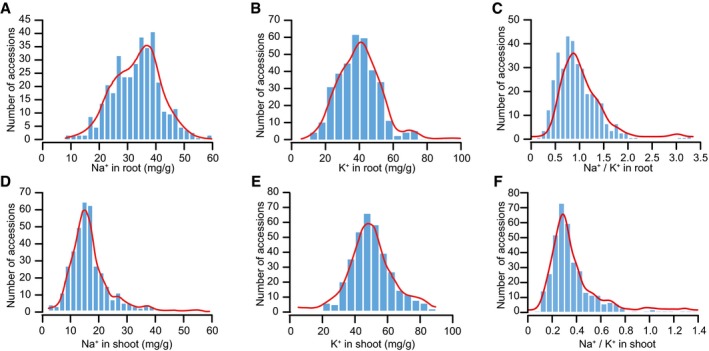
Figure EV1. Frequency distribution of Na+ and K+ contents and Na+/K+ ratio in root and shoot of 369 accessions.
-
A–CFrequency distribution of Na+ (A), K+ (B), and Na+/K+ ratio (C) in roots of the tomato population.
-
D–FFrequency distribution of Na+ (D), K+ (E), and Na+/K+ ratio (F) in shoots of the tomato population.
A variation in SlHAK20 is associated with root Na+/K+ ratio in tomato during salt stress
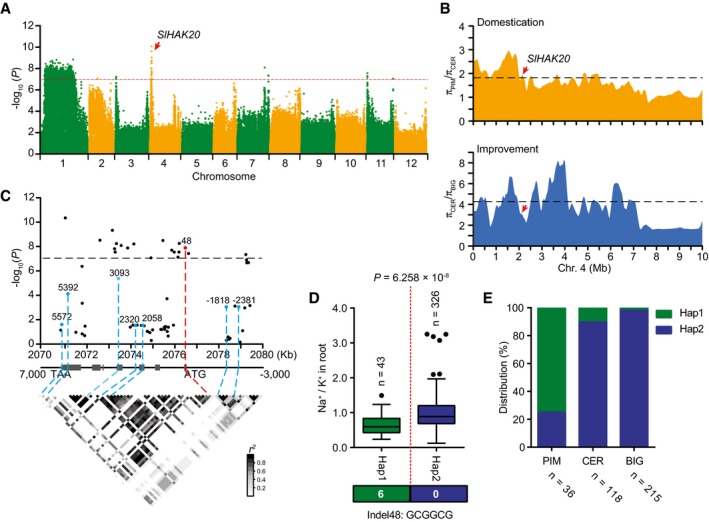
Genome‐wide association study has been successfully used to uncover the molecular basis of ion accumulation in plants (Baxter et al, 2010; Chao et al, 2012; Yang et al, 2018; Kang et al, 2019). However, the genetic basis underlying natural variations in Na+ and K+ accumulation and salt tolerance in tomato remains to be identified. To uncover the genetic alleles contributing to Na+ and K+ accumulation and salt tolerance, 2,824,130 common SNPs with a minor allele frequency (MAF) > 0.05 and missing ratio < 10% were used to perform a GWAS. The P‐values of 1.0 × 10⁻⁷ were set as the significance threshold after Bonferroni‐adjusted correction (Fig 2A, Appendix Fig S2). Nine major signals for root Na+/K+ ratio were detected with the most significant signal located on the short arm of chromosome 4 (Fig 2A). According to the linkage disequilibrium (LD) decay of genomic region harboring the most significant signal (Fig EV2), we retrieved the genes within 200 kb of the leading SNP (04_2156747) and considered their functions to select candidate genes responsible for root Na+/K+ ratio. A candidate locus, SlHAK20, was selected because it was annotated as a potassium transporter gene and the SNPs within this locus are close (86 kb upstream) to the leading SNP (Table EV2, Dataset EV2). This locus was also found to be in the regions associated with domestication sweep (Fig 2B, Dataset EV3), indicating that it underwent artificial selection for large fruits.
Figure 2. Identification of SlHAK20 using GWAS of root Na+/K+ ratio.
-
AManhattan plot displaying the GWAS results of Na+/K+ ratio in root. The red dashed line indicates the Bonferroni‐adjusted significance threshold (P = 1.0 × 10⁻⁷). Red arrow indicates the significant SNP signal of Na+/K+ ratio associated with SlHAK20.
-
BThe nucleotide diversity ratios between PIM and CER, and between CER and BIG on chromosome 4. The black dashed horizontal lines indicate top 10% threshold for entire chromosome 4 (1.82 πPIM/πCER for domestication and 4.27 πCER/πBIG for improvement). The red arrows indicate the position of SlHAK20 in the sweeps. π, nucleotide diversity.
-
CSlHAK20‐based association mapping and pairwise LD analysis. Dots represent SNPs. Indel 48 is highlighted in red. The indel −2,381, indel −1,818 in the promoter region, and five nonsynonymous variants are marked in blue. These eight variants are related to the pairwise LD diagram with dashed lines.
-
DHaplotypes of SlHAK20 among tomato natural variations. The distribution of Na+/K+ ratio in each haplotype group is exhibited by a box plot. n indicates the number of accessions belonging to each haplotype. In the box plots, the middle line indicates the median, the box indicates the range of the percentiles of the total data using Tukey's method, the whiskers indicate the interquartile range, and the outer dots are outliers. Significant difference was determined by Student's t‐test.
-
EAllele distribution of the SlHAK20 locus at position in PIM, CER, and BIG groups. n indicates the accession number.
Figure EV2. Average decay of linkage disequilibrium decay for the associated signal region.
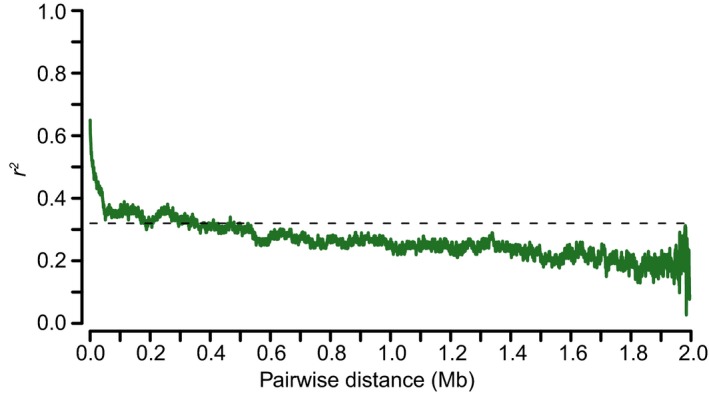
Linkage disequilibrium decay was estimated by squared correlation of allele frequencies (r 2) against distance (Mb) among the SNPs. These SNPs were extracted from 2‐Mb interval surrounding the leading SNP (ch04:2156747), which was determined by the ratios of Na+/K+ in root.
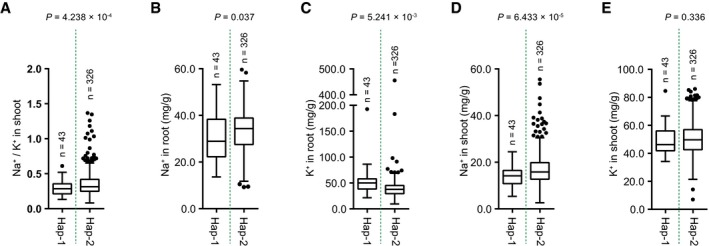
The variations in the genomic sequence of SlHAK20 were identified among TS‐21, TS‐422, TS‐577, and TS‐670 based on the Heinz 1706 tomato genome assembly (version SL2.50) as a reference genome (Sato et al, 2012). In comparison, the coding region displays an in‐frame 6 bp indel (named indel 48) variant significantly associated with root Na+/K+ ratio (P = 1.39 × 10⁻⁸), which is 48 bp downstream of the translation start codon (Dataset EV4). By resequencing of the SlHAK20 promoter regions from all accessions, two variants upstream of the ATG codon, an 48 bp indel (named indel −2,381) and a 32 bp indel (named indel −1,818), were identified but not associated with Na+/K+ ratio in root and shoot. The variant promoter designated as SlHAK20 TS‐670 pro represents the promoters with deletions, and SlHAK20 TS‐21 pro represents the promoters with insertions (Appendix Fig S3). In addition, other five nonsynonymous variations in the coding region show no significant effect on the phenotypic variation (Fig 2C, Table EV3). Based on the identified significant variations in SlHAK20, 369 accessions were classified into two haplotype groups. SlHAK20 TS‐21 belongs to Hap (haplotype group) 1 (n = 43), whereas SlHAK20 TS‐670 is the representative of the largest group Hap2 (n = 326), and these two contrasting accessions are used for further analysis in this study. Statistically, the accessions in Hap1 show significantly lower root Na+/K+ ratios than those in Hap2 (P = 6.258 × 10⁻⁸), and those in Hap1 show a lower shoot Na+/K+ ratio than those in Hap2. Therefore, we designated Hap1 as the tolerant alleles and Hap2 as the sensitive allele of SlHAK20 (Figs 2D and EV3A). We also measured the Na+ and K+ contents in the two haplotypes and found that Hap1 showed lower Na+ content in roots and shoots compared with Hap2 (Fig EV3B–E), suggesting that Hap1 is a stronger allele for restricting Na+ accumulation in a whole plant. The frequencies of the two alleles in PIM, CER, and BIG groups indicate that the salt resistance was lost progressively during domestication and improvement as larger fruits were selected (Fig 2E, Table EV4). These results indicate that the natural variation at the SlHAK20 locus is strongly associated with the difference in root Na+/K+ ratios among the accessions.
Figure EV3. Analysis of Na+ and K+ contents in two SlHAK20 haplotypes in the population.
-
A–EHaplotype analysis of the SlHAK20 gene based on shoot Na+/K+ ratios (A), root Na+ (B) and K+ (C), and shoot Na+ (D) and K+ (E) contents. Box plots represent the interquartile range using Tukey's method, the line in the middle of each box represents the median, the whiskers represent the interquartile range, and the dots represent outlier points. n indicates the number of accessions belonging to each haplotype. Significant difference was determined by Student's t‐test.
SlHAK20 functions in transport of Na+ and K+
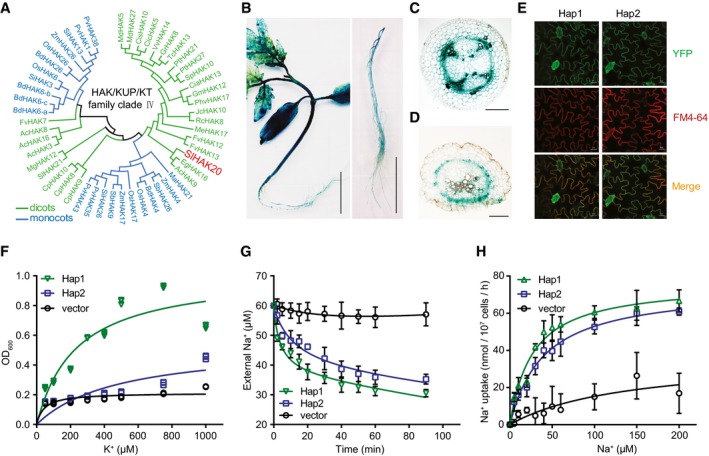
As one of the two members in the clade IV of KT/KUP/HAK family, SlHAK20 homologous proteins have been identified from other crops (Nieves‐Cordones et al, 2016), but no homologs were found in Arabidopsis (Fig 3A, Tables EV5 and EV6). Promoter–GUS analysis showed that the GUS activity driven by the two types of promoters was clearly stronger in shoots than in roots and high expression was detected in vascular tissues (Fig 3B, Appendix Fig S4). In the cross‐sections of hypocotyl and root, GUS activity was primarily detected in the parenchyma cells surrounding xylem vessels (Fig 3C and D). The YFP fusion proteins of SlHAK20Hap1‐YFP and SlHAK20Hap2‐YFP exhibited exclusive localization in the plasma membrane (Fig 3E), indicating that the variations in the coding region have no effect on the subcellular localization of the proteins. The transport activity of SlHAK20 variants for K+ and Na+ was tested in the auxotrophic yeast mutants R5421 and ANT3, respectively (Shi et al, 2002; Li et al, 2014). Under K+‐deficient conditions, the growth of R5421 was significantly depressed, while the SlHAK20 variants SlHAK20Hap1 and SlHAK20Hap2 could partially rescue the growth defect of R5421 mutant (Fig 3F). This result indicates that SlHAK20 mediates K+ influx transport. When grown in the presence of external Na+, the yeast cells expressing SlHAK20 Hap1 exhibited higher Na+ transport activity than the yeast cells expressing SlHAK20 Hap2 (Fig 3G). This result indicates that SlHAK20 also transports Na+ and the variation in SlHAK20 alters Na+ transport activity. Ion uptake kinetic analysis showed that SlHAK20Hap1 had a lower K m (26.8 ± 4.4 μM) than SlHAK20Hap2 (K m = 40.1 ± 4.7 μM), but comparable V max (76.5 ± 3.9 nmol/107 cells/h for SlHAK20Hap1 and 74.1 ± 3.2 nmol/107 cells/h for SlHAK20Hap2) in transporting Na+, indicating that SlHAK20Hap1 has higher Na+‐binding affinity than SlHAK20Hap2 (Fig 3H). Taken together, our results support that Hap1 is a more active allele of SlHAK20 and confers salt tolerance by reducing Na+/K+ ratio in roots.
Figure 3. Functional characterization of SlHAK20.
-
APhylogenetic tree of the HAK/KUP/KT transporter family clade IV. The phylogenetic tree was constructed based on the amino acid sequences using the neighbor‐joining method with MEGA5 in dicots and monocots.
-
B–DThe expression pattern of SlHAK20 in tomato. The GUS activity was examined in seedling (left) and root (right) of 21‐day‐old SlHAK20 TS‐21 pro:GUS transgenic tomato (B). Scale bars, 2 cm. Cross‐sections of hypocotyl (C) and root (D) of SlHAK20 TS‐21 pro:GUS transgenic plants. The scale bar is 400 μm in (C) and 200 μm in (D).
-
ESubcellular localization of SlHAK20‐YFP in tomato. The SlHAK20Hap1‐YFP (left) and SlHAK20Hap2‐YFP (right) were localized in the plasma membrane. YFP, yellow fluorescence protein. FM4‐64, a lipophilic styryl compound as a red fluorescent marker of plasma membrane. Scale bar, 20 μm.
-
FSlHAK20 complements the K+ uptake‐defective yeast mutant assayed using a dose–response method. The K+ uptake‐defective yeast mutant R5421 transformed with SlHAK20Hap1, SlHAK20Hap2, and vector (p416‐GPD) was cultured in AP medium containing indicated concentrations of K+ for 24 h. The data points represent three replicates.
-
GNa+ uptake analysis of yeast cells expressing SlHAK20. Shown are the Na+ concentrations in the medium over the time of culture of the ANT3 yeast cells transformed with SlHAK20 Hap1, SlHAK20 Hap2, or empty vector. The initial NaCl concentration in the medium was 60 μM. The data are shown as the means ± SD (n = 4).
-
HNa+ uptake kinetic analysis of SlHAK20 in yeast cells. The curves show concentration‐dependent Na+ influx in yeast expressing SlHAK20 Hap1 or SlHAK20 Hap2 in the presence of 0, 5, 10, 20, 30, 40, 50, 60, 100, 150, or 200 μM NaCl in the medium. The data are expressed as mean ± SD (n = 3).
Genetic mutations in SlHAK20 decrease salt resistance in tomato
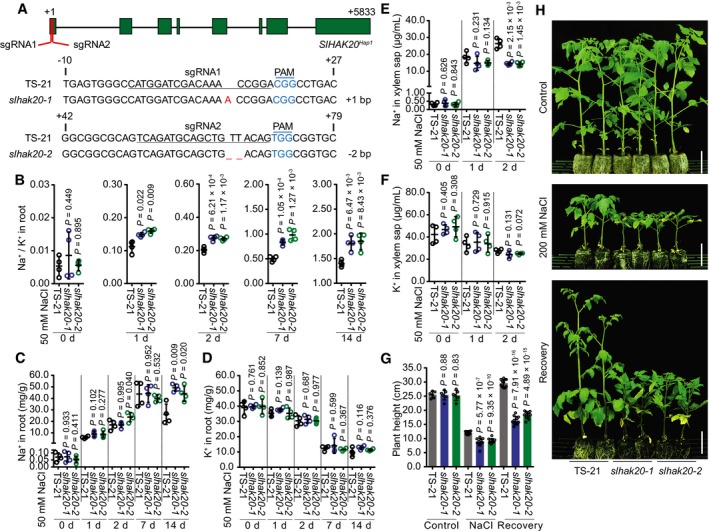
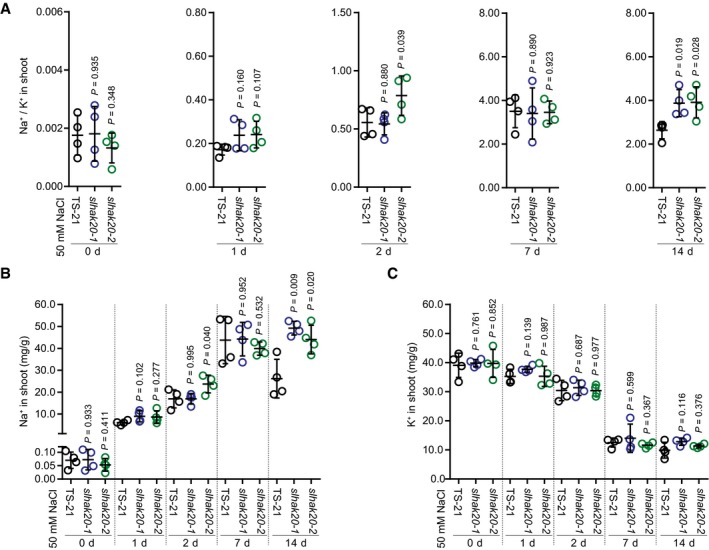
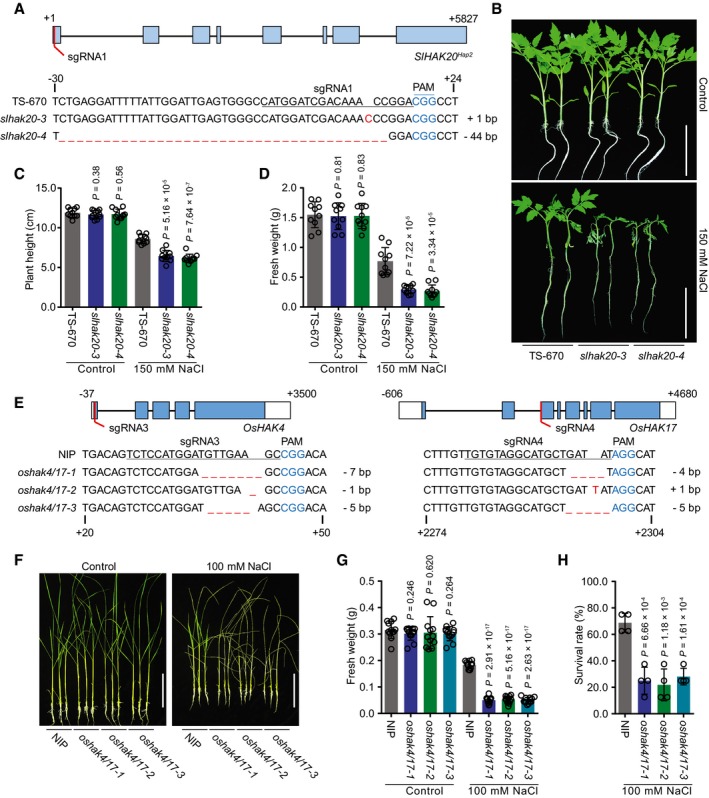
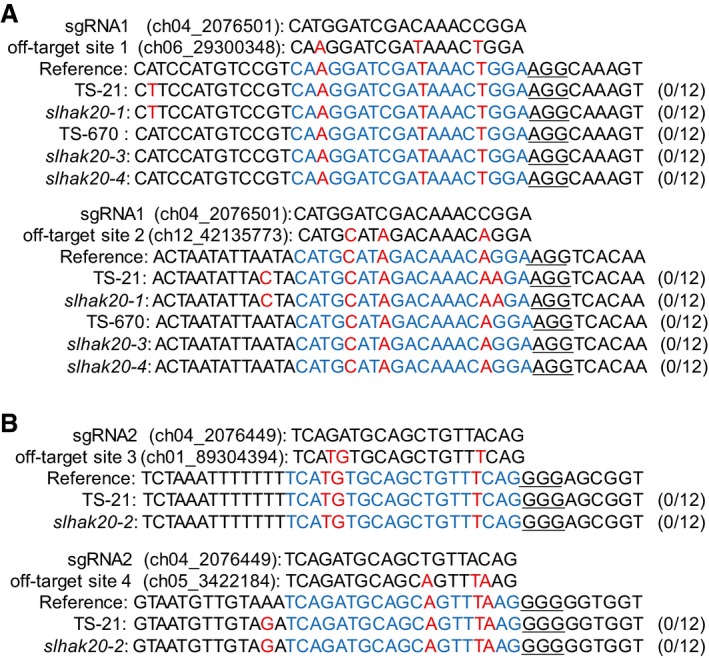
To further confirm the role of SlHAK20 in salt tolerance, we generated knockout mutants of tomato using the CRISPR/Cas9 approach (Fig 4A) and compared Na+/K+ ratio in the root and shoot of wild‐type (TS‐21) and mutant plants. Without salt stress, the Na+/K+ ratio in roots was not substantially different between wild type and mutants. However, after salt treatment, slhak20‐1 and slhak20‐2 mutant roots showed a significantly higher Na+/K+ ratio than wild‐type TS‐21 roots (Fig 4B). The Na+/K+ ratio in shoots did not show significant difference between wild‐type and mutant plants after salt treatment for a week, while after salt treatment for 2 weeks, the mutant shoots had higher Na+/K+ ratio than wild‐type shoots (Fig EV4A). Ion content analysis showed that the Na+ content in mutant roots was higher than that in wild‐type roots, whereas K+ contents were comparable between mutants and wild‐type plants (Fig 4C and D). This result suggests that SlHAK20 controls Na+ accumulation in roots. Higher Na+ accumulation in mutant shoots was observed only after salt treatment for 2 weeks, and K+ accumulation in shoots was similar between the mutant and wild type (Fig EV4B and C). These results suggest that SlHAK20 may limit Na+ accumulation in roots and thus reduce Na+ translocation from roots to shoots. The K+ and Na+ contents in xylem sap were not different between wild‐type and mutant plants under normal conditions, while the xylem sap of mutant plants contained less Na+ but comparable K+ when compared to wild type (Fig 4E and F). These results suggest that SlHAK20 may be involved in Na+ loading/unloading from xylem in roots and shoots under salt stress conditions. It is possible that SlHAK20 is primarily a K+ uptake transporter under normal growth conditions, but it promotes Na+ loading into the xylem in roots but restricts Na+ unloading from the xylem in shoots under salt stress conditions. Thus, in the slhak20 mutants, Na+ could not be loaded into the xylem and was retained in the root cells, resulting in higher Na+/K+ ratio in root and lower Na+ content in the xylem. While in the shoots of mutants, Na+ unloading from the xylem into leaf cells might be enhanced, leading to higher Na+ content in shoots after long period of salt stress, even though there is lower Na+ in the xylem. We measured Na+ and K+ flux in the root maturation zone of mutant and wild‐type TS‐21 plants using the noninvasive, scanning ion‐selective electrode technique (SIET; Shabala et al, 2006), and the results revealed lower Na+ efflux but comparable K+ flux in the root of mutant plants compared with wild type after salt stress (Appendix Fig S5), which indicates that Na+ efflux is reduced in the roots of mutant plants under salt stress. Regardless, phenotype analysis showed that slhak20‐1 and slhak20‐2 mutants were clearly more salt sensitive than wild‐type plants (Fig 4G and H, Appendix Fig S6), which strongly supports the role of SlHAK20 in salt tolerance. In addition, we generated SlHAK20 mutations in the salt‐sensitive line TS‐670 using CRISPR/Cas9, and two independent mutant alleles designated as slhak20‐3 and slhak20‐4 were obtained (Fig 5A). The slhak20‐3 and slhak20‐4 also exhibited significantly reduced salt tolerance when compared to the wild‐type TS‐670 (Fig 5B–D). This result further supports that both strong and weak alleles of SlHAK20 play critical roles in salt tolerance in tomato. To exclude the effects of potential off‐target mutations on salt tolerance of the gene‐editing lines, we identified four potential off‐target sites by using the web tool Cas‐OFFinder (Bae et al, 2014) and sequenced these sites by Sanger sequencing. None of the potential off‐target locus contained mutations in the gene‐editing lines (Fig EV5), further supporting that the loss‐of‐function mutations in SlHAK20 are causative mutations for the salt‐sensitive phenotype.
Figure 4. Role of SlHAK20 in the salt‐tolerant tomato.
-
AGeneration of mutations in SlHAK20 Hap1 by CRISPR/Cas9 using two independent single‐guide RNA (sgRNA1 and sgRNA2). Sequences of SlHAK20 Hap1 in wild‐type (TS‐21), and slhak20‐1 and slhak20‐2 mutant tomato plants are shown. The sgRNA‐targeted sequences are underlined, and the protospacer adjacent motif (PAM) sequences are in blue. The deletion is indicated by a dashed line, and the insertion is labeled with red.
-
B–DNa+/K+ ratio (B) and Na+ (C) and K+ (D) contents in roots of TS‐21 wild type and slhak20 mutants. Data are shown as means ± SD (n = 4).
-
E, FNa+ (E) and K+ (F) contents in the xylem sap of TS‐21 and slhak20 mutants after 50 mM NaCl treatment for the indicated days. Data represent means ± SD (n = 4).
-
GShoot height of TS‐21, slhak20‐1, and slhak20‐2. Plant height of 24‐day‐old TS‐21, slhak20‐1, and slhak20‐2 was measured after growing under normal conditions for 14 days, followed by salt treatment for 14 days, and recovery for 10 days. Values are means ± SD (n = 10 plants of each genotype).
-
HSalt resistance of TS‐21 wild type and slhak20 mutants. TS‐21, slhak20‐1, and slhak20‐2 grown under normal growth conditions for 24 days, followed by a treatment with 200 mM NaCl for 14 days, and then recovered for 10 days. Control plants grown under normal growth conditions for 38 days. Scale bars, 5 cm.
Figure EV4. The Na+ and K+ contents and Na+/K+ ratio in the leaves of slhak20‐1 and slhak20‐2 mutant plants.
-
AShoot Na+/K+ ratio of TS‐21 and slhak20 mutant plants after salt treatment.
-
B, CShoot Na+ (B) and K+ (C) contents of TS‐21, slhak20‐1, and slhak20‐2 under normal and salt stress conditions. 24‐day‐old plants were treated with 50 mM NaCl for the indicated time and used for analysis of Na+ and K+ contents.
Figure 5. Salt tolerance of slhak20 from the salt‐sensitive tomato and oshak4/17 from rice.
-
AGeneration of SlHAK20 Hap2 mutations using CRISPR/Cas9 system. The sequences of SlHAK20 Hap2 in wild‐type (TS‐670), and slhak20‐3 and slhak20‐4 mutant tomato plants are shown.
-
BSalt tolerance assay of TS‐670 and slhak20 mutant plants. TS‐670, slhak20‐3, and slhak20‐4 grown under normal growth conditions for 23 days, and then treated with 150 mM NaCl for 5 days. Control plants grown under normal growth conditions for 28 days.
-
C, DPlant height and fresh weight of TS‐670, slhak20‐3, and slhak20‐4 under normal and salt stress conditions. Shoot height (C) and fresh weight (D) of 23‐day‐old TS‐670, slhak20‐3, and slhak20‐4 were quantified after growing under normal conditions for 5 days, or salt treatment with 150 mM NaCl for 5 days. Values are means ± SD (n = 10 plants of each genotype).
-
EGeneration of oshak4/17 mutants using CRISPR/Cas9 method. Sequences of OsHAK4 and OsHAK17 in wild type (NIP), and oshak4/17‐1, oshak4/17‐2, and oshak4/17‐3 mutants are shown.
-
F–HPhenotype of NIP and oshak4/17 double‐mutant plants under normal and salt stress conditions. 20‐day‐old seedlings of NIP and oshak4/17 mutants were treated with 100 mM NaCl for 8 days. The pictures show representative plants (F), and the fresh weight of shoots (G) and survival rate (H) were analyzed among these genotypes. Control plants were grown under normal growth conditions for 28 days, and the fresh weights of shoots were measured. Values are means ± SD (n = 12 plants of each genotype for fresh weight, four replicates for survival rate).
Figure EV5. Analysis of potential off‐target sites.
-
ATwo potential off‐target sites of sgRNA1 in the T1‐independent lines of slhak20‐1, slhak20‐3, and slhak20‐4.
-
BTwo potential off‐target sites of sgRNA2 in the T1‐independent lines of slhak20‐2.
The oshak4/17 double mutations cause a salt‐sensitive phenotype in rice
Sequence analysis indicated that SlHAK20 shares ~65% similarity with OsHAK4 and OsHAK17 from rice (Appendix Fig S7). To test whether homologous proteins of SlHAK20 in other plants also function in salt tolerance, we generated oshak4/17 double mutant using CRISPR/Cas9 gene editing (Fig 5E) and compared salt tolerance between wild type (japonica. cv. Nipponbare, NIP) and oshak4/17 double mutants. As expected, we observed markedly decreased fresh weight and survival rate of the double mutant after salt treatment, when compared to wild‐type plants (Fig 5F–H). This result indicates that, like SlHAK20, the homologous proteins OsHAK4 and OsHAK17 in rice also function in salt tolerance. Together, our results suggest that the members from clade IV of KT/KUP/HAK family may have a conserved role in salt tolerance in plants including dicots and monocots.
The SlHAK20 Hap1 improves salt tolerance in cultivated tomato varieties
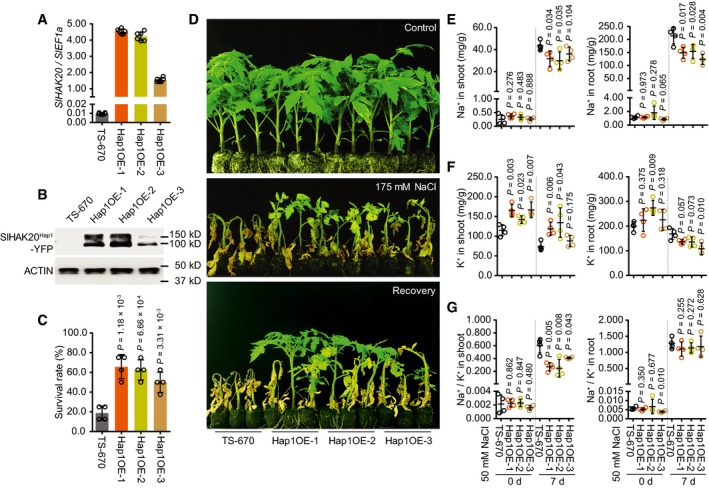
To further verify the function of SlHAK20 haplotypes, we analyzed the salt tolerance of a wide range of tomato varieties. A survey of PIM, CER, and BIG variants showed that the Hap1 confers distinctly greater salt tolerance than Hap2 variants (Appendix Fig S8), indicating that the SlHAK20 Hap1 allele is a major determinant of salt tolerance in tomato. Our results also revealed that the two different haplotypes of SlHAK20 within the BIG group could be phenotypically distinguished by their ability of salt tolerance (Appendix Fig S8), further supporting that SlHAK20Hap1 is critical for salt tolerance and implying that some of the lines retained the salt‐tolerant alleles of SlHAK20 during domestication. In order to determine whether the salt‐tolerant allele of SlHAK20 could enhance salt tolerance of large fruit tomato, we generated transgenic TS‐670 constitutively expressing the SlHAK20 Hap1 (Fig 6A and B). The salt tolerance and Na+ and K+ accumulation of three independent transgenic lines were analyzed in the T2 generation. The transgenic lines exhibited improved survival rates when compared to the TS‐670 wild type under salt stress conditions (Fig 6C and D). The transgenic lines showed significantly decreased Na+ contents in roots compared with wild‐type TS‐670 after salt stress treatment, whereas the K+ contents and Na+/K+ ratios in roots were comparable between the transgenic lines and wild‐type TS‐670 under normal and salt stress conditions. Moreover, less Na+ and more K+ accumulated in the shoots of transgenic plants compared with wild‐type TS‐670 after salt treatment, which resulted in lower shoot Na+/K+ ratios in transgenic plants than in TS‐670 wild‐type plants (Fig 6G). These results suggest that the SlHAK20Hap1 limits Na+ accumulation in a whole plant under salinity stress conditions. The Na+ and K+ fluxes in the root maturation zone were also analyzed with the SIET system, and the results indicated higher Na+ efflux but comparable K+ flux in the roots of HapOE‐1 plants when compared to wild‐type TS‐670 after salt stress (Appendix Fig S9). These results further support that the variations in SlHAK20 are responsible for the reduced salt tolerance in cultivated tomato varieties during domestication and improvement processes and provide the information necessary for the recovery of salt tolerance through molecular breeding. Collectively, our findings uncovered a critical but previously unknown function of SlHAK20 and its homologs in salt resistance, which could help in molecular breeding of salt‐tolerant crops in the future.
Figure 6. Phenotype of the Hap2 accession overexpressing SlHAK20 Hap1 .
-
AThe transcript levels of SlHAK20 in TS‐670 and three independent SlHAK20Hap1‐YFP transgenic lines grown under normal growth conditions.
-
BThe protein levels of SlHAK20Hap1‐YFP in TS‐670 and transgenic plants. Actin was used as loading control.
-
C, DPhenotypes of transgenic lines in soil under salt stress. The survival rates were obtained from at least eight plants in four repeated experiments (C). 38‐day‐old plants grown in soil as control. 20‐day‐old TS‐670 and Hap1OE‐1 to Hap1OE‐3 were treated with 175 mM NaCl for 3 weeks and recovered for 2 weeks (D).
-
E–GThe Na+ (E) and K+ (F) contents and Na+/K+ ratio (G) in shoots and roots of TS‐670 and three independent SlHAK20 Hap1 ‐YFP transgenic lines during salt stress. The 21‐day‐old TS‐670, Hap1OE‐1, Hap1OE‐2, and Hap1OE‐3 plants grown in 0.25× Hoagland, which were then treated with 50 mM NaCl for additional 0 and 7 days.
Discussion
Sodium and potassium have similar chemical properties but rather different physiological impacts on the growth of most crop plants (Hamamoto et al, 2015). Potassium is known to be an essential macronutrient in plants, while high sodium concentrations inhibit plant growth, and maintaining low Na+/K+ ratios has been generally acknowledged as a major strategy for plants to cope with salinity stress (Hauser & Horie, 2010; Chao et al, 2013). Therefore, identifying determinants for Na+/K+ ratio is important for improving salt tolerance in crops. In this study, we collected tomato population representing three distinct evolutionary groups and quantified Na+ and K+ contents of seedlings after salt stress treatment. We observed a clear trend of an increase in root Na+/K+ ratio in the process of domestication and improvement of tomato (Fig 1B). However, low Na+/K+ ratio is associated with salt tolerance (Fig 1C–F), which is a desirable trait for cultivated tomato. Unlike quantitative trait loci (QTL) mapping, GWAS employs genomics‐assisted strategy and can be used to identify the genetic loci controlling root Na+/K+ ratio. We thus performed a GWAS of Na+/K+ ratio in roots (Fig 2A) and detected nine significant signals in chromosomes 2–12 (Table EV2). Among the nine GWAS signals, the variation in SlHAK20, a member of the clade IV in KT/KUP/HAK family, was found to be in the most significant signal region (Fig 2A, Dataset EV2). SlHAK20 showed Na+ and K+ transport activity in yeast, and the variation indel 48 in the SlHAK20 coding region altered SlHAK20 activity in yeast, although these changes did not change the subcellular localization of the protein (Fig 3E–H). The importance of this variation in root Na+/K+ ratio was verified by the distinct Na+/K+ ratios in salt‐tolerant and salt‐sensitive alleles (Fig 2D).
Plants alleviate the toxic effect of Na+ by excluding Na+ from photosynthetic tissue and by sequestrating Na+ into vacuoles. Selective accumulation of Na+ and K+ in vegetative tissues at different developmental stages is essential for maintaining cellular ion homeostasis under high salinity (Hasegawa et al, 2000; Zhu, 2003). Therefore, understanding the molecular mechanisms and manipulation of Na+ movement and distribution thus maintaining a low cytosolic Na+ concentration is critical for improvement of plant salt tolerance (Wu et al, 2019). To our knowledge, this is the first report showing that a natural variation of a member of HAK/KUP/KT family clade IV significantly contributes to Na+ homeostasis and salt tolerance in plants. We showed clearly that SlHAK20 mediates Na+ and K+ transport and regulates Na+/K+ ratio in roots (Figs 3F–H and 4B–D). In Arabidopsis, homologs of the HAK/KUP/KT family clade IV members were not identified so far (Santa‐Maria et al, 2018), and only a few studies reported the role of HAK/KUP/KT clade IV in Na+ transport (Takahashi et al, 2007; Benito et al, 2012). Therefore, the cellular functions and the physiological role of SlHAK20 in a whole plant are still elusive. Based on our findings, we hypothesize that SlHAK20 functions in the loading of K+ and Na+ from parenchyma cells into xylem in roots. The strong allele of SlHAK20 in tomato results in more Na+ loading into xylem and enhances Na+ efflux (Fig 4E, Appendix Fig S5), thereby reducing Na+ accumulation and reducing Na+/K+ ratio in roots (Fig 4B and C). This is supported by our finding that the salt‐tolerant accessions with the strong SlHAK20 allele maintain lower Na+/K+ ratio in roots than the salt‐sensitive accessions with the weak SlHAK20 allele. On the contrary, the knockout mutants of SlHAK20 could not load Na+ into xylem through SlHAK20 (Fig 4E), resulting in Na+ retention in roots and increased root Na+/K+ ratio. This can also explain lower Na+ content in the xylem sap of the mutant plants than wild type. Although previous studies indicated the involvement of other transporters such as HKT1‐, SOS1‐, and CCC‐type transporters in Na+ loading in the xylem (Shabala & Cuin, 2008), our GWAS did not identify any association of SlHKT1;2, SlSOS1, or the two SlCCC genes with the root Na+/K+ ratios in the population (Dataset EV5), suggesting that SlHAK20 is the major player controlling root Na+/K+ ratio in tomato. The function of SlHAK20 in shoot is still elusive since the ion contents and Na+/K+ ratios did not change significantly in shoots among different accessions and genotypes (Fig EV4). It is possible that SlHAK20 in shoot mediates K+ and Na+ loading from xylem into leave cells and other K+ transporters have redundant function with SlHAK20. Therefore, the role of SlHAK20 in shoot remains to be further studied in the future.
Knockout of SlHAK20 in tomato and its homologs in rice resulted in a salt‐sensitive phenotype (Figs 4G and H, and 5, Appendix Fig S6), which suggests that SlHAK20 type of transporters may have conserved functions in both dicots and monocots. Integration of the salt‐tolerant allele SlHAK20 Hap1 into the cultivated tomato varieties effectively enhances salt tolerance (Fig 6, Appendix Fig S9), indicating that wild varieties harboring salt‐tolerant alleles are excellent natural resources for improving salt tolerance in cultivated tomato through molecular breeding.
In summary, our GWAS and loss‐of‐function mutation analyses strongly indicate that SlHAK20 plays a critical role in salt tolerance in tomato. To our knowledge, this is the first report showing that a natural variation of a member of HAK/KUP/KT family clade IV significantly contributes to Na+ homeostasis and salt tolerance in plants. SlHAK20 is the first characterized domesticated gene, which is responsible for the loss of salt tolerance during domestication and improvement as ever‐larger fruits were selected. The identified variations provide valuable information for molecular breeding for salt tolerance in cultivated tomato and other crops.
Materials and Methods
Plant material and growth conditions
All the tomato accessions used in this study were obtained from the TGRC (Tomato Genetics Resource Center), USDA (United State Department of Agriculture), University of Florida, EU‐SOL (The European Union‐Solanaceae project), INRA (The National Institute for Agricultural Research), and IVF‐CAAS (The Institute of Vegetables and Flowers, Chinese Academy of Agricultural Science). For tomato seedling growth in agar plate, seeds were surface‐sterilized and stored in sterile water at 4°C for 48 h for stratification, followed by germination at 23°C in 0.25× Hoagland medium (pH 6.0) with 0.6% (w/v) agar. Seven‐day‐old seedlings were then transplanted to soil or solution culture and grown in a growth room at 25°C with 12‐h light/12‐h dark period for observations of normal growth and development, and seed proliferation. For rice growth, the rice seeds were germinated in petri dish plates. Seven‐day‐old rice seedlings were transplanted into growing trays with soil mixture and placed in a growth chamber with a 12‐h light/12‐h dark photoperiod and a temperature at 23–27°C. About 3 weeks later, the plants were transplanted into field and grown until harvest.
Measurement of K+ and Na+ contents
A total of 369 tomato accessions, consisting of 36 PIM, 118 CER, and 215 BIG, were used for elemental analysis (Table EV1). For collection of shoots and roots, three plants per accession were grown in 0.25× Hoagland liquid medium for 19 days in a growth room at 25°C with 12‐h light/12‐h dark period, and then supplemented with 150 mM NaCl for additional 24 h. To determine Na+ and K+ contents (Chao et al, 2013), shoots and roots were separated with plastic tweezers. The collected plant parts were rinsed three times with deionized water to remove any contaminants. The dry weight of the samples was determined after dehydration in an oven at 75°C for 24 h, and the dry materials were then digested with 1 ml of concentrated nitric acid containing an indium internal standard at 115°C for 3 h. The digested samples were diluted to 10 ml with deionized water and used for measurements of Na+ and K+ by using an inductively coupled plasma mass spectrometry (ICP‐MS) (NexION 350D; PerkinElmer) coupled to an Apex desolation system and an SC‐4 DX autosampler (Elemental Scientific Inc., Omaha, NE, US). As determined using a heuristic algorithm, all samples were normalized in calculation based on the best‐measured elements, the weights of the ten weighed samples, and the solution concentrations.
Genome‐wide association study
A total of 369 accessions in three groups were collected to construct the association panel. The SOAP2 was used to map all the sequencing reads from each accession to the tomato reference genome (version SL2.50) with the following parameters: ‐m 100, ‐x 888, ‐s 35, ‐l 32, ‐v 3 (Li et al, 2009b). The mapped reads were then filtered to remove PCR duplicates. Both paired‐end and single‐end mapped reads were displayed for SNP calling throughout the entire collection of tomato accessions using SOAPsnp with the following parameters: ‐L 100 ‐u ‐F 1 (Li et al, 2009a). The likelihood of genotypes is generated for each SNP with quality ≥ 40 and base quality ≥ 40 across the population. False‐positive SNPs were filtered from the population according to the method previously described by Lin et al (2014). To conduct GWAS for the six traits (Zhu et al, 2018), we used a factored spectrally transformed linear mixed model (FaST‐LMM) program, with 2,824,130 SNP across the entire tomato genome (minor allele frequency ≥ 0.05 and missing ratio < 10%). The genome‐wide significance thresholds of all the six traits were set at a uniform threshold (1.0 × 10⁻⁷). Linkage disequilibrium (LD) analyses were calculated based on all the SNPs in the targeted genomic regions using Haploview software (Barrett et al, 2005). Linkage disequilibrium decay was indicated by r 2 values and corresponding distance between the pairs of SNPs. The average r 2 values for all pairwise SNPs within 500 bp distance were calculated and plotted against the average distance. To reduce the redundancy of GWAS signals, the signals were manually selected and the most significant SNPs within 0.5 Mb interval were extracted as the leading SNPs.
Vector construction and plant transformation
To construct the GUS expression vector, the SlHAK20 TS‐21 and SlHAK20 TS‐670 promoters were PCR‐amplified from their genomic DNA and recombined into the binary vector pMDC162, and the constructs were then transformed into the tomato variety Money Maker. Histochemical staining was performed using at least three independent SlHAK20‐GUS transgenic T2 lines as described previously (Wang, Wang et al, 2016).
The coding sequences without stop codon of SlHAK20 Hap1 and SlHAK20 Hap2 were amplified and inserted into the pCAMBIA1300‐YFP vector under the control of the cauliflower mosaic virus (CaMV) 35S promoter. The constructs were then introduced into the TS‐670 using Agrobacterium‐mediated cotyledon transformation approach (Van Eck et al, 2006). Transgene‐positive and sibling transgene‐negative (WT) plants were identified in each generation by green fluorescence detection. At least two independent transgenic T2 lines of SlHAK20‐YFP were grown in 0.25× Hoagland for 7 days under normal conditions. The patches of leaves were immersed with 2 μg/ml FM4‐64 (Invitrogen) for 8 min to label plasma membrane before microscopy observation. The fluorescence in the transformed leaves was imaged using a confocal laser scanning microscope (ZEISS LSM880).
The construction of CRISPR/Cas9 vectors was performed as described previously (Hua et al, 2018; Miao et al, 2018). The 19 bp single‐guide RNA (sgRNAs) with a requisite protospacer adjacent motif, PAM (NGG), sequence was cloned into the binary vector pCAMBIA1300 together with the fragment of the Cas9 expression cassette. For targeting of SlHAK20, the sgRNA was controlled by 35S promoter. The constructs were introduced into both a salt‐tolerant accession TS‐21 and a salt‐sensitive accession TS‐670 to generate slhak20 mutant plants. The homozygous slhak20 alleles were verified from T1 generation by PCR‐based sequencing. To target OsHAK4 and OsHAK17, the vector containing two sgRNAs under the control of OsU6 and OsU3 promoter, respectively, was transformed into japonica. cv. Nipponbare (NIP) to generate oshak4/17 double‐mutant rice. The homozygous double‐mutant alleles were verified from T1 generation by PCR‐based sequencing.
Functional analysis of SlHAK20 variants in yeast
The coding sequences of SlHAK20 Hap1 and SlHAK20 Hap2 were amplified and inserted into p416‐GPD vector, and the constructs were transformed into the Saccharomyces cerevisiae strains R5421 (Δtrk1::LEU2, Δtrk2::HIS3) and ANT3 (Δena1::HIS3::ena4, Δnha1::LEU2), respectively (Shi et al, 2002; Li et al, 2014). Yeast cell growth under K+‐deficient and K+‐sufficient conditions was determined in arginine–phosphate (AP) medium (10 mM l‐arginine, 8 mM H3PO4, 2 mM MgSO4, 0.2 mM CaCl2, 2% glucose, vitamins, and trace elements, pH 6.5) containing different concentrations of KCl. Na+‐tolerant tests were performed in AP growth medium with 1 mM KCl and supplemented with various concentrations of NaCl as noted.
For the analysis of yeast growth under different concentrations of K+, yeast colonies were cultured at 30°C overnight in 5 ml YPDA medium, until the OD600 reached 2.5. The yeast cells were collected and washed in AP medium for three times and then resuspended in deionized water with the OD600 3.0. The resuspended cells were transferred into 5 ml liquid AP medium containing different concentrations of KCl to adjust the OD600 values of the yeast cells to 0.1, and were shaken at 30°C. The OD600 values of the yeast cells were recorded after incubation for 20 h. The curve in the graph was obtained by applying nonlinear regression analysis.
Na+ uptake tests at micromolar concentrations were carried out by measuring the decrease in Na+ in the external AP medium. Yeast cells were grown in AP medium supplemented with 1 mM K+, washed in deionized water, and then starved in K+‐ and Na+‐free AP medium for 4 h. A final concentration of 60 μM NaCl was then added to the medium, and the yeast cells were cultured for 0, 2, 5, 10, 15, 20, 30, 40, 50, 60, and 90 min. For the analysis of Na+ uptake kinetics, yeast cells were suspended in K+‐ and Na+‐free AP medium to OD600 = 0.5, and then supplemented with NaCl to 0, 5, 10, 20, 30, 40, 50, 60, 100, 150, or 200 μM and incubated for 1 h. The yeast cells were removed by centrifugation, and the Na+ concentrations in the cell‐free medium were determined by atomic emission spectrometry after acidic extraction (Quintero et al, 2000). The amount of Na+ depleted from the medium was used for Na+ uptake kinetic analyses. The curves for Na+ uptake kinetics were generated by applying nonlinear regression analysis using the Michaelis–Menten equation in the GraphPad Prism (version 6.01) to obtain the K m and V max values. The uptake tests were repeated at least three times.
Quantitative real‐time PCR
Total RNA was extracted from samples using Total RNA Extraction Kit (Hua Yue Yang), and reverse transcription was performed by using the iScriptTM cDNA Synthesis Kit (Bio‐Rad). All quantitative real‐time PCR analyses were performed using the AceQ qPCR SYBR Green Master Mix (Vazyme) according to the manufacturer's protocol. Primer sequences used in this study are listed in Table EV7.
Ion content measurements in xylem sap
Plants were grown on 0.25× Hoagland solution for 21 days and then supplied with 50 mM NaCl for 1 or 2 days. To collect xylem sap, hypocotyl near the cotyledons was cut with a sharp razor blade (Shi et al, 2002). Drops of xylem sap that accumulated at the cutting surface of the hypocotyl were collected using a micropipette and later diluted directly in 5% HNO3 solution. Na+ and K+ contents were measured by an ICP‐MS (NexION 350D; PerkinElmer) coupled to an Apex desolation system and an SC‐4 DX autosampler (Elemental Scientific Inc., Omaha, NE, US).
Phenotype analysis
For salt resistance assay, tomato seedlings grown in a growth room with 16‐h light/8‐h dark period were treated with NaCl, and the plants were then subjected to measurements of plant height, fresh weight, and survival rate, etc. The oshak4/17 double‐mutant rice plants were grown in liquid medium in a growth room with a 16‐h light period at 23–27°C for 20 days and treated with 100 mM NaCl for additional 8 days. At least eight plants from each genotype were used for the salt tolerance analysis.
Analysis of potential off‐target mutations
The potential off‐target sites of the target sequences were predicted with the web tool Cas‐OFFinder (Bae et al, 2014) using the 19‐bp target sequence plus the PAM sequence (NGG). The potential off‐target sites containing 0–3 bp mismatch compared with the target sequence were selected for further analysis. Genomic DNA fragments (700–800 bp) encompassing the potential off‐target sites were amplified from T1 plants using specific primers (Table EV7). PCR products were analyzed by Sanger sequencing (Annoroad Gene Technology, Beijing). Twelve independent T1 plants were tested for each off‐target site.
Author contributions
SH and J‐KZ conceived the project. ZW, YH, GZ, SH, and J‐KZ designed the research. ZW, YH, JY, KH, and YZ performed most of the biological experiments. GZ and YL carried out the GWAS analysis. ZW, QN, and JB performed tomato transformation. ZW, GZ, YH, and HS performed the data analysis. ZW and HS drafted the manuscript. ZW, GZ, HS, SH, and J‐KZ revised the manuscript.
Conflict of interest
The authors declare that they have no conflict of interest.
Supporting information
Appendix
Expanded View Figures PDF
Table EV1
Table EV2
Table EV3
Table EV4
Table EV5
Table EV6
Table EV7
Dataset EV1
Dataset EV2
Dataset EV3
Dataset EV4
Dataset EV5
Review Process File
Acknowledgements
We thank Daiyin Chao (Institute of Plant Physiology and Ecology, SIBS, CAS) for his suggestions on ICP‐MS analysis and Yi Wang (China Agricultural University) for kindly providing yeast strains R5421. This work was supported by the Strategic Priority Research Program of the Chinese Academy of Sciences, Grant No. XDB27040101 to J.‐K.Z.
The EMBO Journal (2020) 39: e103256
See also: https://doi.org/10.15252/embj.2020104997 (May 2020)
Contributor Information
Sanwen Huang, Email: huangsanwen@caas.cn.
Jian‐Kang Zhu, Email: jkzhu@sibs.ac.cn.
References
- Alvarez‐Aragon R, Haro R, Benito B, Rodriguez‐Navarro A (2016) Salt intolerance in Arabidopsis: shoot and root sodium toxicity, and inhibition by sodium‐plus‐potassium overaccumulation. Planta 243: 97–114 [DOI] [PubMed] [Google Scholar]
- Al‐Younis I, Wong A, Gehring C (2015) The Arabidopsis thaliana K(+)‐uptake permease 7 (AtKUP7) contains a functional cytosolic adenylate cyclase catalytic centre. FEBS Lett 589: 3848–3852 [DOI] [PubMed] [Google Scholar]
- An D, Chen JG, Gao YQ, Li X, Chao ZF, Chen ZR, Li QQ, Han ML, Wang YL, Wang YF et al (2017) AtHKT1 drives adaptation of Arabidopsis thaliana to salinity by reducing floral sodium content. PLoS Genet 13: e1007086 [DOI] [PMC free article] [PubMed] [Google Scholar]
- Anschutz U, Becker D, Shabala S (2014) Going beyond nutrition: regulation of potassium homoeostasis as a common denominator of plant adaptive responses to environment. J Plant Physiol 171: 670–687 [DOI] [PubMed] [Google Scholar]
- Bae S, Park J, Kim JS (2014) Cas‐OFFinder: a fast and versatile algorithm that searches for potential off‐target sites of Cas9 RNA‐guided endonucleases. Bioinformatics 30: 1473–1475 [DOI] [PMC free article] [PubMed] [Google Scholar]
- Barragan V, Leidi EO, Andres Z, Rubio L, De Luca A, Fernandez JA, Cubero B, Pardo JM (2012) Ion exchangers NHX1 and NHX2 mediate active potassium uptake into vacuoles to regulate cell turgor and stomatal function in Arabidopsis . Plant Cell 24: 1127–1142 [DOI] [PMC free article] [PubMed] [Google Scholar]
- Barrett JC, Fry B, Maller J, Daly MJ (2005) Haploview: analysis and visualization of LD and haplotype maps. Bioinformatics 21: 263–265 [DOI] [PubMed] [Google Scholar]
- Bassil E, Tajima H, Liang YC, Ohto MA, Ushijima K, Nakano R, Esumi T, Coku A, Belmonte M, Blumwald E (2011) The Arabidopsis Na+/H+ antiporters NHX1 and NHX2 control vacuolar pH and K+ homeostasis to regulate growth, flower development, and reproduction (vol 23, pg 3482, 2011). Plant Cell 23: 4526 [DOI] [PMC free article] [PubMed] [Google Scholar]
- Baxter I, Brazelton JN, Yu DN, Huang YS, Lahner B, Yakubova E, Li Y, Bergelson J, Borevitz JO, Nordborg M et al (2010) A coastal cline in sodium accumulation in Arabidopsis thaliana is driven by natural variation of the sodium transporter AtHKT1;1. PLoS Genet 6: e1001193 [DOI] [PMC free article] [PubMed] [Google Scholar]
- Benito B, Garciadeblas B, Rodriguez‐Navarro A (2012) HAK transporters from physcomitrella patens and yarrowia lipolytica mediate sodium uptake. Plant Cell Physiol 53: 1117–1123 [DOI] [PubMed] [Google Scholar]
- Berthomieu P, Conejero G, Nublat A, Brackenbury WJ, Lambert C, Savio C, Uozumi N, Oiki S, Yamada K, Cellier F et al (2003) Functional analysis of AtHKT1 in Arabidopsis shows that Na+ recirculation by the phloem is crucial for salt tolerance. EMBO J 22: 2004–2014 [DOI] [PMC free article] [PubMed] [Google Scholar]
- Blumwald E (2000) Sodium transport and salt tolerance in plants. Curr Opin Cell Biol 12: 431–434 [DOI] [PubMed] [Google Scholar]
- Bolger A, Scossa F, Bolger ME, Lanz C, Maumus F, Tohge T, Quesneville H, Alseekh S, Sorensen I, Lichtenstein G et al (2014) The genome of the stress‐tolerant wild tomato species Solanum pennellii . Nat Genet 46: 1034–1038 [DOI] [PMC free article] [PubMed] [Google Scholar]
- Chao DY, Silva A, Baxter I, Huang YS, Nordborg M, Danku J, Lahner B, Yakubova E, Salt DE (2012) Genome‐wide association studies identify heavy metal ATPase3 as the primary determinant of natural variation in leaf cadmium in Arabidopsis thaliana . PLoS Genet 8: e1002923 [DOI] [PMC free article] [PubMed] [Google Scholar]
- Chao DY, Dilkes B, Luo HB, Douglas A, Yakubova E, Lahner B, Salt DE (2013) Polyploids exhibit higher potassium uptake and salinity tolerance in Arabidopsis . Science 341: 658–659 [DOI] [PMC free article] [PubMed] [Google Scholar]
- Desbrosses G, Kopka C, Ott T, Udvardi MK (2004) Lotus japonicus LjKUP is induced late during nodule development and encodes a potassium transporter of the plasma membrane. Mol Plant Microbe Interact 17: 789–797 [DOI] [PubMed] [Google Scholar]
- Hamamoto S, Horie T, Hauser F, Deinlein U, Schroeder JI, Uozumi N (2015) HKT transporters mediate salt stress resistance in plants: from structure and function to the field. Curr Opin Biotechnol 32: 113–120 [DOI] [PubMed] [Google Scholar]
- Hasegawa PM, Bressan RA, Zhu JK, Bohnert HJ (2000) Plant cellular and molecular responses to high salinity. Annu Rev Plant Physiol Plant Mol Biol 51: 463–499 [DOI] [PubMed] [Google Scholar]
- Hauser F, Horie T (2010) A conserved primary salt tolerance mechanism mediated by HKT transporters: a mechanism for sodium exclusion and maintenance of high K+/Na+ ratio in leaves during salinity stress. Plant, Cell Environ 33: 552–565 [DOI] [PubMed] [Google Scholar]
- Hua K, Tao XP, Yuan FT, Wang D, Zhu JK (2018) Precise A.T to G.C base editing in the rice genome. Mol Plant 11: 627–630 [DOI] [PubMed] [Google Scholar]
- Isayenkov SV, Maathuis FJM (2019) Plant salinity stress: many unanswered questions remain. Front Plant Sci 10: 80 [DOI] [PMC free article] [PubMed] [Google Scholar]
- Ishikawa T, Shabala S (2019) Control of xylem Na(+) loading and transport to the shoot in rice and barley as a determinant of differential salinity stress tolerance. Physiol Plant 165: 619–631 [DOI] [PubMed] [Google Scholar]
- Kang Y, Torres‐Jerez I, An ZW, Greve V, Huhman D, Krom N, Cui YH, Udvardi M (2019) Genome‐wide association analysis of salinity responsive traits in Medicago truncatula . Plant, Cell Environ 42: 1513–1531 [DOI] [PMC free article] [PubMed] [Google Scholar]
- Li RQ, Li YR, Fang XD, Yang HM, Wang J, Kristiansen K, Wang J (2009a) SNP detection for massively parallel whole‐genome resequencing. Genome Res 19: 1124–1132 [DOI] [PMC free article] [PubMed] [Google Scholar]
- Li RQ, Yu C, Li YR, Lam TW, Yiu SM, Kristiansen K, Wang J (2009b) SOAP2: an improved ultrafast tool for short read alignment. Bioinformatics 25: 1966–1967 [DOI] [PubMed] [Google Scholar]
- Li J, Long Y, Qi GN, Li J, Xu ZJ, Wu WH, Wang Y (2014) The Os‐AKT1 channel is critical for K+ uptake in rice roots and is modulated by the rice CBL1‐CIPK23 complex. Plant Cell 26: 3387–3402 [DOI] [PMC free article] [PubMed] [Google Scholar]
- Lin T, Zhu GT, Zhang JH, Xu XY, Yu QH, Zheng Z, Zhang ZH, Lun YY, Li S, Wang XX et al (2014) Genomic analyses provide insights into the history of tomato breeding. Nat Genet 46: 1220–1226 [DOI] [PubMed] [Google Scholar]
- Miao CB, Xiao LH, Huaa K, Zou C, Zhao Y, Bressan RA, Zhu JK (2018) Mutations in a subfamily of abscisic acid receptor genes promote rice growth and productivity. Proc Natl Acad Sci USA 115: 6058–6063 [DOI] [PMC free article] [PubMed] [Google Scholar]
- Munns R, Tester M (2008) Mechanisms of salinity tolerance. Annu Rev Plant Biol 59: 651–681 [DOI] [PubMed] [Google Scholar]
- Nieves‐Cordones M, Rodenas R, Chavanieu A, Rivero RM, Martinez V, Gaillard I, Rubio F (2016) Uneven HAK/KUP/KT protein diversity among angiosperms: species distribution and perspectives. Front Plant Sci 7: 127 [DOI] [PMC free article] [PubMed] [Google Scholar]
- Nieves‐Cordones M, Mohamed S, Tanoi K, Kobayashi NI, Takagi K, Vernet A, Guiderdoni E, Perin C, Sentenac H, Very AA (2017) Production of low‐Cs(+) rice plants by inactivation of the K(+) transporter OsHAK1 with the CRISPR‐Cas system. Plant J 92: 43–56 [DOI] [PubMed] [Google Scholar]
- Quintero FJ, Blatt MR, Pardo JM (2000) Functional conservation between yeast and plant endosomal Na+/H+ antiporters. FEBS Lett 471: 224–228 [DOI] [PubMed] [Google Scholar]
- Ren ZH, Gao JP, Li LG, Cai XL, Huang W, Chao DY, Zhu MZ, Wang ZY, Luan S, Lin HX (2005) A rice quantitative trait locus for salt tolerance encodes a sodium transporter. Nat Genet 37: 1141–1146 [DOI] [PubMed] [Google Scholar]
- Rubio F, Nieves‐Cordones M, Horie T, Shabala S (2019) Doing ‘business as usual’ comes with a cost: evaluating energy cost of maintaining plant intracellular K(+) homeostasis under saline conditions. New Phytol 225: 1097–1104 [DOI] [PubMed] [Google Scholar]
- Santa‐Maria GE, Oliferuk S, Moriconi JI (2018) KT‐HAK‐KUP transporters in major terrestrial photosynthetic organisms: a twenty years tale. J Plant Physiol 226: 77–90 [DOI] [PubMed] [Google Scholar]
- Sato S, Tabata S, Hirakawa H, Asamizu E, Shirasawa K, Isobe S, Kaneko T, Nakamura Y, Shibata D, Aoki K et al (2012) The tomato genome sequence provides insights into fleshy fruit evolution. Nature 485: 635–641 [DOI] [PMC free article] [PubMed] [Google Scholar]
- Schachtman DP, Schroeder JI (1994) Structure and transport mechanism of a high‐affinity potassium uptake transporter from higher plants. Nature 370: 655–658 [DOI] [PubMed] [Google Scholar]
- Shabala L, Ross T, McMeekin T, Shabala S (2006) Non‐invasive microelectrode ion flux measurements to study adaptive responses of microorganisms to the environment. FEMS Microbiol Rev 30: 472–486 [DOI] [PubMed] [Google Scholar]
- Shabala S, Cuin TA (2008) Potassium transport and plant salt tolerance. Physiol Plant 133: 651–669 [DOI] [PubMed] [Google Scholar]
- Shabala S, Pottosin I (2014) Regulation of potassium transport in plants under hostile conditions: implications for abiotic and biotic stress tolerance. Physiol Plant 151: 257–279 [DOI] [PubMed] [Google Scholar]
- Shabala S (2017) Signalling by potassium: another second messenger to add to the list? J Exp Bot 68: 4003–4007 [DOI] [PMC free article] [PubMed] [Google Scholar]
- Shabala S (2019) Linking ploidy level with salinity tolerance: NADPH‐dependent ‘ROS‐Ca2+ hub’ in the spotlight. J Exp Bot 70: 1063–1067 [DOI] [PMC free article] [PubMed] [Google Scholar]
- Shabala S, Chen G, Chen ZH, Pottosin I (2020) The energy cost of the tonoplast futile sodium leak. New Phytol 225: 1105–1110 [DOI] [PubMed] [Google Scholar]
- Shi HZ, Quintero FJ, Pardo JM, Zhu JK (2002) The putative plasma membrane Na+/H+ antiporter SOS1 controls long‐distance Na+ transport in plants. Plant Cell 14: 465–477 [DOI] [PMC free article] [PubMed] [Google Scholar]
- Takahashi R, Nishio T, Ichizen N, Takano T (2007) High‐affinity K+ transporter PhaHAK5 is expressed only in salt‐sensitive reed plants and shows Na+ permeability under NaCl stress. Plant Cell Rep 26: 1673–1679 [DOI] [PubMed] [Google Scholar]
- Tieman D, Zhu GT, Resende MFR, Lin T, Taylor M, Zhang B, Ikeda H, Liu ZY, Fisher J, Zemach I et al (2017) Plant science a chemical genetic roadmap to improved tomato flavor. Science 355: 391–394 [DOI] [PubMed] [Google Scholar]
- Van Eck J, Kirk DD, Walmsley AM (2006) Tomato (Lycopersicum esculentum). Methods Mol Biol 343: 459–473 [DOI] [PubMed] [Google Scholar]
- Vicente‐Agullo F, Rigas S, Desbrosses G, Dolan L, Hatzopoulos P, Grabov A (2004) Potassium carrier TRH1 is required for auxin transport in Arabidopsis roots. Plant J 40: 523–535 [DOI] [PubMed] [Google Scholar]
- Wang Z, Wang FX, Hong YC, Huang JR, Shi HZ, Zhu JK (2016) Two chloroplast proteins suppress drought resistance by affecting ROS production in guard cells. Plant Physiol 172: 2491–2503 [DOI] [PMC free article] [PubMed] [Google Scholar]
- Wu HH, Zhang XC, Giraldo JP, Shabala S (2018) It is not all about sodium: revealing tissue specificity and signalling roles of potassium in plant responses to salt stress. Plant Soil 431: 1–17 [Google Scholar]
- Wu HH, Shabala L, Zhou MX, Su NN, Wu Q, Ul‐Haq T, Zhu J, Mancuso S, Azzarello E, Shabala S (2019) Root vacuolar Na+ sequestration but not exclusion from uptake correlates with barley salt tolerance. Plant J 100: 55–67 [DOI] [PubMed] [Google Scholar]
- Yang M, Lu K, Zhao FJ, Xie WB, Ramakrishna P, Wang GY, Du QQ, Liang LM, Sun CJ, Zhao H et al (2018) Genome‐wide association studies reveal the genetic basis of ionomic variation in rice. Plant Cell 30: 2720–2740 [DOI] [PMC free article] [PubMed] [Google Scholar]
- Zhu JK (2002) Salt and drought stress signal transduction in plants. Annu Rev Plant Biol 53: 247–273 [DOI] [PMC free article] [PubMed] [Google Scholar]
- Zhu JK (2003) Regulation of ion homeostasis under salt stress. Curr Opin Plant Biol 6: 441–445 [DOI] [PubMed] [Google Scholar]
- Zhu JK (2016) Abiotic stress signaling and responses in plants. Cell 167: 313–324 [DOI] [PMC free article] [PubMed] [Google Scholar]
- Zhu GT, Wang SC, Huang ZJ, Zhang SB, Liao QG, Zhang CZ, Lin T, Qin M, Peng M, Yang CK et al (2018) Rewiring of the fruit metabolome in tomato breeding. Cell 172: 249–261 [DOI] [PubMed] [Google Scholar]
Associated Data
This section collects any data citations, data availability statements, or supplementary materials included in this article.
Supplementary Materials
Appendix
Expanded View Figures PDF
Table EV1
Table EV2
Table EV3
Table EV4
Table EV5
Table EV6
Table EV7
Dataset EV1
Dataset EV2
Dataset EV3
Dataset EV4
Dataset EV5
Review Process File


