

Abstract
Impairment of glucose (Glu) uptake and storage by skeletal muscle is a prime risk factor for the development of metabolic diseases. Heterogeneous nuclear ribonucleoprotein A1 (hnRNP A1) is a highly abundant RNA-binding protein that has been implicated in diverse cellular functions. The aim of this study was to investigate the function of hnRNP A1 on muscle tissue insulin sensitivity and systemic Glu homeostasis. Our results showed that conditional deletion of hnRNP A1 in the muscle gave rise to a severe insulin resistance phenotype in mice fed a high-fat diet (HFD). Conditional knockout mice fed a HFD showed exacerbated obesity, insulin resistance, and hepatic steatosis. In vitro interference of hnRNP A1 in C2C12 myotubes impaired insulin signal transduction and inhibited Glu uptake, whereas hnRNP A1 overexpression in C2C12 myotubes protected against insulin resistance induced by supraphysiological concentrations of insulin. The expression and stability of glycogen synthase (gys1) mRNA were also decreased in the absence of hnRNP A1. Mechanistically, hnRNP A1 interacted with gys1 and stabilized its mRNA, thereby promoting glycogen synthesis and maintaining the insulin sensitivity in muscle tissue. Taken together, our findings are the first to show that reduced expression of hnRNP A1 in skeletal muscle affects the metabolic properties and systemic insulin sensitivity by inhibiting glycogen synthesis.
Keywords: hnRNP A1, insulin resistance, hepatic steatosis, glycogen synthesis
Introduction
Insulin resistance is recognized as a characteristic feature of type 2 diabetes mellitus (T2D) and plays a major role in the development of the disease (Czech, 2017). In T2D, insulin-stimulated glucose (Glu) uptake is reduced by ~40% when compared with weight-matched nondiabetic controls (Hojlund, 2014; Wu et al., 2019). Previous study has suggested that a reduction in insulin-stimulated Glu disposal in skeletal muscle was an early defect associated with the pathogenesis of T2D (DeFronzo and Tripathy, 2009).
Skeletal muscle plays an important role in regulating whole body Glu homeostasis. Studies have shown that skeletal muscle is the major site of Glu uptake under insulin-stimulated conditions, accounting for ~85% of Glu disposal following a Glu infusion; indeed, skeletal muscle stores significantly more glycogen than does the liver (DeFronzo et al., 1981, 1985). Therefore, dysregulation of skeletal muscle metabolism can strongly influence whole-body Glu homeostasis and insulin sensitivity. Reductions in Glu disposal by skeletal muscle appear largely as decreased non-oxidative Glu metabolism, including glycogen synthesis (Kelley and Mandarino, 1990; Hojlund et al., 2003). Unsurprisingly, defects in insulin regulation of glycogen synthase (GS), a key enzyme of glycogen synthesis, are among the most common findings in the muscles of patients with T2D (Thorburn et al., 1990; Damsbo et al., 1991; Schalin-Jantti et al., 1992).
GS exists as two isoforms, and the muscle isoform is encoded by the gsy1 gene. One common variant of the gsy1 gene has been associated with insulin resistance and T2D (Savage et al., 2008). GS activity is controlled by allosteric effectors and by multiple-site phosphorylation. Phosphorylation leads to inactivation of GS, while dephosphorylation promotes the activation of GS (Skurat and Roach, 1995; Skurat et al., 2000). The activity of GS responds to insulin signaling from the insulin receptor by activation of a series of factors. Upon insulin binding, the insulin receptor undergoes autophosphorylation and tyrosine phosphorylates the insulin receptor substrate-1 (IRS-1) and IRS-2. These further recruit and activate PI3-Kinase and subsequently activate Akt, which finally leads to phosphorylation and inhibition of glycogen synthase kinase-3β (GSK-3β). Inhibition of GSK-3β further contributes to the dephosphorylation and activation of GS (Cross et al., 1995; Nikoulina et al., 2000; Hojlund et al., 2003). Akt activation also appears to be essential for effective insulin-stimulated Glu uptake, although the molecular link remains to be elucidated (Jiang et al., 2003).
Heterogeneous nuclear ribonucleoproteins (hnRNPs) are a large family of at least 20 RNA-binding nuclear proteins in mammalian cells (Mayeda and Krainer, 1992; Müller-McNicoll et al., 2019; Täuber et al., 2019). One highly abundant form is hnRNP A1, which has been implicated in diverse cellular functions related to RNA processing, including alternative splicing regulation (Tavanez et al., 2012; Zhou et al., 2013), mRNA export (Izaurralde et al., 1997), internal ribosome entry site-mediated translation (Bonnal et al., 2005), mRNA stability (Tavanez et al., 2012), and telomere maintenance (Hamilton et al., 1997; LaBranche et al., 1998; Zhang et al., 2006). HnRNP A1 can regulate mRNA gene expression by binding nascent pre-mRNA, and it can promote nuclear export of mature RNA and the translation process (Burd and Dreyfuss, 1994; Izaurralde et al., 1997; Cammas et al., 2007). HnRNP A1 has a reported involvement in smooth muscle differentiation and is suggested to be a critical regulator of vascular smooth muscle cell (VSMC) function and behavior in the context of neointima hyperplasia through its regulation of miR-124 (Huang et al., 2013; Zhang et al., 2017). However, the role of hnRNP A1 in skeletal muscle function during the development of T2D remains elusive.
In the present study, we report that hnRNP A1 expression is decreased in high-fat diet (HFD)-induced diabetic and ob/ob mice, suggesting that hnRNP A1 might play an important role in skeletal muscle function in T2D. Here, we use skeletal muscle conditional knockout hnRNP A1 mice to provide further clarification of the role of hnRNP A1 in maintaining in vivo muscle insulin sensitivity, especially under conditions of metabolic stress. Our results highlight the potential importance of hnRNP A1 in the insulin resistance associated with T2D.
Results
HnRNP A1 expression is decreased in skeletal muscle of diabetic mice and in insulin-resistant myotubes
We determined the relevance of hnRNP A1 to insulin resistance in the muscle by first detecting hnRNP A1 expression in skeletal muscle from HFD-induced diabetic mice and ob/ob mice. The mRNA level of hnRNP A1 was decreased in skeletal muscle from HFD mice and from ob/ob mice when compared to muscle from control mice (Figure 1A and B). The level of nuclear hnRNP A1 was also determined, since hnRNP A1 is an alternative splicing factor that mainly exerts its activity in the nucleus. As shown in Figure 1C–F, the nuclear levels of hnRNP A1 were also reduced in the muscle from both HFD and ob/ob mice.
Figure 1.
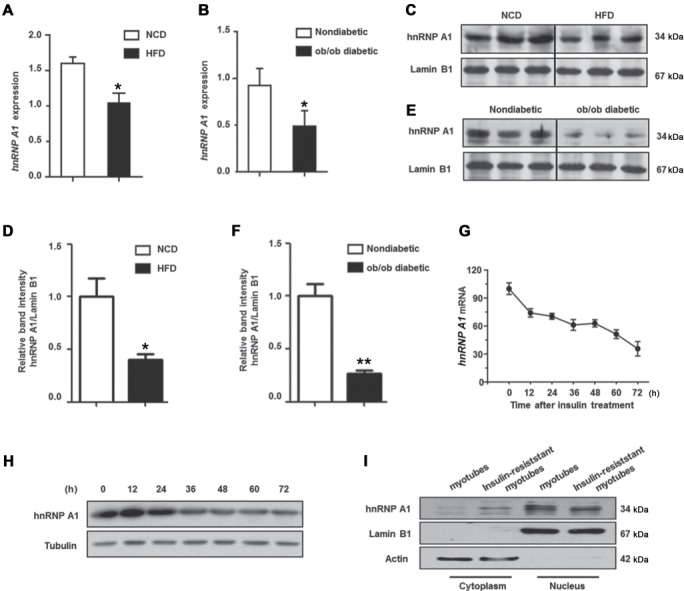
Expression of hnRNP A1 is decreased in insulin-resistant myotubes and diabetic mice muscle. (A and B) The mRNA levels of hnRNP A1 (normalized with Rn18s) in the muscle of diabetic mice was detected by qPCR. (A) hnRNP A1 expression in mice fed with 16-week HFD and mice fed with NCD. (B) hnRNP A1 expression in ob/ob male mice and nondiabetic mice. (C and D) Protein levels of hnRNP A1 in muscle nuclear extracts of HFD feeding mice and NCD mice. (E and F) Protein levels of hnRNP A1 in muscle nuclear extracts of ob/ob male mice and control mice. (G and H) C2C12 myoblasts were cultured in differentiation medium (DM) with 100 nM insulin to induce insulin resistance, and then cells were collected at 0, 12, 24, 36, 48, 60, and 72 h. Relative fold change of hnRNP A1 mRNA levels (G) and hnRNP A1 protein levels (H) were determined. (I) C2C12 myoblasts were cultured in DM with 100 nM insulin for 72 h, then hnRNP A1 expression was detected in nuclear and cytoplasmic extract. Values are mean ± standard error of mean (SEM). *P < 0.05, **P < 0.01 vs. control; n = 5.
We also evaluated the expression of hnRNP A1 in insulin-resistant C2C12 myotubes. C2C12 myoblasts were incubated with a supraphysiological concentration of insulin (100 nM) during differentiation to induce insulin resistance. The expression of hnRNP A1 was decreased during this incubation (Figure 1G–I), suggesting a downregulation of hnRNP A1 expression during the development of insulin resistance in muscle cells. Moreover, the expression of hnRNP A1 was detected during normal C2C12 cell differentiation. As shown in Supplementary Figure S1, both mRNA and protein level of hnRNP A1 did not change during cell differentiation, which indicates that hnRNP A1 does not change along with cell cycle changes during C2C12 differentiation, but only changed during the development of insulin resistance.
HnRNP A1 is essential for insulin sensitivity in C2C12 cells
We explored whether the decreased level of hnRNP A1 could account for the insulin resistance observed in muscle cells. HnRNP A1 expression in C2C12 myocytes was successfully knocked down by siRNA-hnRNP A1 (Figure 2A). As shown in Figure 2B, silencing of hnRNP A1 inhibited the insulin-stimulated activation of the IRS/Akt pathway, indicating impaired insulin sensitivity in C2C12 myotubes. By contrast, as shown in Figure 2C, overexpression of hnRNP A1 in insulin-resistant C2C12 myotubes restored the insulin-stimulated IRS and Akt phosphorylation, suggesting that hnRNP A1 protects C2C12 myotubes against supraphysiological concentration of insulin-induced insulin resistance. Skeletal muscle insulin resistance is characterized by a decreased cell membrane transportation of the insulin-dependent Glu transporter-4 (GLUT4) and ultimately leads to reduced Glu uptake. Therefore, we analyzed the effect of hnRNP A1 expression on Glu uptake in response to insulin stimulation in C2C12 cells. As shown in Figure 2D–F, Glu uptake was decreased in insulin-resistant myotubes as well as in hnRNP A1 knockdown myotubes. Moreover, overexpression of hnRNP A1 could rescue the Glu uptake reduction in insulin-resistant myotubes. We also observed that insulin-induced GLUT4 translocation from the cytoplasm to the membrane, but not its expression, was decreased in hnRNP A1 knockdown cells (Figure 2G and H). In addition, activation of ERK1/2, which has a suggested involvement in GLUT4 translocation, was also inhibited, whereas no difference in p-AMPK was detected (Figure 2H) in the hnRNP A1 knockdown cells. Thus, above data confirms that hnRNP A1 plays an important role in maintaining insulin sensitivity in C2C12 myocytes.
Figure 2.
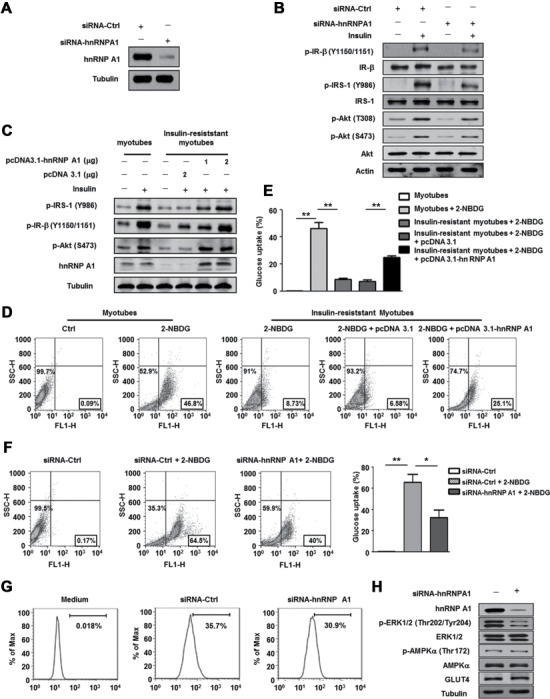
HnRNP A1 is essential for insulin sensitivity in C2C12 myotubes. (A) Protein level of hnRNP A1 was detected in C2C12 myoblasts treated with siRNA-Ctrl or siRNA-hnRNP A1. (B and C) Expressions of proteins involved in insulin signal pathway were tested in C2C12 myotubes transfected with siRNA-Ctrl or siRNA-hnRNP A1 (B), or transfected with pcDNA3.1 or pcDNA3.1-hnRNP A1 plasmids (C). After transfection, cells were maintained in differentiation culture for 3 days. Differentiated myotubes were stimulated with or without insulin (100 nM) for 10 min before collected. (D–F) 2-NBDG uptake was detected by flow cytometry in C2C12 myotubes. Insulin-resistant C2C12 myotubes (D) and (E) or C2C12 myotubes transfected with siRNA-Ctrl or siRNA-hnRNP A1 (F) were incubated with 100 μm fluorescent 2-NBDG at 37°C for 30 min, then cells were collected and 2-NBDG uptake was detected. (G) Translocation of GLUT4 from the cytoplasm to the membrane after insulin stimulation (100 nm) was detected by flow cytometry in C2C12 myotubes transfected with siRNA-Ctrl or siRNA-hnRNP A1 for 36 h. The images shown are representative of three independent experiments. (H) Protein levels of hnRNP A1, ERK1/2, p-ERK1/2, AMPK, p-AMPK, and GLUT4 were detected in C2C12 myotubes transfected with siRNA-Ctrl or siRNA-hnRNP A1. Values are mean ± SEM of three separate experiments. *P < 0.05, **P < 0.01 vs. control.
Loss of hnRNP A1 in skeletal muscle results in a greater severity of T2D and insulin resistance in HFD-fed mice
We assessed the role of hnRNP A1 in skeletal muscle by generating hnRNP A1 skeletal muscle cell (Ckmm-Cre) conditional knockout mice (hnRNP A1ckmm−/− mice; Supplementary Figure S2). Western blotting revealed no hnRNP A1 protein expression in the skeletal muscle of the hnRNP A1ckmm−/− mice, whereas expression of hnRNP A1 in other tissues was hardly affected (Figure 3A–C). Expression of hnRNP A1 was also markedly decreased in the heart tissues of the knockout mice, but no significant difference was observed in cardiac function between the knockout and wild-type (WT) littermates (Supplementary Figure S3). These data indicated the successful generation of hnRNP A1ckmm−/− mice. When fed a normal chow diet (NCD), the hnRNP A1ckmm−/− mice displayed a comparable physiological status to the WT mice. No significant differences were noted between the hnRNP A1ckmm−/− and WT mice in body weight, food intake, oxygen consumption rate, or skeletal muscle tissue morphology (Supplementary Figures S4 and S5). However, aging hnRNP A1ckmm−/− mice showed impaired Glu tolerance and insulin resistance (Supplementary Figure S6), suggesting that muscular hnRNP A1 plays an important role in maintaining whole-body Glu homeostasis.
Figure 3.

Loss of hnRNP A1 in skeletal muscle develops severer T2D and insulin resistance in mice. (A and B) The hnRNP A1 mRNA level (A) and protein level (B) were detected in skeletal muscle cells isolated from gastrocnemius of WT and hnRNP A1ckmm−/− mice. (C) The hnRNP A1 protein level in the liver and epididymal adipose from WT and hnRNP A1ckmm−/− mice. (D) Representative photo of one mouse in each group. (E) Body weight change of WT and hnRNP A1ckmm−/− mice during HFD feeding. (F) The representative photo of epididymal adipose tissue from the mice in each group. (G) The ratio of epididymal adipose weight to body weight. (H and I) Blood Glu and serum insulin levels of WT and hnRNP A1ckmm−/− mice after 12 h fasting. (J and K) GTT was performed on WT and hnRNP A1ckmm−/− mice, and the area under the curve (AUC) was calculated. (L–M) ITT was performed on WT and hnRNP A1ckmm−/− mice, and the AUC was calculated. Values are mean ± SEM. *P < 0.05, **P < 0.01 vs. WT; n = 5.
Subjecting hnRNP A1ckmm−/− mice and the WT littermates to 12 weeks of a HFD resulted in significant increases in body weight in the hnRNP A1ckmm−/− mice (Figure 3D and E) and in creased amounts of epididymal adipose tissue (Figure 3F and G). The hnRNP A1ckmm−/− mice also showed higher fasting blood Glu levels as well as increased fasting insulin levels (Figure 3H and I). The hnRNP A1ckmm−/− mice also exhibited a greater impairment of Glu tolerance and insulin sensitivity, as determined by Glu tolerance test (GTT) and insulin tolerance test (ITT) measurements, when compared with the WT littermates (Figure 3J–M). Therefore, conditional knockout of hnRNP A1 in skeletal muscle exacerbated HFD-induced obesity and insulin resistance.
HnRNP A1 deficiency in skeletal muscle exacerbates HFD-induced hepatic steatosis
HFD-induced obesity can lead to excess accumulation of lipid in the liver, and this process can be exacerbated by insulin resistance (Marchesini et al., 2005). Therefore, we also evaluated the impact of knockout of skeletal muscle hnRNP A1 on hepatic steatosis. The hnRNP A1ckmm−/− mice showed increased liver weights and enhanced liver weight to body weight ratios when compared with their WT littermates (Figure 4A and B). The hematoxylin and eosin (H&E)-stained sections from livers of the hnRNP A1ckmm−/− mice also showed a greater lipid accumulation when compared to the WT mice (Figure 4C). Significantly increased levels of triglyceride (TG) and total cholesterol (TC) were observed in liver tissues as well as in serum of the hnRNP A1ckmm−/− mice when compared with WT mice after a 16-week HFD feeding (Figure 4D–G). Hepatic steatosis is also closely associated with hepatic injury; therefore, the serum levels of aspartate aminotransferase (AST) and alanine aminotransferase (ALT) were also determined. As shown in Figure 4H and I, the levels of both AST and ALT were increased in the serum of hnRNP A1ckmm−/− mice when compared to the WT littermates. Increased hepatic TG accumulation could be a result of diminished fatty acid oxidation as well as increased de novo fatty acid synthesis. The mRNA levels of some genes related to fatty acid synthesis (fasn, dgat2, acc1, acc2, srebp1c, scd1, and pparg) were determined, and fasn as well as dgat2 were significantly increased due to hnRNP A1 conditional knockout in skeletal muscle (Figure 4J).
Figure 4.

HnRNP A1 deficiency in skeletal muscle exacerbates HFD-induced hepatic steatosis. (A) Representative image of liver of WT and hnRNP A1ckmm−/− mice with a HFD fed. (B) The ratio of liver weight to body weight. (C) H&E staining of the liver. Scale bar, 50 μm. (D and E) TG and cholesterol level in the liver. (F and G) TG and cholesterol level in serum. (H and I) AST and ALT level in serum. (J) Relative mRNA levels of genes involved in lipids metabolism in the liver. (K–N) Protein levels of phospho-eIF2α, ATF4, and CHOP were detected, and the relative band intensities (normalized with Tubulin) were calculated. (O–Q) Relative mRNA levels of Dnajb9, Hspa5, and Pdia3 (normalized with Rn18s) in the liver were analyzed by qPCR. (R and S) Relative mRNA levels of G6pc and Pck1 (normalized with Rn18s) in the liver were analyzed by qPCR. Values are mean ± SEM. *P < 0.05, **P < 0.01 vs. WT; n = 5.
Lipid accumulation in the liver, caused by consumption of high-calorie foods, has been reported to cause endoplasmic reticulum stress (Balakumar et al., 2016). The livers of hnRNP A1ckmm−/− mice showed increased expression at the protein level for p-elF2, ATF-4, and CHOP (Figure 4K–N), whereas the mRNA levels of molecular chaperones (Dnajb9, Hspa5, and Pdia3) were decreased (Figure 4O–Q). The liver plays an essential role in gluconeogenesis and glycolysis, and increased TG accumulation may also influence Glu homeostasis (Marchesini et al., 2005). As shown in Figure 4R and S, the expression of G6pc and Pck1 at the mRNA level was higher in livers of hnRNP A1ckmm−/− mice than in WT mice. Therefore, conditional knockout of hnRNP A1 in skeletal muscle appeared to exacerbate HFD-induced hepatic steatosis and injury.
Deletion of hnRNP A1 in skeletal muscle impairs insulin sensitivity by inhibiting glycogen synthesis in skeletal muscle
The observed in vitro insulin resistance caused by hnRNP A1 knock down in muscle cells was further explored by examining the insulin reaction of muscles from hnRNP A1ckmm−/− and WT mice with HFD feeding. Consistent with the in vitro results, the gastrocnemius muscles from hnRNP A1ckmm−/− mice showed reduced activation of the IR/Akt signaling pathway in response to portal vein-delivered insulin (Figure 5A–D). A reduction in non-oxidative Glu metabolism, as indicated by a decreased rate of glycogen storage, has been considered to be the main factor responsible for the insulin resistance in skeletal muscle (Beck-Nielsen, 1998). Analysis of the glycogen content in HFD-feeding hnRNP A1ckmm−/− and WT mice showed a tendency toward a decrease in glycogen content in hnRNP A1ckmm−/− mice (Figure 5E and F). The protein level of GS was also decreased, while the levels of the inactive phosphorylated form, phosphor-GS (p-GS), were increased in muscles of the hnRNP A1ckmm−/− mice (Figure 5G–I). Knockout of hnRNP A1 in skeletal muscle therefore appeared to impair insulin sensitivity by inhibiting glycogen synthesis.
Figure 5.

Loss of hnRNP A1 impairs insulin sensitivity through inhibiting glycogen synthesis in skeletal muscle. (A–D) After overnight fasting, HFD-fed mice were anesthetized and perfused with insulin through portal veins. The gastrocnemius were collected 5 min after perfusion. Proteins invloved in insulin signaling pathway were determined by western blot (A), and the relative band intensities were calculated (B–D). (E and F) Glycogen content in skeletal muscle of HFD-fed WT and hnRNP A1ckmm−/− mice was measured by PAS staining (E) and glycogen concentration was detected by biochemical assays (F). Scale bar, 100 μm. (G–I) Protein levels of GS and p-GS were detected in the muscle of HFD-fed WT and hnRNP A1ckmm−/− mice (G), and the relative band intensities were calculated (H–I). Values are mean ± SEM. *P < 0.05 vs. WT; n = 5.
HnRNP A1 interaction increases gys1 mRNA stability
The phosphorylation of GS leads to GS inactivation, and insulin signaling from the insulin receptor to GS involves the activation of a series of mediators that, in turn, lead to phosphorylation and inhibition of GSK-3 (Bogardus et al., 1984; Coghlan et al., 2000). We therefore examined the expression of GS and GSK-3β in C2C12 myotubes with or without insulin resistance. As shown in Figure 6A, the phosphorylation of GSK-3β after insulin stimulation was significantly inhibited in insulin-resistant myotubes, and the subsequent phosphorylation of GS was higher in the insulin-resistant myotubes than in the control insulin-sensitive myotubes. Similarly, reduced level of p-GSK-3β and increased level of p-GS were also observed in hnRNP A1 knockdown C2C12 cells (Figure 6B). More importantly, the levels of GS protein were reduced in both the insulin-resistant myotubes and the hnRNP A1 knockdown C2C12 cells. Quantitative polymerase chain reaction (PCR) revealed a significant reduction in the level of GS mRNA in the hnRNP A1 knockdown cells, which was due to a decreased stability of the GS mRNA (Figure 6C and D).
Figure 6.
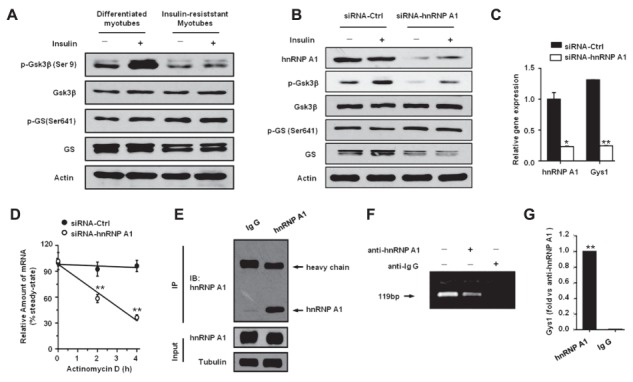
HnRNP A1 interacts with gys1 mRNA to increase its stability. (A and B) The expression levels of Gsk3, phospho-Gsk3, GS, and p-GS were detected in C2C12 myotubes. Cells were stimulated with or without insulin (100 nM) for 10 min before collection. Protein levels were detected in control or insulin-resistant C2C12 myotubes (A) or C2C12 myotubes transfected with siRNA-Ctrl or siRNA-hnRNP A1 (B). (C) The gene expression levels of Hnrnpa1 and Gys1 were determined in C2C12 myotubes transfected with siRNA-Ctrl or siRNA-hnRNP A1 for 48 h. (D) C2C12 myotubes were transfected with siRNA-Ctrl or siRNA-hnRNP A1 for 48 h and then treated with 10 μg/ml actinomycin D. Cells were collected at indicated time points, and mRNA levels of Gys1 (normalized with Actb) were determined by qPCR. (E–G) The mRNA IP of hnRNP A1. The lysis of C2C12 cells was incubated with anti-hnRNP A1 antibody or anti-IgG antibody at 4°C overnight. Immunoprecipitated hnRNP A1 from extracts of lysis was detected by western blot (E). The mRNA was extracted from the precipitate of protein A/G beads, and the genes were amplified with special primers through PCR (F) or real-time PCR (G). Values are mean ± SEM. *P < 0.05, **P < 0.01 vs. Ig G or siRNA-Ctrl; n = 3.
The possibility that hnRNP A1 expression enhanced gys1 stability by binding with the gys1 mRNA was examined by immunoprecipitation (IP) and PCR studies to detect the interaction between hnRNP A1 and gys1. As shown in Figure 6E–G, hnRNP A1 directly bound to gys1 and stabilized its mRNA, thereby increasing the level of GS protein. The absence of hnRNP A1 therefore caused a decrease in the stability of gys1 mRNA, which impaired the synthesis of glycogen in muscle cells (Figure 7) and ultimately exacerbated whole-body insulin resistance under HFD conditions.
Figure 7.

A model depicting the effect of hnRNP A1 knockout in the muscle on Glu homeostasis. HnRNP A1 directly binds with gys1 mRNA to increase the stability in muscle cells. Therefore, loss of hnRNP A1 leads to decreased GS expression and impairs glycogen storage, which finally results in decreased Glu disposal and insulin resistance in skelectal muscle. In hnRNP A1ckmm−/− mice, insulin fails to promote muscle Glu uptake, thereby directing Glu to de novo lipogenesis in the liver and causes hepatic steatosis, which finally exacerbates the whole-body insulin resistance under HFD conditions.
Discussion
In the present study, we addressed the physiological effects of hnRNP A1 on Glu homeostasis and insulin sensitivity both in vivo and in vitro. The absence of hnRNP A1 in skeletal muscle results in decreased glycogen storage and severer impaired insulin sensitivity as well as hepatic steatosis. Both in vitro and in vivo studies support a molecular mechanism involving a decreased expression of GS in the skeletal muscle that causes the impaired Glu homeostasis and insulin resistance observed in hnRNP A1ckmm−/− mice.
Decreased expression of hnRNP A1 in the skeletal muscle of diabetic mice and in insulin-resistant C2C12 myotubes indicated that hnRNP A1 might play a protective role that suppresses the development of insulin resistance and T2D. In vitro studies revealed that knockdown of hnRNP A1 impaired the insulin signal transduction in C2C12 cells. The final step in insulin signaling is Glu transportation, and GLUT4 is the major Glu transporter isoform expressed in skeletal muscle. Insulin-stimulated Glu uptake in skeletal muscle is accomplished by inducing translocation of GLUT4 from the cytoplasm to the membrane (Hirshman et al., 1990; Beck-Nielsen, 1998). Knockdown of hnRNP A1 in C2C12 myotubes caused a decrease in GLUT4 translocation, as well as a reduced Glu uptake in response to insulin. By contrast, overexpression of hnRNP A1 protected the C2C12 myotubes against insulin resistance induced by supraphysiological concentrations of insulin. For the in vivo studies, hnRNP A1 skeletal muscle cell (Ckmm-Cre) conditional knockout mice (hnRNP A1ckmm−/− mice) were generated. Considering that Cre recombinase had been reported previously to produce a phenotype on its own expression, we overexpressed Cre in C2C12 cells to further evaluate the effect of Cre on muscle cells. As shown in Supplementary Figure S7, Cre recombinase had no effect on the insulin signaling pathway or cell viability in C2C12 cells in vitro. Moreover, in a recent study, Batran et al. (2018) reported that although skeletal muscle-specific Cre recombinase (HSA-Cre) expression had a potential to improve Glu tolerance in HFD mice, Cre recombinase expression in the muscle had no effect on insulin sensitivity in mice.
Previous studies have demonstrated that hnRNP A1 is an important target antigen of the immune response in autoimmune diseases, and HnRNP A1 antibodies can be detected in the serum of patients with various autoimmune diseases, such as rheumatoid, systemic lupus erythematosus, and mixed connective tissue disease (Steiner et al., 1996; Caporali et al., 2005). Recently, a function of hnRNP A1 in muscle cells was postulated by Liu et al. (2017), who reported that hnRNP A1 played a critical and irreplaceable role in embryonic muscle development. They found hnRNP A1 knockout mice had muscle defects in the heart, tongue, diaphragm, and intercostal muscles and suggested that low protein levels of hnRNP A1 in hnRNP A1 heterozygous mice can result in cardiac function defects (Liu et al., 2017). In the present study, cardiac function was monitored and no significant differences were observed in cardiac function between the WT and hnRNP A1ckmm−/− mice. Another group studied and reported the function of hnRNP A1 in VSMC. They considered hnRNP A1 to be a novel regulator of VSMC phenotypic modulation and arterial remodeling (Zhang et al., 2017). However, no study has yet focused on the possibility that hnRNP A1 plays a role in skeletal muscle function and especially its function during the development of insulin resistance.
Despite that deletion of hnRNP A1 may lead to insulin resistance in the muscle, it is surprising to find that hnRNP A1ckmm−/− mice displayed comparable physiological status with their WT littermates at young age with NCD feeding. Interestingly, other mouse models of muscular insulin resistance also displayed similar phenotypes (Cettour-Rose et al., 2005; Ikonomov et al., 2013; Raun et al., 2018; Song et al., 2018). Raun et al. (2018) reported that despite a severe decrease in insulin-stimulated Glu uptake in skeletal muscles, they were surprising to find normal Glu tolerance and a very mild whole-body insulin-resistant state in the Rac1 muscle knockout mice. Although underlying mechanism is not fully elucidated, one explanation could be that the muscular insulin resistance might be partly compensated for by increased insulin-stimulated Glu transport activity in adipose tissue. However, metabolic stress can amplify the muscular insulin resistance and accelerate the onset of whole-body insulin resistance. Aging is a major risk factor for most chronic diseases, since individuals gradually lose their ability to maintain homeostasis with aging (Lopez-Otin et al., 2013). Therefore, impaired Glu homeostasis was gradually developed during aging in our study (Supplementary Figure S6). Moreover, hnRNP A1ckmm−/− mice also showed exacerbated obesity, hepatic steatosis, and insulin resistance in HFD conditions, and the gastrocnemius of hnRNP A1ckmm−/− mice showed reduced insulin sensitivity and suppressed Akt activation in response to portal vein-delivered insulin. Previous studies had demonstrated that insulin resistance in the muscle promoted redistribution of substrates to adipose tissue and led to increased adiposity (Kim et al., 2000). Consistently, more pronounced weight gain and enlarged adipose tissue was also observed in hnRNP A1 knockout mice with HFD feeding. In this study, greater adiposity, a subsequence of muscular hnRNP A1 deletion, in hnRNP A1 knockout mice may also contribute to the whole-body insulin resistance and hepatic steatosis. Therefore, we believe that deficiency of muscle hnRNP A1 may have both direct and indirect impact on the whole-body Glu hemostasis and finally lead to the insulin resistance and hepatic steatosis observed in the study.
The progression of insulin resistance can lead to metabolic syndromes, including nonalcoholic fatty liver disease and T2D (Wu et al., 2019). In HFD-induced insulin resistance, insulin fails to stimulate Glu uptake and disposal in muscle cells, thereby prompting de novo hepatic lipogenesis. Increased levels of insulin and Glu lead to increased expression of genes involved in de novo lipogenesis in the HFD-induced insulin-resistant state (Turner et al., 2013). Therefore, the increased levels of TG and cholesterol observed in the liver and serum of the hnRNP A1ckmm−/− mice were partly accounted for by the increased expression of lipogenesis genes, including Fasn and Dgat2. These results suggested that hepatic steatosis was exacerbated by the absence of hnRNP A1 in skeletal muscle, since more Glu was diverted to the liver for lipid storage.
Skeletal muscle accounts for 40% of the total body mass and contains 70%–80% of the total glycogen in the body. Therefore, muscle glycogen content has a major impact on whole-body metabolism. Improved Glu tolerance and insulin sensitivity has been observed in mice with enhanced glycogen content due to increased glycogen synthesis (Patel et al., 2008). Another study demonstrated that the protein level of GS was decreased in insulin-induced insulin resistance in C2C12 myotubes (Asrih and Jornayvaz, 2015). In the present study, the hnRNP A1ckmm−/− mice showed a decreased glycogen content in the muscle that was possibly caused by the decreased expression of GS in the skeletal muscle. The in vitro study further suggested that an interaction between hnRNP A1 and gys1 mRNA might increase the stability of the mRNA.
In conclusion, our current study provides new insight into the role of hnRNP A1 in skeletal muscle. This is the first demonstration of an important role for hnRNP A1 against the insulin resistance and hepatic steatosis induced by HFD. HnRNP A1 is critical for the maintenance of insulin sensitivity in muscle cells, as it can interact with gys1 mRNA to increase the mRNA stability. Therefore, specifically targeting hnRNP A1 or the hnRNP A1-gys1 interaction in skeletal muscle may be a promising therapeutic strategy for treating insulin resistance and the related metabolic dysfunctions.
Materials and methods
Mice
For the generation of hnRNP A1 skeletal muscle cell (Ckmm-Cre) conditional knockout mice (hnRNP A1ckmm−/− mice), we crossed hnRNP A1flox/flox with Ckmm-Cre transgenic mice. A simple schematic diagram is shown in Supplementary Figure S2. The PCR primers used for identification are listed in Supplementary Table S1. Mice were free access to pellet chow and tap water in a temperature-controlled room. The mice were kept on 12:12 h light–dark cycle. Animal welfare was ensured and all experiments were conformed to National Institutes of Health Guide for the Care and Use of Laboratory Animals. Experimental procedures were adhered to the Animal Care and Use Committee of Nanjing University. We made all efforts to minimize animals’ suffering.
Chemicals, regents, and antibodies
Anti-hnRNP A1, anti-ATF4, anti-CHOP, anti-Akt, anti-IRS-1, anti-Tubulin, and anti-GLUT4 were purchased from Santa Cruz. Anti-phospho-eIF2 (Ser51), anti-fatty acid synthase, anti-IR, anti-phospho-IR (Y1105/1151) anti-phospho-IRS-1 (Y986), anti-phospho-Akt (Ser473), anti-phospho-p44/42 MAPK (Erk1/2) (Thr202/Tyr204), anti-p44/42 MAPK (Erk1/2), anti-phospho-AMPKα (Thr172), anti-AMPKα, anti-phospho-Akt (Ser473), anti-phospho-IR (Y1105/1151), anti-IR, anti-GSK-3β (3D10), anti-GS, and anti-p-GS (Ser641) were purchased from Cell Signaling Technology. Anti-phospho-GSK-3β (Ser9) was purchased from Epitomics. Anti-Lamin B1 was purchased from Proteintech Group. Anti-Actin and anti-GAPDH were purchased from Abmart. Insulin was purchased from Wepon. 2-NBDG (2-(N-(7-nitrobenz-2-oxa-1,3-diazol-4-yl) Amino)-2-deoxyglucose) was purchased from Thermo Scientific. The siRNA-hnRNP A1 (m) and siRNA-Ctrl were purchased from Santa Cruz. TG test kit, Glu test kit, TC test kit, ALT, and AST test kits were purchased from Nanjing Jiancheng Bioengineering Institute. Insulin ELISA kit was purchased from ALPCO.
Animal models of diabetes
Male C57BL/6 mice aged 6–8 weeks or skeletal muscle conditional knockout hnRNP A1 mice were randomly divided into NCD and HFD according to body weight after adaptive feeding for 1 week. Mice were fed with NCD (10 kcal% fat) or HFD (60 kcal% fat) for 16 weeks; the food intake and bodyweight were recorded every week. Upon leptin defective type spontaneous diabetes models, both ob/ob and control male mice of the same litter aged 8 weeks were given maintenance feed; the bodyweight were recorded weekly.
Biochemical analyses
Glu level in whole blood from tail vein was measured using a Glu meter (LifeScan, Inc.). Plasma insulin level was assayed using a Mouse High Range Insulin ELISA Kit (ALPCO). The concentrations of ALT, AST, TG, and cholesterol were measured using enzymatic kits (Nanjing Jiancheng Bioengineering Institute) according to the manufacture’s protocols.
Primary isolation and culture of skeletal muscle cells
Primary skeletal muscle cells were isolated from neonatal mice (2–5 days old). In brief, the forelimbs and hindlimbs were removed from neonatal mice, and the bones were dissected away. The remaining muscles were minced finely using a sterile razor blade, washed with Hank’s solution for three times, and then digested with 0.25% trypsin–EDTA for 20 min at 37 °C in an incubator. Afterwards, the digestive fluids were filtered through a 70 μm nylon cell strainer (Falcon). The filtered cells were collected and washed with a basic medium (Dulbecco’s modified Eagle’s medium [DMEM]/F12 supplemented with 10% fetal bovine serum [FBS]) twice. The washed cells were seeded onto culture flasks in the basic medium and incubated at 37 °C in a humidified atmosphere containing 5% CO2 in the air. After 1 h, the supernatant-containing suspended cells were transferred into new plates to remove the nonskeletal muscle cells. Thereafter, the basic medium was replaced every 2 days. When 90% confluence was reached, cells were collected and frozen in liquid N2 until used.
C2C12 myoblasts culture and differentiation
Murine myoblast cell line C2C12 was purchased at the Chinese Academy of Sciences Shanghai Cell Library, maintained in DMEM, supplemented with 10% FBS, 100 U/ml penicillin, and 100 mg/ml streptomycin at 37°C in a humidified incubator (5% CO2). For cell differentiation, C2C12 myoblast cells were allowed to grow in 6-well plates to 50% confluence. Then cells were maintained in growth medium (DMEM supplemented with 10% FBS) and change medium every 24 h until the cells were 80% confluent. Then myoblasts were induced differentiation into myotubes with differentiation medium (DM; DMEM supplemented with 2% horse serum) or DM with insulin (DM with 100 nM insulin). The mediums were changed every 12 h. After 48 h of incubation, C2C12 myotubes were used for the subsequent experiments.
ITT and GTT
Mice were fasted for 4 h before intraperitoneal injection of insulin (0.75 units/kg body weight) for ITT and fasted for 12 h before Glu (1 g/kg body weight) for GTT. Blood Glu in tail veins were measured by a blood glucometer (OneTouch) at indicated time points after the injection.
Histological analysis
Liver sections were embedded in paraffin and then stained using H&E to visualize the pattern of lipid accumulation. To determine the glycogen content of the tissues, Periodic Acid–Schiff (PAS) staining was performed using paraffin-prepared liver sections.
Short interfering RNA (siRNA) transfections
The well-growing C2C12 myoblast cells were seeded into 6-well plates with the adjusted density of 2.0 × 10⁵ cells/well 24 h before transfection. When grew to 50% confluent, cells were transfected by Lipofectamine® 2000 according to the manufacturer’s instruction. Briefly, 3 μl siRNA-hnRNP A1 or siRNA-Ctrl was dissolved in 50 μl transfection buffer (Opti-MEM reduced serum medium). Lipofectamine® 2000 (3 μl) was diluted in 50 μl transfection buffer. The diluted siRNA-hnRNP A1 or siRNA-Ctrl was added to the cationic lipids solution and incubated for 20 min. After 20 min the resulting mixture was added to the myoblasts. The myoblasts were incubated for 6 h at 37°C in humidified air, and then the medium containing the transfection complexes was removed from each well and replaced with 2 ml of complete growth medium (DMEM with 10% serum). If not stated otherwise, C2C12 myoblasts were cultured for an additional 48 h and then were used for the subsequent experiments.
Glu uptake assay in cells
Insulin-stimulated Glu uptake activity was measured using 2-NBDG in C2C12 cells. In detail, cells were cultured in no-Glu DMEM for 3 h before the addition of 2-NBDG and insulin. After incubation for 3 h, the culture medium was removed from each well and the cells were washed with ice-cold Dulbecco's phosphate-buffered saline (DPBS) twice. The cells were incubated with 100 nM insulin in no-Glu DMEM for 10 min and 100 μm 2-NBDG was added to the medium for another 30 min. Then, discarded the medium and washed the cell twice with cold DPBS to remove free 2-NBDG. The cells in each well were suspended with DPBS after trypsinization and subsequently transferred to flow tube. Fluorescence was measured in a FACSCalibur Analyzer (BD Immunocytometry Systems).
GLUT4 translocation assay
The translocation of GLUT4 from the cytoplasm to the plasma membrane of cells was measured by flow cytometry. Briefly, cells were serum starved overnight and seeded into 24-well plate with the density of 1.0 × 10⁵ per well in 0.5 ml serum-free medium and incubated for 2 h at 37°C in humidified air to recover from trypsinization. Then, mixed the primary anti-GLUT4 antibody with secondary chicken anti-goat IgG antibody (conjugated to AlexaFluor 488) and incubated for 10 min at room temperature in the dark. Then, gently added the antibody conjugate and 100 nM insulin to the wells and incubated at 37°C in humidified air for 30 min, avoiding any turbulence of the medium. The cells were fixed with 1% paraformaldehyde (PFA) at room temperature after 20 min incubation in the dark. Afterward, the cells were collected and washed twice with 1 ml cold DPBS and suspended with 0.4 ml DPBS + 1% PFA. Fluorescence was measured in a FACSCalibur Analyzer.
Quantitative reverse-transcriptase PCR
The mRNA levels were analyzed by quantitative reverse-transcriptase PCR (qRT-PCR) as previous reported (Zhao et al., 2019). Briefly, total RNA was separated using TriZol reagent (Invitrogen), cDNA was synthesized using the PrimeScript RT reagent Kits (TaKaRa) according to the manufacturer’s directions. The qRT-PCR was performed with SYBR Premix Ex Taq (TaKaRa) and CFX96 Real-time system (Bio-Rad). The mRNA level was normalized to β-actin. The primer sequences used in PCR were in Supplementary Table S1.
Western blotting
Proteins were separated using 10% SDS-PAGE gels and then transferred to PVDF membranes. After the membranes were blocked in 5% skim milk, they were incubated overnight at 4°C with primary antibodies and then for 1 h at room temperature with the corresponding secondary antibodies. The protein levels were normalized to the levels of Tubulin, Actin, or GAPDH.
mRNA IP assay
mRNA IP was performed using Magna RIP™ RNA-Binding Protein Immunoprecipitation Kit from Merk Millipore (Billerica, MA, USA). Briefly, C2C12 cells were lyzed in ice-cold IP buffer. The cell lysates were incubated with the indicated antibody-conjugated beads at 4°C overnight. The mRNA was extracted from the precipitate of protein A/G beads, and the genes were amplified with special primers through PCR or real-time PCR.
Statistical analysis
All statistical analyses were performed using SPSS software (version 19.0). All data in this study are expressed as the mean ± SEM. For data that showed a normal distribution and homogeneity of variance, one-way analysis of variance was performed for comparisons among more than two groups using a Bonferroni analysis. Two-tailed Student’s t-tests were performed to evaluate significant differences between two groups. P<0.05 was considered significant.
Supplementary material
Supplementary material is available at Journal of Molecular Cell Biology online.
Supplementary Material
Acknowledgements
We thank all the laboratory members for insightful discussion during the course of this study.
Funding
This work was supported by the National Natural Science Foundation of China (81673436, 91853109, 81872877, and 91229109), the open fund of State Key Laboratory of Drug Research (SIMM1903KF-10), and the Mountain-Climbing Talents Project of Nanjing University to Y.S.
Conflict of interest: none declared.
Reference
- Asrih M., and Jornayvaz F.R. (2015). Metabolic syndrome and nonalcoholic fatty liver disease: is insulin resistance the link? Mol. Cell. Endocrinol. 1, 55–65. [DOI] [PubMed] [Google Scholar]
- Balakumar M., Raji L., Prabhu D., et al. (2016). High-fructose diet is as detrimental as high-fat diet in the induction of insulin resistance and diabetes mediated by hepatic/pancreatic endoplasmic reticulum (ER) stress. Mol. Cell. Biochem. 423, 93–104. [DOI] [PubMed] [Google Scholar]
- Batran R.A., Gopal K., Martin M.D., et al. (2018). Skeletal muscle-specific Cre recombinase expression, controlled by the human α-skeletal actin promoter, improves glucose tolerance in mice fed a high-fat diet. Diabetologia 61, 1849–1855. [DOI] [PubMed] [Google Scholar]
- Beck-Nielsen H. (1998). Mechanisms of insulin resistance in non-oxidative glucose metabolism: the role of glycogen synthase. J. Basic Clin. Physiol. Pharmacol. 9, 255–279. [DOI] [PubMed] [Google Scholar]
- Bogardus C., Lillioja S., Stone K., et al. (1984). Correlation between muscle glycogen synthase activity and in vivo insulin action in man. J. Clin. Invest. 73, 1185–1190. [DOI] [PMC free article] [PubMed] [Google Scholar]
- Bonnal S., Pileur F., Orsini C., et al. (2005). Heterogeneous nuclear ribonucleoprotein A1 is a novel internal ribosome entry site trans-acting factor that modulates alternative initiation of translation of the fibroblast growth factor 2 mRNA. J. Biol. Chem. 280, 4144–4153. [DOI] [PubMed] [Google Scholar]
- Burd C.G., and Dreyfuss G. (1994). RNA binding specificity of hnRNP A1: significance of hnRNP A1 high-affinity binding sites in pre-mRNA splicing. EMBO J. 13, 1197–1204. [DOI] [PMC free article] [PubMed] [Google Scholar]
- Cammas A., Pileur F., Bonnal S., et al. (2007). Cytoplasmic relocalization of heterogeneous nuclear ribonucleoprotein A1 controls translation initiation of specific mRNAs. Mol. Biol. Cell 18, 5048–5059. [DOI] [PMC free article] [PubMed] [Google Scholar]
- Caporali R., Bugatti S., Bruschi E., et al. (2005). Autoantibodies to heterogeneous nuclear ribonucleoproteins. Autoimmunity 38, 25–32. [DOI] [PubMed] [Google Scholar]
- Cettour-Rose P., Samec S., Russell A.P., et al. (2005). Redistribution of glucose from skeletal muscle to adipose tissue during catch-up fat: a link between catch-up growth and later metabolic syndrome. Diabetes 54, 751–756. [DOI] [PubMed] [Google Scholar]
- Coghlan M.P., Culbert A.A., Cross D.A., et al. (2000). Selective small molecule inhibitors of glycogen synthase kinase-3 modulate glycogen metabolism and gene transcription. Chem. Biol. 7, 793–803. [DOI] [PubMed] [Google Scholar]
- Cross D.A., Alessi D.R., Cohen P., et al. (1995). Inhibition of glycogen synthase kinase-3 by insulin mediated by protein kinase B. Nature 378, 785–789. [DOI] [PubMed] [Google Scholar]
- Czech M.P. (2017). Insulin action and resistance in obesity and type 2 diabetes. Nat. Med. 23, 804–814. [DOI] [PMC free article] [PubMed] [Google Scholar]
- Damsbo P., Vaag A., Hother-Nielsen O., et al. (1991). Reduced glycogen synthase activity in skeletal muscle from obese patients with and without type 2 (non-insulin-dependent) diabetes mellitus. Diabetologia 34, 239–245. [DOI] [PubMed] [Google Scholar]
- DeFronzo R.A., Gunnarsson R., Bjorkman O., et al. (1985). Effects of insulin on peripheral and splanchnic glucose metabolism in noninsulin-dependent (type II) diabetes mellitus. J. Clin. Invest. 76, 149–155. [DOI] [PMC free article] [PubMed] [Google Scholar]
- DeFronzo R.A., Jacot E., Jequier E., et al. (1981). The effect of insulin on the disposal of intravenous glucose. Results from indirect calorimetry and hepatic and femoral venous catheterization. Diabetes 30, 1000–1007. [DOI] [PubMed] [Google Scholar]
- DeFronzo R.A., and Tripathy D. (2009). Skeletal muscle insulin resistance is the primary defect in type 2 diabetes. Diabetes Care 32(Suppl 2), S157–S163. [DOI] [PMC free article] [PubMed] [Google Scholar]
- Hamilton B.J., Burns C.M., Nichols R.C., et al. (1997). Modulation of AUUUA response element binding by heterogeneous nuclear ribonucleoprotein A1 in human T lymphocytes. The roles of cytoplasmic location, transcription, and phosphorylation. J. Biol. Chem. 272, 28732–28741. [DOI] [PubMed] [Google Scholar]
- Hirshman M.F., Goodyear L.J., Wardzala L.J., et al. (1990). Identification of an intracellular pool of glucose transporters from basal and insulin-stimulated rat skeletal muscle. J. Biol. Chem. 265, 987–991. [PubMed] [Google Scholar]
- Hojlund K. (2014). Metabolism and insulin signaling in common metabolic disorders and inherited insulin resistance. Dan. Med. J. 61, B4890. [PubMed] [Google Scholar]
- Hojlund K., Staehr P., Hansen B.F., et al. (2003). Increased phosphorylation of skeletal muscle glycogen synthase at NH2-terminal sites during physiological hyperinsulinemia in type 2 diabetes. Diabetes 52, 1393–1402. [DOI] [PubMed] [Google Scholar]
- Huang Y., Lin L., Yu X., et al. (2013). Functional involvements of heterogeneous nuclear ribonucleoprotein A1 in smooth muscle differentiation from stem cells in vitro and in vivo. Stem Cells 31, 906–917. [DOI] [PubMed] [Google Scholar]
- Ikonomov O.C., Sbrissa D., Delvecchio K., et al. (2013). Muscle-specific Pikfyve gene disruption causes glucose intolerance, insulin resistance, adiposity, and hyperinsulinemia but not muscle fiber-type switching. Am. J. Physiol. Endocrinol. Metab. 305, E119–E131. [DOI] [PMC free article] [PubMed] [Google Scholar]
- Izaurralde E., Jarmolowski A., Beisel C., et al. (1997). A role for the M9 transport signal of hnRNP A1 in mRNA nuclear export. J. Cell Biol. 137, 27–35. [DOI] [PMC free article] [PubMed] [Google Scholar]
- Jiang Z.Y., Zhou Q.L., Coleman K.A., et al. (2003). Insulin signaling through Akt/protein kinase B analyzed by small interfering RNA-mediated gene silencing. Proc. Natl Acad. Sci. USA 100, 7569–7574. [DOI] [PMC free article] [PubMed] [Google Scholar]
- Kelley D.E., and Mandarino L.J. (1990). Hyperglycemia normalizes insulin-stimulated skeletal muscle glucose oxidation and storage in noninsulin-dependent diabetes mellitus. J. Clin. Invest. 86, 1999–2007. [DOI] [PMC free article] [PubMed] [Google Scholar]
- Kim J.K., Michael M.D., Previs S.F., et al. (2000). Redistribution of substrates to adipose tissue promotes obesity in mice with selective insulin resistance in muscle. J. Clin. Invest. 105, 1791–1797. [DOI] [PMC free article] [PubMed] [Google Scholar]
- LaBranche H., Dupuis S., Ben-David Y., et al. (1998). Telomere elongation by hnRNP A1 and a derivative that interacts with telomeric repeats and telomerase. Nat. Genet. 19, 199–202. [DOI] [PubMed] [Google Scholar]
- Liu T.Y., Chen Y.C., Jong Y.J., et al. (2017). Muscle developmental defects in heterogeneous nuclear ribonucleoprotein A1 knockout mice. Open Biol. 7, 160303. [DOI] [PMC free article] [PubMed] [Google Scholar]
- Lopez-Otin C., Blasco M.A., Partridge L., et al. (2013). The hallmarks of aging. Cell 153, 1194–1217. [DOI] [PMC free article] [PubMed] [Google Scholar]
- Marchesini G., Marzocchi R., Agostini F., et al. (2005). Nonalcoholic fatty liver disease and the metabolic syndrome. Curr. Opin. Lipidol. 16, 421–427. [DOI] [PubMed] [Google Scholar]
- Mayeda A., and Krainer A.R. (1992). Regulation of alternative pre-mRNA splicing by hnRNP A1 and splicing factor SF2. Cell 68, 365–375doi:10.1016/0092-8674(92)90477-T. [DOI] [PubMed] [Google Scholar]
- Nikoulina S.E., Ciaraldi T.P., Mudaliar S., et al. (2000). Potential role of glycogen synthase kinase-3 in skeletal muscle insulin resistance of type 2 diabetes. Diabetes 49, 263–271. [DOI] [PubMed] [Google Scholar]
- Müller-McNicoll M., Rossbach O., Hui J., et al. (2019). Auto-regulatory feedback by RNA-binding proteins. J. Mol. Cell Biol. doi: 10.1093/jmcb/mjz043. [DOI] [PMC free article] [PubMed] [Google Scholar]
- Patel S., Doble B.W., MacAulay K., et al. (2008). Tissue-specific role of glycogen synthase kinase 3β in glucose homeostasis and insulin action. Mol. Cell. Biol. 28, 6314–6328. [DOI] [PMC free article] [PubMed] [Google Scholar]
- Raun S.H., Ali M., Kjøbsted R., et al. (2018). Rac1 muscle knockout exacerbates the detrimental effect of high-fat diet on insulin-stimulated muscle glucose uptake independently of Akt. J. Phys. 596, 2283–2299. [DOI] [PMC free article] [PubMed] [Google Scholar]
- Savage D.B., Zhai L., Ravikumar B., et al. (2008). A prevalent variant in PPP1R3A impairs glycogen synthesis and reduces muscle glycogen content in humans and mice. PLoS Med. 5, e27. [DOI] [PMC free article] [PubMed] [Google Scholar]
- Schalin-Jantti C., Harkonen M., and Groop L.C. (1992). Impaired activation of glycogen synthase in people at increased risk for developing NIDDM. Diabetes 41, 598–604. [DOI] [PubMed] [Google Scholar]
- Skurat A.V., Dietrich A.D., and Roach P.J. (2000). Glycogen synthase sensitivity to insulin and glucose-6-phosphate is mediated by both NH2- and COOH-terminal phosphorylation sites. Diabetes 49, 1096–1100. [DOI] [PubMed] [Google Scholar]
- Skurat A.V., and Roach P.J. (1995). Phosphorylation of sites 3a and 3b (Ser640 and Ser644) in the control of rabbit muscle glycogen synthase. J. Biol. Chem. 270, 12491–12497. [DOI] [PubMed] [Google Scholar]
- Song S., Wen Y., Tong H., et al. (2019). The HDAC3 enzymatic activity regulates skeletal muscle fuel metabolism. J. Mol. Cell Biol. 11,133–143. [DOI] [PMC free article] [PubMed] [Google Scholar]
- Steiner G., Skriner K., Hassfeld W., et al. (1996). Clinical and immunological aspects of autoantibodies to RA33/hnRNP-A/B proteins—a link between RA, SLE and MCTD. Mol. Biol. Rep. 23, 167–171. [DOI] [PubMed] [Google Scholar]
- Täuber H., Hüttelmaier S., and Köhn M. (2019). POLIII-derived non-coding RNAs acting as scaffolds and decoys. J. Mol. Cell Biol. doi: 10.1093/jmcb/mjz049. [DOI] [PMC free article] [PubMed] [Google Scholar]
- Tavanez J.P., Madl T., Kooshapur H., et al. (2012). hnRNP A1 proofreads 3′ splice site recognition by U2AF. Mol. Cell 45, 314–329. [DOI] [PubMed] [Google Scholar]
- Thorburn A.W., Gumbiner B., Bulacan F., et al. (1990). Intracellular glucose oxidation and glycogen synthase activity are reduced in non-insulin-dependent (type II) diabetes independent of impaired glucose uptake. J. Clin. Invest. 85, 522–529. [DOI] [PMC free article] [PubMed] [Google Scholar]
- Turner N., Kowalski G.M., Leslie S.J., et al. (2013). Distinct patterns of tissue-specific lipid accumulation during the induction of insulin resistance in mice by high-fat feeding. Diabetologia 56, 1638–1648. [DOI] [PubMed] [Google Scholar]
- Wu T., Zhang Q., Wu S., et al. (2019). CILP-2 is a novel secreted protein and associated with insulin resistance. J. Mol. Cell Biol. doi: 10.1093/jmcb/mjz016. [DOI] [PMC free article] [PubMed] [Google Scholar]
- Zhang L., Chen Q., An W., et al. (2017). Novel pathological role of hnRNPA1 (heterogeneous nuclear ribonucleoprotein A1) in vascular smooth muscle cell function and neointima hyperplasia. Arterioscler. Thromb. Vasc. Biol. 37, 2182–2194. [DOI] [PMC free article] [PubMed] [Google Scholar]
- Zhang Q.S., Manche L., Xu R.M., et al. (2006). hnRNP A1 associates with telomere ends and stimulates telomerase activity. RNA 12, 1116–1128. [DOI] [PMC free article] [PubMed] [Google Scholar]
- Zhao M.X., Guo W.J., Wu Y.Y., et al. (2019). SHP2 inhibition triggers anti-tumor immunity and synergizes with PD-1 blockade. Acta Pharm. Sin. B 9, 304–315. [DOI] [PMC free article] [PubMed] [Google Scholar]
- Zhou Z.J., Dai Z., Zhou S.L., et al. (2013). Overexpression of HnRNP A1 promotes tumor invasion through regulating CD44v6 and indicates poor prognosis for hepatocellular carcinoma. Int. J. Cancer 132, 1080–1089. [DOI] [PubMed] [Google Scholar]
Associated Data
This section collects any data citations, data availability statements, or supplementary materials included in this article.