

A novel coronavirus disease 2019 (COVID-19) emerged around December 2019 in Wuhan, China and has spread rapidly worldwide (Lu et al., 2020). Until March 27, 2020, the Chinese health authorities had reported 82082 confirmed COVID-19 cases in China with 3298 deaths and 381443 confirmed cases with 20787 deaths outside China. The World Health Organization (WHO) named the virus SARS-CoV-2, which belongs to a distinct clade from the human severe acute respiratory syndrome CoV (SARS-CoV) and Middle East respiratory syndrome CoV (MERS-CoV) (Zhu et al., 2020). At present, there is no effective therapy against this new virus. Identifying effective antiviral agents to treat the COVID-19 is of most urgency.
Coronavirus relies on cellular machinery to replicate itself, thus providing a rationale to search for effective therapies among agents that may impact pathways required for the viral life cycle. The vesicular trafficking system plays a critical role in viral entry, unpacking, assembly, and packaging. Among agents that can interfere with normal vesicular trafficking are several drugs approved for human therapies. A well-known antimalaria drug, Chloroquine, stands out as one of the earliest reagents that can block vesicular trafficking and also interfere with the life cycle of parasites and viruses (Savarino et al., 2006; Delvecchio et al., 2016; Zhang et al., 2019; Zhou et al., 2020). In vitro, Chloroquine is effective in inhibiting the replication of SARS-CoV (Keyaerts et al., 2004), HCoV-229E (Kono et al., 2008), and the newly discovered SARS-CoV-2 (previously known as 2019-nCoV) (Wang et al., 2020). Therefore, Chloroquine may be repurposed for COVID-19 as an emergency therapy.
From January 27, 2020 to February 15, 2020, we initiated a clinical study to evaluate the efficacy and safety of Chloroquine in hospitalized patients with COVID-19. At that time, Lopinavir/Ritonavir, a protease inhibitor treatment combination for HIV infection, had been recommended for treating COVID-19 according to the diagnosis and treatment guidelines of novel coronavirus pneumonia (NCP) (World Health Organization, 2020) by the National Health Commission of the People’s Republic of China. Therefore, we included Lopinavir/Ritonavir treatment as a control group. In our study, efficacy was evaluated by (i) real-time polymerase chain reaction (RT-PCR) for measuring COVID-19 viral RNAs, (ii) lung computerized tomography (CT) for assessing the improvement of NCP, and (iii) length of hospitalization for assessing patient recovery. Safety was evaluated by adverse event monitoring. Here, we report our initial results on Chloroquine therapy of COVID-19 patients.
Firstly, among the 82 patients screened, 22 met the enrollment criteria (Figure 1A; Supplementary material). All the 22 patients were tested positive for SARS-CoV-2 by RT-PCR assay before enrollment. Their main symptoms were dry cough, fatigue, and fever, and severe cases were characterized by dyspnea, hypoxemia, or acute respiratory dysfunction. Patients were then randomized into two groups: 10 patients, including 3 severe and 7 moderate cases, were treated with Chloroquine 500 mg orally twice daily for 10 days; 12 patients, including 5 severe and 7 moderate cases, were treated with Lopinavir/Ritonavir 400/100 mg orally twice daily for 10 days. Primary baseline demographic and clinical features of the patients are listed in Table 1, with fairly even matched characteristics between two groups. Secondary baseline information is listed in Supplementary Table S1.
Figure 1.
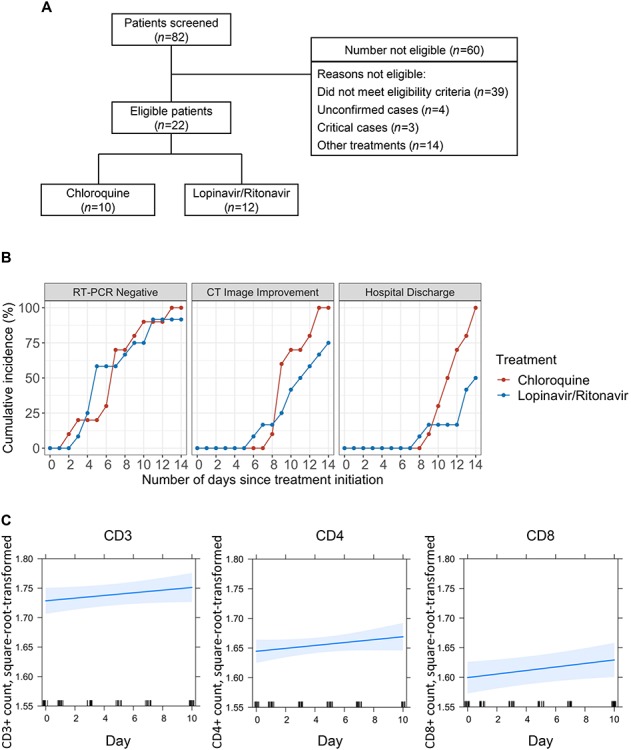
Overall study plan and efficacy results. (A) Patient screening and enrollment flow chart. (B) Cumulative incidence of virologic, clinical, and imaging outcomes. Red color indicates Chloroquine, while blue indicates Lopinavir/Ritonavir. (C) Square root and logarithmic (base 10) transformation were applied to normalize the distribution of CD3+, CD4+, and CD8+ T-cell count data. Missing values of CD3+, CD4+, and CD8+ T-cell counts were imputed by Kalman smoothing on a structural model. The trajectories (with 95% confidence bands) in the Chloroquine group were derived with the use of linear mixed effects model.
Table 1.
Baseline demographic and clinical characteristics of participants by treatment groups.
| Treatment group | ||||
|---|---|---|---|---|
| Characteristics | All patients (n = 22) | Chloroquine (n = 10) | Lopinavir/Ritonavir (n = 12) | P-value* |
| Age, year | 44.0 (36.5–57.5) | 41.5 (33.8–50.0) | 53.0 (41.8–63.5) | 0.09 |
| Female, n (%) | 9 (40.9) | 3 (70.00) | 6 (50.00) | 0.41 |
| Severe cases, n (%) | 8 (36.4) | 3 (30) | 5 (41.67) | 0.67 |
| Days from onset to treatment | 5.5 (3.0–7.0) | 2.50 (2.00–3.75) | 6.50 (4.75–8.50) | <0.001 |
| Height, cm | 166.50 (160.25–170.00) | 167.50 (158.00–173.00) | 165.50 (161.75–170.00) | 0.97 |
| Weight, kg | 70.00 (62.88–74.38) | 70.00 (52.75–72.00) | 71.00 (67.75–75.00) | 0.34 |
| Smoker | 2 (9.10) | 2 (20.00) | 0 (0) | 0.19 |
| Clinical parameters | ||||
| SOFA | 1.00 (0–2) | 1.00 (0–1) | 1.50 (0–3) | 0.32 |
| Temperature, °C | 37.05 (36.60–37.80) | 37 (36.65–37.50) | 37.3 (36.58–37.93) | 0.79 |
| Heart rate, bpm | 80.50 (73.75–91.00) | 80.50 (74.25–90.25) | 80.00 (74.50–89.75) | 0.87 |
| Respiratory rate, bpm | 20.00 (20–20) | 20.00 (19.25–20) | 20.00 (20–20) | 0.32 |
| Mean arterial pressure, mm Hg | 93.00 (91.38–101.28) | 96.35 (92.40–110.33) | 92.45 (86.43–97.85) | 0.09 |
| Oxygen saturation, % | 97.70 (95.98–98.45) | 97.95 (96.25–98.45) | 97.45 (96.08–98.33) | 0.92 |
| CD4+ count, /μL | 559.00 (504.75–616.75) | 582.00 (533.50–652.25) | 413.00 (366.00–460.00) | 0.18 |
| Albumin, g/L | 38.50 (37.60–39.38) | 39.00 (37.85–42.33) | 38.10 (36.88–38.65) | 0.14 |
| Radiology characteristics | ||||
| Ground-glass opacity | 18 (81.82) | 8 (80) | 10 (83.33) | 0.99 |
No. lobes affected  2 2 |
17 (77.27) | 6 (60) | 11 (91.67) | 0.14 |
| Consolidation | 4 (18.18) | 2 (20) | 2 (16.67) | 0.99 |
| Bilateral distribution of patchy shadows | 17 (77.27) | 6 (60) | 11 (91.67) | 0.14 |
Data are presented as number of participants (%) or median (IQR).
bpm, beats per minute; IQR, interquartile range; SOFA, sequential organ failure assessment.
*P-values indicate differences between patients in the Chloroquine group and the Lopinavir/Ritonavir group. P < 0.05 was considered statistically significant.
We initially relied on RT-PCR to measure virological outcomes and showed that one patient in the Chloroquine group became SARS-CoV-2 negative after treatment for only 2 days (Figure 1B, left panel). There were then steady increases in the number of patients turning negative, cumulating at Day 13 when all of the Chloroquine-treated patients became negative (Figure 1B, left panel; Supplementary Table S2). In comparison, patients in the Lopinavir/Ritonavir group only became SARS-CoV-2 negative after 3 days of dosing, and 11 out of 12 turned negative at Day 14. Comparing to the Lopinavir/Ritonavir group, the percentages of patients who became SARS-CoV-2 negative in the Chloroquine group were slightly higher at Day 7, Day 10, and Day 14 (Supplementary Table S2). These results suggest that Chloroquine has slight advantage over Lopinavir/Ritonavir based on RNA tests.
Besides, lung CT is another effective indicator to clinically evaluate the improvement of NCP. The first patient achieving lung clearance based on CT imaging was from the Lopinavir/Ritonavir group at Day 6 and this patient became SARS-CoV-2 negative at Day 3. In the Chloroquine group, the first patient achieving lung clearance was recognized at Day 8, who became SARS-CoV-2 negative at Day 7 (Figure 1B, middle panel). These data suggest that viral clearance does not translate immediately into pathological improvement in lungs. By Day 9, 6 patients (60%) in the Chloroquine group reached lung clearance, compared to 3 (25%) from the Lopinavir/Ritonavir group (Figure 1B, middle panel). By Day 14, the incidence rate of lung improvement based on CT imaging from the Chloroquine group was more than doubled to that of the Lopinavir/Ritonavir group (rate ratio 2.21, 95% CI 0.81–6.62). These results suggest that patients treated with Chloroquine appear to recover better and regain their pulmonary function quicker than those treated with Lopinavir/Ritonavir.
In addition, consistent with the CT imaging data (Figure 1B, middle panel), patients treated with Chloroquine were discharged from hospital in a much quicker pace (Figure 1B, right panel). The first patient discharged from hospital was from the Lopinavir/Ritonavir group at Day 8, and the first discharged from the Chloroquine group was at Day 9. Encouragingly, by Day 14, all 10 patients (100%) from the Chloroquine group were discharged compared to 6 patients (50%) from the Lopinavir/Ritonavir group (Figure 1B, right panel; Supplementary Table S2). Furthermore, Chloroquine also appeared to promote quicker recovery compared to Lopinavir/Ritonavir recommended by health authorities in China.
During Chloroquine treatment period, we observed 5 patients who experienced a total of 9 adverse events, including vomiting, abdominal pain, nausea, diarrhea, rash or itchy, cough, and shortness of breath (Supplementary Table S3). The most common adverse event was vomiting observed in 4 patients. All observed adverse events were known to be related to Chloroquine. There were no serious adverse events or patient withdrew from Chloroquine during the treatment period. Among the 5 patients with adverse events, 3 of them had valid measurements of serum concentration of Chloroquine at 14 days after treatment completion. The serum concentration of Chloroquine decreased to the range of 0.26–0.61 μmol/L, which was safe to patients. Overall, Chloroquine appears well tolerated among the patients we treated. Adverse reactions can be avoided by strengthening patient monitoring and strictly following the standard oral dosage of the drug. To further investigate the change of immunity through the therapy, we measured T-cell counts of the 10 patients in the Chloroquine group every 2 days. The trajectories of CD3+, CD4+, and CD8+ counts showed that there was no significant decrease of T-cell counts during the 10-day treatment period (Figure 1C), indicating that the short-term use of Chloroquine had no significant effect on immune function of patients.
In sum, our preliminary results suggest that Chloroquine could be an effective and inexpensive option among many proposed therapies, e.g. Lopinavir/Ritonavir. Considering the severe epidemic and short supply of medical resource, our study was limited by small sample size. Although our study is relatively preliminary, it has some implications for the epidemic to the world. It is our hope that this work may encourage larger scale randomized trials to fully evaluate this old drug against COVID-19. In the absence of a specific cure, old drugs such as Chloroquine may be repurposed to fight this novel disease and save lives worldwide.
[Supplementary material is available at Journal of Molecular Cell Biology online. This work was supported by the Natural Science Foundation of Guangdong Province (2018A030313652) and the National Mega Project on Major Infectious Disease Prevention (2017ZX10103011).]
Supplementary Material
References
- Delvecchio R., Higa L.M., Pezzuto P., et al. (2016). Chloroquine, an endocytosis blocking agent, inhibits Zika virus infection in different cell models. Viruses. 8, 322. [DOI] [PMC free article] [PubMed] [Google Scholar]
- Keyaerts E., Vijgen L., Maes P., et al. (2004). In vitro inhibition of severe acute respiratory syndrome coronavirus by chloroquine. Biochem. Biophys. Res. Commun. 323, 264–268. [DOI] [PMC free article] [PubMed] [Google Scholar]
- Kono M., Tatsumi K., Imai A.M., et al. (2008). Inhibition of human coronavirus 229E infection in human epithelial lung cells (L132) by chloroquine: involvement of p38 MAPK and ERK. Antivir. Res. 77, 150–152. [DOI] [PMC free article] [PubMed] [Google Scholar]
- Lu H., Stratton C.W., and Tang Y.W. (2020). Outbreak of pneumonia of unknown etiology in Wuhan, China: the mystery and the miracle. J. Med. Virol. 92, 401–402. [DOI] [PMC free article] [PubMed] [Google Scholar]
- Savarino A., Di Trani L., Donatelli I., et al. (2006). New insights into the antiviral effects of chloroquine. Lancet Infect. Dis. 6, 67–69. [DOI] [PMC free article] [PubMed] [Google Scholar]
- Wang M., Cao R., Zhang L., et al. (2020). Remdesivir and chloroquine effectively inhibit the recently emerged novel coronavirus (2019-nCoV) in vitro. Cell Res. 30, 269–271. [DOI] [PMC free article] [PubMed] [Google Scholar]
- World Health Organization. (2020). Clinical management of severe acute respiratory infection when novel coronavirus (2019-nCoV) infection is suspected: interim guidance, 28 January 2020 World Health Organization; https://apps.who.int/iris/handle/10665/330893 [Google Scholar]
- Zhang S., Yi C., Li C., et al. (2019). Chloroquine inhibits endosomal viral RNA release and autophagy-dependent viral replication and effectively prevents maternal to fetal transmission of Zika virus. Antivir. Res. 169, 104547. [DOI] [PubMed] [Google Scholar]
- Zhou P., Yang X.L., Wang X.G., et al. (2020). A pneumonia outbreak associated with a new coronavirus of probable bat origin. Nature 579, 270–273. [DOI] [PMC free article] [PubMed] [Google Scholar]
- Zhu N., Zhang D., Wang W., et al. (2020). A novel coronavirus from patients with pneumonia in China, 2019. N. Engl. J. Med. 382, 727–733. [DOI] [PMC free article] [PubMed] [Google Scholar]
Associated Data
This section collects any data citations, data availability statements, or supplementary materials included in this article.