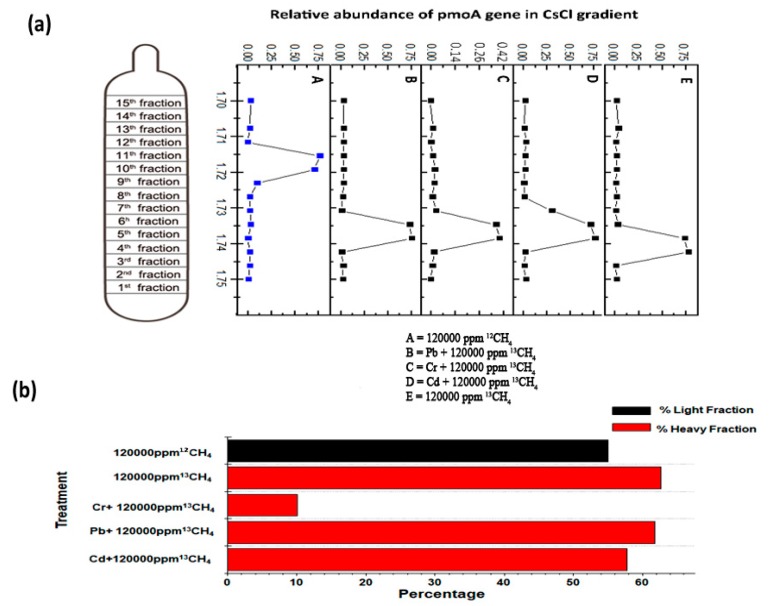
Figure 4.
The enrichment of 13Clabeled methanotrophs on the basis of qPCR of pmoA gene (a). The relative pmoA gene abundance was the proportion of MOB like gene copy numbers in each fraction to the total abundance through the gradient in a treatment (b). The red columns represent the percentage of MOB affiliated reads in total 16S rRNA genes in the heavy fractions (buoyant density 1.745 g mL−1) while the black column represents light fraction (buoyant density 1.72 g mL−1).

