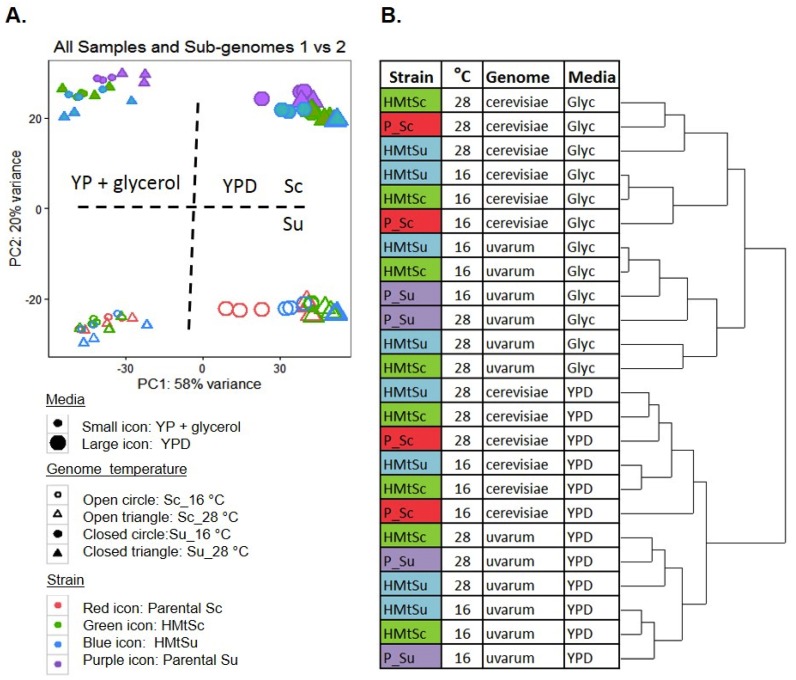
Figure 1.
Clustering of expression data from RNAseq of hybrids and parental strains in different growth conditions. (A). PCA analysis of the transcriptome of each subgenome of HMtSc and HMtSu, and the parental strain BY4743 S. cerevisiae and S. uvarum strain NCYC 2669. The expression data separates primarily by growth media (YP + glycerol or YPD), and secondly by subgenome. Dotted lines show the approximate main separation of clusters along the first and second principal components. (B). Dendrogram describing more detailed clustering of strain and temperature within each growth condition.

