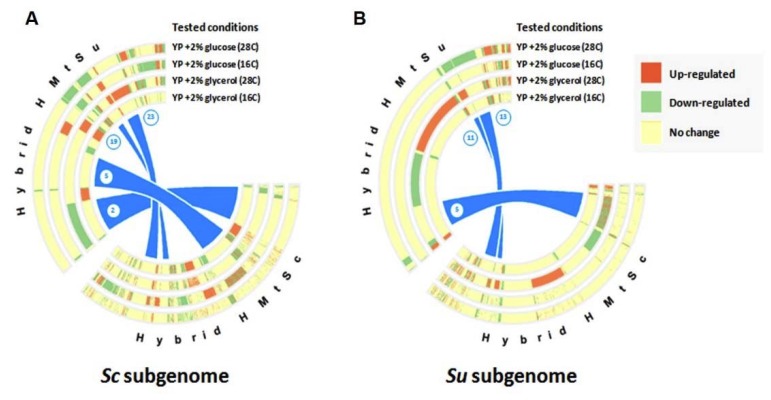
Figure 3.
Circular heat maps representing differential gene expression and preservation of such changes in yeast hybrids versus parent strains. Circular heat map for the (A) S. cerevisiae (Sc) subgenome and (B) S. uvarum (Su) subgenome. Three different colours represent differential expression: red, up-regulation; green, down-regulation; light yellow, no significant change in gene expression. Heat maps of the two hybrids are connected to indicate divergence in differential expression of genes in two different mitotypes.

