Abstract
Background:
Mammalian target of rapamycin (mTOR) is a downstream substrate activated by PI3K/AKT pathway and it is essential for cell migration. It exists as two complexes: mTORC1 and mTORC2. mTORC1 is known to be regulated by active AKT, but the activation of mTORC2 is poorly understood. In this study, we investigated the roles and differential activation of the two mTOR complexes during cell migration in prostate cancer cells.
Methods:
We used siRNA to silence the expression of Rac1 and the main components of mTOR complexes (RAPTOR and RICTOR) in LNCaP, DU145 and PC3 prostate cancer cell lines. We performed transwell migration assay to evaluate the migratory capability of the cells, and western blot analysis to study the activation levels of mTOR complexes.
Results:
Specific knock-down of RAPTOR and RICTOR caused a decrease of cell migration, suggesting their essential role in prostate cancer cells movement. Furthermore, EGF treatments induced the activation of both the mTOR complexes. Lack of Rac1 activity in prostate cancer cells blocked EGF-induced activation of mTORC2, but had no effect on mTORC1 activation. Furthermore, over-expression of constitutively active Rac1 resulted in significant increase in cell migration and activation of mTORC2 in PC3 cells, but had no effect on mTORC1 activation. Active Rac1 was localized in the plasma membrane and was found to be in a protein complex, with RICTOR, but not RAPTOR.
Conclusion:
We suggest that EGF-induced activation of Rac1 causes the activation of mTORC2 via RICTOR. This mechanism plays a critical role in prostate cancer cell migration.
Keywords: PI3K/AKT/mTOR, mTORC1, mTORC2, Rac1, cell migration, prostate cancer
Introduction
Metastasis is the process by which cancer cells leave the primary tumor, disseminate and form secondary tumors at anatomically distant sites1. Metastasis of epithelial cancer cells involves a complex cascade of molecular processes such as epithelial to mesenchymal transformation (EMT), degradation of extracellular matrix, cell migration and invasion of the neighboring tissues, intravasation into blood or lymph vessels, transportation and extravasation, mesenchymal to epithelial transformation (MET), and growth of metastatic tumors at distant locations 1. Among these complex processes, the most critical steps are tumor cell motility or cell migration, processes that are regulated by numerous intracellular proteins2. RHO family of GTPases, including RhoA, Rac1, and Cdc42, play a pivotal role in the regulation of directed cell migration3. During cell migration, formation of actin-driven protrusion at the leading edge, called lamellipodia, is regulated by Rac1 activation, whereas focal adhesion and stress fibers formation at the cell body and rear of the cell are regulated by RhoA activation; filopodia formation, which establishes cell polarity, is regulated by Cdc422.
Several growth factors, chemokines, hormones, and prostaglandins have been shown to induce migratory and invasive behavior in cancer cells4. Several of these growth factors, including EGF, bind to their specific receptors and signal through their intracellular substrates to induce cell migration in numerous cancer cells, including breast, ovarian, and prostate cancer cells5-7. The activation of these receptors leads to the activation of PI3K/AKT/mTOR pathway, which plays a critical role in the induction of cell migration and invasion. 8,9
Mammalian target of rapamycin (mTOR) is a highly conserved serine/threonine kinase that exists in two distinct complexes: mTORC1 and mTORC2. The mTORC1 complex is composed of mTOR, RAPTOR (regulatory associated protein of mTOR), PRAS40 (proline-rich Akt substrate), DEPTOR (DEP domain containing mTOR-interacting protein), mLST8 (mammalian lethal with sec-13), and tti1/tel2 proteins10-12. mTORC2 complex is composed of mTOR, RICTOR (rapamycin-insensitive companion of mTOR), mSIN1 (mammalian stress-activated map kinase interacting protein 1), PROTOR1/2, DEPTOR, mLST8, and tti1/tel2 proteins13-15. Activation of both mTORC1 and mTORC2 complexes are vital for induction of cytoskeletal rearrangement and cell migration in human cancers16-18. Previous studies have shown that in advanced bladder cancer cells, mTORC1 and mTORC2 components RAPTOR and RICTOR, regulate cell spreading and migration19. The present study was carried out to investigate the differential role of mTORC1 and mTORC2 complexes in cell migration and mechanisms involved in their activation in prostate cancer cells.
Materials and Methods
Cell Culture, Chemicals and Reagents
Prostate cancer cell lines (LNCaP, DU145 and PC3) were obtained from American Type Culture Collection (ATCC) (Rockville, MD). They were maintained and cultured, as previously described.4,20,21 Recombinant human Epidermal Growth Factor (EGF) was purchased from R&D systems (Minneapolis, MN). The antibodies anti-His-tag, anti-p-mTOR (Ser-2448), anti-p-mTOR (Ser-2481), and anti-mTOR were purchased from Cell Signaling Technology (Danvers, MA). Anti-Rac1 antibody was purchased from BD Biosciences (New Jersey, NY). Protein A/G agarose beads, RAPTOR, RICTOR, and Rac1 siRNA oligos were purchased from Santa Cruz Biotechnology (Santa Cruz, CA). Anti-α-Tubulin antibody was purchased from Sigma–Aldrich (St Louis, MO). The anti-rabbit and anti-mouse immunoglobulins coupled with horseradish peroxidase (IgG-HRP) were obtained from Promega (Madison, WI). Rac1 inhibitor (NSC23677) was obtained from Tocris Biosciences (Bristol, UK). Rapamycin was obtained from CalBioChem (San Diego, CA). Fluorescent stains for cell nuclei: DAPI (4’, 6-diamidino-2-phenylindole) and for actin: Rhodamine-Phallodin were purchased from Roche Diagnostics (Indianapolis, IN) and Cytoskeleton Inc. (Denver, MO), respectively.
siRNA Transfection
To knockdown endogenous RAPTOR, RICTOR, or Rac1 expression, LNCaP, DU145, and PC3 cells were plated in 6-well plates at a density of 1.5x10⁵ cells per well in antibiotic-free growth medium, supplemented with 5% fetal bovine serum (FBS) overnight. The cells were transfected with control, RAPTOR, RICTOR, or Rac1 siRNA according to the manufacturer’s instructions (Santa Cruz Biotechnology). After 24 hr, the transfection media was replaced with fresh media and the cells were incubated for an additional 24 hr. These cells were used for western blot analysis, cell migration or Rac1 activation assays.
Migration assay
In vitro cell migration assays were performed as described previously, using trans-well inserts coated with 50 μl of rat tail collagen (50 μg/ml) 22. Epidermal growth factor (EGF, 10 ng/ml) was used as chemoattractant. Aliquots of 100 μl of cell suspensions were loaded into the inserts, and incubated at 37°C for 5 hr (PC3 and DU145), or 24 hr (LNCaP). Non-migrating cells were removed with cotton swabs and fixed using 3.7% paraformaldehyde for 20 min at room temperature. Migrated cells were stained with 3 ng/ml of DAPI, according to the manufacturer’s instructions and visualized using an Axiovert 200M Carl-Zeiss microscope (Gottingen, Germany). The results were expressed as migration index defined as: the average number of cells per field for test substance/the average number of cells per field for the control.
Western blot analysis
Cell lysates were collected and western blots were carried out as described previously 22. In brief, individual samples (30–40 μg proteins) were subjected to 7.5 or 10% SDS-PAGE gels and transferred to polyvinylidene difluoride (PVDF) membranes (Millipore Corp., Bedford, Massachusetts). After blocking, the membranes were incubated with appropriate dilutions of specific primary antibodies (1:1000 dilution for anti-p-mTOR (Ser-2448), anti-p-mTOR (Ser-2481), anti-mTOR, anti-p-AKT (Ser-2473), anti-AKT and anti-His-tag antibodies, 1:500 for anti-Rac1, 1:3000 for anti-α-tubulin) overnight at 4°C. After washing, the blots were incubated with appropriate secondary antibodies and developed in ECL mixture. The density of specific protein bands was determined by ImageJ software (NIH, Bethesda, MD) and normalized using α-tubulin used as loading control.
Over-expression of Wild Type Rac1 (Rac1WT) and Active Rac1 mutant (Rac1Q61L) in PC3 Cells
Bacterial Stabs containing pcDNA3-EGFP-Empty Vector (EV) (plasmid#13031), pcDNA3-EGFP-Rac1WT (plasmid#12980), or pcDNA3-EGFP-Rac1Q61L (plasmid#12981) plasmids were purchased from Addgene. Plasmids were isolated and purified, according to the manufacturer’s protocol, using ZYMOPURE™ plasmid Maxiprep kit (Zymo Research). Purified plasmids (2 μg) were transfected into PC3 cells, using Lipofectamine 3000 transfection reagent for 24 hr. Cells were sorted based on EGFP expression using BD Jazz Cell Sorter (BD Bioscience, New Jersey, NY). The enriched populations were grown in MEM, supplemented with 10% FBS and different concentrations of the selective antibiotic G418 (400 μg/ml for PC3-EV, and PC3-Rac1WT, and 800 μg/ml for PC3-Rac1Q61L), to prevent the growth of non-EGFP expressing cells.
Immunoprecipitation
PC3-EV, PC3-Rac1WT, and PC3-Rac1Q61L cells were incubated with or without EGF (10 ng/ml) for 3 min. Total cell lysates containing 1000-1100 μg of total proteins were incubated with 1:50 dilution of anti-His-tag antibody for 24 hr under gentle rotation at 4°C, followed by incubation with 100 μl of protein A/G agarose beads (0.5 ml of agarose in 2.0 ml of PBS with 0.02% sodium azide) overnight at 4°C under gentle rotation. Immune-complexes were washed 3 times with 1X cell lysis buffer and the resulting immune-complexes were eluted using 2X Laemmeli’s buffer at 60°C for 10 min. Resulting eluates were analyzed by western blot analysis with anti-mTOR, anti-RAPTOR, or anti-RICTOR antibodies.
Rac1 activation assay
PC3-EV, PC3-Rac1WT, and PC3-Rac1Q61L cells were plated at a density of 1.5x10⁵ cells per well. Cells were serum-starved for 2 hrs. The cells were then pre-incubated with or without Rac1 inhibitor NSC23677 (10 μM) for 30 min, followed by treatment with EGF (10 ng/ml) for 3 min. Rac1 activity was measured in the cell lysate proteins (0.1-0.2 mg/ml) with GLISA Rac1-activation assay (colorimetric format, Cytoskeleton Inc., Denver, MO) according to manufacturer’s protocol.
Fluorescence analysis and actin staining
PC3-EV, PC3-Rac1WT, and PC3-Rac1Q61L cells were plated on glass cover slips at a density of 1.5x10⁵ cells per well for 48 hrs. Cells were serum-starved for 2 hr and then treated with EGF (10 ng/ml) for 3 min. Cells were fixed, permeabilized and incubated with Rhodamine-phalloidin for 30 min, and DAPI for 10 min. EGFP-fluorescence was used for Rac1 localization in PC3-Rac1WT and PC3-Rac1Q61L cells.
Statistical analysis
All experiments were repeated at least three times using different cell preparations. The results are presented as means ± SEM of three independent experiments and images from a single representative experiment are presented. Analysis of variance and Duncan’s modified multiple range tests were employed to assess the significance of differences among various treatment groups (p< 0.01)
Results
mTORC1 and mTORC2 are essential for migration in prostate cancer cells
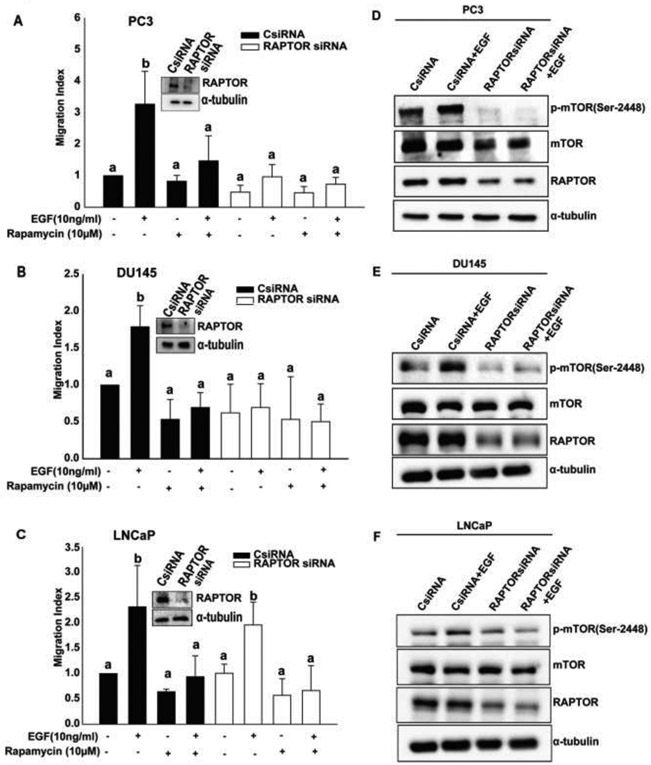
To determine the role of mTORC1 in cell migration, we treated prostate cancer cell lines (PC3, DU145 and LNCaP) with rapamycin (10 μM) for 30 min. Following this, cell migration was performed in the presence or absence of EGF. EGF induced a significant increase in cell migration under control conditions whereas rapamycin treatment decreased cell migration in all three prostate cancer cell lines (Fig 1A, 1B, and 1C), indicating that mTORC1 is required for prostate cancer cell migration. Next, to determine the contribution of RAPTOR, we knocked-down the expression of the protein using siRNA. EGF induced cell migration in cells transfected with control siRNA whereas it caused a slight but statistically insignificant increase in cell migration in RAPTOR deficient PC3 cells (Fig 1A). However, EGF failed to induce cell migration in RAPTOR deficient DU145 cells (Fig 1B). Interestingly, RAPTOR knockdown did not exert significant effect on cell migration in LNCaP cells (Fig 1C). RAPTOR knock down resulted in a drastic reduction of EGF-induced mTORC1 specific phosphorylation in PC3 and DU145 but caused only slight reduction in LNCaP cells (Fig 1D, 1E and 1F).
Figure 1: mTORC1 is essential for cell migration and is required for the activation of mTORC1 in PC3, and DU145 cells and not in LNCaP cells:
A, B, and C) Migration assays were performed for 5 hr (PC3, DU145) and 24 hr (LNCaP). One-way Anova was performed with p-value< 0.01 for at least 3 experiments. a and b represent statistical significance, compared to the controls. D, E, and F) PC3, DU145, and LNCaP cells were transfected with control and RAPTOR siRNAs and treated with EGF (10 ng/ml, 3 min). Western blot analysis for p-mTOR (Ser-2448), mTOR, RAPTOR, and α-tubulin antibodies were performed.
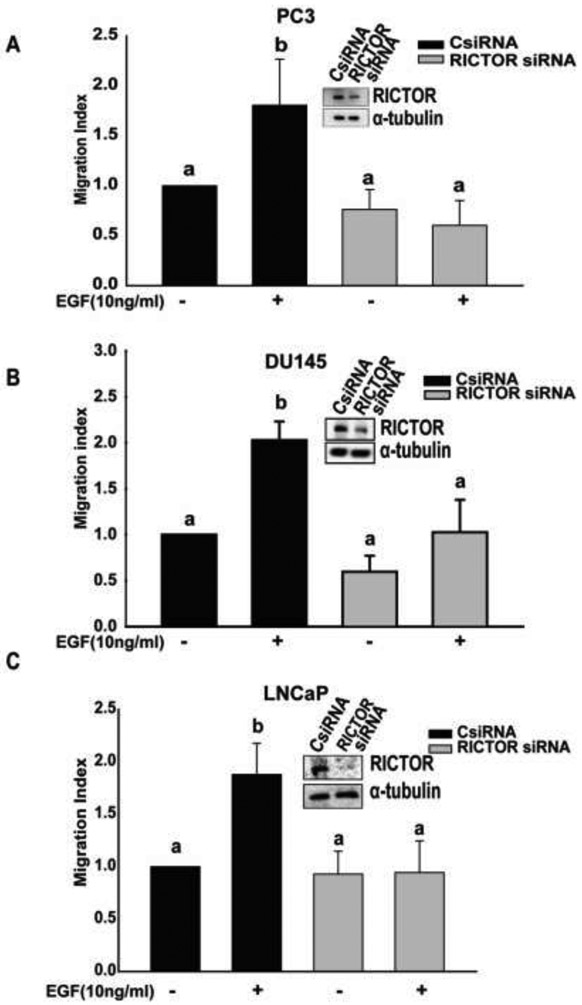
Next, to determine the role of mTORC2 in cell migration, we knocked down the expression of RICTOR (main player in mTORC2) using siRNA in PC3, DU145, and LNCaP cells. EGF induced a significant increase in cell migration in cells transfected with control siRNA whereas it failed to cause increase in cell migration in RICTOR deficient PC3, DU145, and LNCaP cells (Fig 2A, 2B and 2C). These results demonstrated that both complexes are required for cell migration in prostate cancer cell lines.
Figure 2: mTORC2 is essential for cell migration in PC3, DU145, and LNCaP cells:
A, B, and C) Migration assays were performed for 5 hr (PC3, DU145) and 24 hr (LNCaP) One-way Anova was performed with p-value< 0.01 for at least 3 experiments. a and b represents statistical significance, compared to the controls.
EGF induces the activation of both mTORC1 and mTORC2 in prostate cancer cells
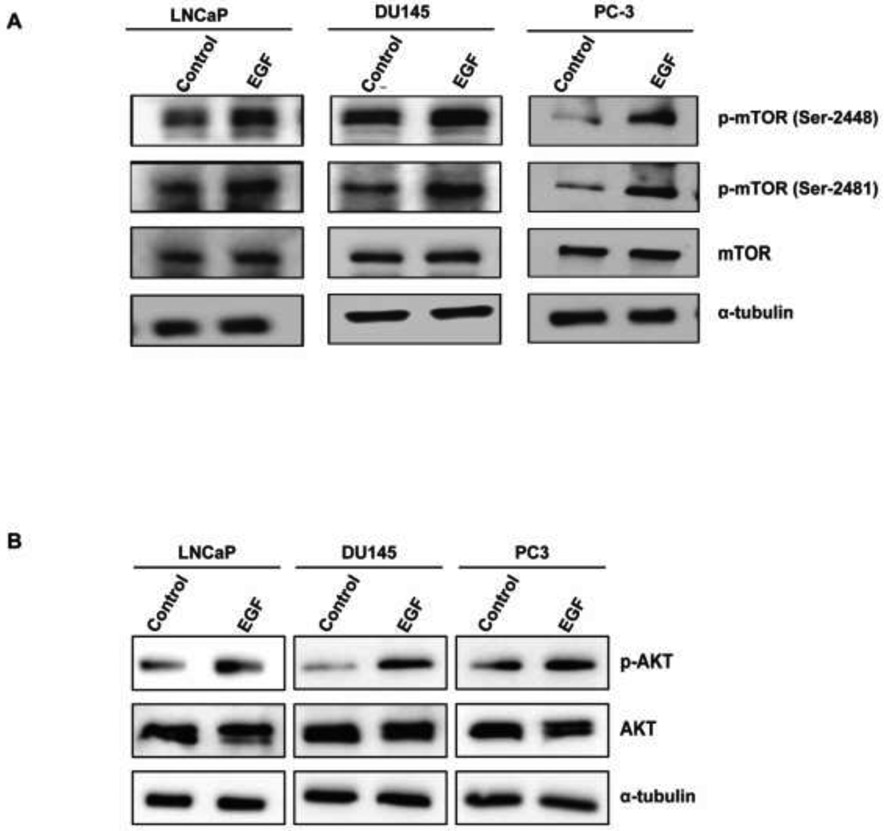
To investigate if EGF activates both mTORC1 and mTORC2 in prostate cancer cells, we treated PC3, DU145 and LNCaP cells with EGF (10 ng/ml, 3 min) and determined the phosphorylation of mTOR protein at complex-specific phosphorylation sites. EGF treatment induced phosphorylation of mTOR protein at both Ser-2448 and Ser-2481 (Fig 3A). In addition, it was also observed that EGF induced activation of AKT in all three prostate cancer cell lines (Fig 3B).
Figure 3: EGF induces the activation of p-AKT, mTORC1,and mTORC2 in PC3, DU145, and LNCaP cells:
A,B) PC3, DU145, and LNCaP cells were treated with EGF (10 ng/ml, 3 min) and western blot analysis was performed using p-mTOR (Ser-2448), p-mTOR (Ser-2481), mTOR, p-AKT, AKT, and α-tubulin antibodies.
Role of Rac1 in activation of mTOR Complexes (mTORC1 and mTORC2) in prostate cancer cells
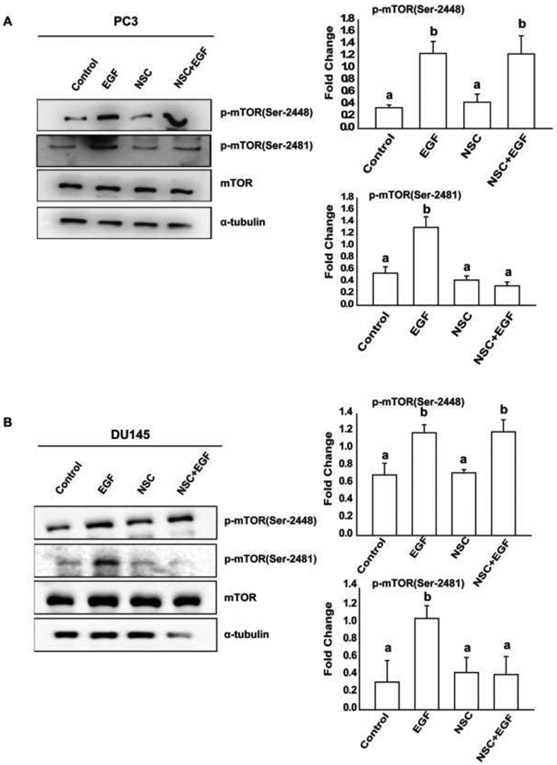
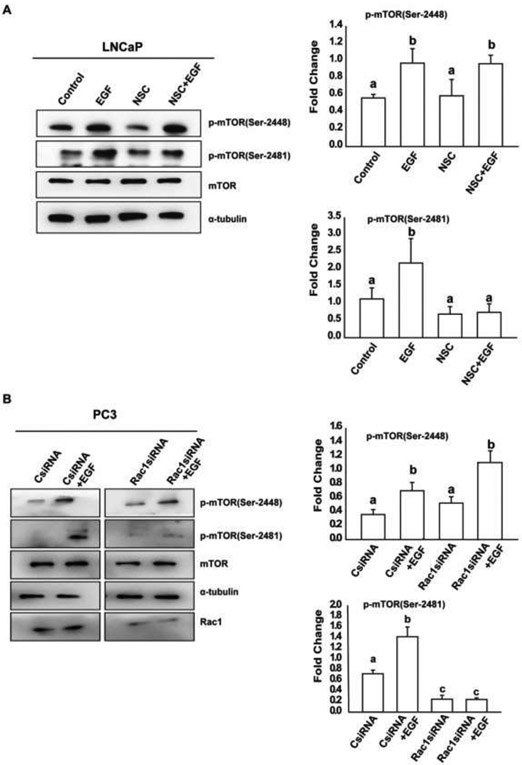
Earlier studies have demonstrated that Rac1 has the capability to regulate mTORC1 and mTORC2 activity and affect cell size in HeLa cells23. To determine the role of Rac1 in the activation of both mTOR complexes in prostate cancer cells, we pre-treated PC3, DU145 and LNCaP cells with a specific Rac1 inhibitor (NSC23677) and investigated the effects of EGF on phosphorylation of mTOR protein. As shown in Fig 4A, 4B and 5A, inhibition of Rac1 blocked EGF-induced activation of mTORC2, but had no effects on activation of mTORC1 in EGF-treated prostate cancer cells. Also, as shown in Fig. 5B, EGF-induced activation of mTORC1 was unaffected, whereas the activation of mTORC2 was significantly reduced in cells after knockdown of endogenous Rac1. These results suggest that EGF-induced activation of mTORC1 is upstream and mTORC2 is downstream of activated Rac1 in PC3, DU145 and LNCaP cells.
Figure 4: Rac1 is required for the activation of mTORC2 in PC3 and DU145 cells:
A, B) PC3 and DU145 cells respectively, were treated with Rac1 inhibitor and EGF, followed by western blot analysis using p-mTOR (Ser-2448), p-mTOR (Ser-2481), mTOR, and α-tubulin antibodies. One-Way Anova was performed with p-value<0.01 for at least 3 experiments. a and b represent statistical significance, compared to the controls.
Figure 5: Activation of mTORC2 is affected in Rac1 depleted LNCaP and PC3 cells:
A) LNCaP cells were treated with Rac1 inhibitor EGF, followed by western blot analysis using p-mTOR (Ser-2448), p-mTOR (Ser-2481), mTOR, and α-tubulin antibodies. One-Way Anova was performed with p-value<0.01 for at least 3 experiments. B) PC3 cells were treated with Rac1siRNA and EGF, followed by western blot analysis using p-mTOR (Ser-2448), p-mTOR (Ser-2481), mTOR, Rac1, and α-tubulin antibodies. One-Way Anova was performed with p-value < 0.01 for at least 3 experiments. a and b represent statistical significance, compared to the controls.
Over-expression of constitutively active Rac1 increased cell migration
PC3 cells were transfected with EGFP-EV, EGFP-Rac1WT, or EGFP-Rac1Q61L (constitutively active Rac1) plasmids and stable over-expressing PC3 cell lines were established. Over-expression of Rac1 in these cells was confirmed by qRT-PCR and western blot analysis (Figure S1A and S1B).
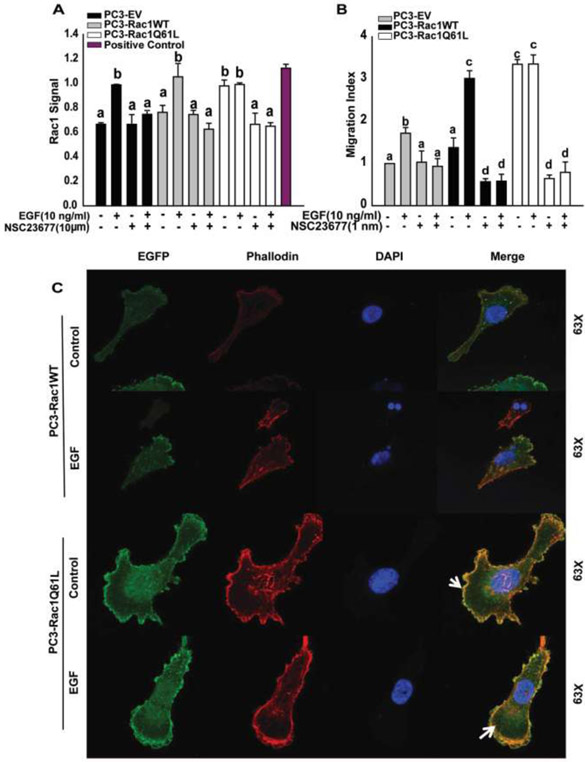
Rac1 activation assays confirmed the activation levels of Rac1 in these cell lines (Fig 6A). Basal Rac1 activity was unaffected in cells over-expressing empty vector (PC3-EV) and wild-type Rac1 (PC3-Rac1WT), however there was an increase in Rac1 activity in cells over-expressing constitutively active Rac1 (PC3-Rac1Q61L). EGF-induced Rac1 activity was more than 2-fold higher in PC3-Rac1WT cells compared to PC3-EV cells, whereas Rac1 activity was unaffected after EGF treatment in cells over-expressing constitutively active Rac1. Treatment with EGF caused significant increase in cell migration in PC3-EV and PC3-Rac1WT cells; EGF effects on cell migration in PC3-Rac1WT were 2-fold higher than those in PC3-EV cells. PC3-Rac1Q61L cells exhibited 3-fold increase in migratory ability and EGF treatment did not cause any additional increase in migration in these cells (Fig 6B). We also performed fluorescence analysis to determine the localization of Rac1 in PC3-Rac1WT and PC3-Rac1Q61L cells (Fig 6C). Under basal conditions, Rac1 was localized in the cytoplasm in a diffused manner in PC3-Rac1WT cells, whereas it was localized at the plasma membrane in the PC3-Rac1Q61L cells. After stimulation with EGF, Rac1 was localized at the plasma membrane in PC3-Rac1WT cells as well. These results showed that increased Rac1 activity leads to an increase in cell migration, which involves localization of Rac1 at the membrane in migrating cells.
Figure 6: Wild type Rac1 (PC3-Rac1WT) and constitutively active Rac1 (PC3-Rac1Q61L) cells affected activation of Rac1, cell migration, and localization of Rac1:
A) G-LISA assays were performed on empty vector (PC3-EV), wild type Rac1 (PC3-Rac1WT), and constitutively active Rac1 (PC3-Rac1Q61L) cells, after treating the cells with NSC23677 and EGF. Graph was plotted using Mean ± SEM from 2 replicates. a and b represent statistical significance, compared to the controls. B) Migration assays were performed for 5 hours on cells treated with NSC23677 and EGF. One-way Anova was performed with p-value< 0.01 for at least 3 experiments. a, b, c and d represent statistical significance, compared to the controls. C) PC3-Rac1WT and PC3-Rac1Q61L cells were treated with EGF and fluorescence analysis was performed using Rhodamine-Phallodin and DAPI for actin and nuclei, respectively.
Active Rac1 promotes activation of mTORC2 via RICTOR
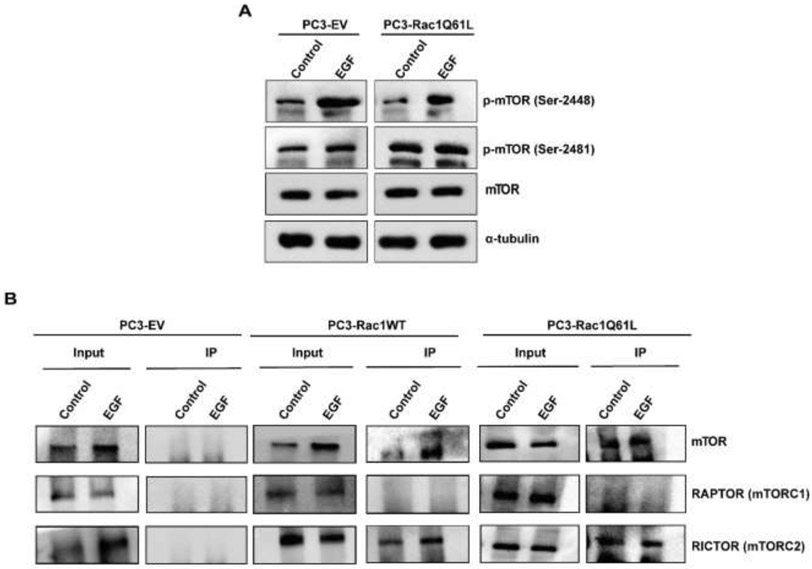
As described above, activation of Rac1 leads to phosphorylation and activation of mTORC2 complex. To determine if Rac1 physically interacts with mTORC2 complex to activate it, we investigated the activation of mTORC1 and mTORC2 in PC3 cell lines overexpressing Rac1. As shown in Fig. 7A, mTORC1 and mTORC2 complexes were not activated in unstimulated PC3 cells. On the other hand, mTORC2 complex was active in unstimulated PC3-Rac1Q61L cells. EGF treatments induced activation of both mTORC1 and mTORC2 complexes in PC3-EV cells. In PC3-Rac1Q61L cells, EGF treatments induced the activation of mTORC1 complex, but no further effects were observed in the activation of mTORC2 complex. Furthermore, immunoprecipitation of His-tagged Rac1 revealed that both mTOR and RICTOR were associated with Rac1 in EGF-treated PC3-Rac1WT cells and in PC3-Rac1Q61L cells, whereas RAPTOR was not detected (Fig. 7B). Our data suggest that the activation of Rac1 was necessary to activate mTORC2 and was dependent on the proximity of Rac1 to RICTOR.
Figure 7: Rac1 forms a complex with mTORC2 through RICTOR in wild type Rac1 (PC3-Rac1WT and constitutively active Rac1 (PC3-Rac1Q61L) cells:
A) PC3-EV and PC3-Rac1Q61L cells were treated with EGF, followed by western blot analysis using p-mTOR (Ser-2448), p-mTOR (Ser-2481), mTOR, and α-tubulin antibodies. B) PC3-EV, PC3-Rac1WT, and PC3-Rac1Q61L cells were immunoprecipitated with His-tag antibody. Western blot analysis was performed using mTOR, RAPTOR, and RICTOR antibodies. All experiments were performed 3 times.
Discussion
In this study, we demonstrated that mTORC1 and mTORC2 complexes were activated by EGF signaling and are required for cell migration. mTORC1 was activated directly by EGF while the activation of mTORC2 complex was indirectly dependent on the activation of Rac1 protein. This data suggested that mTORC1 acts upstream and mTORC2 acts downstream of activated Rac1 to induce cell migration in prostate cancer cells.
PI3K/AKT/mTOR axis is one of the major signaling pathways involved in cancer progression and metastasis.24,25 We have previously shown that TGFβ and EGF induced activation of PI3K/AKT/mTOR pathway in PC3 cells4. We have also shown that EGF is required for the activation of the PI3K/AKT pathway and rapamycin treatment specifically blocks mTORC1, leading to a decrease in cell migration in PC3 and DU145 cells4. Studies in bladder, breast, prostate, and colon cancer indicated also that knockdown of RAPTOR and RICTOR (regulatory components of mTORC1 and mTORC2 respectively), caused decrease in cell migration.19,26,27 In the current study, we have demonstrated that knockdown of RAPTOR leads to the decrease in EGF-induced cell migration in PC3 and DU145 cells (Fig 1A and 1B). However, knockdown of RAPTOR did not affect the EGF-induced cell migration in LNCaP cells (Fig 1C). In order to investigate the aberration associated with RAPTOR deficient LNCaP cells, we determined the activation of mTORC1 associated Ser2448 phosphorylation of mTOR protein. Although, RAPTOR knockdown caused the loss of EGF-induced mTORC1 activation in PC3 and DU145 cells, mTORC1 activation was low but maintained in LNCaP cells (Fig 1). These results indicate that in LNCaP cells mTORC1 activation can be achieved in the presence of very low levels of RAPTOR protein. Our studies also confirm that knockdown of RICTOR drastically reduced cell migration in all prostate cancer cell lines (Fig 2). These results suggest that mTORC1 and mTORC2 are critical for migration in prostate cancer cells.
The mechanism of regulation of mTORC1 requires two major cellular inputs: amino acids and growth factors. A previous study showed that in HEK293 and 293T cells, serum or IL3 acting via p-AKT induced mTORC1 kinase activity by phosphorylating mTOR at Ser2448. 28 A similar induction of mTORC1 activity by phosphorylation at Ser2448 has been demonstrated in breast and pancreatic cancer cells28. We also demonstrate that the stimulation by EGF in prostate cancer cells causes the phosphorylation of mTORC1 at Ser2448 and AKT at Ser473 (Fig 3A and 3B, respectively). Less is known about mTORC2 complex. Soliman et al. showed that the inhibition of PI3K by wortmannin decreased mTORC2 associated mTOR Ser2481 phosphorylation29. Similarly Copp et al. demonstrated that insulin promoted the RICTOR-associated phosphorylation of mTOR at Ser2481, which is associated with mTORC2 kinase activity30. Our results confirmed those of Copp et al., showing that EGF was able to induce phosphorylation of mTORC2 associated mTOR Ser2481 in PC3, DU145 and LNCaP cells (Fig 4A). We also investigated the potential upstream regulators of mTORC2 phosphorylation after EGF stimulation. A study conducted by Sac et al in HeLa cells, showed that Rac1 regulates the activity of mTORC1 and mTORC2 under serum stimulated conditions23. We show that, when Rac1 is inhibited or deficient in PCa cells, mTORC1-associated phosphorylation (mTOR Ser2448) was unaffected, while the phosphorylation of mTORC2 (mTOR Ser2481) was decreased under EGF-stimulated conditions (Fig 4A, 4B, 5A, and 5B). These results indicate that Rac1 plays a role in the induction of mTORC2 associated mTOR Ser2481 phosphorylation.
Rac1 is a member of the Rho/Rac GTPase family and cycles between GTP (guanine tri-phosphate) active and GDP (guanine di-phosphate) inactive states 31. Studies have shown that the over-expression of Rac1 in prostate cancer patient tissue samples is associated with poor patient prognosis32. Studies have also shown that activation of Rac1 via the PI3K/AKT pathway is essential for the induction of migration in PC3 cells 33. It has also been observed that inhibition of active form of Rac1 (GTP bound Rac1) causes anti-migratory effect in prostate cancer cells34. We investigated the effect of Rac1 over-expression on Rac1 activity, its localization and cell migration (Fig.6). These results are in agreement with studies in breast cancer, urothelial carcinoma and squamous cancer of head and neck, which showed that more invasive and metastatic stages of cancer are correlated to higher Rac1 activity35-37. Also, increased levels of cell migration in EGF-induced PC3-Rac1WT and PC3-Rac1Q61L concurred with prostate cancer patient tissue studies, which indicated that drastically higher active Rac1 was associated with aggressive prostate cancer stages32. Finally, we showed that the localization of Rac1 protein is at the leading edge of PC3 cells overexpressing Rac1 WT (in EGF-stimulated cells) and Rac1 constitutively active (Fig.6C). These finding confirm that Rac1 needs to be bound to GTP, in order to be trans-localized to the leading edge of migrating cells 38. Thus, higher Rac1 activity in Rac1WT and Rac1Q61L cells caused Rac1 to localize at the leading edge, which in turn caused an increase in cell migration.
Next, to investigate whether activation of mTORC2 by active Rac1 was caused by the physical interaction of Rac1 with components of mTORC2 complex, we first determined that EGF treatments induced activation of both mTORC1 and mTORC2 complexes in PC3 cells transfected with EV. On the other hand, EGF caused activation of mTORC1 but had no additional effect on the already activated mTORC2 complex in PC3-Rac1Q61L cells (Fig. 7A). This finding concurs with the role of Rac1 in regulation of mTORC2 by anchoring it to the membrane of migrating cells23. Furthermore, immunoprecipitation of Rac1 revealed that activated Rac1 promotes mTORC2 activation due to the proximity of Rac1 to RICTOR. It is, however, not clear whether the proteins are directly in contact with each other or the interaction is indirect. Furthermore, the molecular mechanisms involved in Rac1-dependent activation of RICTOR and mTORC2 remain unknown and should be delineated in continued studies. This result also concurs with Copp et al study, demonstrating that RICTOR promotes mTORC2 activation by phosphorylating mTORC2 associated mTOR Ser2481.30
The role of mTOR, and specifically mTORC1 and mTORC2 complexes, has been studied in several cancer types and overexpression of the main regulator proteins of the two complexes (RICTOR and RAPTOR) have been shown as markers of bad prognosis.27,39,40 In addition, it is also observed that Rac1 protein expression is drastically increased in several cancer types, and specifically in prostate cancer, high levels of Rac1 protein were found in high grade-PIN and prostate carcinoma compared to benign secretory epithelium32,41,42. However, the expression of these proteins in prostate cancer tissues and metastatic prostate cancers has not been widely reported. We analyzed the RNA levels of Rac1, RAPTOR and RICTOR in primary prostate cancer tissues from available databases and found no increase at the RNA levels of these genes (unpublished data). However, it is important to consider that both the levels of proteins and their activation status will play critical roles in the progression of prostate cancer.
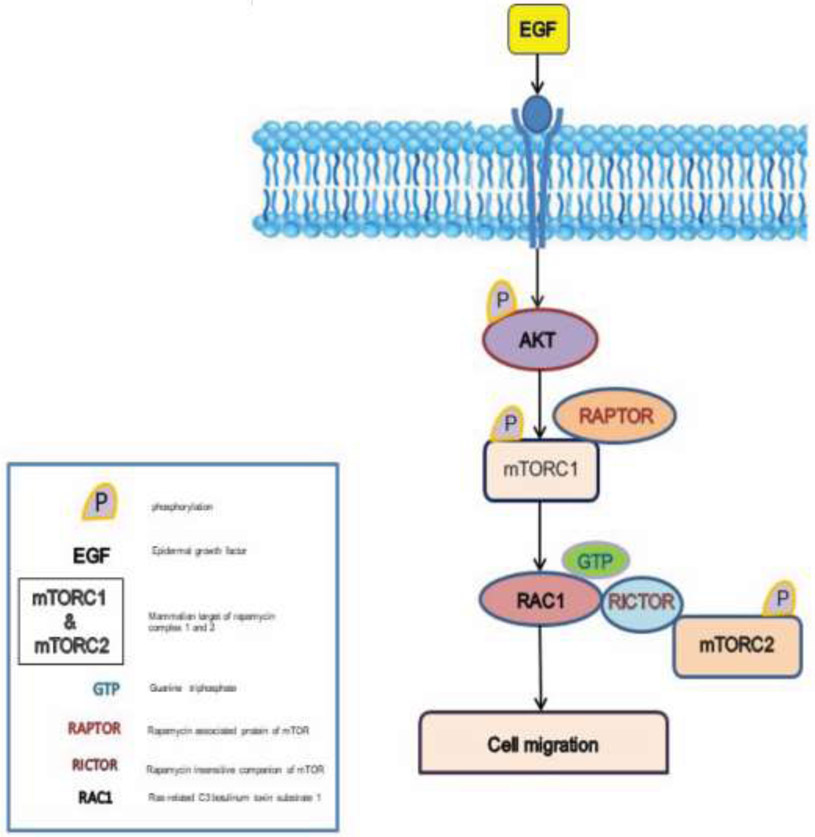
On the basis of our study, we conclude that Rac1 plays a vital role in the regulation of mTORC2 and may provide a potential approach towards development of mTORC2 specific inhibitors. We also showed that EGF induced mTORC1 and mTORC2 specific phosphorylations, which are indicators of their kinase activity. In addition, the study also showed that Rac1 forms a complex with RICTOR in the presences of EGF and affects phosphorylation of mTORC2 associated mTOR Ser2481 in PC3 cells. Although at the mRNA levels the expression of these proteins did not change (Rac1) or it decrease in prostate tumors (RAPTOR and RICTOR), RNA does not necessary represent the abundance and functions of proteins. Our knowledge on the implication of Rac1 and RICTOR interaction towards prostate cancer cell migration is still incomplete, so there is a need to further investigate this aspect of our findings. Based on our findings, we have developed a working model for mTORC2 activation, which is shown in Fig 8. We hypothesize that stimulation by EGF induces the activation of mTORC1 by phosphorylating mTOR at Ser-2448. This in turn caused the activation of Rac1, which upon close proximity with RICTOR affects the activation of mTORC2.
Figure 8: Working model of mTORC2 activation by active RAC1 using PI3K/AKT signaling Pathway:
Signaling by EGF causes the activation of mTORC1 by phosphorylation of mTOR at Ser-2448. Activation of mTORC1 leads to the activation of Rac1, and due to its proximity to RICTOR component of mTORC2, induces activation of mTORC2 by phosphorylating its mTOR at Ser-2481, thereby leads to prostate cancer cell migration.
Supplementary Material
Acknowledgments
Funding information: These studies were supported by the NIH/NIMHD/RCMI grant #G12MD007590 and NIH/NIMHD #5P20MD002285.
Footnotes
Conflict of interest: The authors declare no conflict of interest.
References
- 1.Brooks SA, Lomax-Browne HJ, Carter TM, Kinch CE, Hall DM. Molecular interactions in cancer cell metastasis. Acta histochemica. 2010;112(1):3–25. [DOI] [PubMed] [Google Scholar]
- 2.Pollard TD, Borisy GG. Cellular motility driven by assembly and disassembly of actin filaments. Cell. 2003;112(4):453–465. [DOI] [PubMed] [Google Scholar]
- 3.Wertheimer E, Gutierrez-Uzquiza A, Rosemblit C, Lopez-Haber C, Sosa MS, Kazanietz MG. Rac signaling in breast cancer: a tale of GEFs and GAPs. Cellular signalling. 2012;24(2):353–362. [DOI] [PMC free article] [PubMed] [Google Scholar]
- 4.Vo BT, Morton D Jr., Komaragiri S, Millena AC, Leath C, Khan SA. TGF-beta effects on prostate cancer cell migration and invasion are mediated by PGE2 through activation of PI3K/AKT/mTOR pathway. Endocrinology. 2013;154(5):1768–1779. [DOI] [PMC free article] [PubMed] [Google Scholar]
- 5.Paplomata E, O'Regan R. The PI3K/AKT/mTOR pathway in breast cancer: targets, trials and biomarkers. Therapeutic advances in medical oncology. 2014;6(4):154–166. [DOI] [PMC free article] [PubMed] [Google Scholar]
- 6.Cheaib B, Auguste A, Leary A. The PI3K/Akt/mTOR pathway in ovarian cancer: therapeutic opportunities and challenges. Chinese journal of cancer. 2015;34(1):4–16. [DOI] [PMC free article] [PubMed] [Google Scholar]
- 7.Morgan TM, Koreckij TD, Corey E. Targeted therapy for advanced prostate cancer: inhibition of the PI3K/Akt/mTOR pathway. Current cancer drug targets. 2009;9(2):237–249. [DOI] [PMC free article] [PubMed] [Google Scholar]
- 8.Xue G, Hemmings BA. PKB/Akt-dependent regulation of cell motility. Journal of the National Cancer Institute. 2013;105(6):393–404. [DOI] [PubMed] [Google Scholar]
- 9.Luo J, Manning BD, Cantley LC. Targeting the PI3K-Akt pathway in human cancer: rationale and promise. Cancer cell. 2003;4(4):257–262. [DOI] [PubMed] [Google Scholar]
- 10.Peterson TR, Laplante M, Thoreen CC, et al. DEPTOR is an mTOR inhibitor frequently overexpressed in multiple myeloma cells and required for their survival. Cell. 2009;137(5):873–886. [DOI] [PMC free article] [PubMed] [Google Scholar]
- 11.Kaizuka T, Hara T, Oshiro N, et al. Tti1 and Tel2 are critical factors in mammalian target of rapamycin complex assembly. The Journal of biological chemistry. 2010;285(26):20109–20116. [DOI] [PMC free article] [PubMed] [Google Scholar]
- 12.Sarbassov DD, Ali SM, Kim DH, et al. Rictor, a novel binding partner of mTOR, defines a rapamycin-insensitive and raptor-independent pathway that regulates the cytoskeleton. Current biology : CB. 2004;14(14):1296–1302. [DOI] [PubMed] [Google Scholar]
- 13.Frias MA, Thoreen CC, Jaffe JD, et al. mSin1 is necessary for Akt/PKB phosphorylation, and its isoforms define three distinct mTORC2s. Current biology : CB. 2006;16(18):1865–1870. [DOI] [PubMed] [Google Scholar]
- 14.Pearce LR, Sommer EM, Sakamoto K, Wullschleger S, Alessi DR. Protor-1 is required for efficient mTORC2-mediated activation of SGK1 in the kidney. The Biochemical journal. 2011;436(1):169–179. [DOI] [PubMed] [Google Scholar]
- 15.Laplante M, Sabatini DM. mTOR signaling in growth control and disease. Cell. 2012;149(2):274–293. [DOI] [PMC free article] [PubMed] [Google Scholar]
- 16.Hay N The Akt-mTOR tango and its relevance to cancer. Cancer cell. 2005;8(3):179–183. [DOI] [PubMed] [Google Scholar]
- 17.Majumder PK, Sellers WR. Akt-regulated pathways in prostate cancer. Oncogene. 2005;24(50):7465–7474. [DOI] [PubMed] [Google Scholar]
- 18.Dibble CC, Cantley LC. Regulation of mTORC1 by PI3K signaling. Trends in cell biology. 2015;25(9):545–555. [DOI] [PMC free article] [PubMed] [Google Scholar]
- 19.Gupta S, Hau AM, Beach JR, et al. Mammalian target of rapamycin complex 2 (mTORC2) is a critical determinant of bladder cancer invasion. PloS one. 2013;8(11):e81081. [DOI] [PMC free article] [PubMed] [Google Scholar]
- 20.Zhong M, Clarke S, Vo BT, Khan SA. The essential role of Gialpha2 in prostate cancer cell migration. Molecular cancer research : MCR. 2012;10(10):1380–1388. [DOI] [PMC free article] [PubMed] [Google Scholar]
- 21.Vo BT, Khan SA. Expression of nodal and nodal receptors in prostate stem cells and prostate cancer cells: autocrine effects on cell proliferation and migration. The Prostate. 2011;71(10):1084–1096. [DOI] [PMC free article] [PubMed] [Google Scholar]
- 22.Caggia S, Chunduri H, Millena AC, et al. Novel role of Gialpha2 in cell migration: Downstream of PI3-kinase-AKT and Rac1 in prostate cancer cells. Journal of cellular physiology. 2018. [DOI] [PMC free article] [PubMed] [Google Scholar]
- 23.Saci A, Cantley LC, Carpenter CL. Rac1 regulates the activity of mTORC1 and mTORC2 and controls cellular size. Molecular cell. 2011;42(1):50–61. [DOI] [PMC free article] [PubMed] [Google Scholar]
- 24.Robbins HL, Hague A. The PI3K/Akt Pathway in Tumors of Endocrine Tissues. Frontiers in endocrinology. 2015;6:188. [DOI] [PMC free article] [PubMed] [Google Scholar]
- 25.Saji M, Ringel MD. The PI3K-Akt-mTOR pathway in initiation and progression of thyroid tumors. Molecular and cellular endocrinology. 2010;321(1):20–28. [DOI] [PMC free article] [PubMed] [Google Scholar]
- 26.Gulhati P, Bowen KA, Liu J, et al. mTORC1 and mTORC2 regulate EMT, motility, and metastasis of colorectal cancer via RhoA and Rac1 signaling pathways. Cancer research. 2011;71(9):3246–3256. [DOI] [PMC free article] [PubMed] [Google Scholar]
- 27.Chen X, Cheng H, Pan T, et al. mTOR regulate EMT through RhoA and Rac1 pathway in prostate cancer. Molecular carcinogenesis. 2015;54(10):1086–1095. [DOI] [PubMed] [Google Scholar]
- 28.Sekulic A, Hudson CC, Homme JL, et al. A direct linkage between the phosphoinositide 3-kinase-AKT signaling pathway and the mammalian target of rapamycin in mitogen-stimulated and transformed cells. Cancer research. 2000;60(13):3504–3513. [PubMed] [Google Scholar]
- 29.Soliman GA, Acosta-Jaquez HA, Dunlop EA, et al. mTOR Ser-2481 autophosphorylation monitors mTORC-specific catalytic activity and clarifies rapamycin mechanism of action. The Journal of biological chemistry. 2010;285(11):7866–7879. [DOI] [PMC free article] [PubMed] [Google Scholar]
- 30.Copp J, Manning G, Hunter T. TORC-specific phosphorylation of mammalian target of rapamycin (mTOR): phospho-Ser2481 is a marker for intact mTOR signaling complex 2. Cancer research. 2009;69(5):1821–1827. [DOI] [PMC free article] [PubMed] [Google Scholar]
- 31.Bos JL, Rehmann H, Wittinghofer A. GEFs and GAPs: critical elements in the control of small G proteins. Cell. 2007;129(5):865–877. [DOI] [PubMed] [Google Scholar]
- 32.Engers R, Ziegler S, Mueller M, Walter A, Willers R, Gabbert HE. Prognostic relevance of increased Rac GTPase expression in prostate carcinomas. Endocrine-related cancer. 2007;14(2):245–256. [DOI] [PubMed] [Google Scholar]
- 33.Kato T, Kawai K, Egami Y, Kakehi Y, Araki N. Rac1-dependent lamellipodial motility in prostate cancer PC-3 cells revealed by optogenetic control of Rac1 activity. PloS one. 2014;9(5):e97749. [DOI] [PMC free article] [PubMed] [Google Scholar]
- 34.Dirat B, Ader I, Golzio M, et al. Inhibition of the GTPase Rac1 mediates the antimigratory effects of metformin in prostate cancer cells. Mol Cancer Ther. 2015;14(2):586–596. [DOI] [PubMed] [Google Scholar]
- 35.Baugher PJ, Krishnamoorthy L, Price JE, Dharmawardhane SF. Rac1 and Rac3 isoform activation is involved in the invasive and metastatic phenotype of human breast cancer cells. Breast cancer research : BCR. 2005;7(6):R965–974. [DOI] [PMC free article] [PubMed] [Google Scholar]
- 36.Kamai T, Shirataki H, Nakanishi K, et al. Increased Rac1 activity and Pak1 overexpression are associated with lymphovascular invasion and lymph node metastasis of upper urinary tract cancer. BMC cancer. 2010;10:164. [DOI] [PMC free article] [PubMed] [Google Scholar]
- 37.Patel V, Rosenfeldt HM, Lyons R, et al. Persistent activation of Rac1 in squamous carcinomas of the head and neck: evidence for an EGFR/Vav2 signaling axis involved in cell invasion. Carcinogenesis. 2007;28(6):1145–1152. [DOI] [PubMed] [Google Scholar]
- 38.Payapilly A, Malliri A. Compartmentalisation of RAC1 signalling. Current opinion in cell biology. 2018;54:50–56. [DOI] [PubMed] [Google Scholar]
- 39.Bian Y, Wang Z, Xu J, Zhao W, Cao H, Zhang Z. Elevated Rictor expression is associated with tumor progression and poor prognosis in patients with gastric cancer. Biochemical and biophysical research communications. 2015;464(2):534–540. [DOI] [PubMed] [Google Scholar]
- 40.Sticz T, Molnar A, Mark A, et al. mTOR activity and its prognostic significance in human colorectal carcinoma depending on C1 and C2 complex-related protein expression. Journal of clinical pathology. 2017;70(5):410–416. [DOI] [PubMed] [Google Scholar]
- 41.Yuan K, Qian C, Zheng R. Prognostic significance of immunohistochemical Rac1 expression in survival in early operable non-small cell lung cancer. Medical science monitor : international medical journal of experimental and clinical research. 2009;15(11):BR313–319. [PubMed] [Google Scholar]
- 42.Zhang JY, Zhang D, Wang EH. Overexpression of small GTPases directly correlates with expression of delta-catenin and their coexpression predicts a poor clinical outcome in nonsmall cell lung cancer. Molecular carcinogenesis. 2013;52(5):338–347. [DOI] [PubMed] [Google Scholar]
Associated Data
This section collects any data citations, data availability statements, or supplementary materials included in this article.


