

Abstract
Focal brain ischemia is best studied in neocortex and striatum. Both show highly vulnerable neurons and high susceptibility to spreading depolarization (SD). Therefore, it has been hypothesized that these two variables generally correlate. However, this hypothesis is contradicted by findings in cerebellar cortex, which contains highly vulnerable neurons to ischemia, the Purkinje cells, but is said to be less susceptible to SD. Here, we found in the rat cerebellar cortex that elevated K+ induced a long-lasting depolarizing event superimposed with SDs. Cerebellar SDs resembled those in neocortex, but negative direct current (DC) shifts and regional blood flow responses were usually smaller. The K+ threshold for SD was higher in cerebellum than in previous studies in neocortex. We then topically applied endothelin-1 (ET-1) to the cerebellum, which is assumed to cause SD via vasoconstriction-induced focal ischemia. Although the blood flow decrease was similar to that in previous studies in neocortex, the ET-1 threshold for SD was higher. Quantitative cell counting found that the proportion of necrotic Purkinje cells was significantly higher in ET-1-treated rats than sham controls even if ET-1 had not caused SDs. Our results suggest that ischemic death of Purkinje cells does not require the occurrence of SD.
Keywords: Spreading depolarization, spreading depression, stroke, cerebellum, Purkinje cell
Introduction
After sudden circulatory arrest, a characteristic sequence of electrocorticographic (ECoG) events occurs. Approximately 20 s after the decrease of regional cerebral blood flow (rCBF), there is a non-spreading depression of spontaneous activity and approximately 90 s thereafter terminal spreading depolarization (SD) starts.1,2 The large negative direct current (DC) shift of terminal SD consists of the initial SD component and a late component, termed negative ultraslow potential (NUP). Both are of high amplitude after circulatory arrest.
The same ECoG sequence is also seen in animals in the ischemic center after middle cerebral artery occlusion (MCAO).3–5 In contrast to systemic circulatory arrest, however, further SDs are typically superimposed on the NUP. The resulting DC potential varies along the continuum from severely ischemic to increasingly well-perfused tissue.4,6,7 These DC potential variations have been illustrated previously (cf. Figure 3 in Hossmann,5 Figure 2 in Dijkhuizen et al.4 and Figure 7 in Dreier et al.8) and provide spatial and temporal landmarks for the local energy status and risk of neuronal death.9 A strong relationship between ECoG and injury is supported by recordings with electrodes over the ischemic territory during 90-min MCAO.3 Thus, various early ECoG variables were associated linearly with cortical infarct volume and neurological outcome after 72 h. These included the SD-initiated NUP quantified as a DC integral over time, the amplitude reduction of SDs superimposed on the NUP, the number of recorded SDs, and the persistent depression of spontaneous activity. The correlation strengths between these variables and the cortical infarct volume were in a similar range to that between rCBF decrease and cortical infarct volume. The nomenclature of the ECoG patterns is not uniform. Yet, under different names, the significant correlation between NUP and infarct size has also been noted in earlier publications on MCAO.4,10 Recent clinical studies in patients with aneurysmal subarachnoid hemorrhage (aSAH) and traumatic brain injury (TBI) have shown that the initial SD component followed by the NUP is also the electrophysiological correlate of the principal damage cascade in humans. With some latency, SD initiates death of the human cerebral cortex in focal ischemia,3,8,11,12 brain death despite continued systemic circulatory function13,14 and after cardiocirculatory arrest.15
Figure 3.

(a) Comparison between groups 2 and 3 (stepwise increase of [K+]ACSF in presence and absence of acetate). (b) Circulatory arrest (CA) by injection of air into the heart via the femoral vein in group 6. The fall in rCBF (trace 1) is accompanied by an increase in IOS (trace 2) which presumably results from a decrease in cerebral blood volume. Thereafter, respiration (fluctuations of expiratory pCO2, trace 8) ceases followed by non-spreading depression of spontaneous activity (red asterisk, traces 6 and 7). Terminal SD starts significantly later. Similar to the neocortex, terminal SD consists of the initial SD component followed by the negative ultraslow potential (NUP).3,11,12,15 Terminal SD is preceded by a shallow and accompanied by a sharp increase in [K+]o. The IOS shows an increase during terminal SD which likely results from changes in light scattering and absorption of the parenchyma.32,62–64
Figure 2.

(a) One of nine SDs of a cluster during [K+]ACSF at 250 mM is shown (taken from experiment 3). In this case, the intracerebellar negative DC shift had a saddle-shaped appearance typical of SD.29 A clear increase of [K+]o was associated with the SD (trace 3). Similar to the experiments in Figure 1, SD-induced depression of activity was not seen in experiment 3, either. (b) Demonstrates that the respiration (cf. expiratory pCO2 in trace 9) led to large mechanical artefacts in both IOS and ECoG recordings. Increase of [K+]o causes marked water uptake and swelling of astrocytes.60,61 The astrocytic swelling might have led to significant alterations in the elasticity of the tissue. This might have enhanced mechanical artefacts, in particular respiratory artefacts. The superposition of respiratory artefacts on the spontaneous brain activity would provide a plausible explanation why SD-induced depression periods were not seen in the AC-ECoG recordings (cf. traces 6 and 7 in (a)). In (a) this hypothesis is further supported by the SD-associated augmentation of the respiratory artefacts at the intracerebellar electrode because SD leads to water uptake and swelling of neurons with further shrinkage of the extracellular space.86 Similar to the swelling of astrocytes, the swelling of neurons might have impacted the elasticity of the tissue.
MCAO is an animal model used to reproduce severe sudden onset ischemia in humans caused, for example, by embolism or thrombotic occlusion of a large vessel. In contrast, the animal model of brain-topical administration of endothelin-1 (ET-1) is interesting because it allows the induction of gradually developing and milder focal ischemia by titrating the constrictive effect of different ET-1 concentrations on cortical arterioles.16 Gradual development of focal ischemia also occurs in the human brain, e.g. in patients with aSAH or vasculitides.3,17–19 Such conditions are not necessarily caused by ET-1 but the ET-1 model is attractive for the basic understanding of this constellation. And indeed, ET-1-induced SDs in the center of hypoperfusion can show gross similarities with SDs that spread in normal, well-supplied tissue. Therefore, it was initially unclear during the development of this model whether the ET-1-induced SDs were actually triggered by an ischemia mechanism.16 However, several different arguments, which will be summarized later in the discussion, now support the hypothesis that ischemia mediates ET-1-induced SDs. Interestingly, there is now evidence that similar SD patterns as in the ET-1 model also occur in microembolism models20,21 and after TBI.22
A further question was whether ET-1-induced SDs are only triggered as a result of developing damage to neurons or are a mechanism mediating histopathological changes. To answer this question, a study was performed in which ∼50% of animals exposed to ET-1 developed spontaneous SDs, and at sacrifice after 24 h, only these 50% of animals developed regions of selective neuronal death.23 In further experiments in animals that showed no spontaneous SDs in response to ET-1, SDs were experimentally induced distant from the ET-1-exposed cranial window, and these spread from the outside into the ET-1-exposed window area. In each of these animals, necrosis developed similar to animals with spontaneous SDs, and neuronal death only occurred in regions exposed to ET-1. Similar to previous studies on MCAO,24,25 these results suggested a causal role of SDs as a mechanism contributing to neuronal death in metabolically stressed tissue.
Based on these results, a further question is whether the mass phenomenon SD is a necessary prerequisite for the development of ischemic cell death in gray matter structures of the brain. All previous studies on the brain-topical ET-1 model have been performed in neocortex, which is characterized by (i) high vulnerability of the pyramidal cells in layers III, IV and V26,27 and (ii) relatively high susceptibility to SD compared to other gray matter structures.28–30 In order to answer the above question, we decided to investigate a gray matter structure in the current study, which contains highly vulnerable neurons to ischemia, but has a low susceptibility to SD. These conditions apply to the cerebellar cortex, in which some of the most vulnerable neurons, the Purkinje cells, are located.27
Thus, we first investigated in vivo in rats whether the threshold values of SD in response to (i) an increase in the baseline extracellular K+ concentration ([K+]o) or (ii) ET-1-induced focal hypoperfusion are higher in the cerebellum than in the neocortex. Then, we studied whether injury and death of Purkinje cells already occur below the threshold for the occurrence of SD or not.
Materials and methods
Animals
The reporting of animal experiments complies with the Animal Research: Reporting of In Vivo Experiments (ARRIVE) Guidelines. All animal experiments were authorized by the animal welfare authorities in Berlin, Germany: Berlin State Office for Health and Social Affairs (LAGeSo), G0152-11, and all experimental procedures were conducted in accordance with the Charité Animal Welfare Guidelines. The animals were housed in groups (two to four animals per cage) under a 12-h light/dark cycle with food and tap water available ad libitum. Sixty-two male Wistar rats (250 to 400 g; Charles River Laboratories, Wilmington, MA, USA) were anesthetized with 100 mg/kg thiopental sodium intraperitoneally (Trapanal®, BYK Pharmaceuticals, Konstanz, Germany), tracheotomized and artificially ventilated (Effenberger Rodent Respirator; Effenberger Med.-Techn. Gerätebau, Pfaffing/Attel, Germany) to maintain an arterial partial pressure of CO2 (pCO2) between 35 and 45 mmHg, an arterial pO2 between 90 and 130 mmHg and an arterial pH between 7.35 and 7.45. The right femoral artery and vein were cannulated and saline solution was continuously infused to keep the vessels open (0.5 ml/h). Systemic arterial pressure (Pressure Monitor BP-1, World Precision Instruments, Berlin, Germany) and expiratory pCO2 (Heyer CO2 Monitor EGM I, Bad Ems, Germany) were continuously monitored. Arterial pO2, pCO2, and pH were serially measured using a Compact 1 Blood Gas Analyzer (AVL Medizintechnik GmbH, Bad Homburg, Germany). Body temperature was maintained at 37.5 ± 0.5 ℃ using a heating pad (Temperature Control FHC, Bowdoinham, ME, USA). The level of anesthesia was assessed by testing motor responses and changes in blood pressure to foot-pinching. If necessary, additional doses of thiopental (25 mg/kg body weight) were applied.
An open cranial window was implanted over the cerebellar vermis with a saline-cooled drill as shown in Figure 1(a). The dura mater was removed and artificial cerebrospinal fluid (ACSF) was applied continuously. The physiological composition of the ACSF in mM was: Na+ 152, K+ 3, Ca2+ 1.5, Mg2+ 1.25, 24.5, Cl− 136, glucose 3.7, and urea 6.7. The ACSF was equilibrated with a gas mixture containing 6.6% O2, 5.9% CO2, and 87.5% N2. A pO2 between 90 and 130 mmHg, a pCO2 between 35 and 45 mmHg, and a pH between 7.35 and 7.45 were accepted as physiological.
Figure 1.

(a) Shows the experimental set-up. An open cranial window was implanted in the area of the cerebellar foliae V and VIa.85 The subdural DC/AC-ECoG was recorded with an Ag/AgCl electrode, the intracerebellar DC/AC-ECoG and [K+]o with a K+-sensitive microelectrode and rCBF as well as IOS with a laser-Dopper flow probe (LDF). (b) Gives the full experiment 1 in which the increase of [K+]ACSF from 3 to 250 mM for 1 h induced a long-lasting depolarizing event superimposed with 34 SDs. In response to the increase in [K+]ACSF, the intracerebellar DC potential showed a negative drift with incomplete recovery after washout, whereas the subdural DC potential displayed a positive drift followed by a negative drift after washout. The positive DC drift at the subdural Ag/AgCl electrode was an electrochemical artefact due to the decrease in [Cl−]ACSF which we replaced with acetate. The superimposed SDs were characterized by a transient negative DC shift at both the intracerebellar and the subdural electrode as well as increases in [K+]o, IOS and rCBF. Note that SD-induced depression of spontaneous activity was not visible. (c) Two of 23 SDs of a cluster under [K+]ACSF at 250 mM are shown (taken from experiment 2). Similar to experiment 1, the SDs are characterized by a negative DC shift at both electrodes and transient increases in rCBF and IOS. Negative DC shifts and IOS change started at different time points indicating that the SDs propagated in the tissue. In contrast to experiment 1, [K+]o did not show significant increases during the SDs in experiment 2. This difference was most likely due to different positions of the electrode tips between different experiments in relationship to the cerebellar cortex layers and the white matter. Similar to experiment 1, SD-induced depression of activity was not seen in experiment 2, either. Note that the IOS increase corresponds with the negative DC shift rather than with the rCBF signal, indicating that it reflects changes in optical features of the parenchyma rather than changes of the cerebellar blood volume.
Animal recording techniques
Regional CBF and the intrinsic optical signal (IOS) were monitored by laser-Doppler flowmetry (LDF) (Periflux 4001, Perimed, Järfälla, Sweden), and the subdural DC/alternate current (AC)-ECoG with a subdural silver/silver chloride (Ag/AgCl) electrode. Changes in [K+]o and intracerebellar DC/AC-ECoG were recorded with a double-barreled K+-sensitive microelectrode in a depth of 300 µm.31,32 The microelectrodes were prepared as described previously from double-barreled thetaglass capillaries (Kugelstätter, Garching, Germany).31 Potassium ionophore I-cocktail A (Fluka/Sigma-Aldrich) ion exchanger was used. The electrodes were connected to a differential amplifier (Jens Meyer, Munich, Germany). Brain tissue partial pressure of oxygen (ptiO2) was measured using a modified Clark-type polarographic O2 microelectrode (OX-10, Unisense A/S Aarhus, Denmark).33 Analog-to-digital conversion was performed using a Power 1401 (Cambridge Electronic Design Limited, Cambridge, UK). Systemic arterial blood pressure, expiratory pCO2, [K+]o, intracerebellar and subdural DC/AC-ECoG and rCBF were continuously recorded using a personal computer and Spike 2 software (version 6, Cambridge Electronic Design Limited, Cambridge, UK).
Experimental paradigms
In group 1 (n = 8), a long-lasting depolarizing event superimposed with SDs was induced by increase of the K+ concentration in the ACSF ([K+]ACSF) from 3 to 250 mM for 1 h similar to a previous study in which [K+]ACSF at 250 mM was topically applied to the neocortex.34 [Na+]ACSF was reduced simultaneously to 24.5 mM. In contrast to the previous experiments in neocortex, acetate substituted Cl−. Thus, [Cl−]ACSF fell from 136 to 5.5 mM, acetate increased to 250 mM and osmolarity increased from ∼330 mosM to ∼570 mosM. In group 2 (n = 9), we determined the K+ threshold for SDs by increasing [K+]ACSF from 3 to 35 mM to 50 mM to 80 mM to 130 mM every 60 min while acetate substituted Cl−. In group 3 (n = 8), we determined the K+ threshold for SDs by increasing [K+]ACSF from 3 to 35 mM to 50 mM to 80 mM to 130 mM every 60 min, but acetate did not substitute Cl−. In both groups 2 and 3, the rise of [K+]ACSF determined [Na+]ACSF to maintain osmolarity at the physiological level of ∼330 mosM. In group 4 (n = 15), we directly applied ET-1 (Sigma-Aldrich, Steinheim, Germany) to the cerebellar surface at 1 µM for 60 min to determine if this would induce hypoperfusion, hypoxia and trigger SDs. This protocol was based on the previous notion from experiments in neocortex that ET-1 at 1 µM is more potent if it is not preceded by a lower concentration of ET-1 because tachyphylaxis is avoided.11,35 Group 5 (n = 12) was the sham control group of group 4. In group 6 (n = 10), we topically applied ET-1 at 100 nM and 1 µM each for 60 min to determine if this would induce hypoperfusion and trigger SDs just like in neocortex.16,23,36,37 Thereafter, air was injected into the heart via the femoral vein to induce cardiocirculatory arrest and terminal SD.
Histology and stereology
Eight animals of group 2, 7 of group 3, 11 of group 4 and 12 of (control) group 5 were perfused transcardially with paraformaldehyde (4%) at 4 h after the experiment. The brains were embedded in paraffin wax, and 5 µm sections were stained with hematoxylin and eosin.23,34 The histological analysis focused on the window area where a quantitative counting of cells was performed using a stereology approach.34,38,39 Quantification in the window area was performed by a blinded investigator (AO).
The optical fractionator probe was used to estimate the total number of (i) healthy, (ii) dark, (iii) pycnotic and (iv) necrotic (red) Purkinje cells in the window area.40 Five sections with an intersection distance of 100 µm were sampled, resulting in a section sampling fraction (ssf) of 0.05. The grid size as well as the counting frame size were chosen to be 10,000 µm2 resulting in a complete sampling of the region of interest, represented by an area sampling fraction (asf) of 1. The asf was calculated as the ratio between the areas of the counting frame and the area defined by the x,y-movements (step length) of the dissector. The counting frame height was chosen to be equal to the mounted thickness of the section.
Sampling was achieved using a video camera connected to the microscope with a 20×/0.7 HCPlan APO objective and image display on a computer screen. The computer-generated counting frames of each section were superimposed in a systematic, uniformly random way using Stereo Investigator software (version 7, MBF Bioscience Williston, VT, USA). The movement in the x,y-plane was motor controlled.
The total cell numbers were estimated according to the following formula: total population = 1/ssf × 1/asf × t/h × ΣQ− where ΣQ− is the total of (i) healthy, (ii) dark, (iii) pycnotic and (iv) necrotic (red) Purkinje cells in the region, t is the mounted thickness of the section and h the counting frame height. The calculation of the coefficient of error for volume and particle estimations was based on the method stated in the work of Gundersen et al.41
Statistics
Animal data were prospectively collected and analyzed by comparing relative changes of rCBF in relation to baseline (=100%) and absolute changes of AC-ECoG power (bandpass: 0.5–45 Hz) and DC potential (bandpass: 0–0.05 Hz) according to the recommendations of the Co-Operative Studies on Brain Injury Depolarizations (COSBID).9 The electrophysiological and rCBF data were analyzed in an un-blinded fashion using LabChart-7 software (ADInstruments, New South Wales, Australia). A meaningful blinding was not possible because both DC and rCBF traces disclosed the animals' group affiliations. Animals were not randomly assigned to the different groups because the results of the initial experimental groups influenced the design of the later groups. However, the histopathological analysis was performed in a randomized and blinded fashion. One animal of group 2, one animal of group 3 and four animals of group 5 were not available for the histopathological analysis because of technical problems during the processing. No prior information was available which would have enabled us to perform sample size estimations based on evidence. We thus chose sample sizes which are standard in the field. Data in text and figures are given as median and interquartile range (IQR). Statistical tests are mentioned in the results section. A P-value of ≤ 0.05 was considered statistically significant.
Results
SDs in the cerebellar vermis in presence of increased [K+]ACSF
In group 1 (n = 8), [K+]o rose from 3.0 to a median of 56.8 (IQR: 46.0–72.4) mM in a cortical depth of 300 µm in response to [K+]ACSF (250 mM) and returned to 3.7 (IQR: 3.2, 4.2) mM after washout (P ≤ 0.05, n = 8, Friedman repeated measures analysis of variance on ranks with post hoc Tukey test (FRmAnovaT)) (Figure 1(b)). The intracerebellar DC potential showed a negative drift of −12.3 (IQR: −11.2, −13.2) mV in response to the increase in [K+]o with an incomplete recovery to −11.0 (IQR: −8.7, −12.9) mV after washout (P ≤ 0.05, n = 8, FRmAnovaT). In contrast, the subdural DC potential displayed a positive drift of 50.2 (IQR: 44.5, 56.7) mV followed by a negative drift to −7.6 (IQR: −1.6, −11.7) after washout (P ≤ 0.05, n = 8, FRmAnovaT). The positive DC drift at the subdural Ag/AgCl electrode was presumably an electrochemical artefact, resulting from the decrease of [Cl−]ACSF because acetate substituted Cl− in the ACSF, and Ag/AgCl electrodes depend on [Cl−]ACSF. Mean arterial pressure (MAP), expiratory pCO2, IOS, rCBF and AC-ECoG power did not show significant changes during administration of high [K+]ACSF.
Similar to earlier experiments in neocortex,34 [K+]ACSF at 250 mM robustly induced SDs in the cerebellar vermis. Twenty-four (IQR: 18, 40) SDs/h were detected in 7/8 experiments. The amplitude of the negative DC shift was −0.9 (IQR: −0.6, −1.4) mV at the subdural electrode and −1.3 (IQR: −0.7, −8.3) mV at the intracerebellar electrode. The IOS significantly increased by 2.8 (IQR: 1.8, 5.2) units (P ≤ 0.05, n = 7, FRmAnovaT). Regional CBF increased from 112 (IQR: 103, 124) % to 137 (IQR: 126, 151) % (P ≤ 0.05, n = 7, FRmAnovaT). [K+]o increased from 44.5 (IQR: 43.3, 82.6) mM to 76.9 (IQR: 48.7, 104.7) mM and returned to 43.5 (IQR: 38.8, 82.3) mM after washout, but this increase was not observed in all experiments. Figures 1(b) and 2(a) show two different experiments with clear SD-associated increases of [K+]o. In contrast, no such increase is noted in the experiment given in Figure 1(c). Neither the subdural nor the intracerebellar AC-ECoG power showed significant changes during SD. As can be seen in Figure 2(b), the AC-ECoG power did not only reflect spontaneous cerebellar activity but also mechanical artefacts due to respiration, which may explain why SD-induced depression of spontaneous activity was not visible. The duration of the IOS increase (44 (IQR: 29, 60) s) was not significantly different from that of the negative DC shift (67 (IQR: 57, 82) s, but significantly shorter than the duration of the rCBF increase (113 (IQR: 81, 122) s (P ≤ 0.05, n = 6, FRmAnovaT). The IOS increase always preceded the rCBF increase by a median of 10 (IQR: 8, 22) s. Configurations of IOS increase and negative DC shift were similar and typically deviated from the configuration of the rCBF increase (Figure 1(c)). The delay between the onset of the IOS and the onset of the negative intracerebellar DC shift was 9 (IQR: 17, 6) s suggesting that SD propagated in the tissue.
In groups 2 (n = 9) and 3 (n = 8), we determined the [K+]ACSF threshold of SD in presence and absence of acetate. The statistical comparisons between the two conditions regarding [K+]o, rCBF, subdural and intracerebellar DC shift and subdural AC-ECoG are given in Figure 3(a). Qualitatively, the increase of [K+]ACSF from 3 to 35 mM to 50 mM to 80 mM to 130 mM resulted in the same changes as observed in presence of [K+]ACSF at 250 mM. The only difference between experiments in presence and absence of acetate concerned the subdural DC shift which was negative in absence of acetate and positive in its presence due to the decrease of [Cl−]ACSF. SDs spontaneously occurred in only 2/9 experiments in presence of acetate and only 3/8 experiments in absence of acetate. Thus, the threshold value of [K+]ACSF in the present experiments in cerebellum was significantly higher, between 130 and 250 mM, than the threshold previously determined in neocortex, between 50 and 130 mM.32,42 When experiments with SDs of groups one to three were pooled, a significant correlation was found between the amplitude of the negative DC shift and the increase of [K+]o during SD (Spearman Rank Order Correlation coefficient: −0,827, P ≤ 0.001, n = 11). The negative DC shift was −5.2 (IQR: −2.0, −14.6) mV in experiments in which SDs were associated with a clearly visible increase of [K+]o (n = 5, Figures 1(b) and 2(a)) and −0.7 (IQR: −0.7, −1.1) mV in the other experiments without such an increase (n = 6, Figure 1(c)) (P = 0.017, Mann–Whitney Rank Sum Test). Given the complex anatomical structure of the cerebellar foliae (Figure 4), the most plausible explanation for the variations in negative DC shift and [K+]o signal is that the positions of the electrode tips varied between different experiments.
Figure 4.
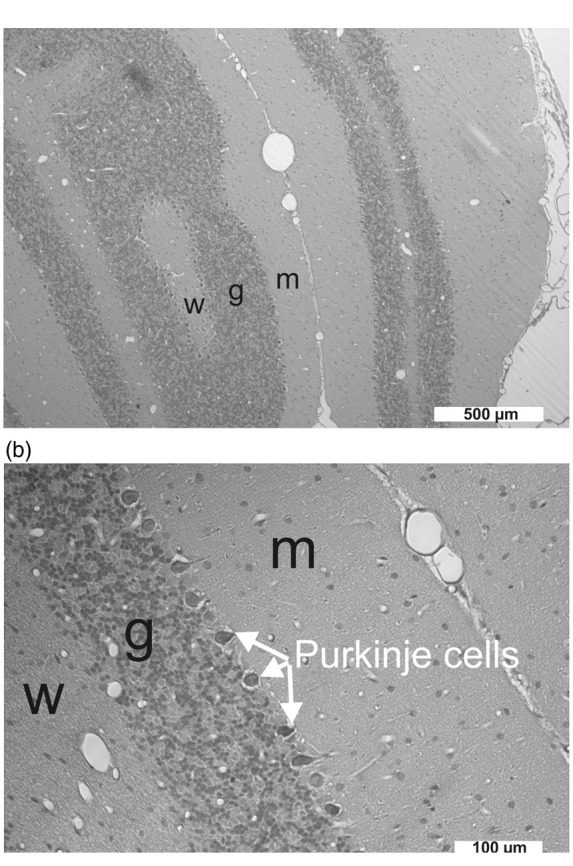
(a) The cerebellar cortex consists of three layers: the molecular layer (m), the granule cell layer (g) and the Purkinje cell layer in the middle. The white matter (w) is below the granule cell layer. Purkinje cell dendritic structures and an unmyelinated afferent fiber system, the parallel fibers, characterize the molecular layer, while the granular layer predominantly comprises small neurons supplied by myelinated afferents, the mossy fibers.55 The cranial window was implanted in the area of the cerebellar foliae V and VIa. Given the complex anatomical structure of the cerebellar foliae, the most likely explanation for the variability of the negative DC shift and the [K+]o signal during SD was that the position of the electrode tip varied with respect to the cortical layers and the white matter between different experiments. (b) Pycnotic Purkinje cells between granule cell layer and molecular layer after exposure to ET-1 at 1 µM (group 4).
SDs in the cerebellar vermis in presence of ET-1
In group 4 (n = 15), ET-1 at 1 µM led to a significant decrease of rCBF from 100 to 54 (IQR: 43, 83; mean value 63% ± 27% (standard deviation)) % with a recovery to 87 (IQR: 72, 103) % (P ≤ 0.05, n = 15, FRmAnovaT), and a significant decrease of ptiO2 from 31.5 (IQR: 22.8, 39.7) to 7.6 (IQR: 5.9, 23.2) mmHg with a recovery to 36.9 (IQR: 14.1, 41.1) mmHg (P ≤ 0.05, n = 14, FRmAnovaT). [K+]o significantly increased from 3.0 to 4.9 (IQR: 3.9, 5.1) mM with a recovery to 3.3 (IQR: 3.2, 3.9) mM after washout (P ≤ 0.05, n = 8, FRmAnovaT). There was a significant negative drift (i) of the subdural DC potential to −2.7 (IQR: −1.4, −5.2) mV with a partial recovery to −1.0 (IQR: 0.3, −3.7) mV, and (ii) of the intracerebellar DC potential to −2.9 (IQR: −1.3, −4.9) mV with a partial recovery to −1.0 (IQR: 0.0, −2.5) mV (both: P ≤ 0.05, n = 11, FRmAnovaT). The subdural power showed a significant decrease from 100 to 83 (IQR: 30, 96) % (P ≤ 0.05, n = 11, FRmAnovaT) without recovery (80 (IQR: 41, 101) %). No such changes were observed in the sham control group 5 (n = 12).
SDs were identified in 5/15 rats under ET-1 at 1 µM in group 4. These five experiments are illustrated in Figure 5. The DC potential showed a sharper deflection and reached a significantly more negative value in these experiments than in the remaining ones (subdural DC amplitude: −7.6 (IQR: −6.3, −9.0) mV versus −1.5 (IQR: −2.1, −1.3) mV, P = 0.004; intracerebellar DC amplitude: −6.1 (IQR: −3.8, −6.4) mV versus −1.3 (IQR: −1.3, −2.1) mV, P = 0.006; both Mann–Whitney Rank Sum Tests). The subdural AC-ECoG power fell from 100% to a significantly lower level than in the remaining experiments (27 (IQR: 13, 30) % versus 94 (IQR: 87, 97) %, P = 0.011; Mann–Whitney Rank Sum Test) and only showed a partial recovery to 39 (IQR: 39, 44) %. In experiments showing SDs, rCBF dropped to a lower value than in the other experiments, but without reaching statistical significance (50 (IQR: 37, 50) % versus 68 (IQR: 46, 93) %, P = 0.098; Mann–Whitney Rank Sum Test).
Figure 5.

In group 4, 5/15 rats displayed the signature of SDs under ET-1 at 1 µM. These recordings are shown here. Similar to K+-induced SDs, it was more difficult to identify ET-1-induced SDs in the cerebellar cortex than in the neocortex. However, using the known patterns in the neocortex (for example, cf. Figure 4 in Oliveira-Ferreira et al.11), typical features of ET-1-induced SDs could also be found in the cerebellar cortex. As can be seen, they were characterized by negative deflections of the DC potential and depressions of spontaneous activity (cf. red asterisks).
In group 6 (n = 10), topical administration of ET-1 at 100 nM and 1 µM, each for 60 min, did not induce SDs. ET-1 at 100 nM caused a decrease of rCBF to 93 (IQR: 90, 104) %. ET-1 at 1 µM further significantly decreased rCBF to 84 (IQR: 63, 92) % (P ≤ 0.05, n = 9, FRmAnovaT). At the end of these experiments, cardiac arrest was induced by injection of air into the heart via the femoral vein. Similar to previous in vivo experiments in neocortex,15 the latency from the onset of the drop in MAP to the moment when rCBF dropped to a level of 10% was 3 (IQR: 3, 4) s. The latencies from the onset of the rCBF decline to (i) the complete respiratory arrest (determined by the arrest of expiratory pCO2 fluctuations) was 13 (IQR: 11, 13) s, to (ii) the non-spreading depression of spontaneous activity 23 (IQR: 20, 25) s, and to (iii) the terminal SD 106 (IQR: 72, 118) s. The latency between non-spreading depression and terminal SD was 81 (IQR: 50, 99) s. During the non-spreading depression of the spontaneous activity, the intracerebellar and subdural DC potentials showed small positive deflections of 0.7 (IQR: 0.5, 0.8) and 0.6 (IQR: 0.3, 0.6) mV, and [K+]o rose to 7.4 (IQR: 5.3, 8.1) mM. Terminal SD was characterized by intracerebellar and subdural sharp initial negative DC shifts of −9.5 (IQR: −9.0, −14.4) and −3.7 (IQR: −3.2, −4.1) mV and an increase of [K+]o to 38 (IQR: 31, 58) mM. The second DC component of the often saddle-shaped terminal SD reached −15.5 (IQR: −11.1, −20.2, intracerebellar electrode) mV and −5.8 (IQR: −4.9, −7.0, subdural electrode) mV, while [K+]o further increased to 65 (IQR: 48, 77) mM. Half an hour after the onset of the terminal SD, intracerebellar and subdural DC potential had partially returned to −9.5 (IQR: −7.1, −12.6) mV and −4.4 (IQR: −2.6, −6.0) mV and [K+]o to 56 (IQR: 52, 58) mM. When rCBF fell in the wake of circulatory arrest, the IOS variably changed by 15 (IQR: −7, 17) units. During the terminal SD, there was a small but significant increase by 3.6 (IQR: 3.1, 4.4) units (P = 0.016; Wilcoxon Signed Rank Test) (Figure 3(b)). The latency between this increase in IOS and the onset of the terminal SD at the intracerebellar electrode was 14 (IQR: 12, 17) s. The delay of the onsets of terminal SD between subdural and intracerebellar electrode was 5 (IQR: 1, 11) s.
Histological changes in groups 2, 3, 4 and 5
The total estimated population of (i) healthy, (ii) dark, (iii) pycnotic and (iv) necrotic (red) Purkinje cells in the window region was 21,120 (IQR: 19,655, 24,357) in the control group 5 (n = 12), 22,060 (IQR: 18730, 23140) in the ET-1 group 4 (n = 11), 21,260 (IQR: 18,090, 22,050) in the high K+ group 3 (n = 7) and 19,420 (IQR: 18,375, 20,140) in the high K+/acetate group 2 (n = 8). The sizes of the total estimated populations of Purkinje cells were not different between the four groups. The coefficient of error for the quantification was 4 (IQR: 4, 5) % for healthy, 10 (IQR: 8, 12) % for dark, 12 (IQR: 7, 15) % for pycnotic, 13 (IQR: 9, 17) % for necrotic (red) Purkinje cells and 4 (IQR: 4, 4) % for the total population, which is considered acceptable given the biological variation.
The number of healthy Purkinje cells was significantly lower (Figure 6), whereas the number of necrotic (red) neurons was significantly higher in the three treatment groups than in control group 5. Only in the ET-1 group 4, pycnotic Purkinje cells were significantly more numerous than in the control group. Only 2/11 cerebellums available for histological analysis showed SDs in group 4. Therefore, a statistical analysis comparing the histopathology of cerebellar window areas with and without SDs was not possible. However, it may be mentioned that the two cerebellums with SDs showed a proportion of 14.9 and 16.6% of red (necrotic) cells in the total Purkinje cells while their median proportion was 4.3 (IQR: 1.7, 7.7) % in the remaining cerebellums without SDs.
Figure 6.

Histopathological changes in groups 2, 3, 4 and 5. The number of healthy Purkinje cells was significantly lower, whereas the number of necrotic (red) neurons was significantly higher in the three treatment groups than in control group 5. The white arrows point at Purkinje cells with increasing injury from (a) to (d). The asterisks indicate a P-value ≤ 0.05.
If only experiments were compared with the control experiments in which no SDs occurred under ET-1, the percentage of healthy Purkinje cells was still significantly lower in the ET-1-treated window area (57.3 (IQR: 50.2, 70.3) % versus 88 (IQR: 79, 93) %, P = 0.005), while the percentages of pycnotic and necrotic (red) Purkinje cells were significantly higher (pycnotic cells: 24.6 (IQR: 21.4, 34.6) versus 3.4 (IQR: 1.5, 7.5) %, P ≤ 0.001; and necrotic cells: 4.3 (IQR: 1.7, 7.7) versus 0.0 (IQR: 0.0, 0.0), P ≤ 0.001; Mann–Whitney Rank Sum Tests).
In group 6, the cardiac arrest by injection of air into the heart via the femoral vein (Figure 3(b)) precluded that perfusion fixation could be transcardially performed with paraformaldehyde at 4 h after the experiment. Therefore, it was not possible to perform a histological analysis.
Discussion
The [K+]ACSF threshold of SD in cerebellar cortex
The [K+]ACSF threshold of SDs was higher in cerebellar cortex than in previous studies in neocortex.32,42 This is consistent with earlier observations that the mammalian cerebellum is generally less susceptible to SD than the neocortex.43–45 Possibly, this is due to the extracellular volume fraction of the superficial molecular layer which is significantly higher than that of neocortex.46 The larger extracellular space should dilute ions, metabolites and neuroactive substances released from the cells and should thus protect against SD.47 In addition, the special features of Bergmann glial cells48 could contribute to the lower susceptibility of the cerebellar cortex to SD given the important protective roles of astrocytes against SD.7,8,49
Replacement of [Cl−]ACSF by acetate in cerebellum and brain stem facilitates SD spread from its initiation site.50–54 However, acetate did not lower the [K+]ACSF threshold of SDs in the present study. These results do not contradict each other as the mechanisms of SD ignition by K+ are likely different from the mechanism of SD spread in normal tissue.7,29
As in earlier reports, cerebellar SDs were essentially similar to those in neocortex.51,55–57 Consisting of a negative DC shift, they lasted for at least 1 min and showed a predominantly hyperemic rCBF response.58 The DC shift amplitude correlated with the peak of [K+]o. A large variability of these two parameters between different experiments probably resulted from different electrode positions in relation to the different anatomical layers, which is presumably due to the complexity of the cerebellar foliae as illustrated in Figure 4. It has been reported that the largest negative DC shifts are typically recorded in the granular layer and the smallest in either the molecular layer near the midline or the white matter.55 We performed our recordings close to the midline. This may explain why only small amplitudes were recorded in many experiments. Given the recording depth at 300 µm, the majority of the electrode tips were most likely positioned in the molecular layer (Figure 4(a)). However, in future studies, electrode placement in relation to the Purkinje cells could be optimized using continuous low frequency stimulation of the contralateral inferior olivary nucleus as described by Gold and Lauritzen.59
Electrode placement might have been further complicated in our experiments by astrocytic swelling in response to increased [K+]o.60,61 In turn, this might have led to significant changes in tissue elasticity, amplifying mechanical, especially respiratory, artifacts as shown in Figure 2. AC-ECoG superposition with respiratory artifacts then presumably masked the SD-induced spreading depression of spontaneous activity under elevated [K+]ACSF.
K+-induced SD was associated with increased light reflectance, measured as increased IOS. This signal clearly preceded the rCBF change, was of similar duration as the negative DC shift and resembled the IOS during SD in brain slices.32,62,63 This suggests that the IOS reflected parenchymal changes in light scattering and absorption64 rather than changes in cerebellar blood volume. An IOS due to SD-induced vasodilatation and increased cerebellar blood volume is also excluded because this would have led to a decreased IOS by increased light absorption. Our experimental setup did not allow us to determine the velocity of SD propagation, but the delays between IOS and negative DC shift suggested that K+-induced SDs spread in the cerebellum similar to previous studies.55,65,66
Similar to earlier reports, global cerebellar ischemia after circulatory arrest led to terminal SD.45,57,67 Similar to neocortex in animals and humans,1,2,15 the terminal SD was typically preceded by non-spreading depression of spontaneous activity and a gradual increase of [K+]o. This increase might result from activation of G-protein-dependent Ca2+-sensitive and ATP-sensitive neuronal K+ channels68–70 and has already been found in earlier studies on cerebellum.57,67 To our knowledge, however, the occurrence of non-spreading depression of spontaneous activity is not yet documented in the cerebellum. At the end of this first ischemic phase, terminal SD started abruptly with a steep increase in [K+]o. Several authors recognized early on that the initial component of terminal SD has a close phenomenological similarity to SD in normal tissue,2,57,71,72 although there are also important differences such as the sensitivity to drugs.7,73,74 The initial SD component is then followed by a late component, the NUP.15 This characteristic sequence after circulatory arrest is also found in the cerebellum.
ET-1-induced SDs in the cerebellum
ET-1-induced SDs were identified by the negative DC shift in combination with a characteristic depression of spontaneous activity. Similar to KCl-induced SDs, the signals of ET-1-induced SDs were more subtle in the cerebellum than in earlier studies in the neocortex.11,16 Overall, however, the observed pattern was similar to that in neocortex (cf., for example, Figure 4 in Oliveira-Ferreira et al.11).
Several arguments have supported the concept that ET-1-induced SDs in neocortex result from vasoconstriction-related rCBF decrease. Thus, in contrast to K+-induced SDs, ET-1-induced SDs started from a slightly but significantly decreased rCBF level.16 This was further substantiated by direct imaging of pial arteriolar constrictions.11 In contrast to diameters of large arterioles, medium and small arteriolar diameters decreased significantly in response to ET-1 before SD onset. Further, characteristic signs of ischemia43,55 such as a gradual increase of [K+]o16 and decrease in extracellular pH11 preceded ET-1-induced SDs. Their receptor profile also indicated ischemia as a cause, as the ETA receptor antagonist BQ-123 completely blocked the SDs in contrast to an ETB receptor antagonist.36 Additionally, the occurrence of neuronal necrosis after ET-1-induced SDs supported the view that they result from ischemia.11,23 Finally, ET-1-induced SDs, unlike K+-induced SDs, did not occur in brain slices. Slices have no intact circulation and thus exclude the occurrence of SD mediated by vasoconstriction-related ischemia.16,75
ECoG features of the brain-topical ET-1 model in rat neocortex deviate from MCAO models.3 Thus, ET-1-induced SDs, unlike MCAO-induced SDs, are generally not preceded by non-spreading depression of spontaneous activity in the center of hypoperfusion. Instead, the first ET-1-induced SD typically induces spreading depression of activity.11 Activity depression can be persistent or transient in the ET-1 model, while it is typically persistent in the MCAO model. A cluster of recurring, more or less prolonged SDs superimposed on a low amplitude NUP may occur in both models, but a high amplitude NUP is more common in the MCAO model.3,4,10,11,16 Importantly, in the ET-1 model also relatively harmless-looking SDs were already associated with cell death in the ET-1-exposed cortex at sacrifice after 24 h.23 If no SDs occurred under ET-1, no cell death occurred in neocortex. However, if KCl-induced SDs spread from the outside into ET-1-exposed cortex, which had previously shown no SDs, cell death was detected in the ET-1-exposed cortex. This indicated that SDs promote the occurrence of cell death in metabolically compromised neocortex.
Whereas in previous studies in neocortex, approximately 20% of rats developed SDs in response to ET-1 at 10 nM, 80% in response to 100 nM and 100% in response to 1 µM,16,36,37 in the present study in cerebellum, only 33% of the rats developed SDs in response to ET-1 at 1 µM. And this was only the case when the wash-in of ET-1 at 1 µM was not preceded by the wash-in of ET-1 at a lower concentration to avoid ET-1-related tachyphylaxis.11,35 Importantly, the difference between the susceptibilities to SD between neocortex and cerebellum was not due to the strength of the mean rCBF decrease in response to ET-1 at 1 µM, which was exactly 63% both in a previous study in neocortex11 and in the current study in cerebellum under otherwise identical experimental conditions. Therefore, we suggest that the lower susceptibility to SDs in the cerebellum results rather from special properties of cerebellar neurons and glial cells and in particular from the larger extracellular space than from a lower sensitivity of arterioles to ET-1 and less pronounced ischemia.46,47 Within cerebellar experiments, however, a lower rCBF value in response to ET-1 may have been the reason why some animals developed SDs and others did not, as suggested by the subgroup analysis of experiments in group 4. However, this question needs to be clarified in a dedicated study.
The important histopathological finding of the present study is that a significantly smaller population of healthy Purkinje cells was observed in ET-1-treated animals than in the sham control group, although no SDs occurred in most animals. Even if only experiments were compared with the control experiments in which ET-1 did not induce SDs, the percentage of healthy Purkinje cells was still significantly lower in the ET-1-treated window area, while the percentages of pycnotic and necrotic (red) Purkinje cells were significantly higher. We would most likely interpret these results in such a way that, in the case of mild cerebellar ischemia, individual Purkinje cells first depolarize and die before SD occurs. Thus, in contrast to the neocortex, the cerebellar cytoarchitecture seems to prevent the surrounding cells from being immediately and directly drawn into the mass depolarization process termed SD. SDs, however, occur in the cerebellum when ischemia is more severe. Accordingly, terminal SD in the wake of circulatory arrest did not differ significantly between cerebellum and neocortex. The question as to whether the reduced susceptibility of the cerebellum to SD has a protective effect on Purkinje cells, which is required because Purkinje cells are particularly vulnerable, or vice versa is a factor contributing to the high vulnerability of Purkinje cells, cannot be answered with the present experiments. This debate is complex and also conducted for other brain structures. Its pros and cons can be found in previous reviews.1,6,7 Our current view is that SD facilitates neuronal injury in metabolically disturbed tissue, while it could be beneficial in surrounding tissue because it upregulates growth factors, stress response proteins and inflammatory mediators,76–79 may have preconditioning actions80 and may enhance plasticity81 and regeneration.82,83
Our study has some limitations: For example, (i) the group sizes were not sufficient to compare whether animals developing ET-1-induced SDs show significantly more cellular injury than animals not developing SDs. This should be studied in future experiments. (ii) Perfusion fixation was already performed at 4 h after the experiment. Lesion maturation takes longer. However, even at sacrifice after 4 h, it could be demonstrated that the populations of injured and dead Purkinje cells were significantly higher in ET-1-treated animals than controls. (iii) To obtain a count independent of size and orientation of the cells for thin sections, counting of consecutive section pairs using the physical fractionator probe is recommended. However, the complex cerebellar anatomy rendered it difficult to obtain a perfect match between adjacent sections. Thus, the alignment of a saved image of a section superimposed on a live image of the next section showed too much variation to establish a reliable region of interest. Therefore, the optical-fractionator probe was chosen instead.
Conclusion
Animal models of focal cerebellar ischemia exist as a part of thromboembolic stroke models in the posterior circulation.84 However, the brain topical ET-1 model is interesting because it allows us to study a more subtle and localized form of focal ischemia in a controlled fashion. Since the cytoanatomy differs greatly between cerebellar cortex and neocortex, a direct comparison of the ET-1 model between these structures can be used to investigate in detail whether and how cytoanatomy influences the course of focal ischemia. In particular, future studies could examine whether and how this influences the outcome of therapeutic interventions. Nevertheless, the interpretation of the signals in the mammalian cerebellum poses a greater challenge than in the neocortex which might explain why there have been no studies on focal cerebellar ischemia and SD so far.
Funding
The author(s) disclosed receipt of the following financial support for the research, authorship, and/or publication of this article: This work was supported by Deutsche Forschungsgemeinschaft (DFG DR 323/5-1 and DFG DR 323/10-1), and FP7 no 602150 CENTER-TBI to Dr. Dreier.
Declaration of conflicting interests
The author(s) declared no potential conflicts of interest with respect to the research, authorship, and/or publication of this article.
Author's contributions
Ana Ferreira: designed and performed the experiments, analyzed data, performed the histopathological analysis, contributed to the draft and approved the manuscript before submission. Sebastian Major: contributed to the experimental design, supervised the data storage and documentation, designed the blinding procedure for the histopathological analysis and approved the manuscript before submission. Ingo Przesdzing designed and supervised the histopathological analysis and approved the manuscript before submission. Eun-Jeung Kang: contributed to the intellectual content and approved the manuscript before submission. Jens Dreier: planned the study, designed experiments, analyzed data, drafted and finalized the manuscript and approved the manuscript before submission.
References
- 1.Dreier JP. The role of spreading depression, spreading depolarization and spreading ischemia in neurological disease. Nat Med 2011; 17: 439–447. [DOI] [PubMed] [Google Scholar]
- 2.Leão AAP. Further observations on the spreading depression of activity in the cerebral cortex. J Neurophysiol 1947; 10: 409–414. [DOI] [PubMed] [Google Scholar]
- 3.Luckl J, Lemale CL, Kola V, et al. The negative ultraslow potential, electrophysiological correlate of infarction in the human cortex. Brain 2018; 141: 1734–1752. [DOI] [PMC free article] [PubMed] [Google Scholar]
- 4.Dijkhuizen RM, Beekwilder JP, van der Worp HB, et al. Correlation between tissue depolarizations and damage in focal ischemic rat brain. Brain Res 1999; 840: 194–205. [DOI] [PubMed] [Google Scholar]
- 5.Hossmann KA. Periinfarct depolarizations. Cerebrovasc Brain Metab Rev 1996; 8: 195–208. [PubMed] [Google Scholar]
- 6.Hartings JA, Shuttleworth CW, Kirov SA, et al. The continuum of spreading depolarizations in acute cortical lesion development: examining Leao's legacy. J Cereb Blood Flow Metab 2017; 37: 1571–1594. [DOI] [PMC free article] [PubMed] [Google Scholar]
- 7.Dreier JP, Reiffurth C. The stroke-migraine depolarization continuum. Neuron 2015; 86: 902–922. [DOI] [PubMed] [Google Scholar]
- 8.Dreier JP, Isele T, Reiffurth C, et al. Is spreading depolarization characterized by an abrupt, massive release of Gibbs free energy from the human brain cortex?. Neuroscientist 2013; 19: 25–42. [DOI] [PMC free article] [PubMed] [Google Scholar]
- 9.Dreier JP, Fabricius M, Ayata C, et al. Recording, analysis, and interpretation of spreading depolarizations in neurointensive care: review and recommendations of the COSBID research group. J Cereb Blood Flow Metab 2017; 37: 1595–1625. [DOI] [PMC free article] [PubMed] [Google Scholar]
- 10.Higuchi T, Takeda Y, Hashimoto M, et al. Dynamic changes in cortical NADH fluorescence and direct current potential in rat focal ischemia: relationship between propagation of recurrent depolarization and growth of the ischemic core. J Cereb Blood Flow Metab 2002; 22: 71–79. [DOI] [PubMed] [Google Scholar]
- 11.Oliveira-Ferreira AI, Milakara D, Alam M, et al. Experimental and preliminary clinical evidence of an ischemic zone with prolonged negative DC shifts surrounded by a normally perfused tissue belt with persistent electrocorticographic depression. J Cereb Blood Flow Metab 2010; 30: 1504–1519. [DOI] [PMC free article] [PubMed] [Google Scholar]
- 12.Hartings JA, York J, Carroll CP, et al. Subarachnoid blood acutely induces spreading depolarizations and early cortical infarction. Brain 2017; 140: 2673–2690. [DOI] [PMC free article] [PubMed] [Google Scholar]
- 13.Carlson AP, Shuttleworth CW, Major S, et al. Terminal spreading depolarizations causing electrocortical silencing prior to clinical brain death: case report. J Neurosurg 2018; 1: 1–7. [DOI] [PubMed] [Google Scholar]
- 14.Dreier JP, Major S, Lemale CL, et al. Correlates of spreading depolarization, spreading depression and negative ultraslow potential in epidural versus subdural electrocorticography. Front Neurosci 2019; 13: 373. DOI:10.3389/fnins.2019.00373. [DOI] [PMC free article] [PubMed] [Google Scholar]
- 15.Dreier JP, Major S, Foreman B, et al. Terminal spreading depolarization and electrical silence in death of human cerebral cortex. Ann Neurol 2018; 83: 295–310. [DOI] [PMC free article] [PubMed] [Google Scholar]
- 16.Dreier JP, Kleeberg J, Petzold G, et al. Endothelin-1 potently induces Leao's cortical spreading depression in vivo in the rat: a model for an endothelial trigger of migrainous aura?. Brain 2002; 125: 102–112. [DOI] [PubMed] [Google Scholar]
- 17.Sakowitz OW, Santos E, Nagel A, et al. Clusters of spreading depolarizations are associated with disturbed cerebral metabolism in patients with aneurysmal subarachnoid hemorrhage. Stroke 2013; 44: 220–223. [DOI] [PubMed] [Google Scholar]
- 18.Dreier JP, Woitzik J, Fabricius M, et al. Delayed ischaemic neurological deficits after subarachnoid haemorrhage are associated with clusters of spreading depolarizations. Brain 2006; 129: 3224–3237. [DOI] [PubMed] [Google Scholar]
- 19.Dreier JP, Major S, Manning A, et al. Cortical spreading ischaemia is a novel process involved in ischaemic damage in patients with aneurysmal subarachnoid haemorrhage. Brain 2009; 132: 1866–1881. [DOI] [PMC free article] [PubMed] [Google Scholar]
- 20.Nozari A, Dilekoz E, Sukhotinsky I, et al. Microemboli may link spreading depression, migraine aura, and patent foramen ovale. Ann Neurol 2010; 67: 221–229. [DOI] [PMC free article] [PubMed] [Google Scholar]
- 21.Bere Z, Obrenovitch TP, Kozak G, et al. Imaging reveals the focal area of spreading depolarizations and a variety of hemodynamic responses in a rat microembolic stroke model. J Cereb Blood Flow Metab 2014; 34: 1695–1705. [DOI] [PMC free article] [PubMed] [Google Scholar]
- 22.Balanca B, Meiller A, Bezin L, et al. Altered hypermetabolic response to cortical spreading depolarizations after traumatic brain injury in rats. J Cereb Blood Flow Metab 2017; 37: 1670–1686. [DOI] [PMC free article] [PubMed] [Google Scholar]
- 23.Dreier JP, Kleeberg J, Alam M, et al. Endothelin-1-induced spreading depression in rats is associated with a microarea of selective neuronal necrosis. Exp Biol Med 2007; 232: 204–213. [PubMed] [Google Scholar]
- 24.Busch E, Gyngell ML, Eis M, et al. Potassium-induced cortical spreading depressions during focal cerebral ischemia in rats: contribution to lesion growth assessed by diffusion-weighted NMR and biochemical imaging. J Cereb Blood Flow Metab 1996; 16: 1090–1099. [DOI] [PubMed] [Google Scholar]
- 25.Takano K, Latour LL, Formato JE, et al. The role of spreading depression in focal ischemia evaluated by diffusion mapping. Ann Neurol 1996; 39: 308–318. [DOI] [PubMed] [Google Scholar]
- 26.García JL, Anderson ML.Circulatory disorders and their effect on the brain. In: Davis RL, Robertson DM. (eds). Textbook of neuropathology, Baltimore: Williams & Wilkins, 1997, pp. 715–822. [Google Scholar]
- 27.Pulsinelli WA. Selective neuronal vulnerability: morphological and molecular characteristics. Prog Brain Res 1985; 63: 29–37. [DOI] [PubMed] [Google Scholar]
- 28.Kaufmann D, Theriot JJ, Zyuzin J, et al. Heterogeneous incidence and propagation of spreading depolarizations. J Cereb Blood Flow Metab 2017; 37: 1748–1762. [DOI] [PMC free article] [PubMed] [Google Scholar]
- 29.Somjen GG. Mechanisms of spreading depression and hypoxic spreading depression-like depolarization. Physiol Rev 2001; 81: 1065–1096. [DOI] [PubMed] [Google Scholar]
- 30.Milakara D, Grozea C, Dahlem M, et al. Simulation of spreading depolarization trajectories in cerebral cortex: correlation of velocity and susceptibility in patients with aneurysmal subarachnoid hemorrhage. Neuroimage Clin 2017; 16: 524–538. [DOI] [PMC free article] [PubMed] [Google Scholar]
- 31.Windmuller O, Lindauer U, Foddis M, et al. Ion changes in spreading ischaemia induce rat middle cerebral artery constriction in the absence of NO. Brain 2005; 128: 2042–2051. [DOI] [PubMed] [Google Scholar]
- 32.Petzold GC, Windmuller O, Haack S, et al. Increased extracellular K + concentration reduces the efficacy of N-methyl-D-aspartate receptor antagonists to block spreading depression-like depolarizations and spreading ischemia. Stroke 2005; 36: 1270–1277. [DOI] [PubMed] [Google Scholar]
- 33.Offenhauser N, Thomsen K, Caesar K, et al. Activity-induced tissue oxygenation changes in rat cerebellar cortex: interplay of postsynaptic activation and blood flow. J Physiol 2005; 565: 279–294. [DOI] [PMC free article] [PubMed] [Google Scholar]
- 34.Dreier JP, Victorov IV, Petzold GC, et al. Electrochemical failure of the brain cortex is more deleterious when it is accompanied by low perfusion. Stroke 2013; 44: 490–496. [DOI] [PubMed] [Google Scholar]
- 35.Hollenberg SM, Shelhamer JH, Cunnion RE. Tachyphylaxis to the vasopressor effects of endothelin in rat aortic rings. Am J Physiol 1993; 264: H352–356. [DOI] [PubMed] [Google Scholar]
- 36.Kleeberg J, Petzold GC, Major S, et al. ET-1 induces cortical spreading depression via activation of the ETA receptor/phospholipase C pathway in vivo. Am J Physiol Heart Circ Physiol 2004; 286: H1339–1346. [DOI] [PubMed] [Google Scholar]
- 37.Petzold GC, Einhaupl KM, Dirnagl U, et al. Ischemia triggered by spreading neuronal activation is induced by endothelin-1 and hemoglobin in the subarachnoid space. Ann Neurol 2003; 54: 591–598. [DOI] [PubMed] [Google Scholar]
- 38.Eriksen N, Rostrup E, Andersen K, et al. Application of stereological estimates in patients with severe head injuries using CT and MR scanning images. Br J Radiol 2010; 83: 307–317. [DOI] [PMC free article] [PubMed] [Google Scholar]
- 39.Eriksen N, Rostrup E, Fabricius M, et al. Early focal brain injury after subarachnoid hemorrhage correlates with spreading depolarizations. Neurology 2019; 92: e326–e341. [DOI] [PubMed] [Google Scholar]
- 40.West MJ, Slomianka L, Gundersen HJ. Unbiased stereological estimation of the total number of neurons in thesubdivisions of the rat hippocampus using the optical fractionator. Anat Rec 1991; 231: 482–497. [DOI] [PubMed] [Google Scholar]
- 41.Gundersen HJ, Jensen EB, Kieu K, et al. The efficiency of systematic sampling in stereology–reconsidered. J Microsc 1999; 193: 199–211. [DOI] [PubMed] [Google Scholar]
- 42.Dreier JP, Ebert N, Priller J, et al. Products of hemolysis in the subarachnoid space inducing spreading ischemia in the cortex and focal necrosis in rats: a model for delayed ischemic neurological deficits after subarachnoid hemorrhage?. J Neurosurg 2000; 93: 658–666. [DOI] [PubMed] [Google Scholar]
- 43.Rhoton A, Goldring S, O'Leary JL. Comparison of direct cerebral and cerebellar cortical responses in the cat. Am J Physiol 1960; 199: 677–682. [DOI] [PubMed] [Google Scholar]
- 44.Cain SM, Bohnet B, LeDue JM, et al. In vivo imaging reveals that pregabalin inhibits cortical spreading depression and propagation to subcortical brain structures. Proc Natl Acad Sci U S A 2017; 114: 2401–2406. [DOI] [PMC free article] [PubMed] [Google Scholar]
- 45.Fifkova E, Bures J, Koshtoyants OK, et al. Leao's spreading depression in the cerebellum of rat. Experientia 1961; 17: 572–573. [DOI] [PubMed] [Google Scholar]
- 46.Sykova E, Nicholson C. Diffusion in brain extracellular space. Physiol Rev 2008; 88: 1277–1340. [DOI] [PMC free article] [PubMed] [Google Scholar]
- 47.Lehmenkuhler A, Sykova E, Svoboda J, et al. Extracellular space parameters in the rat neocortex and subcortical white matter during postnatal development determined by diffusion analysis. Neuroscience 1993; 55: 339–351. [DOI] [PubMed] [Google Scholar]
- 48.De Zeeuw CI, Hoogland TM. Reappraisal of Bergmann glial cells as modulators of cerebellar circuit function. Front Cell Neurosci 2015; 9: 246. [DOI] [PMC free article] [PubMed] [Google Scholar]
- 49.Largo C, Cuevas P, Somjen GG, et al. The effect of depressing glial function in rat brain in situ on ion homeostasis, synaptic transmission, and neuron survival. J Neurosci 1996; 16: 1219–1229. [DOI] [PMC free article] [PubMed] [Google Scholar]
- 50.Richter F, Rupprecht S, Lehmenkuhler A, et al. Spreading depression can be elicited in brain stem of immature but not adult rats. J Neurophysiol 2003; 90: 2163–2170. [DOI] [PubMed] [Google Scholar]
- 51.Lauritzen M, Rice ME, Okada Y, et al. Quisqualate, kainate and NMDA can initiate spreading depression in the turtle cerebellum. Brain Res 1988; 475: 317–327. [DOI] [PubMed] [Google Scholar]
- 52.Richter F, Bauer R, Lehmenkühler A, et al. Spreading depression in the brainstem of the adult rat: electrophysiological parameters and influences on regional brainstem blood flow. J Cereb Blood Flow Metab 2008; 28: 984–994. [DOI] [PubMed] [Google Scholar]
- 53.Leão AAP.On the spread of spreading depression. In: Brazier MAB. (ed). Brain function cortical excitability and steady potentials, Berkeley, CA: University of California Press, 1963, pp. 78–85. [Google Scholar]
- 54.Nicholson C, Phillips JM, Tobias C, et al. Extracellular potassium, calcium and volume profiles during spreading depression. In: Syková E, Hñik P, Vyklicky L. (eds). Ion-selective microelectrodes and their use in excitable tissues, New York: Plenum press, 1981, pp. 211–223. [Google Scholar]
- 55.Young W. Spreading depression in elasmobranch cerebellum. Brain Res 1980; 199: 113–126. [DOI] [PubMed] [Google Scholar]
- 56.Kraig RP, Nicholson C. Extracellular ionic variations during spreading depression. Neuroscience 1978; 3: 1045–1059. [DOI] [PubMed] [Google Scholar]
- 57.Kraig RP, Ferreira-Filho CR, Nicholson C. Alkaline and acid transients in cerebellar microenvironment. J Neurophysiol 1983; 49: 831–850. [DOI] [PubMed] [Google Scholar]
- 58.Lauritzen M. Pathophysiology of the migraine aura. The spreading depression theory. Brain 1994; 117(Pt 1): 199–210. [DOI] [PubMed] [Google Scholar]
- 59.Gold L, Lauritzen M. Neuronal deactivation explains decreased cerebellar blood flow in response to focal cerebral ischemia or suppressed neocortical function. Proc Natl Acad Sci U S A 2002; 99: 7699–7704. [DOI] [PMC free article] [PubMed] [Google Scholar]
- 60.Zhou N, Gordon GR, Feighan D, et al. Transient swelling, acidification, and mitochondrial depolarization occurs in neurons but not astrocytes during spreading depression. Cereb Cortex 2010; 20: 2614–2624. [DOI] [PubMed] [Google Scholar]
- 61.Risher WC, Andrew RD, Kirov SA. Real-time passive volume responses of astrocytes to acute osmotic and ischemic stress in cortical slices and in vivo revealed by two-photon microscopy. Glia 2009; 57: 207–221. [DOI] [PMC free article] [PubMed] [Google Scholar]
- 62.Mane M, Muller M. Temporo-spectral imaging of intrinsic optical signals during hypoxia-induced spreading depression-like depolarization. PLoS One 2012; 7: e43981. [DOI] [PMC free article] [PubMed] [Google Scholar]
- 63.Reiffurth C, Kirov SA, Dreier JP.Spreading depolarization. In: Chen J, Xu XM, Xu ZC, et al. (eds). Animal models of acute neurological injuries II, injury and mechanistic assessments, New York: Humana Press, 2012, pp. 339–352. [Google Scholar]
- 64.Steffensen AB, Sword J, Croom D, et al. Chloride cotransporters as a molecular mechanism underlying spreading depolarization-induced dendritic beading. J Neurosci 2015; 35: 12172–12187. [DOI] [PMC free article] [PubMed] [Google Scholar]
- 65.Tobiasz C, Nicholson C. Tetrodotoxin resistant propagation and extracellular sodium changes during spreading depression in rat cerebellum. Brain Res 1982; 241: 329–333. [DOI] [PubMed] [Google Scholar]
- 66.Nicholson C, ten Bruggencate G, Stockle H, et al. Calcium and potassium changes in extracellular microenvironment of cat cerebellar cortex. J Neurophysiol 1978; 41: 1026–1039. [DOI] [PubMed] [Google Scholar]
- 67.Nicholson C, Bruggencate GT, Steinberg R, et al. Calcium modulation in brain extracellular microenvironment demonstrated with ion-selective micropipette. Proc Natl Acad Sci U S A 1977; 74: 1287–1290. [DOI] [PMC free article] [PubMed] [Google Scholar]
- 68.Erdemli G, Xu YZ, Krnjevic K. Potassium conductance causing hyperpolarization of CA1 hippocampal neurons during hypoxia. J Neurophysiol 1998; 80: 2378–2390. [DOI] [PubMed] [Google Scholar]
- 69.Muller M, Somjen GG. Na(+) and K(+) concentrations, extra- and intracellular voltages, and the effect of TTX in hypoxic rat hippocampal slices. J Neurophysiol 2000; 83: 735–745. [DOI] [PubMed] [Google Scholar]
- 70.Revah O, Lasser-Katz E, Fleidervish IA, et al. The earliest neuronal responses to hypoxia in the neocortical circuit are glutamate-dependent. Neurobiol Dis 2016; 95: 158–167. [DOI] [PubMed] [Google Scholar]
- 71.Hansen AJ, Zeuthen T. Extracellular ion concentrations during spreading depression and ischemia in the rat brain cortex. Acta Physiol Scand 1981; 113: 437–445. [DOI] [PubMed] [Google Scholar]
- 72.Vyskocil F, Kritz N, Bures J. Potassium-selective microelectrodes used for measuring the extracellular brain potassium during spreading depression and anoxic depolarization in rats. Brain Res 1972; 39: 255–259. [DOI] [PubMed] [Google Scholar]
- 73.Lauritzen M, Hansen AJ. The effect of glutamate receptor blockade on anoxic depolarization and cortical spreading depression. J Cereb Blood Flow Metab 1992; 12: 223–229. [DOI] [PubMed] [Google Scholar]
- 74.Marrannes R, Willems R, De Prins E, et al. Evidence for a role of the N-methyl-D-aspartate (NMDA) receptor in cortical spreading depression in the rat. Brain Res 1988; 457: 226–240. [DOI] [PubMed] [Google Scholar]
- 75.Petzold GC, Haack S, von Bohlen Und Halbach O, et al. Nitric oxide modulates spreading depolarization threshold in the human and rodent cortex. Stroke 2008; 39: 1292–1299. [DOI] [PubMed] [Google Scholar]
- 76.Sharp FR, Lu A, Tang Y, et al. Multiple molecular penumbras after focal cerebral ischemia. J Cereb Blood Flow Metab 2000; 20: 1011–1032. [DOI] [PubMed] [Google Scholar]
- 77.Jander S, Schroeter M, Peters O, et al. Cortical spreading depression induces proinflammatory cytokine gene expression in the rat brain. J Cereb Blood Flow Metab 2001; 21: 218–225. [DOI] [PubMed] [Google Scholar]
- 78.Kunkler PE, Hulse RE, Kraig RP. Multiplexed cytokine protein expression profiles from spreading depression in hippocampal organotypic cultures. J Cereb Blood Flow Metab 2004; 24: 829–839. [DOI] [PMC free article] [PubMed] [Google Scholar]
- 79.Urbach A, Bruehl C, Witte OW. Microarray-based long-term detection of genes differentially expressed after cortical spreading depression. Eur J Neurosci 2006; 24: 841–856. [DOI] [PubMed] [Google Scholar]
- 80.Matsushima K, Hogan MJ, Hakim AM. Cortical spreading depression protects against subsequent focal cerebral ischemia in rats. J Cereb Blood Flow Metab 1996; 16: 221–226. [DOI] [PubMed] [Google Scholar]
- 81.Berger M, Speckmann EJ, Pape HC, et al. Spreading depression enhances human neocortical excitability in vitro. Cephalalgia 2008; 28: 558–562. [DOI] [PubMed] [Google Scholar]
- 82.Yanamoto H, Miyamoto S, Tohnai N, et al. Induced spreading depression activates persistent neurogenesis in the subventricular zone, generating cells with markers for divided and early committed neurons in the caudate putamen and cortex. Stroke 2005; 36: 1544–1550. [DOI] [PubMed] [Google Scholar]
- 83.Urbach A, Baum E, Braun F, et al. Cortical spreading depolarization increases adult neurogenesis, and alters behavior and hippocampus-dependent memory in mice. J Cereb Blood Flow Metab 2017; 37: 1776–1790. [DOI] [PMC free article] [PubMed] [Google Scholar]
- 84.Henninger N, Eberius KH, Sicard KM, et al. A new model of thromboembolic stroke in the posterior circulation of the rat. J Neurosci Methods 2006; 156: 1–9. [DOI] [PubMed] [Google Scholar]
- 85.Partearroyo T, Perez-Miguelsanz J, Pena-Melian A, et al. Low and high dietary folic acid levels perturb postnatal cerebellar morphology in growing rats. Br J Nutr 2016; 115: 1967–1977. [DOI] [PubMed] [Google Scholar]
- 86.Dreier JP, Lemale CL, Kola V, et al. Spreading depolarization is not an epiphenomenon but the principal mechanism of the cytotoxic edema in various gray matter structures of the brain during stroke. Neuropharmacology 2018; 134: 189–207. [DOI] [PubMed] [Google Scholar]