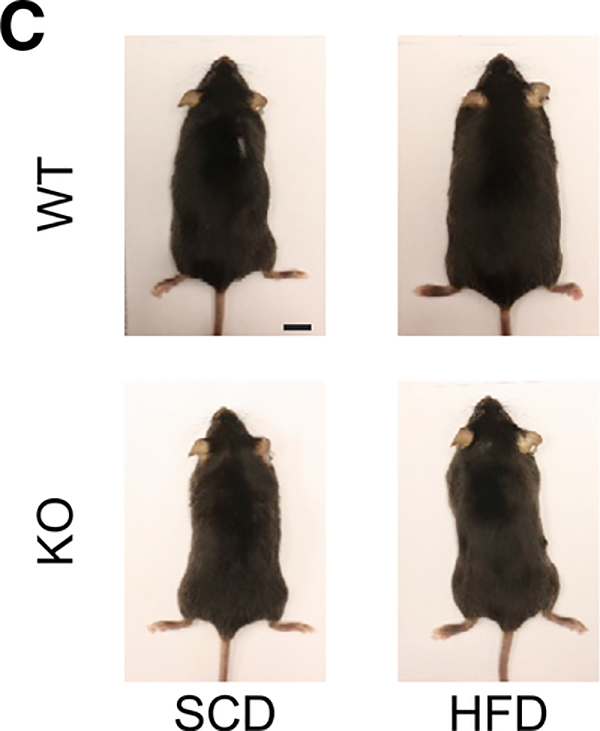
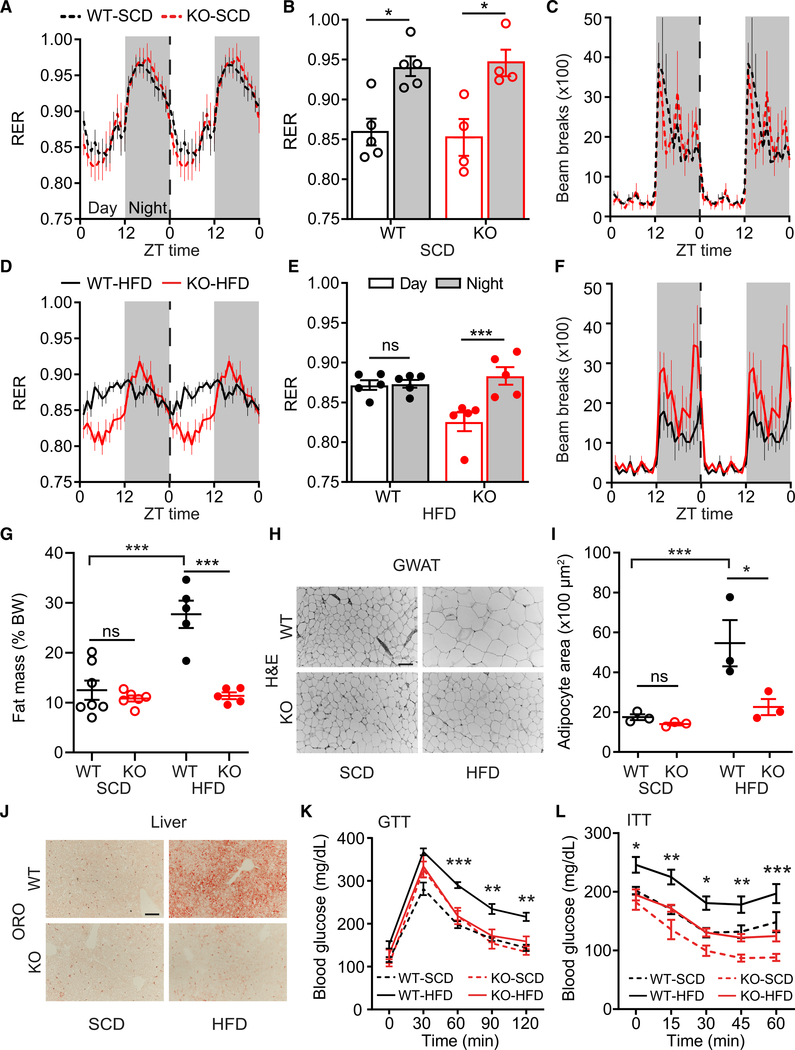
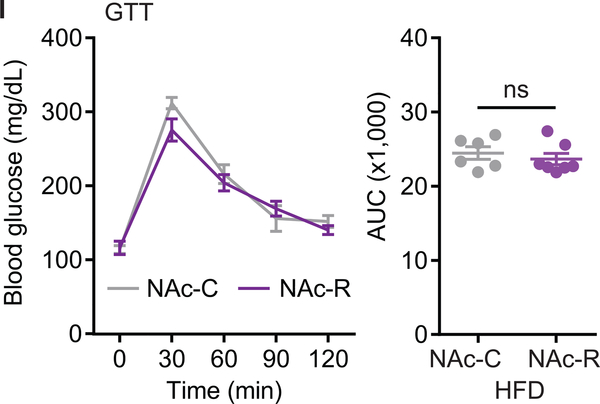
After the publication of the original version of the article, several errors that were made during the production of the main figures were identified in Figures 1C (KO-SCD image duplication as KO-HFD), 2B (inclusion of an extra data marker in KO-SCD night group), 2G (KO-HFD dataset duplication as KO-SCD), and 4I (NAc-C versus NAc-R mislabeling). We also identified typographical errors in the Figure 2 legend: in 2G, Fdiet(1,19) = 22.3 should have been Fdiet(1,19) = 20.3; in 2L, Fdiet(1,36) = 14.8 should have been Fdiet(1,36) = 18.4. In the main text, the mean values for 2G were presented with standard deviation (mean ± SD) (WT-SCD: 12.5% ± 5.1%; KO-SCD: 10.8% ± 1.5%; WT-HFD: 27.7% ± 6.1%; KO-HFD: 11.4% ± 1.5%) instead of standard error of the mean (mean ± SEM) (WT-SCD: 12.5% ± 1.9%; KO-SCD: 10.8% ± 0.6%; WT-HFD: 27.7% ± 2.7%; KO-HFD: 11.4% ± 0.7%). Since these errors occurred after data analysis, they did not affect any of the statistical comparisons or conclusions. In the Supplemental Information, mistakes were identified in Figure S2N (use of KO-HFD group as WT-SCD), the Figure S4C legend (typographical error, indicating use of one-way instead of two-way ANOVA test), and tables (typographical errors made during their population). These errors did not alter any of the conclusions made in our manuscript. New, accurate graphs, statistical comparisons, and tables have now been incorporated into the online version of the paper. The authors thank the reader who alerted us to some of these errors and apologize for any confusion that they may have caused.
Figure 1C.
Drd1-KO Mice Are Protected from HFD-Induced Obesity
Figure 2.
Drd1-KO Mice Are Resistant to HFD-Induced Metabolic Disease
Supplementary Material
Figure 4I.
Selective Re-expression of Drd1 within the NAc of Drd1-KO Mice Partially Rescues HFD-Induced Phenotypes, Excluding Obesity
Associated Data
This section collects any data citations, data availability statements, or supplementary materials included in this article.


