

1. Introduction
Cancer immunotherapy, whether it amplifies the natural immune system (check-point inhibitor) or is a synthetic immunotherapy designed to initiate new responses against the cancer (monoclonal antibodies or CAR-T) (Majzner and Mackall 2018), will introduce a significant immune modulation in the treated patients.
Investigating the therapeutic mechanism of the immunotherapy, in search of common biomarkers of response, requires comprehensive immune-monitoring of the patients receiving the therapy. Single cell monitoring of immune populations and functional markers is crucial to provide insight into cellular therapy mechanisms in the patients.
Here, we describe an immune cell monitoring mass cytometry assay developed as a reference panel to identify all CD45 expressing cells with more than one additional marker (Hartmann et al. submitted; Table 1, Figure 1). This allows for broad monitoring of all major immune cell subsets, whether in blood or other tissues.
Table 1.
Reference Panel (Hartmann et al; Submitted)
| Mass | Element | Marker | Biology | Staining | Source | dilution | catalogue |
|---|---|---|---|---|---|---|---|
| 89 | Y | CD45 | Pan Immune | surface | Fluidigm | 100 | 3089003B |
| 139 | La | CD235ab/CD61 | Dump | BioLegend | 100 | custom | |
| 140 | Ce | ||||||
| 141 | Pr | CD3 | Pan T Cells | surface | BioLegend | 100 | custom |
| 142 | Nd | CD19 | Pan B Cells | surface | Fluidigm | 100 | 3142001B |
| 143 | Nd | CD117 | Mast, early immune | surface | Fluidigm | 100 | 3143001B |
| 144 | Nd | CD11b | Mac / Mono | surface | Fluidigm | 400 | 3144001B |
| 145 | Nd | CD4 | Tcell Sub / Mono | surface | Fluidigm | 200 | 3145001B |
| 146 | Nd | CD8a | Tcell Sub / NK | surface | Fluidigm | 1600 | 3146001B |
| 147 | Sm | CD11c | DC / Mac / Mono | surface | Fluidigm | 200 | 3147008B |
| 148 | Nd | CD14 | Mono/Mac | surface | Fluidigm | 1600 | 3148010B |
| 149 | Sm | ||||||
| 150 | Nd | FceRI | IgE Receptor (Mast/Basophil) | surface | Fluidigm | 100 | 3150027B |
| 151 | Eu | CD123 | Bcell Sub, DC, Baso, pDC | surface | Fluidigm | 100 | 3151001B |
| 152 | Sm | gdTCR | gd T Cells | surface | Fluidigm | 100 | 3152008B |
| 153 | Eu | CD45RA | T Cell Naïve/Mem | surface | Fluidigm | 100 | 3153001B |
| 154 | Sm | TIM3 | Th1 polarization | surface | Fluidigm | 100 | 3154010B |
| 155 | Gd | ||||||
| 156 | Gd | PD-L1 (CD274) | Checkpoint | surface | Fluidigm | 100 | 3156026B |
| 157 | Gd | ||||||
| 158 | Gd | CD27 | B/T Cell Mem | surface | Fluidigm | 400 | 3158010B |
| 159 | Tb | ||||||
| 160 | Gd | Tbet | Th1 polarization/NK | intracellular | Fluidigm | 100 | 3160010B |
| 161 | Dy | CD152 (CTLA-4) | Checkpoint | intracellular | Fluidigm | 800 | 3161004B |
| 162 | Dy | FoxP3 | Treg | intracellular | Fluidigm | 400 | 3162011A |
| 163 | Dy | CD33 | Pan Myeloid | surface | Fluidigm | 100 | 3163023B |
| 164 | Dy | CD45RO | T Cell Naïve/Mem | surface | Fluidigm | 200 | 3164007B |
| 165 | Ho | CD127 | T cell Sub, Treg | surface | Fluidigm | 100 | 3165008B |
| 166 | Er | ||||||
| 167 | Er | CCR7 (CD197) | T Cell subset (eff/mem) | surface | Fluidigm | 100 | 3167009A |
| 168 | Er | Ki-67 | Proliferation | intracellular | Fluidigm | 400 | 3168007B |
| 169 | Tm | CD25 | Treg | surface | Fluidigm | 100 | 3169003B |
| 170 | Er | TCR Va24-Ja18 | iNKT | intracellular | Fluidigm | 100 | 3170015B |
| 171 | Yb | ||||||
| 172 | Yb | CD38 | B Cell, NK, Plasma | surface | Fluidigm | 400 | 3172007B |
| 173 | Yb | ||||||
| 174 | Yb | HLA-DR | APC | surface | Fluidigm | 100 | 3174001B |
| 175 | Lu | PD-1 | Checkpoint | surface | Fluidigm | 100 | 3175008B |
| 176 | Yb | CD56 | NK | surface | Fluidigm | 100 | 3176008B |
| 209 | Bi | CD16 | Fc Receptor, NK, Neu, Mono | surface | Fluidigm | 100 | 3209002B |
Figure 1.


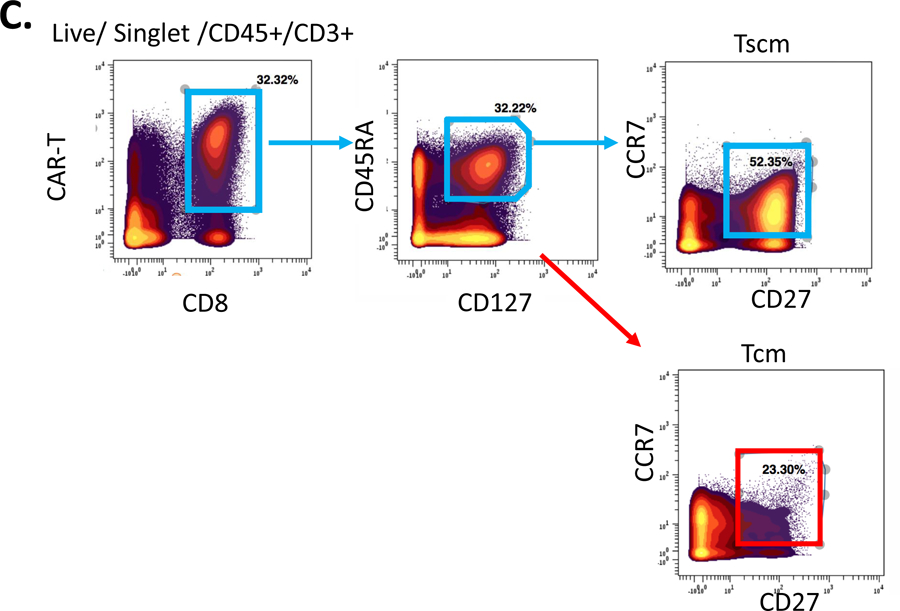
A. T cell phenotype determination by reference panel. Gating on surface and intracellular markers used to determine major subsets of T cells. B. Intracellular cytokines added to reference panel. PBMC are stimulated for 4 h at 37° C and stained for intracellular and surface antigens according to the protocol in this chapter, enabling functional assessment of the T cells studied. C. Phenotypic characterization of chimeric antigen receptor T (CAR-T) cells. CD8 CAR-T cells were further divided into subsets showing the presence of T stem cell memory (Tscm) and T central memory (Tcm) cells.
The advantages of adopting mass cytometry by time of flight (CyTOF) methods as opposed to high dimensional flow cytometry include(Bendall et al. 2012):
Negligible signal overlap between parameters, creating a lower background and little or no need for signal compensation.
A higher number of parameters, allowing single-tube analysis of 40+ markers.
1.1. Markers to identify and characterize immune cell subsets
Our goal for developing this reference panel was to perform comprehensive immune monitoring, covering all major immune cell populations, while providing flexibility for project-specific markers to be added.
Our reference panel (Table 1, figure 1A, B and C) was designed to comprehensively and reproducibly identify:
Major lineages of T and B cells, Natural killer (NK) cells, myeloid and granulocyte populations found in peripheral blood mononuclear cells (PBMC) and other tissues
Minor T cell subsets such as regulatory T cells, and exhaustion markers such as PD-1 and TIM3.
Cytokine-producing cells (optionally)
Blood cell tumors in the context of other immune cell types
Functional markers of antigen presenting cells such as monocytes and dendritic cells
Other study-specific markers using the 10 empty channels
After identification of live single cells, all immune cell subpopulations expressing CD45 are identified, through cell surface and intracellular markers, including the lymphoid lineage in which T cells could be further subdivided into CD4+ T-helper (Th) cells, CD8+ T cells, natural killer T (NKT) cells and γ T cells. Additionally, using differential expression patterns of CD27, CD45RA, CD45RO and CCR7, several maturation states of T cells such as naïve, effector, effector memory and central memory can be discriminated (Sallusto et al. 2004). In addition, regulatory T cells (Tregs) are identified through high expression of CD25 (interleukin-2 receptor alpha chain), low to negative levels of the IL-7 receptor CD127, and expression of the lineage defining transcription factor FoxP3. Figure 1A shows a general T cell subsetting strategy using this panel.
Furthermore, other immune cell lineages and various functional subsets of each population are identified. B cell maturation is characterized via CD27 and CD38 expression. Monocyte subsets are distinguished based on their expression of CD14 and CD16, and NK cell subsets based on their combinatorial expression of CD16 and CD56 (Hartmann et al, manuscript submitted).
Other functionally relevant proteins may be investigated using this panel. CD25, HLA-DR, and CD38 can help determine the activation state of T cells, while Ki-67 expression identifies actively proliferating cells across multiple cell types.
This panel allows for quantification of the immune checkpoint-related molecules and exhaustion markers such as PD-1, PD-L1, CTLA-4 and TIM-3 in various cell types (Hartmann et al 2019). The robustness and reproducibly of this panel has been confirmed in staining of different tissue types such as PBMC, whole blood, bone marrow, and tissue biopsies, all relevant for investigating immune modulation after immunotherapy.
Several modifications to the panel have also been tested. As shown in figure 1B, intracellular cytokines are detected in T cells after in vitro stimulation with PMA+ionomycin while 1B shows gating strategy for T cells.
Figure 1C shows the gating strategy for a modified reference panel for phenotypic characterization of CAR-T cells.
1.2. Minimizing experimental variability
In addition to considerations taken to develop a comprehensive panel, minimizing experimental variability is necessary for comparability of high dimensional data and down-stream automation of data processing. Our efforts to minimize experimental variability include the following experimental strategies:
Processing batched samples as a single composite of multiplexed barcoded samples to reduce inter-sample variability
Inclusion of a labeled spike-in sample as an internal reference control to monitor variability between separately stained samples
Lyophilization of the antibody cocktail, reducing the variability introduced by errors in pipetting or degradation of liquid reagents
2. Materials
Thawing Media: RPMI 1640 + 10% fetal bovine serum, (FBS)+ 100 U/ml Penicillin and Streptomycin + 2mM L-Glutamine + 20 mM HEPES; PH=7.0; keep at 4°C
Benzonase (Pierce™ Universal Nuclease for Cell Lysis), ThermoFisher Catalogue number 88701; keep at −20°C
Rh103 (rhodium) Intercalator, 500 μM (Fluidigm Catalogue number 201103A)
Cell Staining Media (CSM): PBS + 0.5%BSA+ 0.02% NaN3
Cell-ID™ Intercalator-Ir, 500 µM, Fluidigm Catalogue number 201192B, aliquots kept at −20°C.
Pierce™ 16% Formaldehyde (w/v), Methanol-free; Catalogue number 28906
Phosphate Buffer Saline (PBS, Rockland, catalog number: MB-008)
Bovine serum albumin (BSA; Sigma, A1933)
Doubly distilled water (ddH2O, Millipore MilliQ system)
EQ four element calibration beads, Fluidigm Catalog number 201078
Human TruStainFcX™ (FcReceptor Blocking solution); Biolegend, 422302
PVDF filter tubes (Millipore #UFC30VV00)
Veri-Cells™ Heavy Metal (Ta) PBMC (Biolegend) (see Figure 3. note 4.4)
Veri-cell reconstitution buffer (Biolegend)
Foxp3 / Transcription Factor Staining Buffer Set, eBiosciences, Catalog number 00–5523
Figure 3. Tantalum-labeled lyophilized reference PBMC.

were spiked into an experimental sample prior to staining with a CyTOF antibody panel. The internal reference cells were easily resolvable from the experimental sample based on Ta181 signal, and viSNE analysis of the lyophilized PBMC sample allowed clear identification of major immune subsets that can be used to evaluate the consistency of marker staining across samples.
3. Methods
3.1. Cryopreserved PBMC thawing
-
3.1.1
Keep the frozen PBMC vial on dry-ice until time to thaw; Prepare 10 ml of RPMI-1640 complete media with 1:10 000 benzonase, per vial to be thawed. Warm this media to 37°C in a water bath (see Note 4.1).
-
3.1.2
Thaw the vial in a 37°C until 2/3 of the PBMC is thawed and transfer slowly to 10 ml RPMI with benzonase.
-
3.1.3
Centrifuge @ 250 g for 5 min.
-
3.1.4
Remove supernatant and gently resuspend the cell pellet. Add 10 ml of CSM (PBS + 0.2% BSA + 0.02% NaN3) and centrifuge again @ 250 g for 5 min.
-
3.1.5
Count cells and aliquot 2 million cells for subsequent staining.
3.2. Cell viability staining
-
3.2.1
Prepare 1x Rh103 staining media by diluting the stock to 1 μM staining solution in cell culture medium (see Note 4.2).
-
3.2.2
Add 500 μl of 1x Rh103 staining medium to up to 107 cells, mix well.
-
3.2.3
Incubate at 37°C for 20 min.
-
3.2.4
Wash the cells by adding 500 μl CSM, spin @ 250g for 5 min, confirm pellet before aspirating the supernatant.
-
3.2.5
Repeat the wash as in (3.2.4) above.
3.3. Live cell barcoding (see note 4.3)
-
3.3.1
Anti-CD298 and anti-β2-microglubulin (b2m) to cisplatinum (194Pt, 195Pt, 196 Pt and 198Pt) and indium 113 and 115 is mixed in predetermined titrated amounts in combination on a plate using 6-choose-3 combinatorial barcodes (note 4.3).
-
3.3.2
Stain up to 3×10⁶ from each sample with the combination matrix of anti-CD298 and b2m for 30 min at room temperature.
-
3.3.3
Wash cells twice in CSM as described above (3.2.4).
-
3.3.4
Consolidate the samples in a single tube for downstream staining and acquisition.
3.4. Addition of spike-in reference standard (see note 4.4)
-
3.4.1
Reconstitute Veri-Cells™ Heavy Metal (Ta) PBMC by adding 325 μl of Veri-Cell reconstitution buffer to each vial of 1 million lyophilized cells and incubating at room temperature for 15 min.
-
3.4.2
Remove cells from vial and Centrifuge at 250 g, for 5 min.
-
3.4.3
Remove supernatant and wash the cells by adding 500 μl CSM, spin @ 250g for 5 min.
-
3.4.4
Count the cells and resuspend at 2 million cells per mL in CSM and store on ice until use.
-
3.4.5
Spike in 200,000 reconstituted Veri-cells into each experimental sample of 2 million PBMCs.
3.5. Cell surface staining
-
3.5.1
Prepare a 2X antibody cocktail by pipetting each of the antibodies in a total volume of 50 μl CSM (per one sample). Prepare sufficient cocktail for all samples to be processed at one time (see note 4.5–4.7).
-
3.5.2
Resuspend cells in 50 μl of CSM, add 1 μl of TruStain Fc block (FcX), incubate for 5 min at room temperature.
-
3.5.3
Add 50 μl of filtered antibody cocktail to the cells and mix well.
-
3.5.4
Incubate for 30 min at room temperature.
-
3.5.5
Wash the cells by addition of 3 ml CSM and spin down @ 250g for 5 min.
3.6. Intracellular staining (see note 4.8)
-
3.6.1
Prepare 1X fixing solution (FoxP3 staining buffer set, eBiosciences) by mixing 1 part concentrate to 3 parts diluent.
-
3.6.2
Resuspend each sample in 0.5 ml per sample and incubate for 1h at room temperature.
-
3.6.3
Make 1x perm buffer (FoxP3 staining buffer set): mix 1 ml of 10x perm buffer with 9 ml ddH2O.
-
3.6.4
Resuspend each sample in 1ml Perm buffer, spin 5 min @ 600g at 4°C, aspirate.
-
3.6.5
Prepare intracellular antibody master mix in Perm buffer according to panel.
-
3.6.6
Resuspend each sample in 100 µl intracellular antibody master mix/sample.
-
3.6.7
Incubate for 60 min at room temp.
-
3.6.8
Resuspend each sample in 1ml perm buffer, spin 5 min @ 600 g 4°C, aspirate.
-
3.6.9
Resuspend each sample in 1ml perm buffer, spin 5 min @ 600 g 4°C, aspirate.
-
3.6.10
Resuspend each sample in 1ml perm PBS, spin 5 min @ 600 g 4°C, aspirate.
3.7. Post fixation and iridium intercalation
-
3.7.1
Prepare fix-Ir solution by mixing 0.25 μl Intercalator-Ir, 10 μl 2% saponin in PBS solution, 150 μl 16% PFA in 850 μl PBS
-
3.7.2
Add 1mL fix-Ir solution per sample and incubate for 30 min at room temperature.
-
3.7.3
Wash once in CSM; spin 5 min @ 600g at 4°C, aspirate.
-
3.7.4
Store in 1ml CSM containing 0.25 μl/ml Intercalator-Ir
-
3.7.5
Store up to one week at 4°C
3.8. Data acquisition
-
3.8.1
Tune the CyTOF instrument according to Fluidigm-recommended protocol. Document Tb, Tm, and Detector voltage.
-
3.8.2
Run Eu Beads (151Eu and 153 Eu) for 120 s; the bead count needs to be <10,000 and singlet mean dual count should be 1,000 and 1,500 respectively.
-
3.8.3
If these parameters are not met, the machine needs to be cleaned and re-tuned
-
3.8.4
Immediately prior to acquisition, resuspend each sample in 1 ml CSM; spin 5 min at 600 g 4°C, aspirate.
-
3.8.5
Resuspend each sample in 1 ml ddH2O; spin 5 min at 600 g 4°C, aspirate.
-
3.8.6
Resuspend each sample in 1 ml ddH2O; spin 5 min at 600 g 4°C, aspirate.
-
3.8.7
Keep samples on ice until CYTOF acquisition.
-
3.8.8
Make 1x EQ beads solution: add 1 ml 10x EQ beads to 9 ml ddH2O.
-
3.8.9
For each sample acquisition: resuspend each sample at a concentration of 750,000 cells/ml with 1xEQ beads solution.
-
3.8.10
Filter sample through a cell strainer cap into a 5mL tube and load onto the CyTOF instrument.
-
3.8.11
Acquire 250,000 events/sample.
-
3.8.12
Post-acquisition: normalize FCS files using Fluidigm normalizer (software version 6.5.358).
3.9. Data Analysis
-
3.9.1
CyTOF FCS files can be analyzed using a variety of approaches. In general, analyses focus on identifying defined immune subsets on the basis of canonical marker expression patterns, and evaluating changes in the expression of dynamic markers within these cell subsets. This can be accomplished through manual gating (Figure 1) or automated clustering approaches (Figure 5; note 4.9).
Figure 5. Astrolabe population identification algorithm.

PBMC from a patient undergoing immunotherapy were clustered and automatically annotated using the Astrolabe platform. Expression level of each antigen across clusters is depicted in the heatmap.
Figure 2. Use of lyophilized antibody cocktail.


Staining between fresh (liquid) antibodies and a lyophilized panel (kept in −20°C or aged at 37°C for 19 days) is shown. A. T cells. Top row: live intact single cells; bottom two rows: live intact single CD45+CD3+ cells. B. B cells, myeloid cells, and monocytes/NK cells. All rows: live intact single cells. C. T cell subsets and monocytes. Top two rows: live intact single CD45+CD3+ cells. Bottom row: live intact single cells. D. Further T cell subsets. Top row: live intact single CD45+CD3+ cells. Bottom row: live intact single CD45+CD3+CD4+ cells.
Figure 4. Nivolumab treatment interferes with detection of PD-1 expression on activated T cells.

PBMCs stimulation with PHA for 48hrs resulted in upregulation of PD-1 expression detected by CyTOF analysis with clone EH122H7. However, prior treatment of the stimulated cells with Nivolumab interferes with the ability to detect upregulation of PD-1 expression.
4. Notes
Cell thawing media: It is critical to add the benzonase right before thawing the cells into the thawing media. Benzonase may be deactivated if heated to denaturation and kept too long in warmed media.
Rhodium-103 is a nucleic acid intercalator that will preferentially permeate and accumulates in cells with compromised membrane integrity, hence allowing dead cell discrimination based on higher staining intensity in these cells. When staining thawed cells, we recommend at least a 1 h cell rest at 37°C for better results. Typically, we acquire stained samples within 24 h; however, rhodium intercalation is reversible, and Rh103 signal may be diluted out if samples are stored too long prior to CyTOF acquisition. An alternative approach for dead cell labeling is the use of Cisplatin, which binds covalently to proteins and may offer more flexibility in postponing sample acquisition.
- Since all the samples are stained in a single tube, all cells will be exposed to the same concentration of antibodies. Uniform antibody exposure eliminates tube-to-tube variability in staining.
- Acquiring the specimen as one multiplexed sample abrogates any detector sensitivity drift during the time it takes to acquire the whole sample.
This protocol uses live-cell barcoding, where a combination of antibodies against cell surface markers sodium-potassium pump (CD298) and β2-microglubulin, (b2m) are used to barcode the cells (Hartmann et al. 2018).
Indium conjugation of the anti-CD298 (clone 2M2, BioLegend) and anti-b2m (clone, LNH-94; BioLegend) is performed using the MaxPar X8 antibody labelling kit obtained from Fluidigm and following manufacturer’s instructions. Monoisotopic platinum conjugation of anti-CD298 and anti-b2m of four different platinum isotypes (194Pt, 195Pt,196Pt and 198Pt) is done via direct covalent binding of platinum isotype to the antibodies as described (Mei et al. 2016). Briefly, 1mM stock solution of isotopically enriched cisplatin in DMSO (custom order Fluidigm) is preconditioned for 48h in 37°C and stored at −20°C. Buffer exchange is performed on anti-CD298 and anti-b2m in a 50 KD MW cut off filter, and reduced with 4mM TCEP (ThermoFisher) for 30 min at 37°C and washed 2 times with C buffer (Fluidigm). 20 μl of the 1 mM monoisotopic cisplatin solution (equivalent to 20 nmol) is diluted in 1 ml of C buffer and added to the antibody for 1 h at 37 °C for conjugation. Cisplatin-conjugated antibodies are then washed four times with 400 μl W buffer (Fluidigm) and the antibody is collected by two centrifugations (2 min, 1,000 g, RT) with 50 μl of W buffer with an inverted column into a new collection tube. Protein content is assessed by NanoDrop (Thermo Fisher) measurement, antibody stabilization buffer (Candor Bioscience) is added to a final volume of at least 50 v/v %, and antibodies are stored at 4 °C.
Both indium and cisplatinum conjugated antibodies are titrated to define the optimal working concentration. A 6-choose-3 scheme (Zunder et al. 2015) can be used to identify and tag up to 20 samples in combination of 3 channels for barcoding. The debarcoding algorithm such as Permessa and fluidigm debarcoder may be used for sample deconvolution and exclusion of doublets.
While barcoding samples is a useful strategy to reduce sample variability within a batch, the number of samples that can be barcoded and pooled is ultimately limited. Spike-in reference controls are therefore a useful experimental strategy to control for variability between batches. There are several potential options for spike-in reference controls such as multiple aliquots of PBMCs derived from leukaphersis, which can potentially be banked and cryopreserved. This protocol uses a commercial source of lyophilized healthy donor PBMCs that have been pre-labeled with Tantalum, a channel that is generally not used for mass cytometry analysis (Figure 3). These lyophilized cells offer the advantage of ease of preparation and long term reproducibility, and are a versatile resource for monitoring staining variability across samples, particularly in the setting of multi-center studies. However, one of the limitations of this approach is that healthy PBMCs may not express some of the dynamic checkpoint markers that are of interest in monitoring immunotherapy. To address this, PBMCs can be stimulated with CD3/CD28 Dynabeads (ThermoFisher Scientifics; Catalogue number 11131D) for 4 days to induce upregulation of T cell activation/checkpoint markers. Further stimulation with phorbol 12-myristate 13-acetate (PMA) and Ionomycin can be used to induce production of intracellular cytokines. A reference sample consists of 1:1 resting and stimulated PBMCs may therefore allow for monitoring of a broader range of immunotherapy-relevant markers than healthy control PBMCs alone.
An antibody panel for comprehensive immune monitoring will ideally allow identification of all major immune cell populations, characterization of dynamic markers that are relevant in the setting of immunotherapy (e.g. PD-L1). Our proposed reference panel is designed to identify major and minor immune lineages, while providing flexibility for project-specific markers to be added.
The large number of antibodies in a typical CyTOF panel increases the potential risk of pipetting errors when prepare antibody cocktail and represents a major source of potential inter-sample technical variability in large scale monitoring studies. One strategy to reduce these issues is lyophilization of antibody panels, which streamlines sample processing and reduces the potential for tube-to-tube pipetting variations. We have successfully validated the robustness and durability of this antibody panel in a lyophilized state. The lyophilized panel can be stored desiccated at −20°C for over one year without changing the reactivity of the panel. In instances where some antibodies included in the panel are not robust to lyophilization, those antibodies can be added after reconstitution, at the time of staining.
One particular point to note in designing panels to monitor cancer immunotherapy is the potential of therapeutic antibodies to interfere with binding of antibodies in the CyTOF panel. For example, treatment with Nivolumab (anti-PD1) can interfere with the ability to effectively detect dynamic changes in PD-1 expression (Figure 4).
The fixation process that follows cell surface staining is different depending on whether the panel includes intracellular targets. If staining for Foxp3, Tbet or other transcription factors, we recommend the eBiosciences Transcription Factor staining protocol.
Astrolabe (Astrolabe Diagnostics, Inc.) analysis is one method for automated cluster-finding and analysis of CyTOF samples, and is compatible with the reference panel used in this protocol (Figure 5).
Bibliography
- Bendall SC, Nolan GP, Roederer M and Chattopadhyay PK 2012. A deep profiler’s guide to cytometry. Trends in Immunology 33(7), pp. 323–332. [DOI] [PMC free article] [PubMed] [Google Scholar]
- Hartmann FJ, Simonds EF and Bendall SC 2018. A Universal Live Cell Barcoding-Platform for Multiplexed Human Single Cell Analysis. Scientific reports 8(1), p. 10770. [DOI] [PMC free article] [PubMed] [Google Scholar]
- Majzner RG and Mackall CL 2018. Tumor Antigen Escape from CAR T-cell Therapy. Cancer discovery 8(10), pp. 1219–1226. [DOI] [PubMed] [Google Scholar]
- Mei HE, Leipold MD and Maecker HT 2016. Platinum-conjugated antibodies for application in mass cytometry. Cytometry. Part A: the Journal of the International Society for Analytical Cytology 89(3), pp. 292–300. [DOI] [PubMed] [Google Scholar]
- Sallusto F, Geginat J and Lanzavecchia A 2004. Central memory and effector memory T cell subsets: function, generation, and maintenance. Annual Review of Immunology 22, pp. 745–763. [DOI] [PubMed] [Google Scholar]
- Zunder ER, Finck R, Behbehani GK, et al. 2015. Palladium-based mass tag cell barcoding with a doublet-filtering scheme and single-cell deconvolution algorithm. Nature Protocols 10(2), pp. 316–333. [DOI] [PMC free article] [PubMed] [Google Scholar]