Abstract
There have been intensive efforts to identify in vivo biomarkers that can be used to monitor drug-induced kidney damage before significant impairment occurs. Kidney injury molecule-1, neutrophil gelatinase-associated lipocalin, clusterin, β2-microglobulin and cystatin C (CysC) have been validated as clinical or preclinical biomarkers in urinary and plasma predictive of acute and chronic kidney injuries and diseases. A high-throughput in vitro assay predictive of nephrotoxicity could potentially be implemented in early drug discovery stage to reduce attrition at later stages of drug development. To assess the potential of these known in vivo biomarkers for in vitro evaluation of drug-induced nephrotoxicity, we selected four nephrotoxic agents (cisplatin, cyclosporin, aristolochic acid I and gentamicin) and detected their effects on the protein levels of nephrotoxic biomarkers in RPTEC/TERT1 cells. The protein levels of clusterin, CysC, GSTπ and TIMP-1 significantly increased in the conditioned media of RPTEC/TERT1 cells treated with cisplatin, cyclosporin, aristolochic acid I and gentamicin. The messenger RNA levels of clusterin, CysC, GSTπ and TIMP-1 also increased in RPTEC/TERT1 cells treated with cisplatin, cyclosporin, aristolochic acid I and gentamicin, indicating that drug-induced upregulation involves transcriptional activation. Taken together, the results clearly demonstrate that among the known in vivo nephrotoxic biomarkers, clusterin, CysC, GSTπ and TIMP-1 can be effectively used as in vitro biomarkers for drug-induced nephrotoxicity in RPTEC/TERT1 cells.
Keywords: RPTEC/TERT1, biomarkers, nephrotoxicity, in vitro
Introduction
The kidney is one of the major target organs for drug-induced toxicity. Nephrotoxic drugs and chemicals can induce acute kidney injury (AKI) or chronic kidney disease and subsequently end-stage renal disease [1]. However, minor damage of kidney function is hardly detected because of the kidney functional reserve [2]. The levels of blood urea nitrogen (BUN) and serum creatinine (SCr), the most commonly used markers of kidney injury, only indicate severe kidney damage. Furthermore, the changes of SCr and BUN can be affected by many factors [3]. Thus, the assessment of kidney toxicity requires more sensitive and reliable biomarkers [4].
In recent years, a lot of preclinical and clinical researches have been performed for screening and validation of nephrotoxic biomarker. In 2008 and 2010, the Food and Drug Administration and the European Medicines Agency endorsed the use of several biomarkers including urinary total protein, kidney injury molecule-1 (KIM-1), clusterin, β2-microglobulin, cystatin C (CysC), trefoil factor-3 (TFF-3), renal papillary antigen-1 and albumin for the prediction of AKI in rat [5–7]. Although nephrotoxic biomarkers have been reported in a number of preclinical and clinical studies, they are rarely used in the in vitro high-throughput screening in early drug development. An accurate in vitro model can provide important information on the structure–activity relationship and toxicity mechanism, which are useful for structure optimization and improving efficiency [8].
Recently, the evaluation of various toxic compounds using in vitro assays or alternative methods to animal testing has drawn a lot of interest [9]. In vitro assays present a valuable approach for the identification of biomarkers because they are cost-effective, convenient and eco-friendly and allow mechanistic studies compared with serum or plasma protein [10–12].
The RPTEC/TERT1 cell line is derived from immortalized renal proximal tubule epithelial cells (RPTEC) of a healthy human donor using the catalytic subunit of human telomerase reverse transcriptase (hTERT), the endogenous enzyme responsible for telomere stabilization. It has been confirmed the functional similarity of the RPTEC/TERT1 cell line to that of proximal tubule cells in the body, especially prototypical RPTEC structural and biochemical properties. Although primary RPTECs are the appropriate models under certain specific experimental protocols, primary cells undergo replicative senescence in culture. These properties make them difficult to conduct chronic exposure or long-term studies. The RPTEC/TERT1 cell line could overcome these limitations of primary RPTECs. Furthermore, primary RPTECs are often isolated from diseased patients, which may influence their ability to model the normal tissue. The near-normal properties of RPTEC/TERT1 cell line suggest that it may provide a promising new model to study the drug-induced nephrotoxicity [13–15].
Therefore, we used the RPTEC/TERT1 cell line to assess these known in vivo biomarkers for their potential of in vitro evaluation of drug -induced nephrotoxicity, where the four nephrotoxic agents (cisplatin, cyclosporin, aristolochic acid I and gentamicin) were selected to detect the effects on the protein and messenger RNA (mRNA) levels of nephrotoxic biomarkers.
Materials and Methods
Cell culture
RPTEC/TERT1 cells (ATCC, CRL-4031; Manassas, VA, USA) were cultured in DMEM/F12 (Life Technologies, Carlsbad, CA, USA) supplemented with 10 ng/ml hEGF, 0.1 mg/ml G418, 1% ITS-G, 3.5 μg/ml ascorbic acid, 25 ng/ml prostaglandin E1 (ITS-G, 100×; Life Technologies, Carlsbad, CA, USA) and 10% fetal bovine serum (FBS; Life Technologies, Sydney, NSW, Australia). Cells were plated in 96 well plates with a density of 2 × 10⁴ cells/well or 12 well plates with a density of 1 × 10⁵ cells/well and maintained in a humidified atmosphere with 95% air and 5% CO2 at 37°C.
Compounds
Cisplatin, cyclosporine and aristolochic acid I were purchased from the National Institutes for Food and Drug Control (Beijing, China), and gentamicin was obtained from Sigma-Aldrich (St. Louis, MO, USA). The stock solutions of cisplatin, cyclosporine and aristolochic acid I were dissolved in dimethyl sulfoxide (DMSO; Sigma-Aldrich, St. Louis, MO, USA). The stock solution of gentamicin was prepared with water. Vehicle controls were performed with the 0.5% DMSO alone. All stock solutions can be stored for up to 3 months in the dark at 4°C.
Cell count kit-8 assays
The cell count kit-8 (CCK-8; Dojindo, Kumamoto, Japan) assay was used to assess cytotoxicity according to the manufacturer’s instructions with minor modification. In brief, cell lines were treated with selected compounds in different concentrations for 24 h. And then 100 μl 10% CCK-8 dissolved in cultured medium was added to each well and incubated for 2 h at 37°C, 5% CO2. The absorbance was determined at 450 nm using a Victor X5 Multilabel Reader (Perkin Elmer, Waltham, MA, USA). All assays were performed at least three independent replicates. The 50% inhibitive concentration (IC50) was determined using GraphPad Prism 6 Software (Inc. La Jolla, CA, USA) [16].
Apoptosis assay
Cells were seeded into 12 well plates (Corning Incorporated, USA) with a density of 1 × 10⁵ cells/well. Cells were cultivated for 48 h and then treated for 6, 24 and 48 h with the test compounds (cisplatin: 7, 14 μM; cyclosporin: 10, 20 μM; aristolochic acid I: 6, 12 μM; gentamicin: 7, 14 mM). All assays were performed with three replicates.
Apoptosis assay was performed using a FITC Annexin V Apoptosis Detection Kit (BD Biosciences, San Diego, CA, USA) according to the manufacturer’s instructions. Briefly, harvested cells were washed twice in cold stain buffer, pelleted by centrifugation and resuspended with binding buffer to a final concentration of 1 × 10⁶ cells/ml. Then, 5 μl FITC Annexin V and 5 μl propidium iodide were added to 100 μl single-cell suspension and incubated for 15 min at room temperature in the dark. After binding buffer was added, cells were analysed by flow cytometry (Beckman Coulter, UK) and analysis was performed using FlowJo Version 7.6.1 [16].
Nephrotoxic marker analysis
Cells were seeded into 12 well plates (Corning Incorporated, USA) with a density of 1 × 10⁵ cells/well. Cells were cultivated for 48 h and then treated for 6, 24 and 48 h with the test compounds (cisplatin: 7, 14 μM; cyclosporin: 10, 20 μM; aristolochic acid I: 6, 12 μM; gentamicin: 7, 14 mM). All assays were performed with three replicates. The culture medium was collected for determination of biomarkers and the cells were collected for RNA isolation.
Collagen IV, calbindin, fatty acid-binding protein 1 (FABP-1), glutathione-S-transferase α (GSTα), GSTπ, interferon-induced protein-10 (IP-10), KIM-1, osteoactivin, renin, TFF-3, TIMP-1, α1-microglobulin (α1-MG), albumin, clusterin, CysC, epidermal growth factor (EGF), neutrophil gelatinase-associated lipocalin (NGAL) and osteopontin were determined using the MILLIPLEX® MAP Human Kidney Injury Magnetic Bead Panel 1 and Panel 2 (Billerica, MA, USA), respectively, following the manufacturer’s instructions. The assays are performed on the Luminex® 200 (Austin, TX, USA), which combines a sandwich ELISA immobilized on microparticle beads and flow cytometry. The data were analysed on MILLIPLEX Analyst 5.1 Software (Billerica, MA, USA) [16].
Quantitative real-time polymerase chain reaction
The total RNA was isolated using RNAprep Pure Cell/Bacteria Kit (Tiangen Biotech, Beijing, China). The cDNA synthesis was performed using the FastQuant RT Kit (with gDNase) and SuperReal PreMix Plus (SYBR Green) (Tiangen Biotech, Beijing, China). The quantitative polymerase chain reaction (qPCR; up to 40 cycles) was then performed with the Applied Biosystems 7500 Fast Real-Time PCR System (Carlsbad, CA, USA). Procedures were carried out according to the manufacturers’ instructions with the software included in the device. The data analysis was performed on 7500 Software version 2.0.6. The mRNA levels were determined by 2−ΔΔCT method and expressed as mean ± SD (n = 3). The primers were purchased from Sangon Biotech (Shanghai, China). The primer sets of target markers were shown in Table 1 and GAPDH was internal controls [16].
Table 1.
The primer sequences used for real-time PCR in the study
| Primers | |
|---|---|
| GAPDH | Forward: 5′-GGCATCCACTGTGGTCATGAG-3′ |
| Reverse: 5′-TGCACCACCAACTGCTTAGC-3′ | |
| CysC | Forward: 5′-GCCTGTGCCTATCACCTCTTAT-3 |
| Reverse: 5′-CCTTCTCTGTCTGTCTCCTGGT-3 | |
| TIMP-1 | Forward: 5′-GGGGCTTCACCAAGACCTAC-3′ |
| Reverse: 5′-GGAAGCCCTTTTCAGAGCCT-3′ | |
| Clusterin | Forward: 5′-CCAGGACAGGTTCTTCACCC-3′ |
| Reverse: 5′-CGTACGGAGAGAAGGGCATC-3′ | |
| GSTπ | Forward: 5′-TATTTCCCAGTTCGAGGCCG-3′ |
| Reverse: 5′-TACAGGGTGAGGTCTCCGTC-3′ |
Statistical analysis
The apoptosis analysis was performed using FlowJo Version 7.6.1 (Ashland, OA, USA). The difference in protein and mRNA levels of biomarkers between treated versus control groups were assessed by one way analysis of variance (ANOVA) using GraphPad Prism 6 (GraphPad Software, San Diego, CA, USA).
Results
Drugs inhibited the growth of RPTEC/TERT1 cells
In order to investigate the cytotoxic effects of drugs in vitro, CCK-8 assay was conducted in RPTEC/TERT1 cells treated with four drugs (cisplatin, cyclosporin, aristolochic acid I and gentamicin). RPTEC/TERT1 cells were treated with four drugs for 24 h in different concentrations, and IC50 values with mean ± SD were 36.0 ± 7.6 μM, 50.8 ± 12.3 μM, 30.4 ± 10.4 μM and 35.3 ± 11.8 mM, respectively, for cisplatin, cyclosporin, aristolochic acid I and gentamicin, implying that the four drugs inhibited the growth of RPTEC/TERT1 cells in a dose-dependent manner (Fig. 1).
Figure 1.
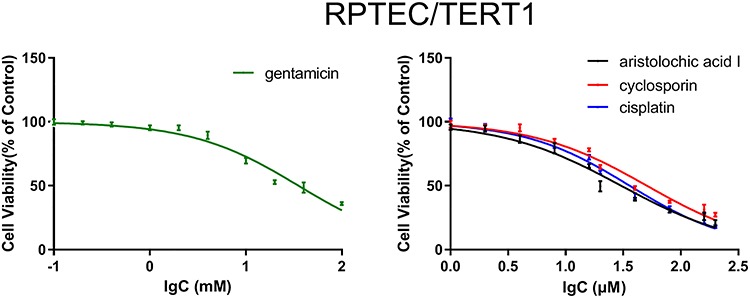
The cytotoxic effects of four drugs (cisplatin, cyclosporin, aristolochic acid I and gentamicin) administered to RPTEC/TERT1 cells, respectively.
Drugs induced the apoptosis of RPTEC/TERT1 cells
To examine whether the drugs could induce growth inhibition involving apoptosis, the FACS analysis was conducted in the RPTEC/TERT1 cells treated with the four drugs. As shown in Fig. 2 (Q1: PI-positive dead cells; Q2: Annexin V/PI-positive apoptotic cells; Q3: Annexin V-positive early apoptotic cells; Q4: viable cells), compared to vehicle control group with 3.69, 0.52 and 3.52%, respectively, treatment with different concentrations of drugs (cisplatin: 7, 14 μM; cyclosporin: 10, 20 μM; aristolochic acid I: 6, 12 μM; gentamicin: 7, 14 mM) for 24 h resulted in marked increase in early apoptotic cells. The early apoptotic cells increased significantly with the increase of concentration demonstrating that drugs induced the apoptosis in a dose-dependent manner in RPTEC/TERT1 cells.
Figure 2.
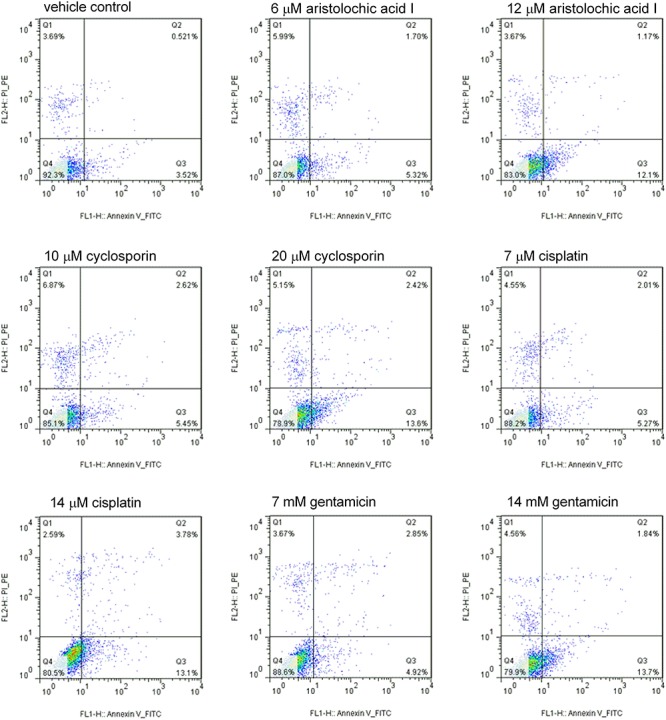
Cisplatin, cyclosporin, aristolochic acid I and gentamicin induced the increase in early apoptosis cell in RPTEC/TERT1 cell compared to vehicle control at 24 h. With the increase of compound concentration, the early apoptosis cell increased significantly (Q1: PI-positive dead cells; Q2: Annexin/PI-positive apoptotic cells; Q3: Annexin-positive early apoptotic cells; Q4: viable cells).
Protein levels of markers in vitro
In order to determine the suitable biomarkers, we evaluated the protein levels of 18 nephrotoxic biomarkers in culture medium, which have been recently identified in vivo. The RPTEC/TERT1 cells were treated with different concentrations of the four drugs (cisplatin: 7, 14 μM; cyclosporin: 10, 20 μM; aristolochic acid I: 6, 12 μM; gentamicin: 7, 14 mM) for 6, 24 and 48 h. There was obvious increase of TIMP-1, clusterin, CysC and GSTπ in RPTEC/TERT1 cells in treatment groups as shown in Fig. 3. The protein levels of the above biomarkers in the four drug treatment groups obviously increased at 48 h and slightly at 24 h compared to vehicle control group at 24 and 48 h (P < 0.05). The increase of TIMP-1, clusterin, CysC and GSTπ at 6 h was not obvious. However, no significant difference of NAG, NGAL, osteopontin, EGF, FABP-1, albumin, Collagen IV and α1-MG was found in the treatment groups in comparison with the vehicle control group (Figs 4 and 5), while the levels of calbindin, GSTα, IP-10, KIM-1, osteoactivin, renin and TFF-3 were below the detection limitation.
Figure 3.
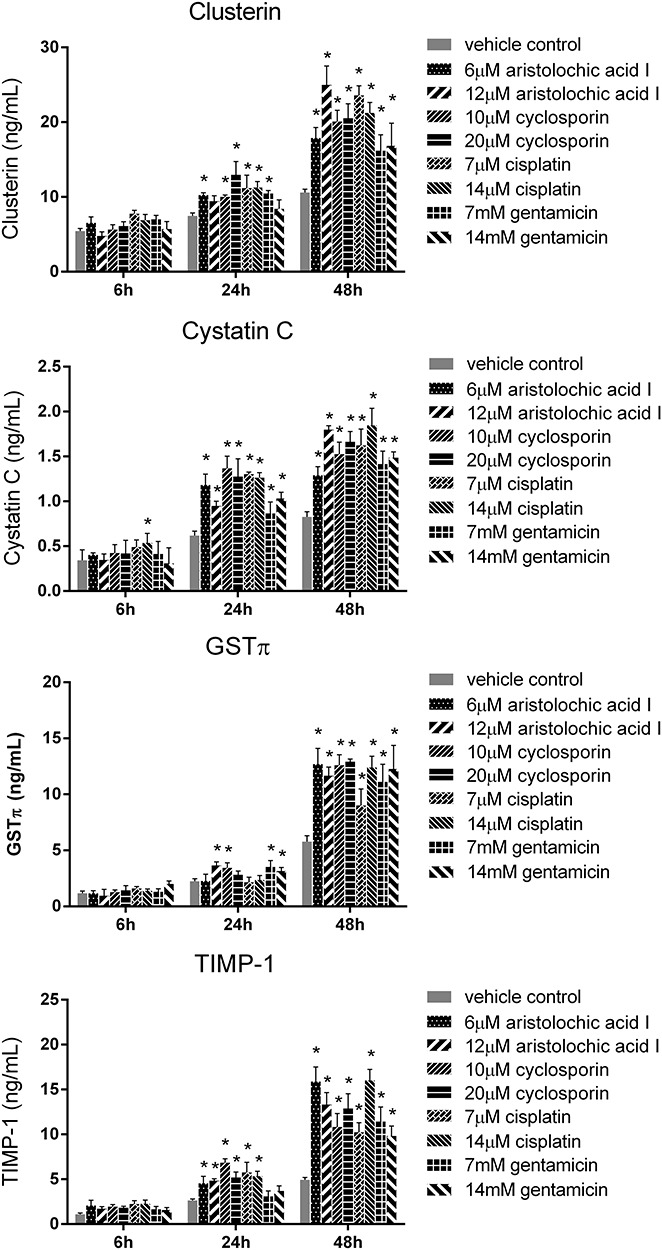
The protein levels of clusterin, CysC, GSTπ and TIMP-1 in RPTEC/TERT1 cell treated with cisplatin, cyclosporin, aristolochic acid I and gentamicin for 6, 24 and 48 h (mean ± SD, n = 3). Asterisk indicates significantly different from the vehicle control value (P < 0.05).
Figure 4.
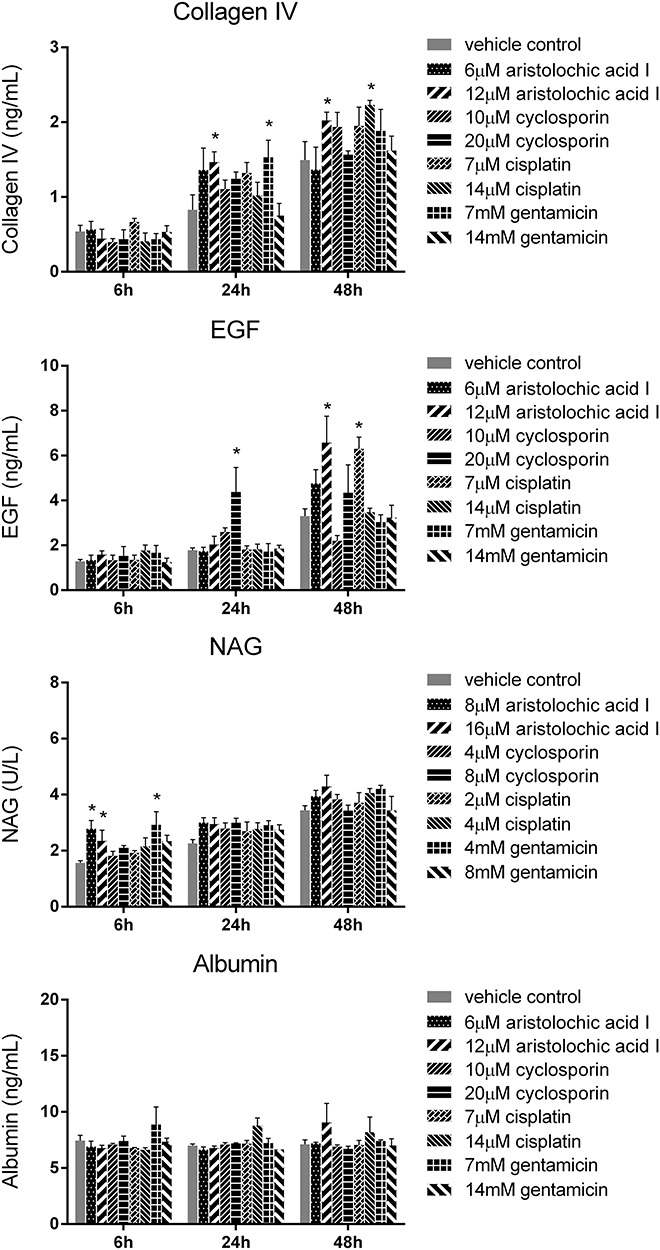
The protein levels of collagen IV, EGF, NAG and albumin in RPTEC/TERT1 cell treated with cisplatin, cyclosporin, aristolochic acid I and gentamicin for 6, 24 and 48 h (mean ± SD, n = 3). Asterisk indicates significantly different from the vehicle control value (P < 0.05).
Figure 5.
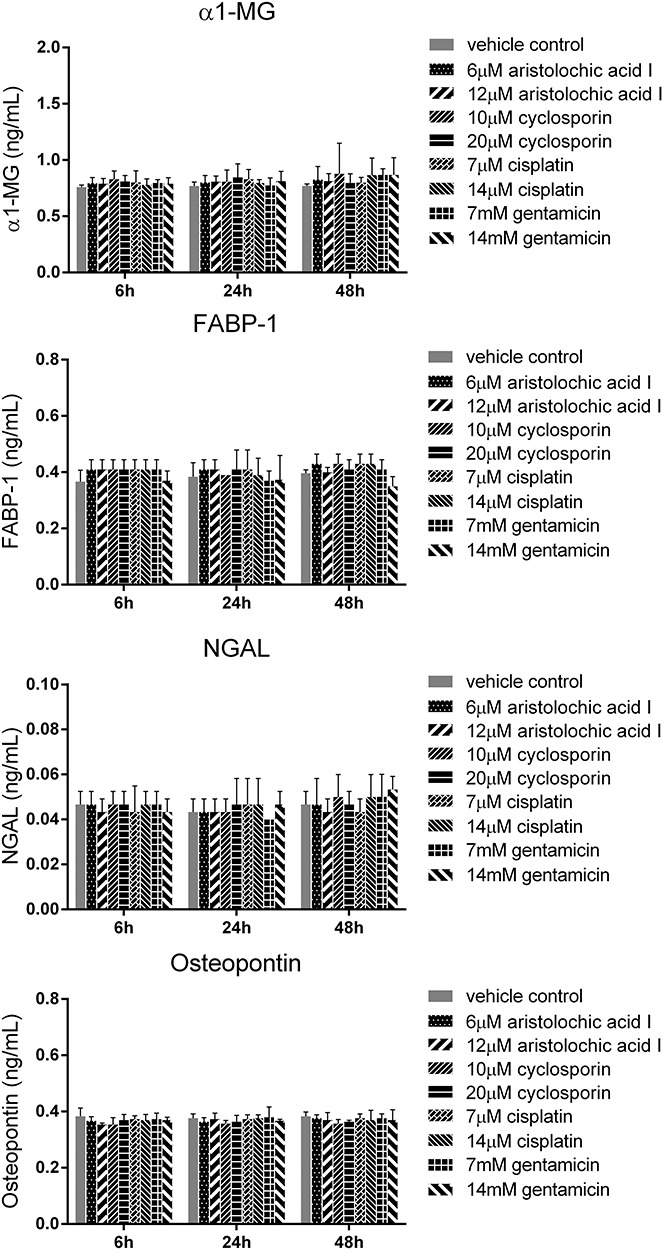
The protein levels of α1-MG, FABP-1, NGAL and osteopontin in RPTEC/TERT1 cell treated with cisplatin, cyclosporin, aristolochic acid I and gentamicin for 6, 24 and 48 h (mean ± SD, n = 3). Asterisk indicates significantly different from the vehicle control value (P < 0.05).
Changes in the mRNA levels of seven biomarkers
In order to further determine the gene levels of biomarkers, we evaluated the mRNA level of TIMP-1, clusterin, CysC and GSTπ. As shown in Fig. 6, the mRNA level of these biomarkers obviously increased compared to vehicle control group at 24 and 48 h (P < 0.05). Therefore, both protein and mRNA levels of the four biomarkers significantly increased in drug treatment groups at 24 and 48 h compared to vehicle control group.
Figure 6.
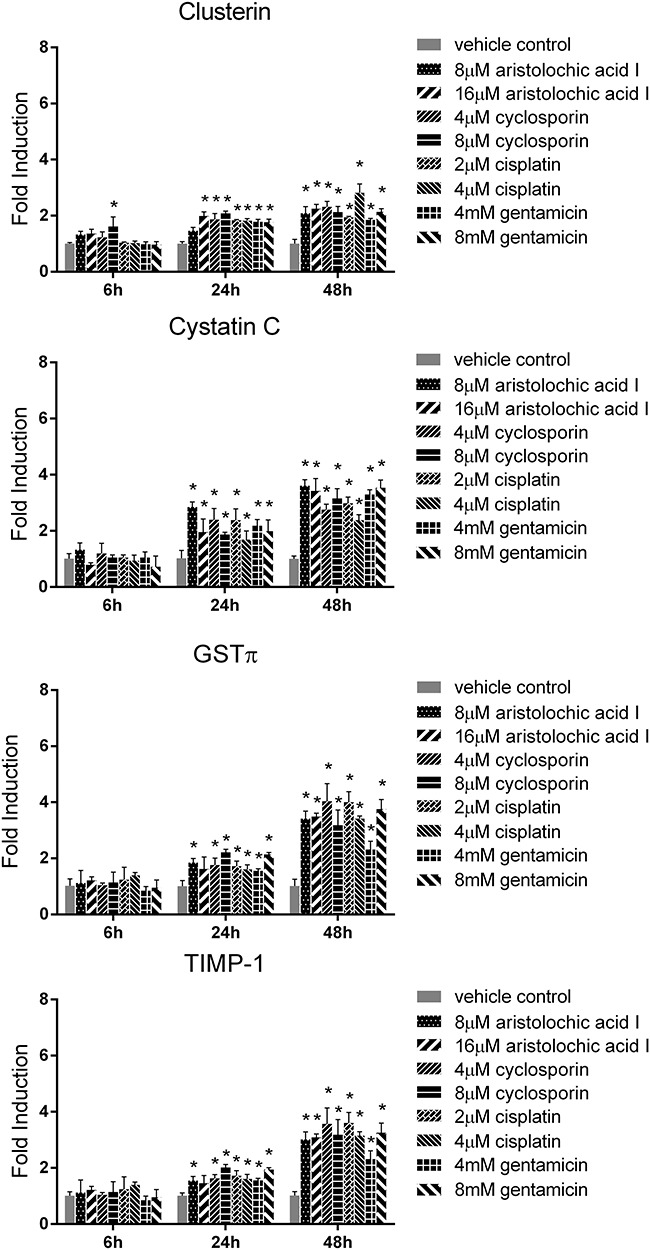
The mRNA levels of clusterin, CysC, GSTπ and TIMP-1 in RPTEC/TERT1 cell treated with cisplatin, cyclosporin, aristolochic acid I and gentamicin for 6, 24 and 48 h (mean ± SD, n = 3). Asterisk indicates significantly different from the vehicle control value (P < 0.05).
Discussion
Although in vivo studies have been used in the evaluation of multiple toxic compounds, in vitro methods or alternative tests are being emphasized recently due to the advantages of being cost-effective, practical and expedient [8]. Furthermore, in vitro methods provide useful information on the mechanism of toxicity. Early high-throughput evaluation of toxicity of various compounds with in vitro screening would be useful to reduce the cost of drug development prior to in vivo studies [9].
In vitro systems for nephrotoxic studies have been developed employing isolated perfused kidney, kidney slices, primary kidney cells and immortalized cell lines. Although isolated perfused kidney and kidney slices were more morphologically identical to kidney in vivo, poor retention of viability was the major drawback [10]. The primary cultured cells can survive only two or three passages due to the slow proliferation. However, in vitro cell culture can be easily obtained and keep stable properties for a long time [11, 12] Furthermore, cell culture systems are useful means for high-throughput screening and mechanistic studies of the toxic effects. Therefore, a variety of in vitro nephrotoxic studies have been performed on immortalized cell lines.
There has been a strong need for nephrotoxic evaluation method using immortalized cell lines derived from human tissue because they provide more reliable toxic information than cells from other species. In the present study, we aimed to evaluate biomarkers for drug-induced nephrotoxicity using a cell line derived from human kidney tissue.
The RPTEC/TERT1 cells, immortalized using hTERT subunit only without chromosomal abnormalities, have been used to characterize initial canonical responses to two environmental toxicants, cadmium (Cd) and benzo[a]pyrene (B[a]P) [17, 18]. However, there is still no comprehensive research on the potential of the known in vivo biomarkers for evaluating drug-induced nephrotoxicity in RPTEC/TERT1 cell. Herein, the four drugs (cisplatin, cyclosporin, aristolochic acid I and gentamicin), representing a variety of nephrotoxicants, were chosen to verify the cytotoxicity and the levels of nephrotoxic biomarkers in our study. We found that the RPTEC/TERT1 cells were less sensitive to gentamicin (mean IC50 value of 35.3 mM) than the other three drugs with low IC50 (level of μM) as shown in Fig. 1. It may be explained by that the uptake of gentamicin was altered in RPTEC/TERT1 cells with very low level of megalin similar to HK-2 cell [16, 19]. In our study, we also found that the four drugs could induce apoptosis of RPTEC/TERT1 cells in the dose-dependent manner as shown in Fig. 2. These results imply that the observed inhibitory effect of four drugs on the growth of RPTEC/TERT1 cells may be due to the induction of apoptotic cell. However, it is difficult to understand the functional state of cells and identify appropriate endpoints in vitro. In order to induce cell injury, the RPTEC/TERT1 cells were treated with the concentration in apoptosis assay and the potential nephrotoxic biomarkers were screened.
As the same with recently reported in vivo biomarkers for in vitro nephrotoxic evaluation in HK-2 cells [20, 21], we also found that the protein and mRNA levels of clusterin, CysC, TIMP-1 and GSTπ in RPTEC/TERT1 cells significantly increased in the treatment group with the four drugs compared to vehicle control group (P < 0.05) as shown in Figs 3 and 6. However, the increase of these endpoints with a dose-independent manner may be explained by that the expressions of protein and mRNA levels depend on the functional state of cells, not the injury degree. In addition, other biomarkers are not sensitive endpoints to evaluating drug-induced nephrotoxicity in RPTEC/TERT1 cells, such as NAG, NGAL, osteopontin, EGF, FABP-1, albumin, collagen IV, α1-MG calbindin, GSTα, IP-10, KIM-1, osteoactivin, renin and TFF-3 as shown in Figs 4 and 5.
In the studies aiming at the development of in vitro models, a comprehensive comparison of different proximal tubule cell (PTC) was performed with 41 well-characterized compounds using the mRNA levels of interleukin (IL)-6/IL-8 as endpoint. The best in terms of predicting nephrotoxicity was human primary PTC with area under the curve (AUC) value of 0.85 followed by human embryonic stem cells derived cells with AUC value of 0.80. And the AUC values for RPTEC/TERT1 and LLC-PK1 cells were 0.71 and 0.73, respectively. The model may not be suitable for high-throughput screening, taking into account the labor-intensive and time-consuming PCR method [22, 23]. In our earlier study, we developed the model based on the HK-2 cell using the protein expression of clusterin, osteopontin, CysC and KIM-1 as endpoints with AUC value of 0.79–0.84 [16]. Therefore, the RPTEC/TERT1 cells will be an appropriate model based on the protein expression of above validated biomarkers as the endpoints.
Conclusions
Together, we comprehensively evaluate the potential of the known in vivo nephrotoxic biomarkers in the RPTEC/TERT1 cells. The results clearly demonstrate that clusterin, CysC, TIMP-1 and GSTπ may be effectively used as the biomarkers for drug-induced nephrotoxicity in RPTEC/TERT1 cells and need to be validated with more compounds prospectively. Even if the cells express normal characteristics and represent reliable in vitro models, it is important to keep in mind that unlike the in vivo situation in animal organisms, cell lines are not able to perform all the stages of development, differentiation and aging in vitro. Therefore, it would be desirable to utilize both in vivo and in vitro test methods for reliable and confident assessment of drug-induced nephrotoxicity.
Conflict of interest statement
None declared.
Acknowledgements
This work was supported by the Ministry of Science and Technology of the People’s Republic of China (No. 2018ZX09201017-001) and the National Natural Science Foundation of China (No. 81603210).
References
- 1. Choudhury D, Ahmed Z. Drug-associated renal dysfunction and injury. Nat Clin Pract Nephrol 2006;2:80–91. [DOI] [PubMed] [Google Scholar]
- 2. Rached E, Hoffmann D, Blumbach K et al. . Evaluation of putative biomarkers of nephrotoxicity after exposure to ochratoxin a in vivo and in vitro. Toxicol Sci 2008;103:371–81. [DOI] [PubMed] [Google Scholar]
- 3. Bonventre JV, Vaidya VS, Schmouder R et al. . Next-generation biomarkers for detecting kidney toxicity. Nat Biotechnol 2010;28:436–40. [DOI] [PMC free article] [PubMed] [Google Scholar]
- 4. Huang HF, Zhou JY, Chen JH. Biomarkers for early diagnosis of acute kidney injury: current progress and clinical prospects. Curr Protein Pept Sci 2017;18:1205–10. [DOI] [PubMed] [Google Scholar]
- 5. Marrer E, Dieterle F. Impact of biomarker development on drug safety assessment. Toxicol Appl Pharmacol 2010;243:167–79. [DOI] [PubMed] [Google Scholar]
- 6. Sistare FD, Dieterle F, Troth S et al. . Towards consensus practices to qualify safety biomarkers for use in early drug development. Nat Biotechnol 2010;28:446–54. [DOI] [PubMed] [Google Scholar]
- 7. Al-Naimi MS, Rasheed HA, Hussien NR et al. . Nephrotoxicity: role and significance of renal biomarkers in the early detection of acute renal injury. J Adv Pharm Technol Res 2019;10:95–9. [DOI] [PMC free article] [PubMed] [Google Scholar]
- 8. Gobe GC, Coombes JS, Fassett RG et al. . Biomarkers of drug-induced acute kidney injury in the adult. Expert Opin Drug Metab Toxicol 2015;11:1683–94. [DOI] [PubMed] [Google Scholar]
- 9. Faria J, Ahmed S, Gerritsen KGF et al. . Kidney-based in vitro models for drug-induced toxicity testing. Arch Toxicol 2019;93:3397–418. [DOI] [PubMed] [Google Scholar]
- 10. McDuffie JE. Brief overview: assessment of compound-induced acute kidney injury using animal models, biomarkers, and in vitro platforms. Toxicol Pathol 2018;46:978–90. [DOI] [PubMed] [Google Scholar]
- 11. Soo JY, Jansen J, Masereeuw R et al. . Advances in predictive in vitro models of drug-induced nephrotoxicity. Nat Rev Nephrol 2018;14:378–93. [DOI] [PMC free article] [PubMed] [Google Scholar]
- 12. Cook D, Brown D, Alexander R et al. . Lessons learned from the fate of AstraZeneca’s drug pipeline: a five dimensional frame work. Nat Rev Drug Discov 2014;13:419–31. [DOI] [PubMed] [Google Scholar]
- 13. Wieser M, Stadler G, Jennings P et al. . hTERT alone immortalizes epithelial cells of renal proximal tubules without changing their functional characteristics. Am J Physiol Renal Physiol 2008;295:F1365–75. [DOI] [PubMed] [Google Scholar]
- 14. Aschauer L, Limonciel A, Wilmes A et al. . Application of RPTEC/TERT1 cells for investigation of repeat dose nephrotoxicity: A transcriptomic study. Toxicol In Vitro 2015;30:106–16. [DOI] [PubMed] [Google Scholar]
- 15. Secker PF, Schlichenmaier N, Beilmann M et al. . Functional transepithelial transport measurements to detect nephrotoxicity in vitro using the RPTEC/TERT1 cell line. Arch Toxicol 2019;93:1965–78. [DOI] [PubMed] [Google Scholar]
- 16. Qiu X, Zhou X, Miao Y et al. . An in vitro method for nephrotoxicity evaluation using HK-2 human kidney epithelial cells combined with biomarkers of nephrotoxicity. Toxicol Res 2018;13:1205–13. [DOI] [PMC free article] [PubMed] [Google Scholar]
- 17. Simon-Friedt BR, Wilson MJ, Blake DA et al. . The RPTEC/TERT1 cell line as an improved tool for in vitro nephrotoxicity assessments. Biol Trace Elem Res 2015;166:66–71. [DOI] [PMC free article] [PubMed] [Google Scholar]
- 18. Simon BR, Wilson MJ, Wickliffe JK. The RPTEC/TERT1 cell line models key renal cell responses to the environmental toxicants, benzo[a]pyrene and cadmium. Toxicol Res 2014;1:231–42. [DOI] [PMC free article] [PubMed] [Google Scholar]
- 19. Sawada T, Nagai J, Okada Y et al. . Gadolinium modulates gentamicin uptake via an endocytosis-independent pathway in HK-2 human renal proximal tubular cell line. Eur J Pharmacol 2012;684:146–53. [DOI] [PubMed] [Google Scholar]
- 20. Luo QH, Chen ML, Chen ZL et al. . Evaluation of KIM-1 and NGAL as early indicators for assessment of gentamycin-induced nephrotoxicity in vivo and in vitro. Kidney Blood Press Res 2016;41:911–8. [DOI] [PubMed] [Google Scholar]
- 21. Hauschke M, Roušarová E, Flídr P et al. . Neutrophil gelatinase-associated lipocalin production negatively correlates with HK-2 cell impairment: evaluation of NGAL as a marker of toxicity in HK-2 cells. Toxicol In Vitro 2017;39:52–7. [DOI] [PubMed] [Google Scholar]
- 22. Li Y, Oo ZY, Chang SY et al. . An in vitro method for the prediction of renal proximal tubular toxicity in humans. Toxicol Res 2013;2:352–65. [Google Scholar]
- 23. Li Y, Kandasamy K, Chuah JK et al. . Identification of nephrotoxic compounds with embryonic stem-cell-derived human renal proximal tubular-like cells. Mol Pharm 2014;11:1982–90. [DOI] [PubMed] [Google Scholar]


