

Abstract
In recent years, numerous studies have shown that astrocytes play an important role in neuronal processing of information. One of the most interesting findings is the existence of bidirectional interactions between neurons and astrocytes at synapses, which has given rise to the concept of “tripartite synapses” from a functional point of view. We used focused ion beam milling and scanning electron microscopy (FIB/SEM) to examine in 3D the relationship of synapses with astrocytes that were previously labeled by intracellular injections in the rat somatosensory cortex. We observed that a large number of synapses (32%) had no contact with astrocytic processes. The remaining synapses (68%) were in contact with astrocytic processes, either at the level of the synaptic cleft (44%) or with the pre- and/or post-synaptic elements (24%). Regarding synaptic morphology, larger synapses with more complex shapes were most frequently found within the population that had the synaptic cleft in contact with astrocytic processes. Furthermore, we observed that although synapses were randomly distributed in space, synapses that were free of astrocytic processes tended to form clusters. Overall, at least in the developing rat neocortex, the concept of tripartite synapse only seems to be applicable to a subset of synapses.
Keywords: FIB-SEM, glia, three-dimensional, tripartite synapse, ultrastructure
Introduction
It has long been thought that astrocytes were merely supportive cells for neurons (Kettenmann and Verkhratsky 2008). However, this view has changed in recent years. Mounting evidence indicates that astrocytes are able to respond to synaptic activity through restricted, discrete Ca2+ transients and then locally modulate neuronal function (Clarke and Barres 2013) by actively releasing the so-called gliotransmitters, such as ATP (Arcuino et al. 2002), D-serine (Schell et al. 1995), and glutamate (Parpura et al. 1994). In addition, astrocytes are involved in global and widespread control of neuronal activity, inducing a tightly synchronized neuronal firing and a co-ordinated synaptic network (Fellin et al. 2004; Pascual et al. 2005; Min and Nevian 2012; Pannasch et al. 2014; Morquette et al. 2015; Poskanzer and Yuste 2016; for review, see Dallérac et al. 2018). Earlier findings suggest the existence of bidirectional interactions between neurons and astrocytes at excitatory synapses, giving rise to the concept of “tripartite synapses” (Araque et al. 1999; Ventura and Harris 1999). The term “tripartite synapse” refers to the concept in synaptic physiology that, in addition to the classic “bipartite” information flow between the pre- and post-synaptic neurons, astrocytes exchange information with the synaptic neuronal elements, responding to synaptic activity and, in turn, regulating synaptic transmission and plasticity. Astrocytes have recently been described as active partners for enhancing synaptic function (Fellin et al. 2004; Fiacco and McCarthy 2004), and it has been hypothesized that astrocytic calcium increase is involved in synaptic plasticity and the processing, transfer, and storage of information by the nervous system (Verkhratsky et al. 1998; Danbolt 2001; Theodosis et al. 2008; Perea et al. 2009; Min and Nevian 2012; Tasker et al. 2012; Zorec et al. 2015).
Regarding morphology, it has been reported that astrocytes are organized in a nonoverlapping tile-like manner and that one single astrocyte can potentially influence thousands of synapses within their occupancy volume (Bushong et al. 2002; Sofroniew and Vinters 2010; Khakh and Sofroniew 2015). Studies performed using transmission electron microscopy (TEM), in which glial processes were distinguished by their morphological appearance, have reported a variable percentage of synapses with the synaptic cleft in contact with astrocytic processes depending on species, regions, and tissue preparation (Ventura and Harris 1999; Witcher et al. 2007, 2010; Lushnikova et al. 2009; Bernardinelli et al. 2014a, 2014b; Medvedev et al. 2014; Rollenhagen et al. 2015, 2018). These studies were based on reconstructions of 33-229 synapses and the identification of thin astrocytic processes was performed according to morphological ultrastructural features.
The recent development of 3D electron microscopy (Denk and Horstmann 2004; Smith 2007; Knott et al. 2008; Merchán-Pérez et al. 2009; Helmstaedter 2013; Morgan and Lichtman 2013; Kubota et al. 2018) has made it possible to investigate large numbers of synapses (on the scale of thousands; n = 2993 in our case) in long series of sections in an automated way, which is extraordinarily important to have a broader picture of the 3D relationships between synapses and glial processes.
There are several studies showing that astrocytes are “territorial” in the sense that near the soma of the astrocyte virtually all astrocytic processes are coming from a single astrocyte (Bushong et al. 2002; Ogata and Kosaka 2002; Halassa et al. 2007; Jinno et al. 2007; Sofroniew and Vinters 2010; Khakh and Sofroniew 2015; Nimmerjahn and Bergles 2015). Assuming that the single astrocytic territory has no structural overlap with other neighboring astrocytes, we labeled single astrocytes using intracellular injections of the fluorescent marker Alexa 594. The fluorescent labeling was photoconverted into electron dense diaminobenzidine (DAB)-deposits, and then stacks of serial electron micrographs were acquired using FIB/SEM. Thus, all synapses within the arborization of the labeled astrocyte could be examined at the electron microscope level to determine whether or not they were physically adjacent to the astrocytic processes (to be certain that if a synapse was not in contact with a labeled astrocytic process, then it was not in contact with any other astrocytic process). Since excitatory (asymmetric) and inhibitory (symmetric) synapses can be easily recognized in serial sections based on their morphological features (Merchán-Pérez et al. 2009), it is feasible—using this combination of techniques—to study the relationship of the astrocytes with these two major types of cortical synapses. Furthermore, the size and shape (diameter, area and volume) of the astrocytic arbors of single astrocytes labeled with intracellular injections of fluorescent markers can be accurately determined in these experiments. We focused on layer IV of the developing rat primary somatosensory cortex (hindlimb representation, S1HL). In most sensory cortices, layer IV is the main layer where thalamocortical afferents arrive (Sherman and Guillery 1996) and, thus, it is considered to be the first place of intracortical information processing (Bruno and Sakmann 2006).
Material and Methods
Tissue Preparation
Seven 14-day-old male Wistar rats were administered a lethal intraperitoneal injection of sodium pentobarbital (40 mg/kg) and were intracardially perfused at room temperature with saline solution, and then with 4% paraformaldehyde (Sigma-Aldrich, St Louis, MO, USA) in 0.1 M sodium phosphate buffer (PB; Panreac, 131965, Spain), pH 7.4. All animals were handled in accordance with the guidelines for animal research set out in the European Community Directive 86/609/EEC and all procedures were also approved by the local ethics committee of the Spanish National Research Council.
Brains were extracted from the skull and the right and left hemispheres were processed differently. The right hemisphere was postfixed at 4°C overnight in the same fixative solution. Subsequently, coronal 50 and 200 μm sections were obtained with a vibratome (Vibratome Sectioning System, VT1200S Vibratome, Leica Biosystems, Germany). Astrocytes were injected (see below) in coronal sections in S1HL (Bregma −0 to −2.28; Paxinos and Watson 2007). The left hemisphere was flattened between two glass slides (Welker and Woolsey 1974) and further immersed in 4% paraformaldehyde for 24 h. Sections (200 μm) were cut parallel to the cortical surface with a vibratome. By relating these sections to coronal sections, we were able to identify—using cytoarchitectural differences—the section that contained each cortical layer, allowing the subsequent injection of cells (see below) in the S1HL cortical region [approximately corresponding to area S1HL of Franklin and Paxinos (1997)]. Cytochrome oxidase (CO) staining was used to label dark modules in layer IV somatosensory cortex (Wong-Riley and Welt 1980; Jain et al. 2003) in order to locate the hindlimb somatosensory cortical region (Rojo et al. 2016).
Intracellular Injections
Intracellular injections of astrocytes were performed as previously described for pyramidal neurons in different brain regions and species (Elston and Rosa 1997; Ballesteros-Yáñez et al. 2007, 2010; Benavides-Piccione et al. 2013; Miguéns et al. 2015; Selvas et al. 2017). Briefly, coronal and horizontal sections (200 μm) from postnatal day (P) 14 rat brains were prelabeled with 4,6 diamino-2-phenylindole (DAPI; Sigma, St Louis, MO, USA) 0.025% in PBS and staining time around 10 s to identify the cell nuclei. Putative astrocytic nuclei were distinguished based on their morphological characteristics; they are smaller, with brighter and more compact chromatin than neuronal nuclei. After labeling, these cells are identified as astrocytes by the typical morphology of their cellular processes, which consists of a complex star-shaped arborization with numerous fine processes (Fig. 1).
Figure 1.
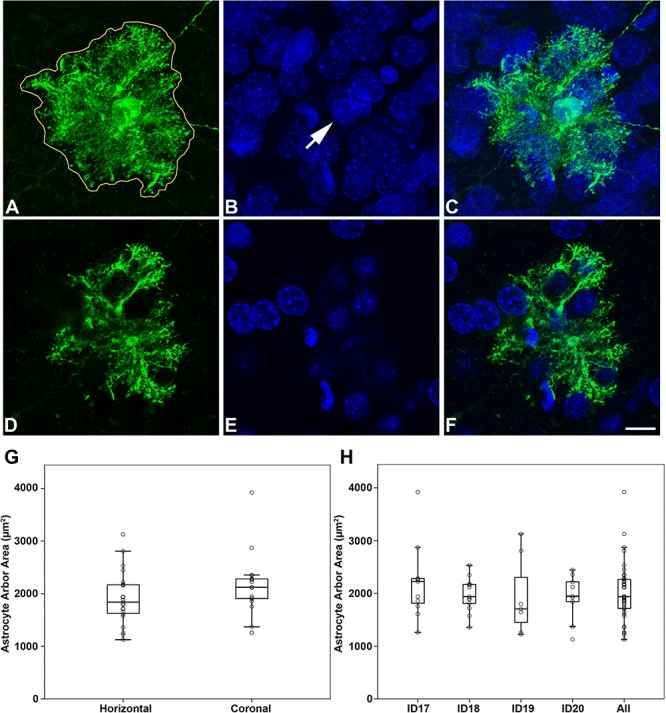
Arbor of LY-injected astrocytes. A–C, An example of an LY-injected astrocyte. A, Maximum projection of an LY-injected astrocyte (39 slices, z-step = 0.5 μm). The solid white line was manually traced using ImageJ and encloses the 2D surface area whose shape corresponds to the maximum surface area delineated by the distal ends of the astrocytic arborization. B, Maximum projection of DAPI staining in the same section and field as panel A. C, Panel C was obtained by combining A and B. The arrow in B points out the DAPI-stained nucleus of the injected astrocyte. D–F, Single confocal optical sections from the stack of images in A–C showing the same stainings, respectively. G, Box plot illustrating the astrocyte arbor area of LY-injected cells in horizontal and coronal sections. H, Box plot illustrating the astrocyte arbor area of LY-injected cells in each P14 rat (including LY-injected cells in horizontal and coronal sections) and the average of all LY-injected cells. See Supplementary Table 1 for details of astrocyte arbor data and statistical comparisons. Scale bar shown in F indicates 15 μm in A–F.
Astrocytes in the S1HL were injected individually using a glass micropipette filled with Alexa 594 for microinjections (Invitrogen, Eugene, OR) or Lucifer Yellow (LY, 8% in 0.1 M Tris buffer, pH 7.4) (Sigma) by passing a steady hyperpolarizing current through the electrode. Alexa 594 or LY were applied to each injected cell until the distal tips of each cell fluoresced brightly, indicating that all processes were completely filled and ensuring that the fluorescence did not diminish at a distance from the soma. Visually, no differences were observed in terms of morphology (shape of the cell and arborization of the processes) between LY and Alexa 594-injected cells. Astrocytes filled with LY were injected in the whole S1HL (both in coronal and horizontal sections), while astrocytes filled with Alexa 594 were injected in coronal sections in S1HL (Bregma −1.44 to −2.28; Paxinos and Watson 2007), that is, in the brain area where the representation of the hindpaw and the proximal hind limb are located (Chapin and Lin 1984, Seelke et al. 2012).
Immunocytochemistry
Following the intracellular injection of astrocytes with LY, coronal and horizontal sections were immunostained for LY using rabbit antisera against LY (1:400 000; generated at the Instituto Cajal) diluted in stock solution (2% bovine serum albumin, 1% Triton X-100, and 5% sucrose in PB). The sections were then incubated in biotinylated donkey antirabbit IgG (1:100; Amersham, Buckinghamshire, UK) and streptavidin-conjugated Alexa fluor 488 (1:1000; Molecular Probes, Eugene, OR, USA). Finally, sections were mounted in ProLong mounting medium (Invitrogen, Waltham, MA, USA).
Imaging and Astrocytic Arbor Analysis
Astrocytes injected intracellularly with LY and located in layer IV of the S1HL in coronal and horizontal sections were imaged with a Zeiss 710 confocal laser scanning system (Carl Zeiss Microscopy, Germany). Stacks of images (35–87 images; z-step of 0.50 μm) were acquired at high magnification to capture whole cells (pixel size (x, y) = 0.132 μm). For each stack of images, confocal parameters were set, so that the fluorescence signal was as bright as possible while ensuring that there were no pixels saturated within the processes. ImageJ was used to manually trace and quantify a 2D surface area whose shape corresponded to the maximum surface area delineated by the distal ends of the astrocytic arborization (Fig. 1 and Supplementary Table 1).
Tissue Preparation for Electron Microscopy
Coronal sections in which astrocytes had been intracellularly injected with Alexa 594 were subsequently photoconverted by immersing them in DAB (1.5 mg/mL in TRIS 0.1 M pH 8.2) and applying fluorescence light through a filter (Bandpass 660) and a ×10 objective for approximately 30 min (Fig. 2B–D) (Buhl and Lübke 1989). The time necessary for photoconversion was visually controlled, with the process continuing until the fluorescence of the soma of injected cells had disappeared and the cell appeared brown with the light microscope. The sections were then washed in 0.1 M sodium cacodylate (Sigma, C0250-500G, Germany) buffer and postfixed for 24 h in a solution containing 2% paraformaldehyde, 2.5% glutaraldehyde (TAAB, G002, UK), and 0.003% CaCl2 (Sigma, C-2661-500G, Germany) in 0.1 M sodium cacodylate buffer. These sections were washed in 0.1 M sodium cacodylate buffer and treated with 1% OsO4 (Sigma, O5500, Germany), 0.1% ferrocyanide potassium (Probus, 23345, Spain), 0.003% CaCl2, and 7% glucose in 0.1 M sodium cacodylate buffer for 1 h at room temperature. After washing in 0.1 M sodium cacodylate buffer, sections were stained with 2% uranyl acetate (EMS, 8473, USA), and then dehydrated and flat embedded in Araldite (TAAB, E021, UK) for 48 h at 60°C (DeFelipe and Fairén 1993). Embedded sections were glued onto a blank Araldite block and trimmed. Semithin sections (1–2 μm thickness) were obtained from the surface of the block until the first processes, visualized as brown-colored deposits, of the astrocyte to be analyzed appeared in the semithin section. Then, semithin sections were stained with 1% toluidine blue (Merck, 115930, Germany) in 1% sodium borate (Panreac, 141644, Spain). The last semithin section (which corresponds to the section immediately adjacent to the block surface) was examined under light microscope and photographed to accurately locate the selected astrocyte regions to be examined (Fig. 2E,F).
Figure 2.
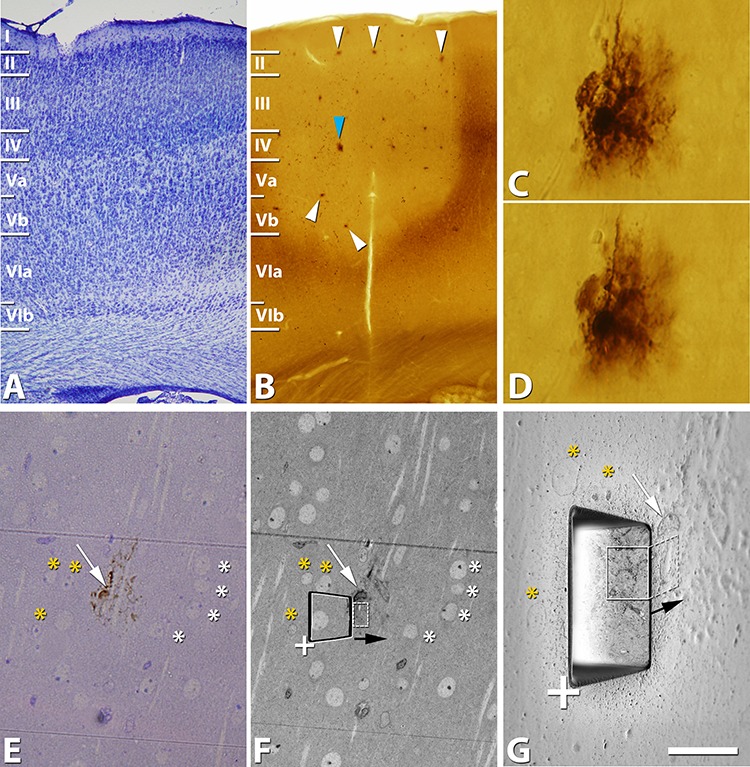
Example of the selection of the location for the acquisition of a stack of images by FIB/SEM. A, Low-magnification image from a Nissl stained section showing the cytoarchitectonic cortical organization of P14 rat S1HL. B, Low-magnification image from a section where astrocytes were injected with Alexa 594 and then immediately photoconverted (arrowheads). Blue arrowhead in B points to an astrocyte in C and D. C, D, Higher-magnification images showing two optical sections of a photoconverted astrocyte. E, Image obtained from the last semithin section that was cut from the surface of the block. We stopped cutting when the first DAB-stained processes and beginning of the cell body from the photoconverted astrocyte were observed in a semithin section. F, Similar field to that shown in E, imaged with the SEM column by using detectors for secondary electrons from the surface of the block. Asterisks point out some of the same nuclei observed in E and F. G, Composition showing a trapezoidal trench (imaged with the SEM column by using detectors for secondary electrons) excavated with the FIB to allow visual access to the tissue below the block surface and acquire a stack of FIB/SEM images (location of the trench has been represented in F; the same corner of the trench is pointed out by a “+” in F and G). In the front of the trench, we can observe the tissue exposed and the first image taken in the FIB/SEM stack of images (region surrounded by a rectangle with continuous white line; x, y dimensions) (imaged with the SEM column by using detectors for backscattered electrons). The series of images is then acquired by sequentially milling and imaging the front wall of the trench. Black arrow indicates the direction of the milling progression (in F and G). The actual imaged volume is represented by the dashed white rectangle (also represented in F). The white arrow in E–G points out the nucleus of the astrocyte partially observed in the surface of the tissue block. Yellow asterisks in G point out the same nuclei in E and F. This particular example corresponds to astrocyte 1. Scale bar shown in G indicates 440 μm in A, B; 30 μm in C, D; 40 μm in E, F; and 15 μm in G.
The blocks containing the embedded tissue were glued onto a sample stub using conductive adhesive tabs (EMS 77825-09, Hatfield, PA, USA). All the surfaces of the blocks, except the area to be studied (the top surface), were covered with silver paint (EMS 12630, Hatfield, PA, USA) to prevent charging artifacts. The stubs with the mounted blocks were then placed into a sputter coater (Emitech K575X, Quorum Emitech, Ashford, Kent, UK) and the top surface was coated with a 10–20 nm thick layer of gold/palladium to facilitate charge dissipation.
Focused Ion Beam Milling and the Acquisition of Serial Scanning Electron Microscopy Images
We used a Crossbeam 540 electron microscope (Carl Zeiss NTS GmbH, Oberkochen, Germany). This instrument combines a high-resolution field emission SEM column with a focused gallium ion beam, which can mill the sample surface, removing thin layers of material on a nanometer scale. After removing each slice (20 nm thick), the milling process was paused and the freshly exposed surface was imaged with a 1.8 kV acceleration potential using the in-column energy selective backscattered (EsB) electron detector. The milling and imaging processes were sequentially repeated, and long series of images were acquired through a fully automated procedure, thus obtaining a stack of images that represented a three-dimensional sample of the tissue (Merchán-Pérez et al. 2009).
Seven different samples (stacks of images) within the arbor of two astrocytes located in layer IV of the S1HL in coronal slices of two P14 rats were obtained (three samples in astrocyte 1 and four samples in astrocyte 2) (Fig. 2G). Image resolution in the x, y plane was 7 nm/pixel. Resolution in the z-axis (section thickness) was 20 nm and image sizes were 2048 x 1536 pixels. The number of sections per stack ranged from 90 to 461 (mean 366.29; total 2564 sections). Only those stacks where part of the astrocyte cell body was present were analyzed to ensure that the analysis was performed not further than 15–20 μm in any direction from the cell body. The analysis was performed completely within the arbor of the astrocyte, thus excluding the region occupied by other neighboring astrocytes (Supplementary Table 2).
Tissue Shrinkage Estimation
All measurements were corrected for tissue shrinkage that occurs during osmication and plastic embedding of the vibratome sections containing the area of interest (Merchán-Pérez et al. 2009). To estimate the shrinkage in our samples, we photographed and measured the vibratome sections with Stereo Investigator (MBF Bioscience, Williston, VT, USA), both before and after processing for electron microscopy. The values after processing were divided by the values before processing to obtain the volume, area, and linear shrinkage factors (Oorschot et al. 1991), yielding correction factors of 0.96, 0.97, and 0.99, respectively.
Estimation of the Volume Fraction of Photoconverted Astrocytic Elements
We used the Cavalieri method (Gundersen et al. 1988) to estimate the volume fraction of photoconverted astrocytic elements that were present in the stacks of FIB/SEM images. We used “Image J Stereology Toolset” (Mironov 2017) to analyze the four stacks of images described above. A grid with an area per point of 6.8 μm2 was used. The estimations were made in every 10th section of each stack (z = 200 nm). A total of 163 sections were analyzed. The parameters used for the Cavalieri method (grid size and number of sections) were chosen based on a pilot study (Broskey et al. 2013). Coefficients of error and variation were calculated to ensure the reliability of the measurements (Howard and Reed 2005) (Supplementary Table 3).
Synaptic Three-Dimensional Analysis
Stacks of images obtained by FIB/SEM were analyzed using EspINA software (EspINA Interactive Neuron Analyzer, 2.1.9; http://cajalbbp.cesvima.upm.es/espina/), which allows the segmentation of synapses in the stack of serial sections (for a detailed description of the segmentation algorithm, see Morales et al. 2011; Fig. 3; Supplementary Fig. 1; Supplementary Videos 1 and 2). Since the synaptic junctions were fully reconstructed as described elsewhere (Merchán-Pérez et al. 2009), each synapse could be classified as asymmetric (AS) or symmetric (SS) based on its prominent or thin postsynaptic density (PSD), respectively (Gray 1959; Peters and Palay 1996; Fig. 4A–G: an example of a symmetric synapse, Fig. 4H–U: two examples of asymmetric synapses). EspINA allows the navigation of the stacks and each stack can also be digitally resliced through orthogonal planes of section. In this way, the spatial relationship between synapses and astrocytic processes was analyzed in 3D. EspINA also provides the number of synapses within an unbiased 3D counting frame of known volume, so the local density of synapses could be established (Howard and Reed 2005; Merchán-Pérez et al. 2009).
Figure 3.
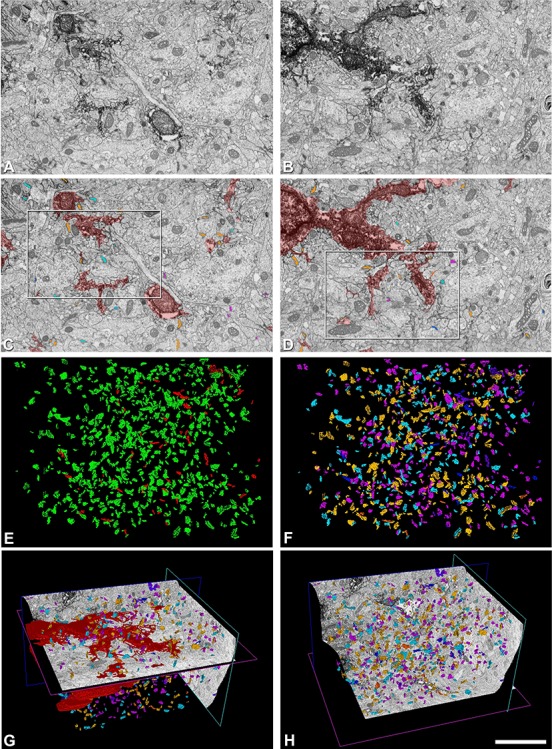
Example of FIB/SEM imaging, segmentation, and 3D visualization. A, B, Images 88 and 147 from a stack of images. Electron dense deposits of DAB are visible within astrocytic compartments (soma and processes) in the FIB/SEM images. C, D, Same FIB/SEM images as in A and B, respectively, with segmented structures (astrocytic compartments in red; synapses: asymmetric “Cleft Ast” in light orange, asymmetric “Pre/Post Ast” in light blue, asymmetric “Free Ast” in light purple, symmetric “Cleft Ast” in dark orange, symmetric “Pre/Post Ast” in dark blue, and symmetric “Free Ast” in dark purple). White rectangles in C, D surround regions shown at higher magnification in Supplementary Figure 1. E, Frontal 3D view of the asymmetric (green) and symmetric (red) segmented synapses. F, Frontal 3D view of the asymmetric and symmetric segmented synapses classified—according to their contacts with the labeled astrocytic compartments—as “Cleft Ast”, “Pre/Post Ast,” or “Free Ast” (colors as already stated). G, Diagonal 3D view showing orthogonal axis from the FIB/SEM stack of images and segmented structures (astrocytes and synapses; colors and synaptic classifications as already stated). H, Diagonal 3D view showing orthogonal axis from the FIB/SEM stack of images and segmented synapses (colors and synaptic classifications as already stated). This particular example corresponds to sample 4 from astrocyte 1. Scale bar shown in H indicates 2.7 μm in A–F and 5.7 μm in G, H.
Figure 4.
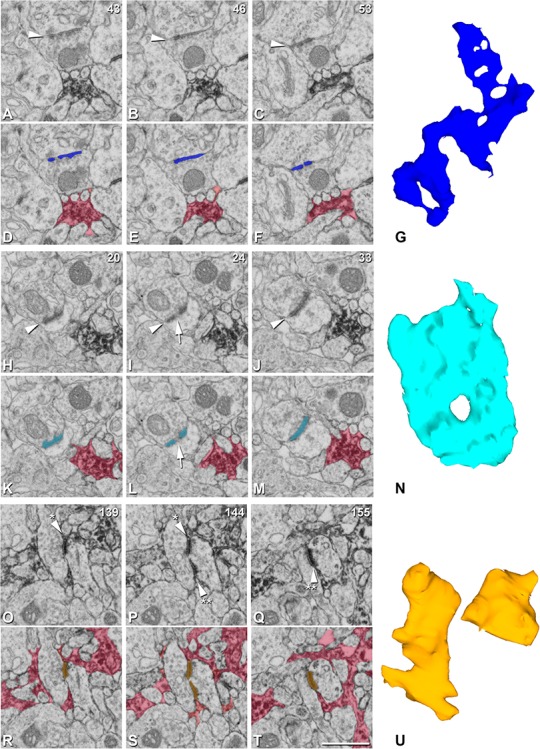
Classification of synapses according to their synaptic shape. Example of synapses with nonmacular shapes. A–C, Clipping from three FIB/SEM images (slices 43, 46, 53) showing a symmetric “Pre/Post Ast synapse” (arrowhead). D–F, Same images as in A–C with segmentation of the synapse (dark blue) and the astrocytic processes (red). G, 3D synaptic segmentation obtained automatically by EspINA software. This synaptic shape is classified as horseshoe-shaped. H–J, Clipping from three FIB/SEM images (slices 20, 24, 33) showing an asymmetric “Pre/Post Ast synapse” (arrowhead). The arrow points out a discontinuity in the synaptic junction. K–M, Same images as in H–J with segmentation of the synapse (light blue) and the astrocytic processes (red). The arrow points out a discontinuity in the synaptic junction. N, 3D synaptic segmentation obtained automatically by EspINA software. This synaptic shape is classified as perforated (with a hole in the middle). O–Q, Clipping from three FIB/SEM images (slices 139, 144, 155), showing an asymmetric “Cleft Ast synapse” (arrowhead). The arrowhead with one asterisk points out one of the synaptic contacts and the arrowhead with two asterisks points out the other synaptic contact from the same synapse. R–T, Same images as in O–Q with segmentation of the synapse (light orange) and the astrocytic processes (red). U, 3D synaptic segmentation obtained automatically by EspINA software. This synaptic shape is classified as fragmented (the smaller fragment corresponds to the synaptic contact pointed out by the arrowheads with one asterisk in O, P, while the larger fragment corresponds to the synaptic contact pointed out by the arrowheads with two asterisks in P, Q). Scale bar shown in T indicates 0.95 μm in A–F, H–M, and O–T.
The 3D segmentation of synaptic junctions includes both the presynaptic density (active zone; AZ) and the PSD. Since the AZ and the PSD are located face to face, their surface areas are very similar (correlation coefficients over 0.97; Schikorski and Stevens 1997, 1999). Thus, they can be simplified to a single surface and represented as the surface of apposition between the AZ and the PSD. This surface can be extracted from the 3D segmented synaptic junction (Morales et al. 2013). For the sake of clarity, we will refer to this surface as the synaptic apposition surface (SAS). EspINA was used to visualize the SAS in 3D and the possible presence of perforations or deep indentations in the perimeter was recorded (Fig. 4; Supplementary Video 1).
Spatial Distribution Analysis of Synapses
To analyze the spatial distribution of synapses, spatial point pattern analysis was performed as described elsewhere (Anton-Sanchez et al. 2014; Merchán-Pérez et al. 2014; Blazquez-Llorca et al. 2015). Briefly, we recorded the spatial coordinates of the centers of gravity or centroids of synaptic junctions. We then calculated the F, G, and K functions to compare the actual position of centroids of synapses with the complete spatial randomness (CSR) model, or homogeneous spatial Poisson point process, where a point is equally probable to occur at any location within a given volume. The G function is the cumulative plot of distances from each point to its nearest neighbor. The F function or empty-space function is the cumulative plot of distances between a regular grid of points and the closest sample points. The K function is given by the number of points within a sphere of increasing radius centered on each sample point (Illian et al. 2008; Gaetan and Guyon 2009). We used R software (https://www.r-project.org/) and the spatstat package (Baddeley and Turner 2005; Baddeley et al. 2015) (http://spatstat.org/) for the calculations.
Statistical Analysis
To determine possible differences between the sizes of the astrocyte arbors of cells injected in coronal or horizontal slices, we carried out t-Student or U-Mann–Whitney tests depending on compliance with the normality criteria. To determine possible differences of astrocytic arbors between different P14 rats and possible differences in synaptic density between different types of classified synapses, statistical comparisons were carried out using the ANOVA test (the normality and homoscedasticity criteria were met) and statistical comparisons of synaptic proportions were carried out using the Chi-squared test. Frequency distribution analysis of the SAS was performed using Kolmogorov-Smirnov (KS) nonparametric test. Statistical studies were performed with the aid of SPSS program (IBM SPSS Statistics v22, IBM Corp., USA) and Statistica (TIBCO Statistica, USA). Unless otherwise stated, data are provided as mean ± standard deviation (SD).
Results
Astrocyte Arbor
We analyzed the arbor size (2D surface area and the Feret diameter of the arbor) in 40 LY-injected astrocytes of layer IV in S1HL. Of these, 23 cells (from four P14 rats) were sampled from coronal sections and 17 (from three P14 rats) were sampled from horizontal sections in order to check possible orientation differences. The mean arbor area was 2010 ± 131 μm2 and the mean arbor Feret diameter was 63 ± 2 μm. We did not observe statistical differences in the size of the astrocyte arbor between coronal and horizontal slices (mean coronal arbor area = 1915 ± 498 μm2 and mean horizontal arbor area = 2163 ± 591 μm2; mean coronal Feret diameter = 60 ± 9 μm and mean horizontal Feret diameter = 66 ± 10 μm). Thus, the arbors of astrocytes seem to be nearly spherical (Fig. 1 and Supplementary Table 1).
Relationship of Synapses with Labeled Astrocytic Processes
Synaptic Density and Proportions
We analyzed synapses in regions within the arbor of two Alexa 594-injected and photoconverted astrocytes located in layer IV of the developing rat S1HL in coronal slices. The analysis was performed completely within the arbor of the injected astrocytes, thus excluding the presence of processes of other noninjected neighboring astrocytes (Fig. 2). We analyzed four FIB/SEM stacks (two stacks in each of the two injected cells) with a total volume of 3936.34 μm3 and a total number of 2993 synapses (2807 asymmetric and 186 symmetric) (see Supplementary Table 2 for detailed numbers per sample). Thus, asymmetric synapses corresponded to 93.8% (91.4–94.5%, minimum and maximum values of the four samples) of total synapses, while symmetric synapses represented 6.2% (5.5–8.1%, minimum and maximum values of the four samples) of total synapses. The mean volume fraction of tissue occupied by the photoconverted astrocyte was 19.2% including the soma and processes and 12.2% when the soma was excluded from the calculation (Supplementary Table 3).
Both asymmetric and symmetric synapses were visualized in 3D and classified according to their contacts with the photoconverted astrocyte. We established three categories:
Synapses whose synaptic clefts were in contact with the labeled astrocytic processes (orange colored in figures; light orange for asymmetric synapses and dark orange for symmetric synapses). For simplicity, we will refer to them as “Cleft Ast” (Figs 5 and 6 and Supplementary Videos 2 and 3; see also Figure 10).
Synapses whose presynaptic and/or postsynaptic terminals were in contact with the labeled astrocytic process but not in contact with their synaptic clefts (blue colored in figures; light blue in asymmetric synapses and dark blue in symmetric synapses). We will refer to them as “Pre/Post Ast” (Figs 5 and 6 and Supplementary Videos 2 and 3; see also Figure 10).
Synapses that have no adjacent astrocytic processes (purple colored in figures; light purple in asymmetric synapses and dark purple in symmetric synapses). We will refer to them as “Free Ast” (Supplementary Video 2; see also Figure 10).
Figure 5.
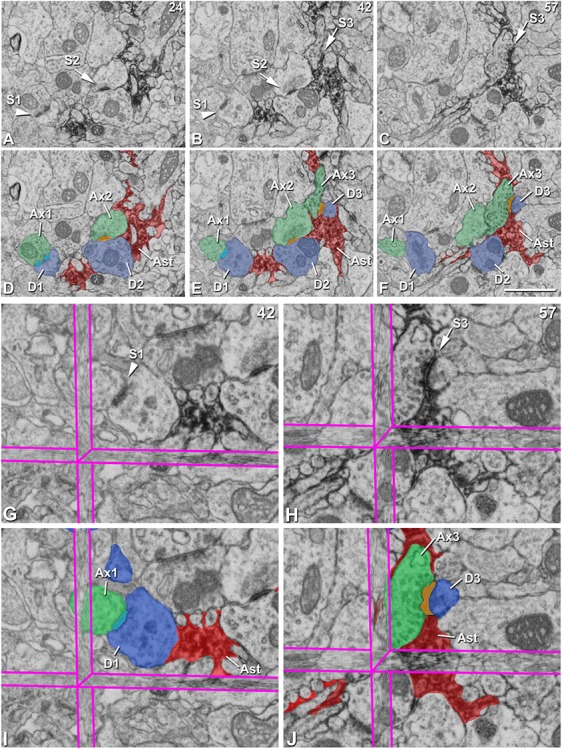
Classification of synapses according to their contacts with the labeled astrocytic processes. A–C, Clipping from three FIB/SEM images (slices 24, 42, and 57; x, y dimensions) showing an asymmetric “Pre/Post Ast synapse” (S1, arrowhead) and two asymmetric “Cleft Ast synapses” (S2 and S3, arrows). D–F, Same images as in A–C showing the following segmented structures: synapse S1 (light blue), synapses S2 and S3 (light orange), axonal buttons from synapses S1 (Ax1), S2 (Ax2), and S3 (Ax3) (green), postsynaptic dendritic elements from synapses S1 (D1, spine head), S2 (D2, dendritic shaft), and S3 (D3, spine head) (blue), and astrocytic processes (Ast, red). Note that in synapse S1, the astrocytic processes are in contact with the postsynaptic element (D1), while in synapses S2 and S3, the astrocytic processes contact their synaptic cleft. G–H, Synapses S1 (G) and S3 (H) at higher magnification visualized in the 3D View from EspINA software with the three orthogonal planes. I–J, Same images as in G–H showing the following segmented structures in I: synapse S1 (light blue), axonal button from synapse S1 (Ax1), postsynaptic dendritic spine from synapse S1 (D1) and astrocytic processes (Ast, red). The following segmented structures are shown in J: synapse S3 (light orange), axonal button from synapses S3 (Ax3), postsynaptic dendritic spine from synapse S3 (D3) and astrocytic processes (Ast, red). The 3D reconstruction of all segmented structures can be found in Figure 6. Scale bar shown in F indicates 1.41 μm in A–F.
Figure 6.
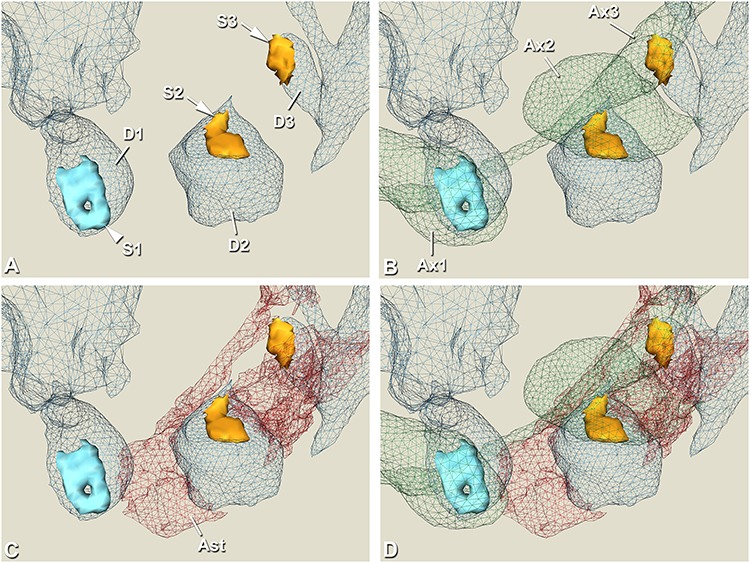
3D reconstruction to illustrate synapses classified according to their contacts with the labeled astrocytic processes. A, 3D reconstruction of the asymmetric “Pre/Post Ast synapse” (S1, light blue, arrowhead) and two asymmetric “Cleft Ast synapses” (S2 and S3, light orange, arrows) segmented in Figure 5. Their respective postsynaptic elements are also shown (D1, D2, and D3 in blue; D1 and D3 refer to a spine head, D2 is a dendritic shaft). B, In addition to the synapses and the postsynaptic elements, their respective presynaptic axonal buttons are also shown (Ax1, Ax2, and Ax3 in green). C, In addition to the synapses and the postsynaptic elements, the surrounding astrocytic processes (Ast in red) are shown. Note that in the case of synapse S1, only part of the head of the dendritic spine is in contact with the astrocytic processes, while in the case of synapses S2 and S3, the astrocytic processes are in contact with the segmented synaptic junction. D, 3D reconstruction of all segmented structures (Fig. 5) is shown (synapses; presynaptic and postsynaptic elements; and astrocytic processes). See Supplementary Video 3 for a video of the 3D reconstruction.
Figure 10.
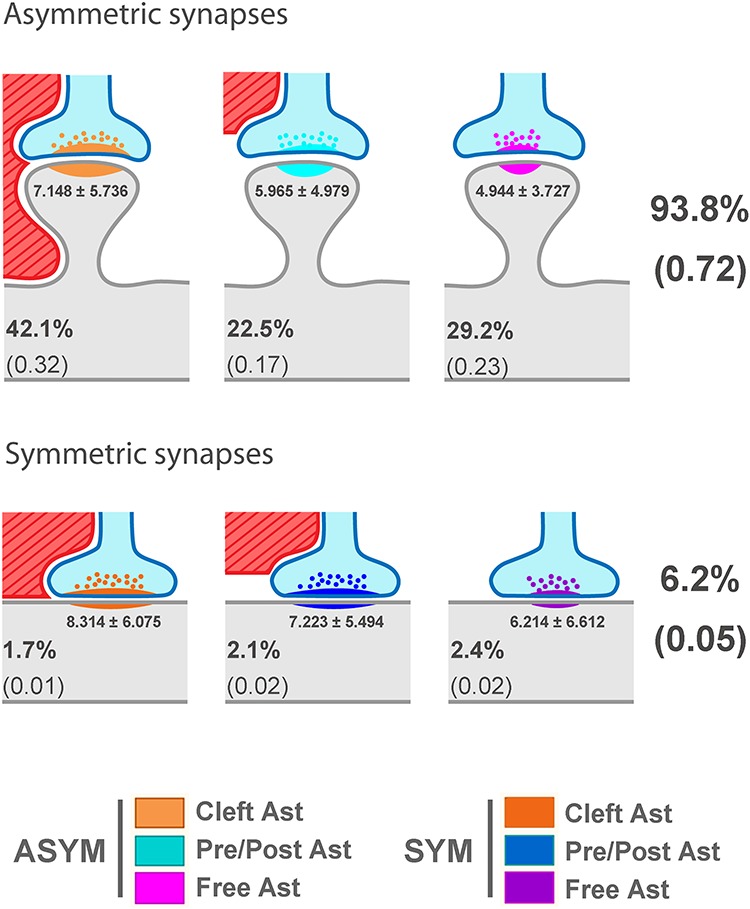
Schematic representation of the distribution of asymmetric synapses and symmetric synapses according to their contact with astrocytic processes. Asymmetric and symmetric synapses have been represented based on their contact with astrocytic processes (red element with diagonal lines). The axon terminal is represented in blue with the postsynaptic element in gray. In the case of the “Pre/Post Ast synapses,” as an example, the astrocytic process has been represented in contact with the presynaptic terminal. Asymmetric synapses have been represented on the head of the spine and symmetric synapses on the dendritic shaft as these locations are their most probable postsynaptic targets (Santuy et al. 2018b). Percentages represent the average of the four samples examined (total number of synapses: 2993). Values in brackets represent the average density of each type of synapse in synapses per μm3. The number below the PSD represents the mean ± SD (×10 000) in nm2 of the SAS area of each type of synaptic contact (Figs 7 and 8 for statistical comparisons).
When synapses were classified according to their contacts with the labeled astrocytic processes, the synapse density of each type was estimated per sample and as an average (Supplementary Table 2 and Fig. 7A,B). We found that the density of asymmetric “Cleft Ast synapses” (0.32 ± 0.06 asymmetric synapses/μm3) was significantly higher than the density of asymmetric “Pre/Post Ast synapses” (0.17 ± 0.03 asymmetric synapses/μm3). In addition, the density of asymmetric “Cleft Ast synapses” was higher than the density of asymmetric “Free Ast synapses” (0.23 ± 0.05 asymmetric synapses/μm3), although this difference was not statistically significant (t9 = 2.802, P = 0.062). Thus, a large number of synapses had no contact with astrocytic processes. No differences were found in the density of symmetric synapses classified according to their contacts with the labeled astrocytic processes.
Figure 7.
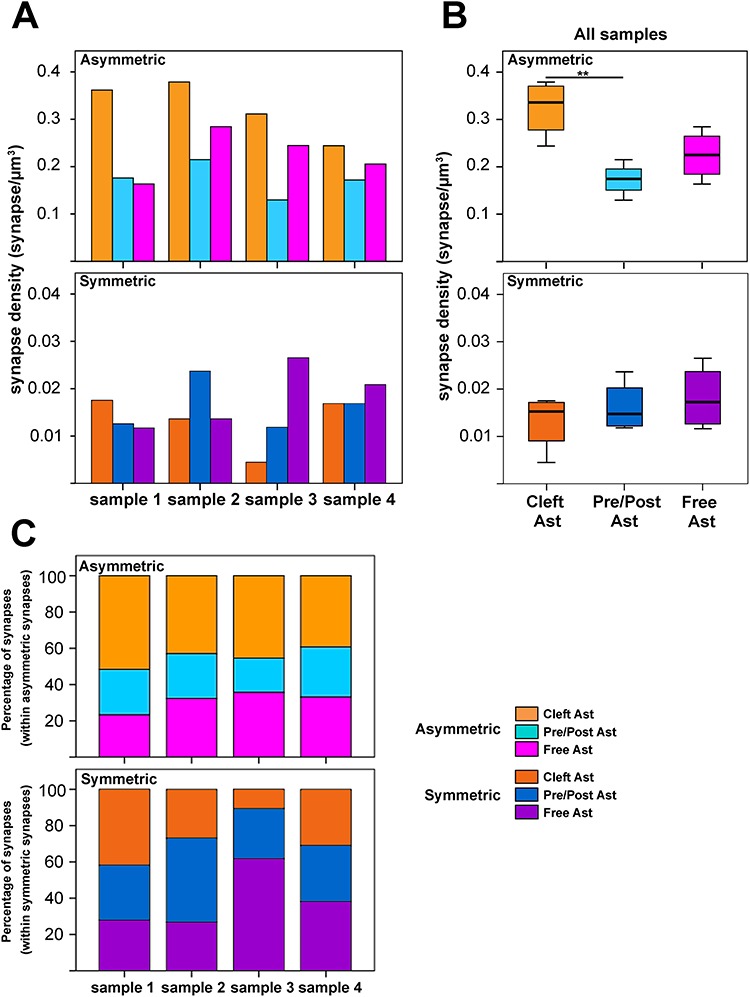
Asymmetric and symmetric synaptic density and percentage of synapses classified according to their contacts with the labeled astrocytic compartments. A, Graphs showing asymmetric (upper part of panel A) and symmetric (lower part of panel A) synapse density (synapses/μm3) classified based on the 3D contact with the labeled astrocytic compartments (see legend and text for further details) per sample. B, Box plot showing average asymmetric (upper part of panel B) and symmetric (lower part of panel B) synapse density (synapses/μm3) classified according to the 3D contact with the labeled astrocytic compartments (see legend and text for further details). C, Graphs showing percentage of synapses within asymmetric synapses (upper part of panel C) and within symmetric synapses (lower part of panel C) classified according to the 3D contact with the labeled astrocytic compartments (see legend and text for further details) per sample. Note the difference in the scale of the y-axis between asymmetric (top) and symmetric synapses (bottom) in panels A and B. Also see Supplementary Table 2 for detailed data and statistical comparisons. **P < 0.01.
Furthermore, we observed differences between the percentages of the three categories of asymmetric synapses: 45% “Cleft Ast”, 24% “Pre/Post Ast,” and 31% “Free Ast.” These differences were statistically significant (χ2 test, P < 0.001). However, no statistically significant differences were found in the case of symmetric synapses (χ2 test, P = 0.117): 27% “Cleft Ast”, 34% “Pre/Post Ast,” and 39% “Free Ast” (see Supplementary Table 2 and Fig. 7C for detailed information for each sample).
Moreover, we observed that, within the population of synapses with the pre- and/or post-synaptic elements in contact with astrocytic processes, the proportion of synapses that had only the presynaptic (38%), only the postsynaptic (46%) or both the pre- and the post-synaptic (16%) elements in contact with astrocytic processes were not homogenously distributed for asymmetric synapses (χ2 test, P < 0.001). However, no statistically significant difference was observed within the population of symmetric synapses (χ2 test, P = 0.199) (Supplementary Table 4).
We also studied the number of synapses that were in contact with the soma of the labeled astrocyte or with their processes. We observed that the most of synapses were in contact with astrocytic processes (between 97 and 100%), but almost none with the astrocytic soma (Supplementary Table 5).
SAS Area
Synaptic morphological analysis was performed by analyzing the SAS from each synapse. The SAS is extracted from the 3D segmentation of synaptic junctions and corresponds to the interface between the PSD and the active zone (see Methods). We analyzed the SAS area distribution of asymmetric and symmetric synapses classified according to their 3D contact with labeled astrocytic processes. Values of the SAS area fitted to a log-normal distribution in all cases (Fig. 8, Supplementary Fig. 2, Supplementary Table 6).
Figure 8.
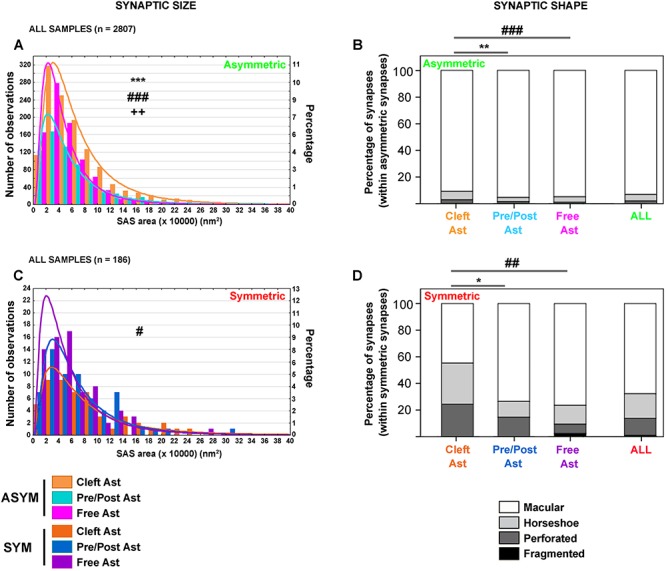
Synaptic size and shape of synapses classified according to their contacts with labeled astrocytic compartments. A, Frequency distribution histogram of SAS areas of asymmetric synapses classified according to their 3D contact with the labeled astrocytic compartments in all samples. Larger SAS areas were more frequently found within the population of asymmetric “Cleft Ast synapses” when compared with “Pre/Post Ast synapses” (KS, P = 0.000, ***) and “Free Ast synapses” (KS, P = 0.000, ###). Larger SAS areas were also more frequently found within the population of “Pre/Post Ast synapses” when compared with “Free Ast synapses” (KS, P = 0.003, ++). B, Proportion of macular (white), horseshoe (light gray), perforated (dark gray) and fragmented (black) asymmetric synapses classified according to their 3D contact with the labeled astrocytic processes and for all asymmetric synapses. “Cleft Ast synapses” had a higher proportion of synapses showing more complex shapes—horseshoe, perforated, and fragmented—when compared with “Pre/Post Ast” and “Free Ast synapses” (χ2, P = 0.002, ** and P = 0.001, ### respectively). C, Frequency distribution histogram of SAS areas of symmetric synapses classified according to their 3D contact with the labeled astrocytic compartments in all samples. Larger SAS areas were most frequently found within the population of symmetric “Cleft Ast synapses” when compared with “Free Ast synapses” (KS, P = 0.016, #). D, Proportion of macular (white), horseshoe (light gray), perforated (dark gray), and fragmented (black) symmetric synapses classified according to their 3D contact with the labeled astrocytic compartments and for all symmetric synapses. “Cleft Ast synapses” had a higher proportion of synapses showing more complex shapes—horseshoe, perforated, and fragmented—when compared with “Pre/Post Ast” and “Free Ast synapses” (χ2, P = 0.018, * and P = 0.006, ## respectively). In A, C, the log-normal function for each category has been represented. The x-axis bin = 2 (×10 000) nm2. See text and Supplementary Tables 6–8 for further details.
Asymmetric synapses: Larger SAS areas were more frequently found within the population of “Cleft Ast synapses” when compared with “Pre/Post Ast synapses” (KS, P < 0.001) and compared with “Free Ast synapses” (KS, P < 0.001). Furthermore, larger SAS areas were less frequently found within the population of “Free Ast synapses” when compared with “Pre/Post Ast synapses” (KS, P < 0.005) (Fig. 8A and Supplementary Table 6).
Symmetric synapses: Larger SAS areas were more frequently found within the population of symmetric “Cleft Ast synapses” when compared with “Free Ast synapses” (KS, P = 0.016) (Fig. 8C and Supplementary Table 6).
Synaptic Shape
Since it had been previously found that larger synapses tend to have more complex morphologies (horseshoe, perforated, and fragmented; Santuy et al. 2018a), we evaluated if synapses classified according to their contact with labeled astrocytic processes presented different proportions of synaptic shapes. EspINA was used to visualize the SAS in 3D and the possible presence of perforations or deep indentations in the perimeter were recorded. Synapses were classified into four categories: macular (without deep indentations, mostly round), horseshoe (with deep indentations), perforated (with perforations), and fragmented (same presynaptic element establishing two or more contacts—spatially separated—with the same postsynaptic element) (Fig. 4). We found a significantly higher proportion of synapses with more complex shapes (horseshoe, perforated, and fragmented) within the population of asymmetric and symmetric “Cleft Ast synapses” (around 5% higher for asymmetric synapses and 30% for symmetric synapses) in layer IV of the developing rat S1HL (Fig. 8B,D and Supplementary Tables 7 and 8).
In the case of asymmetric synapses, 90.1% of “Cleft Ast synapses” had a macular shape and the remaining 9.9% were horseshoe, perforated or fragmented, while—in the case of “Pre/Post Ast synapses”— these percentages were 95.3% and 4.7%, respectively, and for “Free Ast synapses”, 94.9% and 5.1%, respectively.
In the case of symmetric synapses, 44.6% of “Cleft Ast synapses” had a macular shape and the remaining 55.4% were horseshoe, perforated or fragmented, while—in the case of “Pre/Post Ast synapses”—these percentages were 73.5% and 26.5%, respectively, and for “Free Ast synapses,” 76.4% and 23.6%, respectively.
Synaptic Spatial Distribution
The analysis of the spatial distribution of synapses was performed for all synapses (asymmetric and symmetric synapses together) and also for asymmetric synapses alone. Symmetric synapses were not analyzed separately because their numbers were too low to perform such an analysis. To analyze the spatial distribution of synapses, we compared the actual position of the centers of gravity or centroids of synaptic junctions with the CSR model. This study was carried out using six samples of centroids obtained from the corresponding stacks of serial sections (see Material and Methods section). A sample was considered to be compatible with the CSR model when the observed F, G, and K functions lay within the envelope generated by 99 simulations of the CSR model (Fig. 9,Supplementary Table 9, Supplementary Figs 3–6).
Figure 9.
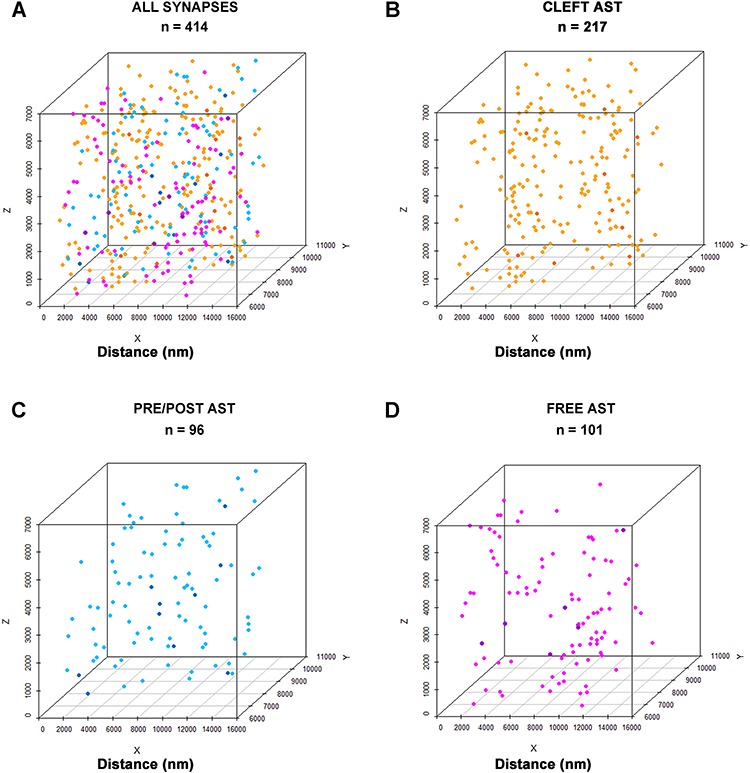
Example of the analysis of the 3D spatial distribution of synapses. In this example, all synapses present in sample 1.1 were analyzed together (ALL SYNAPSES; A) and then separated into three groups according to their relationship with astrocytic processes: “Cleft Ast synapses” (CLEFT AST, B), “Pre/Post Ast synapses,” (PRE/POST AST, C) and “Free Ast synapses” (FREE AST, D). For each group of synapses, we recorded the spatial positions of the centers of gravity or centroids of synaptic junctions, as represented in the 3D scatter plots. In this particular sample, there were 414 synapses, 217 of which were CLEFT AST (orange), 96 PRE/POST AST (blue), and 101 FREE AST (magenta). Three spatial statistical functions (F, G, and K) were calculated for each group of synapses (see the corresponding spatial statistics analysis in Supplementary Figs 3–6). The spatial distributions of ALL SYNAPSES, CLEFT AST, and PRE/POST AST were nearly random, while the spatial distribution of FREE AST was clustered.
We obtained very similar results when all synapses were pooled together (asymmetric and symmetric) and when only asymmetric synapses were analyzed, given that AS clearly outnumbered SS. Our results indicate that the spatial organization of synapses in the neuropil of layer IV of S1HL in P14 rats is nearly random, since only slight deviations from the CSR model were found (Fig. 9). When we analyzed the different groups of synapses according to their contacts with astrocytic processes, we also found only slight deviations from randomness in the spatial distributions of “Cleft Ast” and “Pre/Post Ast synapses.” However, the distribution of “Free Ast synapses” was clearly nonrandom, since at least two of the functions (mainly G and K) were clearly incompatible with the CSR model in all samples. In this case, the spatial distribution corresponded to a clustered pattern, since nearest neighbors were closer than expected by chance (as indicated by the G function) and local densities of points were also higher than expected (as indicated by the K function) (Fig. 9 and Supplementary Figs 3–6).
Discussion
We can draw three main conclusions from our study (Fig. 10): (i) A large number of synapses (32%) had no contact with astrocytic processes. The remaining synapses (68%) were in contact with astrocytic processes, either at the level of the synaptic cleft (44%) or with the pre- and/or post-synaptic elements (24%); (ii) regarding synaptic morphology, larger synapses with more complex shapes were most frequently found within the population that had the synaptic cleft in contact with astrocytic processes; and (iii) although synapses were observed to be randomly distributed in space, synapses that were free of astrocytic processes tended to form clusters.
Spatial Relationship Between Synapses and Astrocytic Processes
Synaptic Density and Proportions
Numerous studies have shown that individual astrocytes occupy distinct territories with their cellular processes exhibiting a minimal overlap, which is estimated to be only around 5% with the cellular processes of neighboring astrocytes across different brain regions and species (Bushong et al. 2002; Ogata and Kosaka 2002; Halassa et al. 2007; Jinno et al. 2007; Sofroniew and Vinters 2010; Khakh and Sofroniew 2015; Nimmerjahn and Bergles 2015). We estimated that astrocytes located in layer IV had a mean cell arbor area of 2010 ± 131 μm2 and a mean cell arbor Feret diameter of 63 ± 2 μm. These data are similar to data published in previous studies (Ogata and Kosaka 2002; Medvedev et al. 2014; Lanjakornsiripan et al. 2018). However, astrocyte cell arbor size differences have been described in different cortical regions and species (Bushong et al. 2002, 2004; Halassa et al. 2007; Oberheim et al. 2012). In addition, one astrocyte can influence thousands of synapses inside their occupancy area (Bushong et al. 2002; Sofroniew and Vinters 2010; Khakh and Sofroniew 2015). In our work, we estimated that the mean density of synapses within astrocytic arbors is 0.77 synapses/μm3 (0.72 asymmetric synapses/μm3 and 0.05 symmetric synapses/μm3). Considering that the astrocytes analyzed in the present study have an estimated spherical cell arbor of approximately 68 000 μm3 (based on the area measurements), then it follows that there are more than 52 000 synapses within the arbor of a typical astrocyte in layer IV of S1HL. Numbers in other cortical layers or regions probably vary according to the local density of synapses and volume of astrocytic cell arbors (Papouin et al. 2017).
We observed that many asymmetric (excitatory) synapses (31%) had no contact with astrocytic processes. The remaining asymmetric synapses (69%) made contact with astrocytic processes, including the synaptic cleft (45%) as well as the pre- and/or post-synaptic elements (24%). With regard to symmetric (inhibitory) synapses, we observed that in 27% of the cases, astrocytes were in contact at the level of the synaptic clefts, whereas 34% were in contact with the pre- or post-synaptic elements and a large number of synapses (39%) were also free of astrocytic processes (Fig. 10). Nevertheless, data regarding symmetric synapses should be regarded with caution since relatively few symmetric synapses were analyzed (n = 186). However, the total number of asymmetric synapses examined was large enough to provide a more accurate indication of their relationship with the astrocyte cell arbors (n = 2807).
It has been reported that the numbers of synapses in contact with astrocytic processes vary greatly between regions, species, and tissue preparation methods based on previous electrophysiological (Perea and Araque 2007) and anatomical studies of the cortex (Ventura and Harris 1999; Witcher et al. 2007, 2010; Lushnikova et al. 2009; Medvedev et al. 2014; Bernardinelli et al. 2014a, 2014b; Rollenhagen et al. 2015, 2018). It is estimated that in 68–90% of synapses, the synaptic cleft is in contact with astrocytes in layer IV and Vb of the rodent somatosensory cortex (Bernardinelli et al. 2014a; Rollenhagen et al. 2015, 2018) and that this percentage is 40–85% in the stratum radiatum of the CA1 of the rat hippocampus (Ventura and Harris 1999; Witcher et al. 2007; Lushnikova et al. 2009). Astroglial contacts have been reported to occur mainly with postsynaptic elements (e.g., the dendritic spine) (Lehre and Rusakov 2002; Reichenbach et al. 2010; Bernardinelli et al. 2014b), with the exception of the CA3 field of the hippocampus. It has been reported that mossy fiber synapses in CA3 are entirely engulfed by extensive astrocytic ensheathment, but fine glial processes never reach the active zones (Rollenhagen et al. 2007) (Supplementary Table 10). In our study, we did not find significant differences between the percentage of asymmetric synapses with their presynaptic terminals in contact with astrocytic elements (38%) and the percentage of asymmetric synapses with their postsynaptic terminals in contact with astrocytic elements (46%).
Size and Shape of Synapses
Our data showed different distributions of synaptic sizes depending on whether or not they were in contact with astrocytic processes (Fig. 10). Larger synapses were more frequently found within the population of “Cleft Ast synapses”. The average size (SAS area) of asymmetric “Cleft Ast synapses” was approximately 1.45 fold larger compared with “Free Ast synapses” (AS SAS area Cleft Ast/AS SAS area Free Ast; see Supplementary Table 6). Similarly, the average size (SAS area) of symmetric “Cleft Ast synapses” was approximately 1.38-fold larger, as compared with “Free Ast synapses” (SS SAS area Cleft Ast/SS SAS area Free Ast; see Supplementary Table 6). These data are in agreement with previous studies carried out in the CA1 of the hippocampus of rats (P65–P75) (1.53-fold larger; Witcher et al. 2007). However, these data contrasted with the study of Medvedev et al. (2014), which reported that smaller postsynaptic densities were more tightly surrounded by glia in the molecular layer of the rat (8-week-old) dentate gyrus. Nevertheless, it is important to keep in mind that comparisons between different studies are difficult to interpret due to the different methodologies, species, brain regions, and ages involved. Thus, further detailed studies should be performed in different brain regions and species to determine the variations in the size and proportion of synapses in contact with astrocytic processes.
Regarding synaptic shape, we found a higher percentage of synapses with more complex shapes (i.e., horseshoe, perforated, and fragmented) within the population of asymmetric and symmetric “Cleft Ast synapses” (around 5% higher for asymmetric synapses and 30% higher for symmetric synapses). A previous study in the CA1 of the hippocampus (Ventura and Harris 1999) reported that astrocytes made contact more frequently with perforated synapses (88%) than macular synapses (52%). It has been described in the developing rat somatosensory cortex that larger synapses are more frequently associated with complex PSD morphologies such as perforated or horseshoe synapses (Santuy et al. 2018a). Whether synapses with more complex shapes and synapses with a macular shape belong to different populations of synapses or a given synapse can have different shapes due to dynamic and nonpermanent changes—for example, molecular turnover of the constituents of the PSD—remains unknown (Santuy et al. 2018a). However, it has been shown in the hippocampus that the relative proportions of horseshoe, perforated, and fragmented or partitioned synapses do change after the induction of long-term potentiation (Geinisman et al. 1993; Toni et al. 2001).
3D Distribution of Synapses
Our analysis indicates that the spatial organization of synapses corresponds to a nearly random distribution, as previously described (Anton-Sanchez et al. 2014; Merchán-Pérez et al. 2014). We observed a quasi-random distribution also for “Cleft Ast synapses” and “Pre/Post Ast synapses,” but a clustering distribution tendency for “Free Ast synapses.” These synapses seemed to be distributed in between the spaces left by the astrocytic processes (that we estimated to occupy 12% of the volume of the neuropil). Thus, astrocytic processes in a nonoverlapping astrocytic region seem to randomly contact about two-thirds of the synapses within their region of influence, but they leave islands or pockets of synapses that are not in contact with astrocytic processes. Thus, it seems that astrocytes form tripartite synapses within their territorial area in a random manner. The functional significance of this spatial distribution remains to be elucidated.
Functional Implications of Glial Coverage of Layer IV Synapses of the S1HL
In our work, approximately one-third of the synapses are not in contact with astrocytic processes. Thus, it seems that the suggested bidirectional communication between neurons and astrocytes (Bezzi and Volterra 2001; Perea et al. 2009) is not always established at the synaptic level through local contact between astrocytic processes and synapses. We could, therefore, speculate that the concept of “tripartite synapses,” which implies a close spatial relationship between synaptic and astrocytic elements (Volterra and Bezzi 2002; Fellin et al. 2004; Fiacco and McCarthy 2004; Pascual et al. 2005; Perea and Araque 2005; Perea et al. 2009), cannot be applied to all cortical synapses.
Similar to suggestions emerging from previous studies in layers IV and Vb of the rat somatosensory cortex (barrel cortex) (Rollenhagen et al. 2015, 2018), we propose that astrocytes in direct contact with the synaptic cleft may act as physical barriers to neurotransmitter diffusion, thereby preventing spillover of released neurotransmitters by active take-up and removal of glutamate and GABA. These barriers may protect against the effects of neurotransmitter accumulation in the extracellular space and provide glutamine to replenish neurotransmitter pools in glutamatergic and GABAergic neurons (Danbolt 2001; Schousboe et al. 2014). Astrocytes contribute to the ending of synaptic transmission and may thus accelerate the recovery from receptor desensitization (Danbolt 2001; Oliet et al. 2004). These mechanisms allow the precise spatial and temporal regulation of the neurotransmitter concentration in the synaptic cleft (Anderson and Swanson 2000). In addition, whether the expression levels of presynaptic glutamate transporter (DLT1)—which is known to clear glutamate and regulate synaptic function (Veruki et al. 2006)—might differ among the “Cleft Ast”, “Pre/Post Ast,” and “Free Ast” synapses is a possibility that could be investigated. Furthermore, astrocytes release glutamate or GABA (Le Meur et al. 2012; Dallérac et al. 2018; Rollenhagen et al. 2018) through vesicular exocytosis, which can also regulate synaptic transmission through activation of pre- and post-synaptic receptors (Haydon and Carmignoto 2006; Jourdain et al. 2007). In addition, astrocytes are thought to be crucial for the induction and control of spike-time-dependent depression of neocortical synapses (Min and Nevian 2012). Thus, astrocytes may act as a memory buffer for previous coincident neuronal activity and therefore seem to be involved in modulating synaptic transmission and plasticity by temporal and spatial modulation of the glutamate concentration in layer IV synaptic buttons (Rollenhagen et al. 2015, 2018). However, in other cases, we observed that synapses had their presynaptic or postsynaptic element (but not the synaptic cleft) in contact with astrocytic processes. Interestingly, it has been reported that the mossy fiber synapses in CA3 (Rollenhagen et al. 2007) are ensheathed by astrocytes, but their synaptic clefts are not in contact with astrocytic processes, suggesting glutamate spillover—and as a consequence synaptic cross talk—at these synapses, which could promote synchronization of neuronal populations in the CA3 region of the hippocampus (Barbour and Häusser 1997; Rollenhagen et al. 2015, 2018; Dallérac et al. 2018).
All these studies indicate that the relationship between the astrocyte and synapses is complex—and probably even more so given that perisynaptic astrocytic processes are highly plastic (Haber et al. 2006). For example, perisynaptic astrocytic processes are motile structures displaying rapid actin-dependent movements (Lavialle et al. 2011) that may result in variable degrees of pre- and post-synaptic coverage of the synapse (Genoud et al. 2006; Witcher et al. 2007; Lushnikova et al. 2009) in response to increased neuronal activity and plasticity (Oliet 2001; Genoud et al. 2006; Lushnikova et al. 2009; Bernardinelli et al. 2014b; Perez-Alvarez et al. 2014), which triggers Ca2+ elevation in astrocytic processes (Dani et al. 1992; Wang et al. 2006). However, the functional relevance of such an observation remains unclear. One possibility is that sustained synaptic activation triggers an increase in astrocytic process motility, thus providing an adequate time window for glutamate spillover and structural remodeling of the dendritic spine and/or synaptic button. Astrocytic process stabilization with an enhanced coverage would terminate this process and increase the level of synaptic efficacy. Thus, the degree of spine astrocytic coverage seems to be predictive of spine stability (Dallérac et al. 2018).
According to our results, it is plausible that astrocytes might be in direct apposition to a higher proportion of larger and more active synapses from an anatomical and physiological point of view, respectively, since the shape and size of the synaptic junctions are strongly correlated with release probability, synaptic strength, efficacy and plasticity (Nusser et al. 1998; Takumi et al. 1999; Ganeshina et al. 2004; Tarusawa et al. 2009; Holderith et al. 2012; Südhof 2012; Montes et al. 2015; Biederer et al. 2017). Perisynaptic astrocytic processes could play an important structural role as active partners in the regulation of activity-dependent synaptic remodeling and, furthermore, this mechanism may represent an important contribution of astrocytes to learning and memory processes.
Finally, whether the astrocytic synapse coverage is developmentally regulated remains to be further investigated. Interestingly, this synaptic coverage is preferentially associated with large synapses (our own results and Witcher et al. 2007), which are more abundant in adults (Petrak et al. 2005; Harms and Dunaevsky 2007). The most comparable study to ours found that more than 90% of synapses in layer IV of barrel cortex of adult rat were completely surrounded by fine astrocytic processes, in the majority of cases reaching as far as individual AZs, or even the synaptic cleft (Rollenhagen et al. 2015). However, we found that 44% of synapses had their synaptic cleft in contact with astrocytic processes in layer IV of the developing S1HL rat. Apart from regional differences of the somatosensory cortex (barrel cortex vs. S1HL), this observation could suggest that astroglial coverage gradually increases during postnatal development. For example, it has been observed that there is an increase in the number of glutamatergic synapses that are ensheathed by processes from individual developing astroglia from P14 to P26 in motor-sensory cortex of mice, when astroglia undergo dramatic postnatal maturation (Morel et al. 2014). In addition, differences have been observed between cortical regions, for example, astrocytes in the rat medial prefrontal cortex continue to mature from P24 to P70. This ongoing maturation is accompanied by a substantial increase in colocalization of astrocytes with synapses. However, these differences are not observed in the hippocampus, which seems to mature earlier (Testen et al. 2019). Finally, recently it has been shown in the rat that S1HL field potential generators are layer-specific and change during development, which is probably related to the progressive maturation of cortical synaptic connections (Ortuño et al. 2019). Field potentials are mostly generated by a pathway in layer VI (a deep layer) in juvenile animals (P14-P16), whereas other pathways mature later in middle layers (III–V) and take over in adults. Whether these functional characteristics are also related to the proportion of synapses that are in contact with astrocytes is unknown. Further studies should be performed to examine the structural interactions between astrocytes and synapses in the rest of the layers at P14 and in the adult.
Supplementary Material
Funding
The Spanish “Ministerio de Ciencia, Innovación y Universidades” (grant PGC2018-094307-B-I00) and the Cajal Blue Brain Project (the Spanish partner of the Blue Brain Project initiative from EPFL, Switzerland); the European Union Horizon 2020 research and innovation program under Grant agreement No. 785907 (Human Brain Project, SGA2); and Centro de Investigación en Red sobre Enfermedades Neurodegenerativas (CIBERNED, CB06/05/0066, Spain); UNED (Plan de Promoción de la Investigación, 2014-040-UNED-POST).
Notes
We would like to thank Carmen Álvarez, Miriam Marín, and Lorena Valdés for their helpful assistance, and Nick Guthrie for his excellent text editing. The data that support the findings of this study are available from the corresponding author upon reasonable request. Conflict of Interest: The authors declare no conflict of interest.
References
- Anderson CM, Swanson RA. 2000. Astrocyte glutamate transport: review of properties, regulation, and physiological functions. Glia. 32:1–14. [PubMed] [Google Scholar]
- Anton-Sanchez L, Bielza C, Merchán-Pérez A, Rodríguez J-R, DeFelipe J, Larrañaga P. 2014. Three-dimensional distribution of cortical synapses: a replicated point pattern-based analysis. Front Neuroanat. 8:85. [DOI] [PMC free article] [PubMed] [Google Scholar]
- Araque A, Parpura V, Sanzgiri RP, Haydon PG. 1999. Tripartite synapses: glia. the unacknowledged partner. Trends Neurosci. 22:208–215. [DOI] [PubMed] [Google Scholar]
- Arcuino G, Lin JH-C, Takano T, Liu C, Jiang L, Gao Q, Kang J, Nedergaard M. 2002. Intercellular calcium signaling mediated by point-source burst release of ATP. Proc Natl Acad Sci U S A. 99:9840–9845. [DOI] [PMC free article] [PubMed] [Google Scholar]
- Baddeley A, Rubak E, Turner R.. 2015. Spatial point patterns: Methodology and Applications with R. Boca Raton (FL): CRC Press. [Google Scholar]
- Baddeley A, Turner R. 2005. Spatstat: an R package for analyzing spatial point patterns. J Stat Softw. 12. [Google Scholar]
- Ballesteros-Yáñez I, Ambrosio E, Benavides-Piccione R, Pérez J, Torres I, Miguéns M, García-Lecumberri C, DeFelipe J. 2007. The effects of morphine self-administration on cortical pyramidal cell structure in addiction-prone Lewis rats. Cereb Cortex. 17:238–249. [DOI] [PubMed] [Google Scholar]
- Ballesteros-Yáñez I, Benavides-Piccione R, Bourgeois J-P, Changeux J-P, DeFelipe J. 2010. Alterations of cortical pyramidal neurons in mice lacking high-affinity nicotinic receptors. Proc Natl Acad Sci U S A. 107:11567–11572. [DOI] [PMC free article] [PubMed] [Google Scholar]
- Barbour B, Häusser M. 1997. Intersynaptic diffusion of neurotransmitter. Trends Neurosci. 20:377–384. [DOI] [PubMed] [Google Scholar]
- Benavides-Piccione R, Fernaud-Espinosa I, Robles V, Yuste R, DeFelipe J. 2013. Age-based comparison of human dendritic spine structure using complete three-dimensional reconstructions. Cereb Cortex. 23:1798–1810. [DOI] [PMC free article] [PubMed] [Google Scholar]
- Bernardinelli Y, Muller D, Nikonenko I. 2014a. Astrocyte-synapse structural plasticity. Neural Plast. 2014:1–13. [DOI] [PMC free article] [PubMed] [Google Scholar]
- Bernardinelli Y, Randall J, Janett E, Nikonenko I, König S, Jones EV, Flores CE, Murai KK, Bochet CG, Holtmaat A et al. 2014b. Activity-dependent structural plasticity of perisynaptic astrocytic domains promotes excitatory synapse stability. Curr Biol. 24:1679–1688. [DOI] [PubMed] [Google Scholar]
- Bezzi P, Volterra A. 2001. A neuron-glia signalling network in the active brain. Curr Opin Neurobiol. 11:387–394. [DOI] [PubMed] [Google Scholar]
- Biederer T, Kaeser PS, Blanpied TA. 2017. Transcellular nanoalignment of synaptic function. Neuron. 96:680–696. [DOI] [PMC free article] [PubMed] [Google Scholar]
- Blazquez-Llorca L, Woodruff A, Inan M, Anderson SA, Yuste R, DeFelipe J, Merchan-Perez A. 2015. Spatial distribution of neurons innervated by chandelier cells. Brain Struct Funct. 220:2817–2834. [DOI] [PMC free article] [PubMed] [Google Scholar]
- Broskey NT, Daraspe J, Humbel BM, Amati F. 2013. Skeletal muscle mitochondrial and lipid droplet content assessed with standardized grid sizes for stereology. J Appl Physiol. 115:765–770. [DOI] [PubMed] [Google Scholar]
- Bruno RM, Sakmann B. 2006. Cortex is driven by weak but synchronously active thalamocortical synapses. Science. 312:1622–1627. [DOI] [PubMed] [Google Scholar]
- Buhl EH, Lübke JHR. 1989. Intracellular Lucifer yellow injection in fixed brain slices combined with retrograde tracing, light and electron microscopy. Neuroscience. 28:3–16. [DOI] [PubMed] [Google Scholar]
- Bushong EA, Martone ME, Ellisman MH. 2004. Maturation of astrocyte morphology and the establishment of astrocyte domains during postnatal hippocampal development. Int J Dev Neurosci. 22:73–86. [DOI] [PubMed] [Google Scholar]
- Bushong EA, Martone ME, Jones YZ, Ellisman MH. 2002. Protoplasmic astrocytes in CA1 stratum radiatum occupy separate anatomical domains. J Neurosci. 22:183–192. [DOI] [PMC free article] [PubMed] [Google Scholar]
- Chapin JK, Lin CS. 1984. Mapping the body representation in the SI cortex of anesthetized and awake rats. J Comp Neurol. 229:199–213. [DOI] [PubMed] [Google Scholar]
- Clarke LE, Barres BA. 2013. Emerging roles of astrocytes in neural circuit development. Nat Rev Neurosci. 14:311–321. [DOI] [PMC free article] [PubMed] [Google Scholar]
- Dallérac G, Zapata J, Rouach N. 2018. Versatile control of synaptic circuits by astrocytes: where, when and how? Nat Rev Neurosci. 19:729–743. [DOI] [PubMed] [Google Scholar]
- Danbolt NC. 2001. Glutamate uptake. Prog Neurobiol. 65:1–105. [DOI] [PubMed] [Google Scholar]
- Dani JW, Chernjavsky A, Smith SJ. 1992. Neuronal activity triggers calcium waves in hippocampal astrocyte networks. Neuron. 8:429–440. [DOI] [PubMed] [Google Scholar]
- DeFelipe J, Fairén A. 1993. A simple and reliable method for correlative light and electron microscopic studies. J Histochem Cytochem. 41:769–772. [DOI] [PubMed] [Google Scholar]
- Denk W, Horstmann H. 2004. Serial block-face scanning electron microscopy to reconstruct three-dimensional tissue nanostructure. PLoS Biol. 2:e329. [DOI] [PMC free article] [PubMed] [Google Scholar]
- Elston GN, Rosa MG. 1997. The occipitoparietal pathway of the macaque monkey: comparison of pyramidal cell morphology in layer III of functionally related cortical visual areas. Cereb Cortex. 7:432–452. [DOI] [PubMed] [Google Scholar]
- Fellin T, Pascual O, Gobbo S, Pozzan T, Haydon PG, Carmignoto G. 2004. Neuronal synchrony mediated by astrocytic glutamate through activation of extrasynaptic NMDA receptors. Neuron. 43:729–743. [DOI] [PubMed] [Google Scholar]
- Fiacco TA, McCarthy KD. 2004. Intracellular astrocyte calcium waves in situ increase the frequency of spontaneous AMPA receptor currents in CA1 pyramidal neurons. J Neurosci. 24:722–732. [DOI] [PMC free article] [PubMed] [Google Scholar]
- Franklin KBJ, Paxinos G. 1997. The Mouse Brain in Stereotaxic Coordinates. San Diego: Academic Press. [Google Scholar]
- Gaetan C, Guyon X. 2009. Spatial Statistics and Modeling. New York, USA: Springer-Verlag. [Google Scholar]
- Ganeshina O, Berry RW, Petralia RS, Nicholson DA, Geinisman Y. 2004. Differences in the expression of AMPA and NMDA receptors between axospinous perforated and nonperforated synapses are related to the configuration and size of postsynaptic densities. J Comp Neurol. 468:86–95. [DOI] [PubMed] [Google Scholar]
- Geinisman Y, Detoledo-Morrell L, Morrell F, Heller RE, Rossi M, Parshall RF. 1993. Structural synaptic correlate of long-term potentiation: formation of axospinous synapses with multiple, completely partitioned transmission zones. Hippocampus. 3:435–445. [DOI] [PubMed] [Google Scholar]
- Genoud C, Quairiaux C, Steiner P, Hirling H, Welker E, Knott GW. 2006. Plasticity of astrocytic coverage and glutamate transporter expression in adult mouse cortex. PLoS Biol. 4:e343. [DOI] [PMC free article] [PubMed] [Google Scholar]
- Gray EG. 1959. Electron microscopy of synaptic contacts on dendrite spines of the cerebral cortex. Nature. 183:1592–1593. [DOI] [PubMed] [Google Scholar]
- Gundersen HJG, Bagger P, Bendtsen TF, Evans SM, Korbo L, Marcussen N, MØLler A, Nielsen K, Nyengaard JR, Pakkenberg B et al. 1988. The new stereological tools: Disector, fractionator, nucleator and point sampled intercepts and their use in pathological research and diagnosis. APMIS. 96:857–881. [DOI] [PubMed] [Google Scholar]
- Haber M, Zhou L, Murai KK. 2006. Cooperative astrocyte and dendritic spine dynamics at hippocampal excitatory synapses. J Neurosci. 26:8881–8891. [DOI] [PMC free article] [PubMed] [Google Scholar]
- Halassa MM, Fellin T, Takano H, Dong J-H, Haydon PG. 2007. Synaptic islands defined by the territory of a single astrocyte. J Neurosci. 27:6473–6477. [DOI] [PMC free article] [PubMed] [Google Scholar]
- Harms KJ, Dunaevsky A. 2007. Dendritic spine plasticity: looking beyond development. Brain Res. 1184:65–71. [DOI] [PubMed] [Google Scholar]
- Haydon PG, Carmignoto G. 2006. Astrocyte control of synaptic transmission and neurovascular coupling. Physiol Rev. 86:1009–1031. [DOI] [PubMed] [Google Scholar]
- Helmstaedter M. 2013. Cellular-resolution connectomics: challenges of dense neural circuit reconstruction. Nat Methods. 10:501–507. [DOI] [PubMed] [Google Scholar]
- Holderith N, Lorincz A, Katona G, Rózsa B, Kulik A, Watanabe M, Nusser Z. 2012. Release probability of hippocampal glutamatergic terminals scales with the size of the active zone. Nat Neurosci. 15:988–997. [DOI] [PMC free article] [PubMed] [Google Scholar]
- Howard V, Reed M. 2005. Unbiased Stereology: Three-Dimensional Measurement in Microscopy. New York (USA): Garland Science. [Google Scholar]
- Illian J, Penttinen A, Stroyan H, Stroyan D. 2008. Statistical Analysis and Modelling of Spatial Point Patterns. Hoboken, NJ: John Wiley & Sons Ltd. [Google Scholar]
- Jain N, Diener PS, Coq JO, Kaas JH. 2003. Patterned activity via spinal dorsal quadrant inputs is necessary for the formation of organized somatosensory maps. J Neurosci Off J Soc Neurosci. 23:10321–10330. [DOI] [PMC free article] [PubMed] [Google Scholar]
- Jinno S, Fleischer F, Eckel S, Schmidt V, Kosaka T. 2007. Spatial arrangement of microglia in the mouse hippocampus: a stereological study in comparison with astrocytes. Glia. 55:1334–1347. [DOI] [PubMed] [Google Scholar]
- Jourdain P, Bergersen LH, Bhaukaurally K, Bezzi P, Santello M, Domercq M, Matute C, Tonello F, Gundersen V, Volterra A. 2007. Glutamate exocytosis from astrocytes controls synaptic strength. Nat Neurosci. 10:331–339. [DOI] [PubMed] [Google Scholar]
- Kettenmann H, Verkhratsky A. 2008. Neuroglia: the 150 years after. Trends Neurosci. 31:653–659. [DOI] [PubMed] [Google Scholar]
- Khakh BS, Sofroniew MV. 2015. Diversity of astrocyte functions and phenotypes in neural circuits. Nat Neurosci. 18:942–952. [DOI] [PMC free article] [PubMed] [Google Scholar]
- Knott G, Marchman H, Wall D, Lich B. 2008. Serial section scanning electron microscopy of adult brain tissue using focused ion beam milling. J Neurosci. 28:2959–2964. [DOI] [PMC free article] [PubMed] [Google Scholar]
- Kubota Y, Sohn J, Kawaguchi Y. 2018. Large volume electron microscopy and neural microcircuit analysis. Front Neural Circuits. 12:98. [DOI] [PMC free article] [PubMed] [Google Scholar]
- Lanjakornsiripan D, Pior BJ, Kawaguchi D, Furutachi S, Tahara T, Katsuyama Y, Suzuki Y, Fukazawa Y, Gotoh Y. 2018. Layer-specific morphological and molecular differences in neocortical astrocytes and their dependence on neuronal layers. Nat Commun. 9. [DOI] [PMC free article] [PubMed] [Google Scholar]
- Lavialle M, Aumann G, Anlauf E, Pröls F, Arpin M, Derouiche A. 2011. Structural plasticity of perisynaptic astrocyte processes involves ezrin and metabotropic glutamate receptors. Proc Natl Acad Sci U S A. 108:12915–12919. [DOI] [PMC free article] [PubMed] [Google Scholar]
- Le Meur K, Mendizabal-Zubiaga J, Grandes P, Audinat E. 2012. GABA release by hippocampal astrocytes. Front Comput Neurosci. 6. [DOI] [PMC free article] [PubMed] [Google Scholar]
- Lehre KP, Rusakov DA. 2002. Asymmetry of glia near central synapses favors presynaptically directed glutamate escape. Biophys J. 83:125–134. [DOI] [PMC free article] [PubMed] [Google Scholar]
- Lushnikova I, Skibo G, Muller D, Nikonenko I. 2009. Synaptic potentiation induces increased glial coverage of excitatory synapses in CA1 hippocampus. Hippocampus. 19:753–762. [DOI] [PubMed] [Google Scholar]
- Medvedev N, Popov V, Henneberger C, Kraev I, Rusakov DA, Stewart MG. 2014. Glia selectively approach synapses on thin dendritic spines. Philos Trans R Soc Lond Ser B Biol Sci. 369:20140047. [DOI] [PMC free article] [PubMed] [Google Scholar]
- Merchán-Pérez A, Rodriguez J-R, Alonso-Nanclares L, Schertel A, DeFelipe J. 2009. Counting synapses using FIB/SEM microscopy: a true revolution for ultrastructural volume reconstruction. Front Neuroanat. 3:18. [DOI] [PMC free article] [PubMed] [Google Scholar]
- Merchán-Pérez A, Rodríguez J-R, González S, Robles V, DeFelipe J, Larrañaga P, Bielza C. 2014. Three-dimensional spatial distribution of synapses in the neocortex: a dual-beam electron microscopy study. Cereb Cortex. 24:1579–1588. [DOI] [PMC free article] [PubMed] [Google Scholar]
- Miguéns M, Kastanauskaite A, Coria SM, Selvas A, Ballesteros-Yañez I, DeFelipe J, Ambrosio E. 2015. The effects of cocaine self-administration on dendritic spine density in the rat hippocampus are dependent on genetic background. Cereb Cortex. 25:56–65. [DOI] [PubMed] [Google Scholar]
- Min R, Nevian T. 2012. Astrocyte signaling controls spike timing–dependent depression at neocortical synapses. Nat Neurosci. 15:746–753. [DOI] [PubMed] [Google Scholar]
- Mironov A. 2017. Stereological morphometric grids for ImageJ. Ultrastruct Pathol. 41:126. [Google Scholar]
- Montes J, Peña JM, DeFelipe J, Herreras O, Merchan-Perez A. 2015. The influence of synaptic size on AMPA receptor activation: a Monte Carlo model. PLoS One. 10:e0130924. [DOI] [PMC free article] [PubMed] [Google Scholar]
- Morales J, Alonso-Nanclares L, Rodríguez J-R, DeFelipe J, Rodríguez A, Merchán-Pérez A. 2011. Espina: a tool for the automated segmentation and counting of synapses in large stacks of electron microscopy images. Front Neuroanat. 5:18. [DOI] [PMC free article] [PubMed] [Google Scholar]
- Morales J, Rodríguez A, Rodríguez J-R, DeFelipe J, Merchán-Pérez A. 2013. Characterization and extraction of the synaptic apposition surface for synaptic geometry analysis. Front Neuroanat. 7:20. [DOI] [PMC free article] [PubMed] [Google Scholar]
- Morel L, Higashimori H, Tolman M, Yang Y. 2014. VGluT1+ neuronal glutamatergic signaling regulates postnatal developmental maturation of cortical protoplasmic astroglia. J Neurosci. 34:10950–10962. [DOI] [PMC free article] [PubMed] [Google Scholar]
- Morgan JL, Lichtman JW. 2013. Why not connectomics? Nat Methods. 10:494–500. [DOI] [PMC free article] [PubMed] [Google Scholar]
- Morquette P, Verdier D, Kadala A, Féthière J, Philippe AG, Robitaille R, Kolta A. 2015. An astrocyte-dependent mechanism for neuronal rhythmogenesis. Nat Neurosci. 18:844–854. [DOI] [PubMed] [Google Scholar]
- Nimmerjahn A, Bergles DE. 2015. Large-scale recording of astrocyte activity. Curr Opin Neurobiol. 32:95–106. [DOI] [PMC free article] [PubMed] [Google Scholar]
- Nusser Z, Lujan R, Laube G, Roberts JD, Molnar E, Somogyi P. 1998. Cell type and pathway dependence of synaptic AMPA receptor number and variability in the hippocampus. Neuron. 21:545–559. [DOI] [PubMed] [Google Scholar]
- Oberheim NA, Goldman SA, Nedergaard M. 2012. Heterogeneity of astrocytic form and function. Methods Mol Biol. 814:23–45. [DOI] [PMC free article] [PubMed] [Google Scholar]
- Ogata K, Kosaka T. 2002. Structural and quantitative analysis of astrocytes in the mouse hippocampus. Neuroscience. 113:221–233. [DOI] [PubMed] [Google Scholar]
- Oliet SHR. 2001. Control of glutamate clearance and synaptic efficacy by glial coverage of neurons. Science. 292:923–926. [DOI] [PubMed] [Google Scholar]
- Oliet SHR, Piet R, Poulain DA, Theodosis DT. 2004. Glial modulation of synaptic transmission: insights from the supraoptic nucleus of the hypothalamus. Glia. 47:258–267. [DOI] [PubMed] [Google Scholar]
- Oorschot D, Peterson D, Jones D. 1991. Neurite growth from, and neuronal survival within, cultured explants of the nervous system: a critical review of morphometric and stereological methods, and suggestions for the future. Prog Neurobiol. 37:525–546. [DOI] [PubMed] [Google Scholar]
- Ortuño T, López-Madrona VJ, Makarova J, Tapia-Gonzalez S, Muñoz A, DeFelipe J, Herreras O. 2019. Slow-wave activity in the S1HL cortex is contributed by different layer-specific field potential sources during development. J Neurosci. 23:1212–1219. [DOI] [PMC free article] [PubMed] [Google Scholar]
- Pannasch U, Freche D, Dallérac G, Ghézali G, Escartin C, Ezan P, Cohen-Salmon M et al. 2014. Connexin 30 sets synaptic strength by controlling astroglial synapse invasion. Nat Neurosci. 17:549–558. [DOI] [PubMed] [Google Scholar]
- Papouin T, Dunphy J, Tolman M, Foley JC, Haydon PG. 2017. Astrocytic control of synaptic function. Philos Trans R Soc Lond Ser B Biol Sci. 372:20160154. [DOI] [PMC free article] [PubMed] [Google Scholar]
- Parpura V, Basarsky TA, Liu F, Jeftinija K, Jeftinija S, Haydon PG. 1994. Glutamate-mediated astrocyte-neuron signalling. Nature. 369:744–747. [DOI] [PubMed] [Google Scholar]
- Pascual O, Casper KB, Kubera C, Zhang J, Revilla-Sanchez R, Sul J-Y, Takano H, Moss SJ, McCarthy K, Haydon PG. 2005. Astrocytic purinergic signaling coordinates synaptic networks. Science. 310:113–116. [DOI] [PubMed] [Google Scholar]
- Paxinos G, Watson C. 2007. The Rat Brain in Stereotaxic Coordinates. 6th ed. London, UK: Academic Press. [Google Scholar]
- Perea G, Araque A. 2005. Glial calcium signaling and neuron-glia communication. Cell Calcium. 38:375–382. [DOI] [PubMed] [Google Scholar]
- Perea G, Araque A. 2007. Astrocytes potentiate transmitter release at single hippocampal synapses. Science. 317:1083–1086. [DOI] [PubMed] [Google Scholar]
- Perea G, Navarrete M, Araque A. 2009. Tripartite synapses: astrocytes process and control synaptic information. Trends Neurosci. 32:421–431. [DOI] [PubMed] [Google Scholar]
- Perez-Alvarez A, Navarrete M, Covelo A, Martin ED, Araque A. 2014. Structural and functional plasticity of astrocyte processes and dendritic spine interactions. J Neurosci. 34:12738–12744. [DOI] [PMC free article] [PubMed] [Google Scholar]
- Peters A, Palay SL. 1996. The morphology of synapses. J Neurocytol. 25:687–700. [DOI] [PubMed] [Google Scholar]
- Petrak LJ, Harris KM, Kirov SA. 2005. Synaptogenesis on mature hippocampal dendrites occurs via filopodia and immature spines during blocked synaptic transmission. J Comp Neurol. 484:183–190. [DOI] [PubMed] [Google Scholar]
- Poskanzer KE, Yuste R. 2016. Astrocytes regulate cortical state switching in vivo. Proc Natl Acad Sci U S A. 113:E2675–E2684. [DOI] [PMC free article] [PubMed] [Google Scholar]
- Reichenbach A, Derouiche A, Kirchhoff F. 2010. Morphology and dynamics of perisynaptic glia. Brain Res Rev. 63:11–25. [DOI] [PubMed] [Google Scholar]
- Rojo C, Leguey I, Kastanauskaite A, Bielza C, Larrañaga P, DeFelipe J, Benavides-Piccione R. 2016. Laminar differences in dendritic structure of pyramidal neurons in the juvenile rat somatosensory cortex. Cereb Cortex. 26:2811–2822. [DOI] [PMC free article] [PubMed] [Google Scholar]
- Rollenhagen A, Klook K, Sätzler K, Qi G, Anstötz M, Feldmeyer D, Lübke JHR. 2015. Structural determinants underlying the high efficacy of synaptic transmission and plasticity at synaptic boutons in layer 4 of the adult rat barrel cortex. Brain Struct Funct. 220:3185–3209. [DOI] [PubMed] [Google Scholar]
- Rollenhagen A, Ohana O, Sätzler K, Hilgetag CC, Kuhl D, Lübke JHR. 2018. Structural properties of synaptic transmission and temporal dynamics at excitatory layer 5B synapses in the adult rat somatosensory cortex. Front Synaptic Neurosci. 10. [DOI] [PMC free article] [PubMed] [Google Scholar]
- Rollenhagen A, Sätzler K, Rodríguez EP, Jonas P, Frotscher M, Lübke JHR. 2007. Structural determinants of transmission at large hippocampal mossy fiber synapses. J Neurosci. 27:10434–10444. [DOI] [PMC free article] [PubMed] [Google Scholar]
- Santuy A, Rodríguez JR, DeFelipe J, Merchán-Pérez A. 2018a. Study of the size and shape of synapses in the juvenile rat somatosensory cortex with 3D electron microscopy. eNeuro. 5:0377–0317. [DOI] [PMC free article] [PubMed] [Google Scholar]
- Santuy A, Rodriguez JR, DeFelipe J, Merchan-Perez A. 2018b. Volume electron microscopy of the distribution of synapses in the neuropil of the juvenile rat somatosensory cortex. Brain Struct Funct. 223:77–90. [DOI] [PMC free article] [PubMed] [Google Scholar]
- Schell MJ, Molliver ME, Snyder SH. 1995. D-serine, an endogenous synaptic modulator: localization to astrocytes and glutamate-stimulated release. Proc Natl Acad Sci U S A. 92:3948–3952. [DOI] [PMC free article] [PubMed] [Google Scholar]
- Schikorski T, Stevens CF. 1997. Quantitative ultrastructural analysis of hippocampal excitatory synapses. J Neurosci. 17:5858–5867. [DOI] [PMC free article] [PubMed] [Google Scholar]
- Schikorski T, Stevens CF. 1999. Quantitative fine-structural analysis of olfactory cortical synapses. Proc Natl Acad Sci U S A. 96:4107–4112. [DOI] [PMC free article] [PubMed] [Google Scholar]
- Schousboe A, Scafidi S, Bak LK, Waagepetersen HS, McKenna MC. 2014. Glutamate metabolism in the brain focusing on astrocytes. Adv Neurobiol. 11:13–30. [DOI] [PMC free article] [PubMed] [Google Scholar]
- Seelke AMH, Dooley JC, Krubitzer LA. 2012. The emergence of somatotopic maps of the body in S1 in rats: the correspondence between functional and anatomical organization. PLoS One. 7:e32322. [DOI] [PMC free article] [PubMed] [Google Scholar]
- Selvas A, Coria SM, Kastanauskaite A, Fernaud-Espinosa I, DeFelipe J, Ambrosio E, Miguéns M. 2017. Rat-strain dependent changes of dendritic and spine morphology in the hippocampus after cocaine self-administration. Addict Biol. 22:78–92. [DOI] [PubMed] [Google Scholar]
- Sherman SM, Guillery RW. 1996. Functional organization of thalamocortical relays. J Neurophysiol. 76:1367–1395. [DOI] [PubMed] [Google Scholar]
- Smith SJ. 2007. Circuit reconstruction tools today. Curr Opin Neurobiol. 17:601–608. [DOI] [PMC free article] [PubMed] [Google Scholar]
- Sofroniew MV, Vinters HV. 2010. Astrocytes: biology and pathology. Acta Neuropathol. 119:7–35. [DOI] [PMC free article] [PubMed] [Google Scholar]
- Südhof TC. 2012. The presynaptic active zone. Neuron. 75:11–25. [DOI] [PMC free article] [PubMed] [Google Scholar]
- Takumi Y, Ramírez-León V, Laake P, Rinvik E, Ottersen OP. 1999. Different modes of expression of AMPA and NMDA receptors in hippocampal synapses. Nat Neurosci. 2:618–624. [DOI] [PubMed] [Google Scholar]
- Tarusawa E, Matsui K, Budisantoso T, Molnár E, Watanabe M, Matsui M, Fukazawa Y, Shigemoto R. 2009. Input-specific intrasynaptic arrangements of ionotropic glutamate receptors and their impact on postsynaptic responses. J Neurosci. 29:12896–12908. [DOI] [PMC free article] [PubMed] [Google Scholar]
- Tasker JG, Oliet SHR, Bains JS, Brown CH, Stern JE. 2012. Glial regulation of neuronal function: from synapse to systems physiology. J Neuroendocrinol. 24:566–576. [DOI] [PMC free article] [PubMed] [Google Scholar]
- Testen A, Ali M, Sexton HG, Hodges S, Dubester K, Reissner KJ, Swartzwelder HS, Risher ML. 2019. Region-specific differences in morphometric features and synaptic colocalization of astrocytes during development. Neuroscience. 400:98–109. [DOI] [PMC free article] [PubMed] [Google Scholar]
- Theodosis DT, Poulain DA, Oliet SHR. 2008. Activity-dependent structural and functional plasticity of astrocyte-neuron interactions. Physiol Rev. 88:983–1008. [DOI] [PubMed] [Google Scholar]
- Toni N, Buchs P-A, Nikonenko I, Povilaitite P, Parisi L, Muller D. 2001. Remodeling of synaptic membranes after induction of long-term potentiation. J Neurosci. 21:6245–6251. [DOI] [PMC free article] [PubMed] [Google Scholar]
- Ventura R, Harris KM. 1999. Three-dimensional relationships between hippocampal synapses and astrocytes. J Neurosci. 19:6897–6906. [DOI] [PMC free article] [PubMed] [Google Scholar]
- Verkhratsky A, Orkand RK, Kettenmann H. 1998. Glial calcium: homeostasis and signaling function. Physiol Rev. 78:99–141. [DOI] [PubMed] [Google Scholar]
- Veruki ML, Mørkve SH, Hartveit E. 2006. Activation of a presynaptic glutamate transporter regulates synaptic transmission through electrical signaling. Nat Neurosci. 9:1388–1396. [DOI] [PubMed] [Google Scholar]
- Volterra A, Bezzi P. 2002. Release of transmitters from glial cells In: Volterra A, editor. The tripartite synapse: glia in synaptic transmission. Oxford, UK: Oxford University Press, pp. 164–184. [Google Scholar]
- Wang X, Lou N, Xu Q, Tian G-F, Peng WG, Han X, Kang J, Takano T, Nedergaard M. 2006. Astrocytic Ca2+ signaling evoked by sensory stimulation in vivo. Nat Neurosci. 9:816–823. [DOI] [PubMed] [Google Scholar]
- Welker C, Woolsey TA. 1974. Structure of layer IV in the somatosensory neocortex of the rat: description and comparison with the mouse. J Comp Neurol. 158:437–453. [DOI] [PubMed] [Google Scholar]
- Witcher MR, Kirov SA, Harris KM. 2007. Plasticity of perisynaptic astroglia during synaptogenesis in the mature rat hippocampus. Glia. 55:13–23. [DOI] [PubMed] [Google Scholar]
- Witcher MR, Park YD, Lee MR, Sharma S, Harris KM, Kirov SA. 2010. Three-dimensional relationships between perisynaptic astroglia and human hippocampal synapses. Glia. 58:572–587. [DOI] [PMC free article] [PubMed] [Google Scholar]
- Wong-Riley MT, Welt C. 1980. Histochemical changes in cytochrome oxidase of cortical barrels after vibrissal removal in neonatal and adult mice. Proc Natl Acad Sci. 77:2333–2337. [DOI] [PMC free article] [PubMed] [Google Scholar]
- Zorec R, Horvat A, Vardjan N, Verkhratsky A. 2015. Memory formation shaped by Astroglia. Front Integr Neurosci. 9:56. [DOI] [PMC free article] [PubMed] [Google Scholar]
Associated Data
This section collects any data citations, data availability statements, or supplementary materials included in this article.