The Debye scattering equation (DSE) is generalized and augmented in order to account for moderate texture effects, yielding the differential cross section as a function of atomic coordinates and texture coefficients subject to symmetry constraints. Implications for the evaluation of the pair distribution function (PDF) as a direct transform of powder diffraction data from textured samples are also discussed.
Keywords: Debye scattering equation, texture, pair distribution function
Abstract
Many functional materials are today synthesized in the form of nanoparticles displaying preferred orientation effects to some small or large extent. The analysis of diffraction data of such kinds of systems is best performed in the framework of the total scattering approach that prescinds from translation symmetry assumptions. Therefore modified expressions were derived for the most common total scattering functions, in particular the Debye scattering equation (DSE) which yields the texture-averaged differential cross section as a function of atomic coordinates and texture parameters. The modified DSE encodes higher-order even spherical Bessel functions which account for the texture effect. Selection rules arising from experimental geometries and symmetries are discussed. In addition the duality of the texture effect is introduced showing the effects of texture on both the I(Q) and  . The paper includes several definitions and appendices which are meant to be useful for those involved in the development of crystallographic computing.
1. Introduction
Preferred orientation (texture) is a complex effect that bridges powder diffraction to single-crystal diffraction. In recent years in materials science there has been an increasing trend towards the synthesis and subsequent analysis of materials displaying only partial order, often in the nanometre length scale in the form of nanoparticles (Tekumalla et al., 2019 ▸), thin films (Rijckaert et al., 2018 ▸; Dippel et al., 2019 ▸), or fibre-textured materials that are bone-like (Tan et al., 2019 ▸) or wood-like (Lagerwall et al., 2014 ▸). The analysis of these kinds of materials is best performed within the framework of the total scattering approach that prescinds from periodicity and therefore avoids Bragg formalism, yet provides quantitative information on the structural parameters as well as on the size and shape of the scattering domain (Guagliardi et al., 2015 ▸).
While intensity corrections for Bragg intensities are known (Roe, 1965 ▸; Bunge, 1982 ▸; Popa, 1992 ▸), within the total scattering approach the problem of evaluating the  and
and  functions in the presence of texture has never been quantitatively tackled. Only some generalities have been presented in a preprint by Gong & Billinge (2018) ▸. Therefore this paper deals with computation, via an extended Debye scattering equation [concisely DSE in this paper; see Debye (1915 ▸)], of 1D powder diffraction patterns obtained from crystalline powders having a non-uniform orientation distribution function (ODF hereafter). We will remain in the realm of ‘textured powders’ or powders with a weak to strong preferred orientation, but not so strong as to be better defined as mosaic crystal sets. A complete treatment in the framework of spherical harmonics for the most common powder diffraction geometries is presented. The differential cross section I(Q) can be computed by an extended version of the DSE comprising now sums over spherical Bessel functions of all (even) orders. Selection rules arising from symmetries and explicit expressions for the most common experimental geometries are given. Concerning the
  , the effects of texture result in a fundamental indetermination which has important consequences that we will discuss towards the end. We will start appropriately by defining terms we use, although some of them may be familiar to some readers, and giving a brief recall of the part of the scattering theory relevant in this context (Section 2); in Section 3 the definition of the analytic problem and its solution are given. Section 4 deals with related computation aspects. In Section 5 the effects of texture on the pair distribution function are examined. Section 6 shows several example calculations and finally Section 7 is devoted to brief conclusions. Some useful mathematical functions (Appendix A
) and computing details (Appendix B
) are also reported.
1.1. Some definitions
(i) Atomic object (AO) is a set of atoms rigidly bound together, constituting a particle, a nanoparticle, a molecule, a nanowire, a nanocrystal (NC) etc.
(ii) Powder is an ensemble of a large number of identical AOs constrained in a given volume and assuming all possible orientations in space with a certain probability density. In an ideal powder the orientation probability distribution function is uniform and isotropic, but in reality there are many cases where it is not so.
(iii) Symmetry is the point (or Laue) symmetry group of the AO considered as a whole – also (and especially) when the object is a (perhaps small) portion of a perfect crystal. In fact, translational symmetry cannot apply to a limited object. The crystal point-group symmetry is the maximal possible symmetry group of the AO, even if the external shape would be more symmetric. So, a cubic cutout of a monoclinic crystal may be at most monoclinic, and only if one of the cube axes coincides with the monoclinic twofold axis.
1.2. Additional considerations
It must be also clear that, while the diffraction pattern of an ideal powder is essentially 1D (because the intensity in reciprocal space varies only radially), a non-ideal powder, i.e. with a non-uniform ODF (or textured powder), has full 3D dependence in reciprocal space. In fact, in an extreme case, all AOs might be parallel and co-aligned, and if they were to be NC, the pattern would be essentially that of a single crystal. This might entail the need to measure it almost like a single crystal. We are interested mainly in the case where the uniformity of the ODF is only lightly perturbed. Then it still makes sense to measure the powder as such, with one of the traditional geometries (as discussed later). The variable in the patterns thus measured is the deflection angle  , or better the transferred momentum magnitude
  [or
[or  ], where λ is the incident wavelength. As the differential scattering cross section for textured powders is not only a function of q but in general of the vector
  , the experimental geometry is essential in order to take into account texture effects. In particular, we must take into account additional symmetries arising from the sample nature and/or special averaging means applied. In many geometries, for instance, it is customary to rotate the sample around an axis while the measurement is taken; this will of course affect the texture, reducing it as a single axis rotation performs a partial orientation averaging. Therefore, we must specialize the concept of symmetry into two kinds: object symmetry which is the one defined in Section 1.1 at point (iii); sample symmetry which is the one defined just above. Clearly, the geometric relationship between the symmetry elements of the two kinds is important and needs to be specified.
2. Scattering theory
Take an AO composed of N atoms indexed with  , each centred at positions
  and each with isotropically variable spatial distributions
  of scattering length around
  . Hereafter, a vector is denoted in bold and its length in italic (e.g.
 ). We assume from here on that the coordinate system is chosen so that the main symmetry axes are along the coordinate axes. The scattering length density is then
Its Fourier transform is easily evaluated as
 |
where we have set
The scattering factors  are known and tabulated functions for all atoms and ions and for X-rays as well as for neutrons and electrons (disregarding the weak perturbations due to the atomic environment). The common feature is that they are complex-valued but isotropic in reciprocal space. This is a consequence of the isotropy in direct space of the associated scattering length densities.
The differential elastic coherent scattering cross section  is now proportional to the square modulus of
  , giving
 |
Note that, of the three resulting terms, (i) the term in equation (2), the self-scattering, is isotropic (depends only on q) because (as it is often assumed) the atomic scattering length densities are isotropic. Therefore this term does not change if the ODF is not uniform. (ii) The term in equation (3), let us name it principal scattering, is even in  . (iii) The term in equation (4), for us secondary scattering, is odd in
  .
.
We shall be neglecting in the following the secondary scattering in expression (4). There are several reasons for that. First, let us look at the magnitude of the scattering factor products. In the X-ray case, we have  , where
  (real) is the true elastic scattering term, depending only on q and at small q we have
  (the atomic number), whilst
  constitute the anomalous scattering factor part (real and imaginary parts), caused by the atomic electron binding, constant with respect to q and varying only with the wavelength. For reference and databases of atomic scattering factors see Thompson & Vaughan (2009 ▸), Cullen et al. (1997 ▸), Waasmaier & Kirfel (1995 ▸), Chantler et al. (2005 ▸), Chantler (1995 ▸, 2000 ▸). In standard conditions (far from elemental absorption edges) the ratios
  and
and  are small. Then
and it is clear that the imaginary part is small. Only in special conditions can the  or
or  become large. Second, note that if the atomic species of the jth and kth atoms are the same clearly
  , implying that the only contributing terms come from interatomic vectors linking atoms of different species. In mono-atomic samples the secondary scattering will always be zero. Third, consider the degree of preferred orientation. We range from ideal powder to single crystals, with many intermediates. Any even partial ODF averaging that mixes up
  and
and  will cancel partly or totally the secondary scattering. When the ODF is uniform (ideal powders), the odd sine terms average to exactly zero. This paper deals mainly with non-ideal powders, where the ODF is not uniform but also not as sharp as in a single crystal. For this reason, in most cases the secondary scattering can be neglected and one can assume that
  is an even function of
  . This has important consequences for the ODF averaging.
We mention in passing that, as it must be, the effect in single crystals has been noted [Friedel pairs (Friedel, 1913 ▸)] and exploited for phasing (see Bijvoet et al., 1951 ▸). Moreover, this scattering contribution can be exploited in resonant conditions, that is, whenever the wavelength can be chosen so as to maximize it.
For completeness, we also give the inverse Fourier transform of equation (1) as it represents the pair correlation of the scattering density:
We now deal with evaluating the orientation average of terms like the sum in equation (3) when the ODF is not uniform (texture).
We shall follow the fundamental treatment of texture expressed in the basis of spherical harmonics, as in Roe (1965 ▸) and Bunge (1982 ▸). For a detailed comparison of these two fundamental references see Esling et al. (1982 ▸). A new method has recently been presented (Mason & Schuh, 2008 ▸, 2009 ▸), using the quaternion (axis–angle) parameterization (Morawlec & Pospiech, 1989 ▸; Kazantsev et al., 2009 ▸; Karney, 2007 ▸; Bernstein et al., 2005 ▸; Bernstein & Schaeben, 2005 ▸) for 3D rotations instead of the less intuitive Euler matrices. We will not deal with this approach in this paper. A very important paper for the treatment of symmetry is that by Popa (1992 ▸), refined by Popa (2008 ▸); well-known references are also Järvinen (1993 ▸) and Von Dreele (1997 ▸). Special function definitions are taken from Nikiforov & Uvarov (1988 ▸) and Olver et al. (2009 ▸).
3. ODF formalism
An ODF
is a function of three Euler angles. Let also
be the Euler matrix corresponding to a rotation of  around the z axis, followed by a rotation of Ψ around the y axis, followed by a rotation of
  around the new z axis. An ODF is normalized to have unit average:
so that  is a probability density. The uniform isotropic case is when
  . The ODF-weighted average of the principal scattering, the meaningful part of the differential cross section, as in equation (3), becomes
where
 |
3.1. Uniform isotropic ODF case – the DSE
In the uniform isotropic case ( ), it is simple to verify that
where
is the spherical Bessel function of 0 order [for definitions an excellent online reference is Olver et al. (2009 ▸)]. In this simplest, and fortunately very frequent, case, the expression of the orientation-averaged differential cross section of our AO is simply
which is the well-known DSE, first presented by Debye (1915 ▸).
3.2. Arbitrary ODF case
In more complex cases we first have to make one further simplification. If
and
this still does not fully determine the Euler angles  . In fact, a further rotation around
  is possible. This does not affect anything, of course; therefore it is convenient to average it out. It is possible (see Roe 1965 ▸; Bunge, 1982 ▸) to expand g in generalized spherical harmonics (GSH), whose definition we take from Nikiforov & Uvarov (1988 ▸):
and we note conditions (Nadeau & Ferrari, 2003 ▸)
(where the second inequality is just an upper bound, as tighter bounds are very difficult to compute in general) and then we execute the averaging of rotations around  (cf. Roe, 1965 ▸; Bunge, 1982 ▸):
where  are ordinary spherical harmonics (SPH). There are unfortunately many definitions used in various fields; the definition used here (and a comparison with other common definitions) is given in Appendix A
. They are complex functions:
where for convenience we define
where the associated Legendre functions  are defined in Section A2. It is also convenient to use the plane-wave expansion in spherical harmonics,
 |
or [using the SPH addition theorem, see e.g. Arfken (1985 ▸)]
where, if we express  in polar coordinates
we can write
Now we integrate over  :
:
 |
3.3. Symmetry constraints
The theory of symmetry constraints on the complex coefficients  has been developed by Bunge (1982 ▸). A very clear and concise derivation is also found in Popa (1992 ▸) (with several small imprecisions), Järvinen (1993 ▸), Von Dreele (1997 ▸) and Popa (2008 ▸). In fact, we have already exploited the fact that
  is real and centrosymmetric [i.e.
 ]. We can still exploit the fact that g, and therefore also
  , is real.
Define thus the real spherical harmonics  :
:
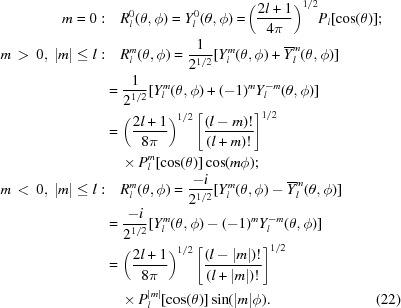 |
In terms of the  functions [equation (15)] we have the compact forms
 |
Now we can rewrite
 |
where  are now real coefficients.
We will expand now on symmetry conditions as from Bunge (1982 ▸) and Popa (1992 ▸).
3.4. Sample symmetry
In the three most used experimental geometries for powder diffraction (DS or Debye–Scherrer with rotating capillary, BB or Bragg–Brentano with flat spinning plate, FP or flat-plate in transmission with frontal 2D detector; see Fig. 1 ▸) we can assume cylindrical sample symmetry. In the first two cases this is due to the sample spinning around an axis which is then automatically the cylindrical symmetry axis; for FP, cylindrical symmetry ensues from integrating the Scherrer rings on the detector (or possibly, the flat plate could be made to rotate around the beam axis).
Figure 1.
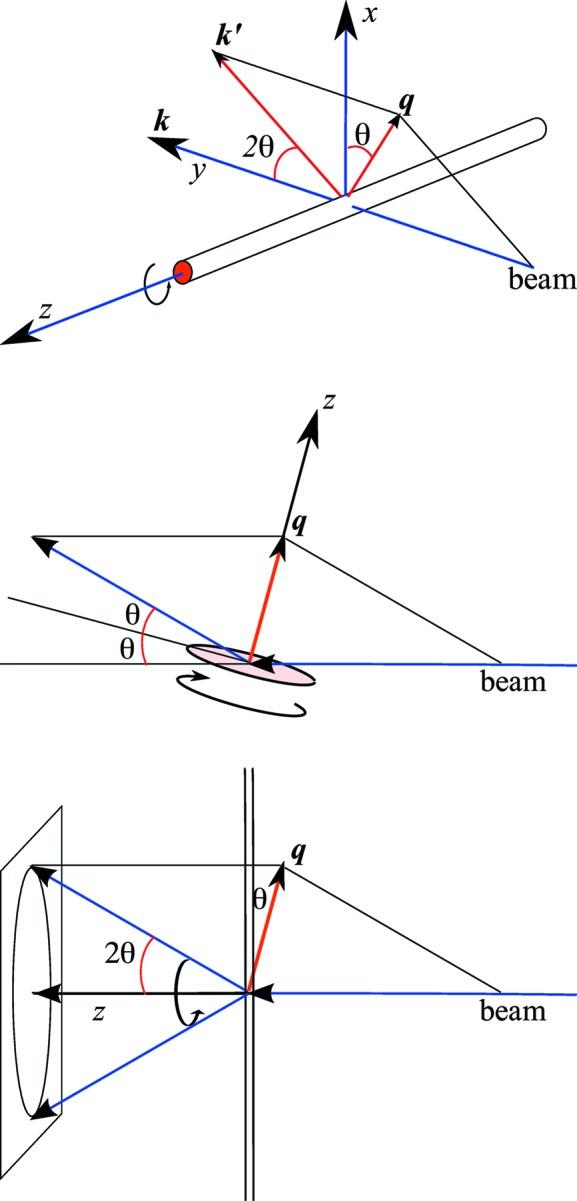
(Top) Debye–Scherrer (capillary) geometry; (middle) Bragg–Brentano (symmetric reflection) geometry; (bottom) flat-plate with frontal 2D detector (transmission) geometry.
We always set the z axis along the cylinder axis. Then in the three cases, as is evident from Fig. 1 ▸,
 |
Then, as for cylindrical symmetry, the only allowed value is always  ,
,
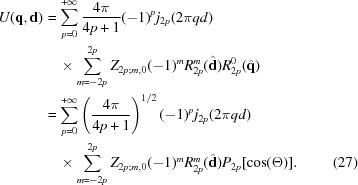 |
Here we used the identity  . For the three geometries (DS, BB, FP) here considered:
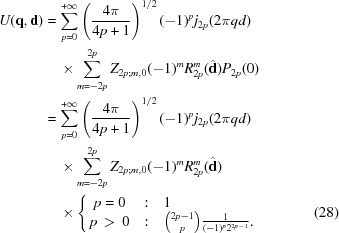
Case DS:
 |
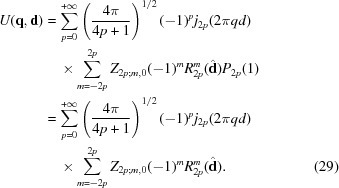
Case BB:
 |
Case FP:
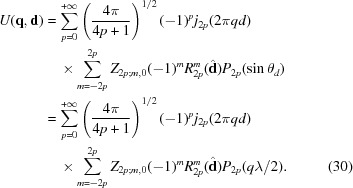 |
Here we used the even parity of the even Legendre polynomials  and Bragg’s law
  .
.
Given the obvious constraint  , we can extract the
  term and simplify the rest. We define another quantity for convenience:
Now we have for DS:
For BB:
For FP:
3.5. AO symmetry
If the atom cluster has additional symmetries, also the sum over m can be reduced due to additional constraints (Bunge, 1982 ▸; Popa, 1992 ▸). Let us explore the constraints for classical non-cubic crystal symmetries.
3.5.1. One axis
With one symmetry axis only of order r ( , for Laue groups
  ,
,  ,
,  ,
,  , respectively), supposedly oriented along z, we have that some of the
  (
( ) coefficients are zero. In particular, the surviving ones are
3.5.2. Two axes
With one symmetry axis of order r ( ), supposedly oriented along z, and an additional twofold axis orthogonal to it, we have, additionally to the former condition, that, for
  , if m even (
 ),
),
and if m odd ( ),
),
i.e. only the cosine terms survive when m is even (respectively, the sine terms when m is odd). The results are summarized in Table 1 ▸.
Table 1. Symmetry rules for the 11 crystallographic Laue groups plus the cylinder group.
Top part: For all non-cubic groups, where symmetry causes just a decimation of the coefficients  , entries 0, + or − indicate if, for the selected |m| value (and of course for each l = 2p > |m|), the coefficients
  ,
,  ,
,  , respectively, are allowed to take nonzero values. Bottom part: For cubic groups, only linear combinations of cubic harmonics
  are allowed; for each l = 2p, the possible cubic angular functions (if any) are shown.

|
0 | 1 | 2 | 3 | 4 | 5 | 6 | 7 | 8 | 9 | 10 | 11 | 12 | ||
|---|---|---|---|---|---|---|---|---|---|---|---|---|---|---|---|

|

|
Triclinic | 0 | ± | ± | ± | ± | ± | ± | ± | ± | ± | ± | ± | ± |

|
2/m | Monoclinic | 0 | ± | ± | ± | ± | ± | ± | ||||||

|
mmm | Orthorhombic | 0 | + | + | + | + | + | + | ||||||

|

|
Trigonal 1 | 0 | ± | ± | ± | ± | ||||||||

|

|
Trigonal 2 | 0 | − | + | − | + | ||||||||

|
4/m | Tetragonal 1 | 0 | ± | ± | ± | |||||||||

|
4/mmm | Tetragonal 2 | 0 | + | + | + | |||||||||

|
6/m | Hexagonal 1 | 0 | ± | ± | ||||||||||

|
6/mmm | Hexagonal 2 | 0 | + | + | ||||||||||

|
∞/m | Cylindrical | 0 | ||||||||||||

|
1 | 2 | 3 | 4 | 5 | 6 | 7 | 8 | 9 | 10 | 11 | 12 | ||
|---|---|---|---|---|---|---|---|---|---|---|---|---|---|---|
 (tetrahedral) (tetrahedral) |

|
Cubic I |

|

|

|

|

|
|||||||

|

|

|
||||||||||||

|
||||||||||||||
 (octahedral) (octahedral) |

|
Cubic II |

|

|

|

|

|
|||||||

|
||||||||||||||
3.5.3. Three axes
This is the cubic case. Symmetrized harmonics for this case are not simply an appropriate subset of the real harmonics  ; we must form appropriate linear combinations of them (with fixed l, of course). The original derivation is due to von der Lage & Bethe (1947 ▸). Equation (31) will be changed into
where  is a (small) number of allowed terms for each p. Denote these so-called cubic harmonics as
  , where
  is simply a counter. Two Laue groups belong to the cubic case,
  and
and  . For the first, conditions as for group
  hold; for the second, conditions as for group
  hold. Additionally, for both, we must add the condition (Popa, 1992 ▸)
For  no terms are present. For
  , for both groups
  and
and  , we have one term (polar angle θ, azimuth ϕ):
where the X functions are defined in equation (15). For  , for
, for  , we have one term (polar angle θ, azimuth ϕ):
and for group  there is additionally
 |
For  , for
, for  as well as for group
  , we have just one term:
 |
For  , for
, for  , we have one term (polar angle θ, azimuth ϕ):
 |
and for group  there is additionally
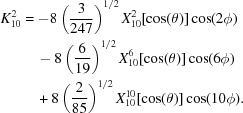 |
For  , for
, for  , we have two terms (polar angle θ, azimuth ϕ):
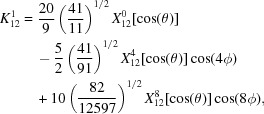 |
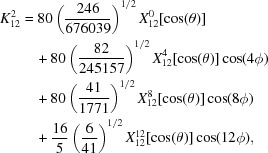 |
and for group  there is additionally
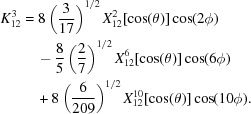 |
All cubic harmonics above are orthonormal.
4. Computation
The computation of the classical Debye scattering equation is made much easier by using the Gaussian sampling method (see Cervellino et al., 2006 ▸; Guagliardi et al., 2015 ▸). We briefly recall its principle. Firstly, we assume that either the system is mono-atomic, or the sum over atom pairs in equation (8) has been split into parts corresponding to each pair of atomic species. In this way we can factor out the possibly q-dependent scattering length products  , that would then be multiplied after evaluating the partial sums over different pairs, to be finally summed at the very end. So in this part we will omit the scattering length products.
Given an interatomic distance  , its contribution to the powder pattern is
  . As the
  values are a huge number (the square of the number of atoms in the AO) and they are all concentrated in a finite interval
  , with D the diameter (or maximal linear dimension) of the AO, it pays to consider only a discrete and uniformly spaced set of distances
  with appropriately chosen weights
  and then compute the pattern as
instead of a much larger sum over terms like in equation (12). Recalling briefly the procedure, each term is replaced by
 |
Here,  is the nearest integer to x;
  is a correction factor;
  is a numerical constant; ζ is an integer (typically ζ = 30 to 60) such that (numerically)
  can be considered negligibly small. The second Gaussian centred at
  is almost always negligible except when m is close to 0. Finally, the parameter Δ, the sampling step, must be chosen so that
  , where
  is the maximum momentum transfer value in the pattern to be calculated; a numerically safe choice is
  . The Whittaker–Nyquist–Kotelnikov–Shannon upper limit for the sampling step (Shannon, 1949 ▸) is also
  (see Guagliardi et al., 2015 ▸; Cervellino et al., 2016 ▸). Hence, this is the most efficient approximate method with negligible error (practically zero). Values of Δ ranging from 1 to 0.03 Å cover most imaginable powder diffraction experimental conditions with neutrons and X-rays. For an exhaustive derivation see Cervellino et al. (2006 ▸). When adding more contributions to the pattern, the q-dependent factor
  can be omitted and left to be multiplied at the end. The contributions from different distances can be summed on the
  grid and the pattern is built by accumulation, resulting in the
  that multiply the
  contributions in equation (36).
It is clear that such computational advantage can be preserved in the extended form. We now will explain how the procedure must be modified.
We rewrite here the sum equation (8) [assuming equation (10)] in a more convenient way,
where the set of interatomic vectors  has been split into
  equivalence classes of interatomic vectors having the same length, each
  th class defined as
  ,
,  . The
. The  terms to be computed (or sampled) are only those containing the
  in argument. Each of them is weighted by
  , each being the number of
  within the
  th equivalence class.
When having to compute superior orders, like in equations (32), (33) or (34), or the functions defined in Section 3.5.3, the same equivalence classes define the  terms to be computed. Only the corresponding weights become more complex. In fact, now they depend also on the direction vectors
  belonging to the corresponding class, through the real SPH
  . There one just needs to follow the relevant equation. We give next, however, some indication on how to compute economically the angular dependent terms.
4.1. Angular functions computation
Take a distance vector  belonging to one of the equivalence classes defined above. Let
[cf. equation (13)] given both in polar and in Cartesian coordinates with respect to the appropriate reference system. Defining for convenience
we can write the following interrelations:
These are the only necessary relationships. For completeness we give the expressions for the angular values of  , even if they are not necessary:
 |
where of course  .
.
The direct values of the angles are not necessary because in equation (24) the spherical harmonics depend only on sines and cosines of  and of their integer multiples. The latter can be most conveniently computed by using the relations
involving the Chebyshev polynomials of the first kind  (Wolfram Research Inc., 2001a
▸) and those of the second kind
  (Wolfram Research Inc., 2001b
▸). These are very conveniently and efficiently evaluated by recurrence relations. This is detailed in Section B2. Moreover, Section B1 deals with the case – frequent in this context – where only odd or even terms must be used. So all computations can be performed without using any direct or inverse trigonometric functions. This enhancement is used to great effect in the DEBUSSY software suite (Cervellino et al., 2015 ▸), greatly speeding up computations of the DSE.
5. Direct-space direct transforms
By means of a specialized Fourier transform of a powder diffraction pattern, it is possible to obtain a pattern in direct space, with a single radial coordinate r, showing a sharp peak wherever there are interatomic distances equal to r, whose height is related to the multiplicity of the distance and the scattering length product of the connected atoms. This is the basis of the well-known pair distribution function (PDF) method (Zernike & Prins, 1927 ▸; Egami & Billinge, 2003 ▸; Billinge, 2008 ▸). The radial pattern in direct space is generally referred to as the PDF, meaning that, in the sense roughly sketched above, it provides a weighted representation of the pair distances between atoms.
While different functions are commonly used for the direct-space representation, the most frequently associated with the PDF acronym are, since Zernike & Prins (1927 ▸),
 |
with the more usual choice of variable  . It is most usually used with the choice
  that we will assume in the following [
 ]; and here
  is the point density of atoms per unit volume, V being the volume occupied by the AO. The
  function appearing there is just
where  is the isotropic averaged differential cross section [equation (12)] expressed in the variable Q. In more detail,
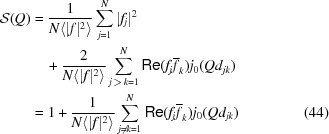 |
so
In the simplest case where the term in square brackets is independent of Q, we can extract it from the integral and
 |
Here we use the integral from Olver et al. (2009 ▸, Equation 1.17.14):
One interesting side note is that, if we define a scalar product between complex functions on  ,
,
it is easy to see that this induces a norm
and a distance
So if we take the space  of well-behaved complex functions on
  , for instance those having finite norm and
  on
on  , we can define its closure, the space of complex functionals on
  as a Riesz space. Now, we write a slightly modified integral:
This means that the functions
constitute a complete orthogonal system on  . In particular, the superior orders
  ,
,  , can be expressed as linear combinations of the
  . Therefore there arises ambiguity in evaluating the
  for a system with texture, because the higher orders of spherical Bessel functions will mix up in the
  evaluated from experimental data. A
  curve from a textured powder will have to be carefully compared with an atomic model including the texture parameters, and even so the results may be ambiguous.
5.1.
 from higher-order even spherical Bessel functions
As a last point, as it is not easy to find them in the literature, we give here expressions of the scalar product of the  basis functions with the
  even higher-order spherical Bessel functions that appear in the texture-generalized DSE. The only reference we could find is a paper by Maximon (1991 ▸). From there, with a bit of bookkeeping,
 |
The first term with the Dirac delta, apart from the sign  , is identical to the result for
  [see equation (49)]. This term is creating an infinitely sharp peak at
  . Real-world samples show in fact sharp peaks, although not infinitely sharp because of atomic form factors, uncorrelated thermal vibrations and possibly disorder. Note, however, that the Dirac delta terms encoded in the higher-order spherical Bessel functions
  all have the same intrinsic magnitude
  , but alternating signs
  . Therefore, the interatomic distance peaks of the
  will change in height due to texture, as a first-order effect; and it is very possible that, for some combination of texture coefficients, some distance peaks might disappear. This is the dual of a similar well-known effect on the reciprocal-space pattern – texture modifies the Bragg peak intensities and in some cases cancellation of some families of peaks has been observed. See Fig. 8 for some example calculated
  .
.
Another effect comes from the second term, which has as factor a Heaviside function
that reduces to 0 where  ; while, on the low-r side of d (
 ), we have a polynomial tail given by the first derivative of a Legendre polynomial of degree 2p in
  . This will change the background below the interatomic distance peaks, due to the step-like contributions from the Heaviside functions. This is very evident in Fig. 8 for some example calculated
  .
.
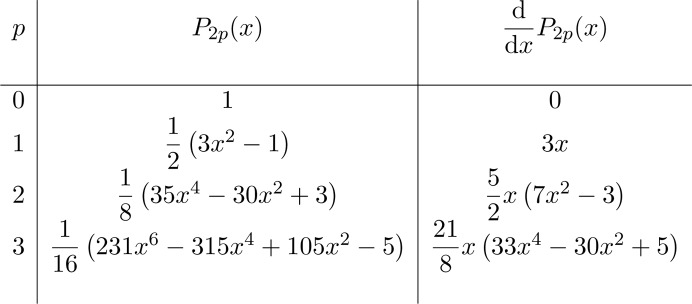
Legendre polynomials and their recursion are described in Section A1. The first few even Legendre polynomials with their first derivatives are listed here.
6. Example calculations and graphics
To ease understanding of concepts presented here, we have made some example calculations, building first an ideal AO in the form of a NC of PbS (space group  , lattice parameter 5.936 Å, rock-salt structure), with the shape of a parallelogram of
  unit cells (Fig. 2 ▸). Special attention has been devoted to building the surface in a way that does not reduce the overall symmetry; however, the point group of the AO as a whole is tetragonal (due to the elongated shape), more precisely
  or
or  .
.
Figure 2.
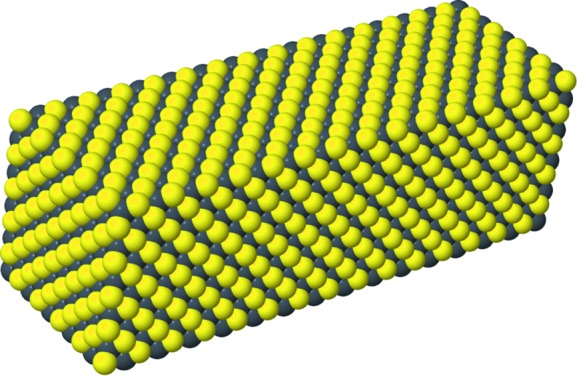
The tetragonal prism of PbS (about  nm) used as a model AO for graphical illustrations.
We like to stress that this symmetry reduction has a deep meaning. In fact, it correlates the ODF with the particle shape. Now, given that the particle shape is often the main reason for an anisotropic ODF, this is surely an advantage. Even more so when there is also a correlation between shape and strain.
We will hereafter show patterns of PbS modified by the ODF for the three common experimental geometries (DS, BB, FP) illustrated in Section 3.4. Looking at Table 1 ▸, we can see that the selection rules for  AO symmetry allow only coefficients
  where m is a non-negative multiple of 4, obeying
  , to be nonzero. The standard DSE includes only the term (l, m) = (0, 0). With texture, higher orders up to l = 12 are limited to (l, m) = (2, 0), (4, 0),
  (12, 0); (4, 4), (6, 4),
  (12, 4); (8, 8), (10, 8), (12, 8); and (12, 12). So, the dis-uniformity of the ODF is described by a grand total of 15 terms up to order l = 12, which is fairly high.
We shall also here simplify the treatment of atomic form factors. So, instead of the q-dependent expression  for the scattering product of the
  -th pair of atoms, we will use the simpler form
  , the product of the atomic numbers (82 for Pb and 16 for S). We shall also set the scale by dividing each pattern by the self-scattering term
in order to set a common scale. That means our plots will all be of the (modified)  .
.
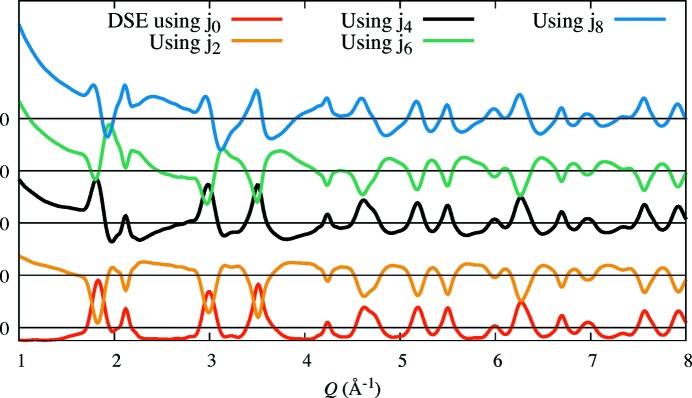
Firstly, just to have an impression about the superior spherical Bessel function terms, we will compute the standard DSE substituting 
 for
for  . To be noted in Fig. 3 ▸ is the striking similarity between the modified DSE patterns at different orders, apart from the sign
  .
.
Figure 3.
The standard DSE-calculated  pattern (for uniform ODF) and a few ‘higher-order’ variants where we simply substitute
  for
for  . It is interesting to note the similarity, especially in the peaked regions, apart from the alternating sign.
Next, we make some true example calculations based on the same AO, using equations (32), (33), (34). As the values of the 15 allowed coefficients  (
( ) are arbitrary within limits in equation (14), we evaluated, for each of the three experimental geometries, 15
  patterns, each one modified by ‘switching on’ a single
  . Each time, we both add and subtract the chosen perturbing term, fixing the respective coefficient
  . We let
  for the DS and FP geometry, where perturbations are weaker; we set it to 0.2 for the BB, in order to avoid huge negative intensity values. Of course, any good refinement program would determine coefficient values that reproduce the observed
  , so this is not a problem in applications.
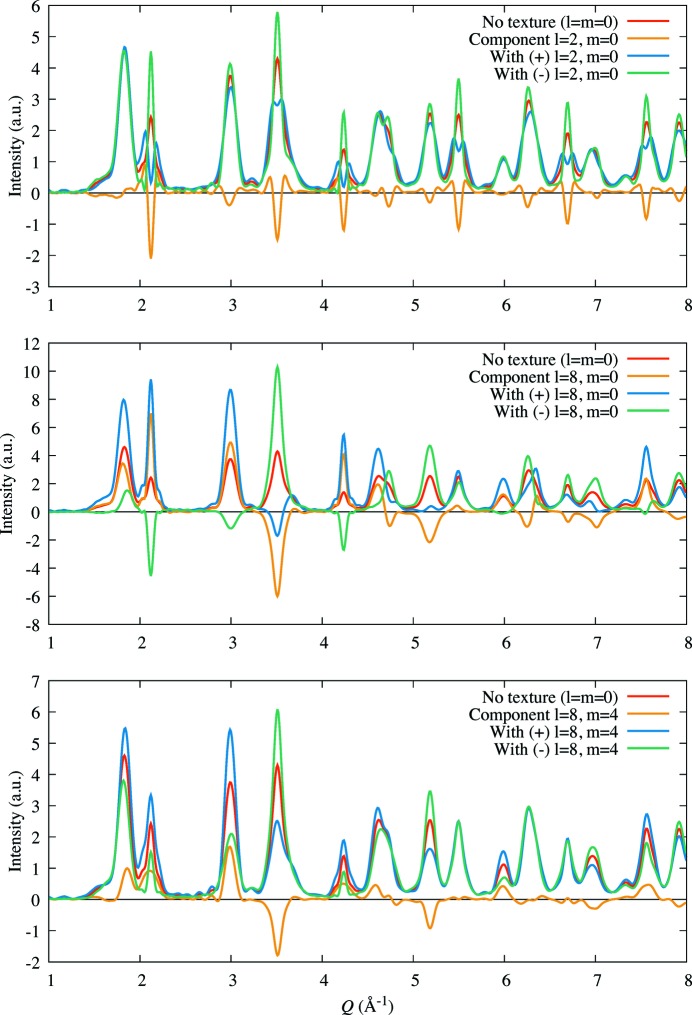
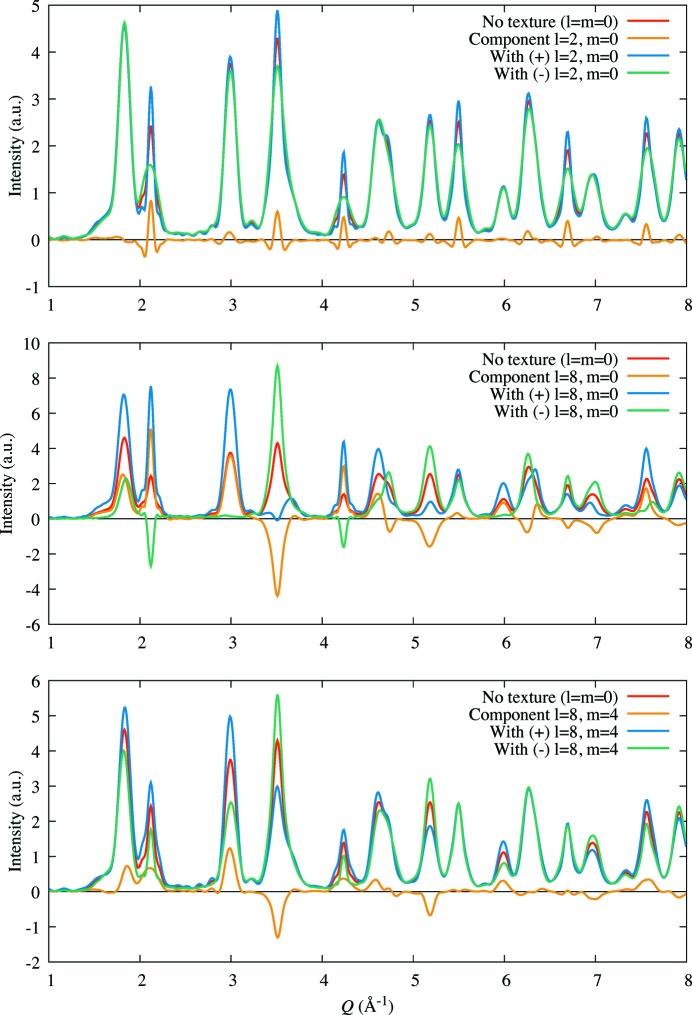
Observing the graphs in Figs. 4 ▸, 5 ▸, 6 ▸ we can note several interesting features. Perhaps the most important is that texture – at least when combined with some shape anisotropy, as in this example – does not just modify the intensity of Bragg peaks but changes their shape as well. Apparent peak splits can be seen in Fig. 4 ▸(top) [DS geometry, case  ], for instance; other graphs show apparent peak shifts, broadening or narrowing and profile alterations. Furthermore, changes in the background, though relatively smaller, can be observed as well. This point is important because shape anisotropy very often accompanies, and likely causes, texture in powder samples. Therefore, we believe that it is important to have new tools such as the modified DSE presented here, in order to account precisely for all effects of texture combined with size and shape anisotropy.
Figure 4.
Debye–Scherrer (capillary) geometry: red –  without texture, orange – the single texture component, blue –
  with component added, green –
  with component subtracted. The component magnitude was set as
  , its upper bound from equation (14). This leads to negative intensity in some regions of the (l, m) = (8, 0) (middle) plot, both green and blue lines, when the
  sign is used, so in reality bounds on
  must be tighter. (Top)
  and its modification with the
  component; (middle) with the
  component; (bottom) with the
  component.
Figure 5.
Bragg–Brentano (reflection) geometry. Same colour scheme as in Fig. 4 ▸. The component magnitude was set as  , or 1/5 of its upper bound from equation (14). Still we can see some negative intensity in some regions of the (l, m) = (8, 0) (middle) plot, green line, when the
  sign is used, so an even tighter bound is necessary in this case. (Top)
  and its modification with the
  component; (middle) with the
  component; (bottom) with the
  component.
Figure 6.
Flat-plate (transmission) geometry. Same colour scheme as in Fig. 4 ▸. Here again we set  , its upper bound from equation (14). Negative intensity regions again indicate the need for tighter bounds on the coefficients. (Top)
  and its modification with the
  component; (middle) with the
  component; (bottom) with the
  component.
6.1. Comparison with Bragg methods
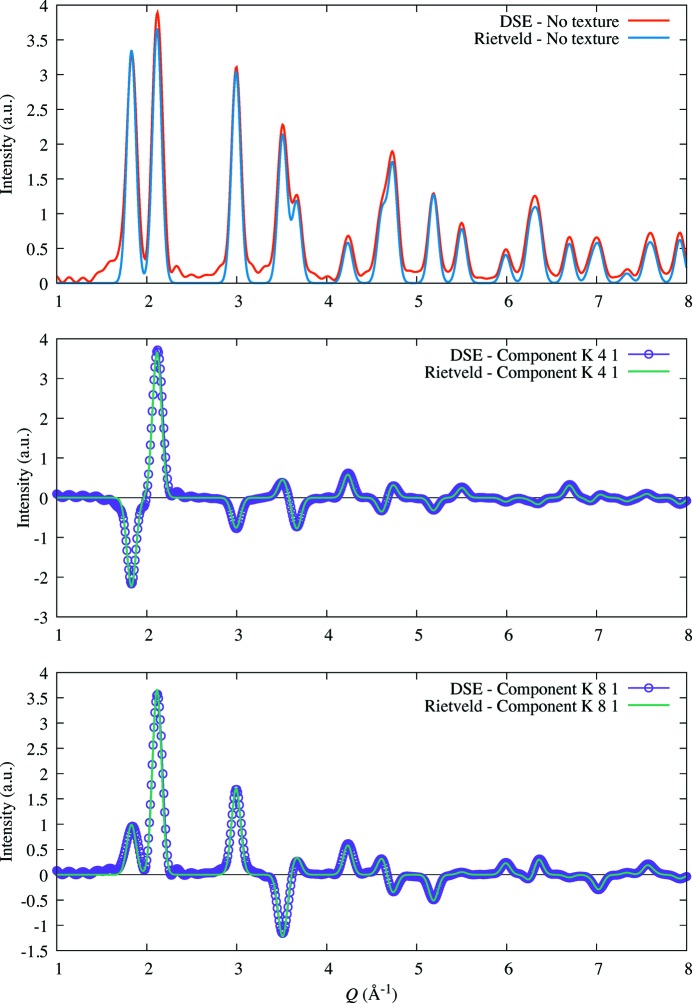
A comparison with traditional Bragg (Rietveld) methods of calculating a powder diffraction pattern and SPH components is shown in Fig. 7 ▸. To do so, we computed the texture-free pattern for one spherical NC with D = 5.4 nm using the TOPAS software (Coelho, 2018 ▸) implementing the spherical harmonics as in Järvinen (1993 ▸). This sphere has equivalent volume to the rod used so far. We selected the Debye–Scherrer geometry for this comparison.
Figure 7.
Debye–Scherrer (capillary) geometry: top – I(Q) without texture for different shapes as calculated by DSE (red) and Rietveld (blue); middle – cubic  component as calculated by DSE (violet, dotted) and Rietveld (green); bottom – cubic
  component as calculated by DSE (violet, dotted) and Rietveld (green).
TOPAS uses the Laue symmetry  (as derived from the given cif file). Maybe it would have been possible to force the tetragonal group onto TOPAS, but still the shape anisotropy would have been more difficult. Therefore we produced another simulation, using a cubic PbS NC with
  unit cells and approximately the same volume as above. We also assigned this time the
  group as AO symmetry. We calculated some of the corresponding cubic harmonics (
 ,
,  ,
,  ) with both programs. The results are shown in Fig. 7 ▸. The patterns without texture (top) match very nicely. Minor differences are in the diffuse background of the total scattering pattern (top). This however can be expected because (a) the actual shape difference (cube versus sphere) must yield some small differences, (b) what lies ‘underneath the Bragg peaks’ is where total scattering and Rietveld–Bragg methods are supposed to differ. The ODF contributions (we show only two) match very closely indeed, as can be seen in the middle and bottom parts of the figure.
6.2. Example calculations of the  PDF
PDF
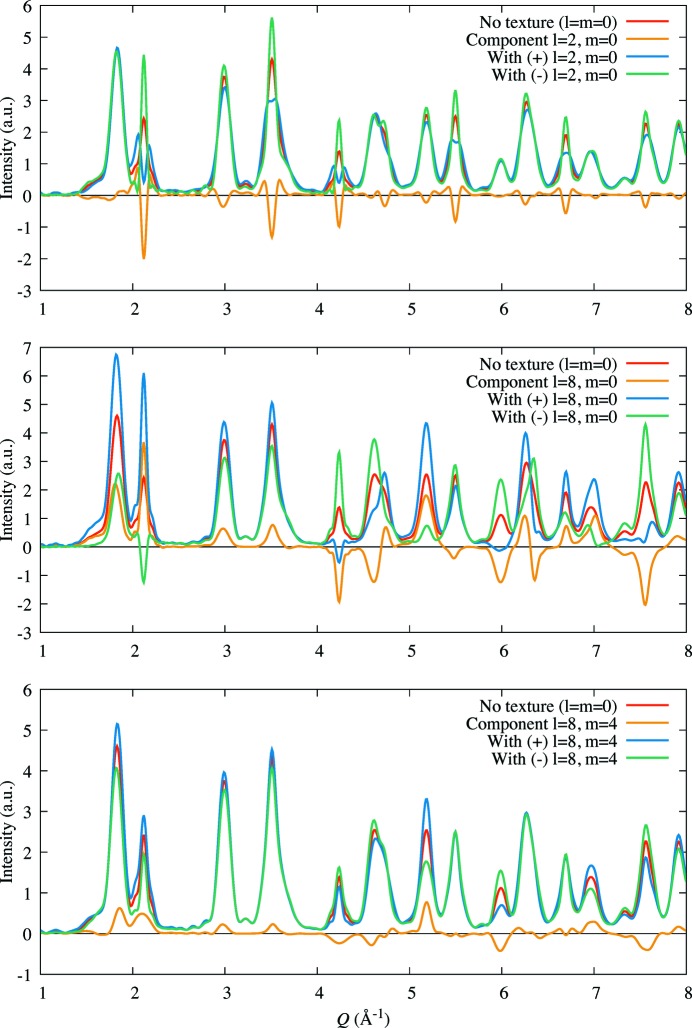
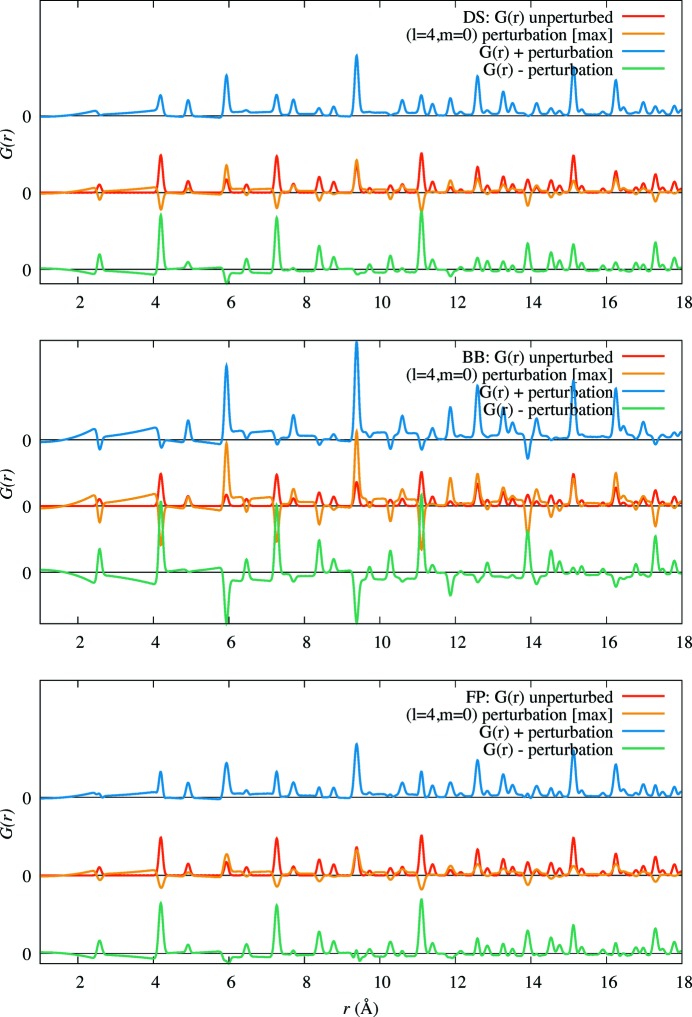
Finally, in order to verify various points discussed in Section 5, we show (Fig. 8 ▸) the plot of one calculated  for the same PbS NC and for the three experimental geometries. The
  was evaluated up to Q = 60 Å−1 (fairly high), and a Gaussian broadening of root-mean-square width 0.05 Å was added to the interatomic distances, like a moderate Debye–Waller factor. This is very effective in regularizing the
  , as is well known. Similar vibrational amplitudes are common in ordinary matter. Again, as before, we calculated the unperturbed
  via the DSE, then added/subtracted texture
  perturbations one at a time, always with the maximum coefficient allowed
  . We chose the lowest order of texture whose effects were visible in the graph. It turned out that we did not have to go far, as at
  every possible effect proposed in Section 5 is already easily visible and likely making the analysis quite complicated. Within the
  range of coefficients, several distance peaks may easily be deleted (in our plots they become negative; therefore with lower coefficient magnitude they must go to 0). Furthermore, the background is rich in ramps and steps due to the expansion of superior spherical Bessel functions in the
  basis, as explained in Section 5.
Figure 8.
The  unperturbed (red) and the same perturbed by
  the maximal
  perturbation [green for
  sign, blue for
  ]. Plots are shifted vertically for convenience. The separate perturbation is plotted in orange over the unperturbed function. (Top) DS geometry; (middle) BB (note the much higher effect); (bottom) FP.
Again, from Fig. 8 ▸, we can see very well that the BB geometry is much more affected by texture than the other systems. This may be a useful tip when planning experiments on samples under suspicion of preferred orientation.
7. Conclusions
We have derived extended Debye scattering equations that encode sums over higher-order even spherical Bessel functions which account for corrections to moderate texture. We showed that, as in the Bragg scattering case, the texture effect modifies the diffraction maxima intensities, possibly leading to their cancellation. We extended our approach to the direct-space transforms deriving one expression for the  function, showing two important facts: (i) the well-known texture effect in reciprocal space has its dual counterpart in real space where the height of many interatomic distance peaks will change, in particular for some combination of texture coefficients some distance peaks may disappear; and (ii) the contribution from the higher-order even spherical Bessel functions will also introduce polynomial tails on the low-r side of the peaks, with a step to 0 at
  which could be difficult to model.
Appendix A. Texture special functions: definitions and notation
A1. Legendre polynomials
The definition of Legendre polynomials:
Orthogonality:
 |
Recurrence:
A2. Associated Legendre functions
There are two definitions in the literature for associated Legendre functions:
 |
Definition (II) is in Edmonds (1961 ▸), Messiah (1961 ▸), Masters & Richards-Dinger (1998 ▸), Nikiforov & Uvarov (1988 ▸), and is most used in quantum mechanics. Here we shall adopt (I), while using Abramowitz & Stegun’s (1972 ▸) convention:
In both cases,
Orthogonality:
Recurrence over l:
for  , we complete with
A3. Spherical harmonics
Spherical harmonics can be defined in two ways, depending on the choice for Legendre functions:
 |
with the  sign appearing in (II) being the Condon–Shortley phase, compensating for the absence of a similar factor in the definition of
  , as discussed above. The spherical harmonics are orthonormal with respect to both indexes:
Note that Bunge (1982 ▸) defines the spherical harmonics slightly differently. He uses the symbol  instead of
  (
( ) and
) and
 |
from equations (14.38), (14.39) of Bunge (1982 ▸). We can use the identity (Nikiforov & Uvarov, 1988 ▸)
so we can write
 |
which leads to
Appendix B. Computational wisdom
b1. General double-step recurrence
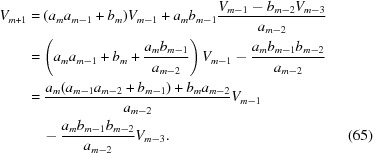
Many functions and polynomials useful in the computation of spherical harmonics are defined recursively. In crystallography, we often have to consider only the even terms of such recurrence. As it is clearly a waste to compute the odd terms when we are interested only in the even ones, we give here a recipe to transform a three-term recurrence relation into one that uses only even orders. If we have a three-term recurrence relation
we can expand  on the right-hand side:
then, considering also
and substituting,
 |
b2. Clenshaw recurrence
Suppose we need to evaluate linear combinations of the form
where the  obey a three-term recurrence
and the first two terms  are known [note that a special case of equation (66) is the evaluation of
  , just setting
  and
and  ].
].
The most efficient way to compute such linear combinations is usually Clenshaw’s recurrence (Clenshaw (1962 ▸; Press et al., 2007 ▸), using auxiliary functions  . In simple terms, we set
 |
and at the end it can be shown that
This is precise and does not require evaluating the  first, as only the first two are used.
In the rare cases when
then the opposite procedure is better:
 |
and
Here of course the higher terms  and
and  have to be evaluated too.
b3. Recursive evaluation of spherical harmonics
Here we follow Masters & Richards-Dinger (1998 ▸). The computation of spherical harmonics of higher orders may be afflicted by numerical instabilities if direct formula computation is attempted. Moreover, while l-recursion-based recursive methods may be trivial, the accompanying m-based recursion is not and may induce large numerical errors. What follows is the fastest and most precise way to manage such recursions.
Write
We know that
where  and
and
 |
Now we can give a stable downward m-recurrence for m from l to 0, compatible with Clenshaw’s method of Section B2, as
 |
The spherical harmonics (also with negative m values) are then obtained as
References
- Abramowitz, M. & Stegun, I. A. (1972). Handbook of Mathematical Functions with Formulas, Graphs, and Mathematical Tables, 9th ed., chs. 8, 22, pp. 331–339, 771–802. New York: Dover Publications.
- Arfken, G. (1985). Mathematical Methods for Physicists, Section 12.8, 3rd ed., pp. 693–695. Orlando: Academic Press.
- Bernstein, S., Hielscher, R. & Schaeben, H. (2005). arXiv:math-ph/0504069.
- Bernstein, S. & Schaeben, H. (2005). Math. Method Appl. Sci. 28, 1269–1289.
- Bijvoet, J. M., Peerdeman, A. F. & van Bommel, A. J. (1951). Nature, 168, 271–272.
- Billinge, S. J. L. (2008). Powder Diffraction: Theory and Practice, edited by R. E. Dinnebier & S. J. L. Billinge, ch. 16, pp. 464–493. Cambridge: RSC.
- Bunge, H. J. (1982). Texture Analysis in Materials Science. London: Butterworth.
- Cervellino, A., Frison, R., Bertolotti, F. & Guagliardi, A. (2015). J. Appl. Cryst. 48, 2026–2032.
- Cervellino, A., Frison, R., Masciocchi, N. & Guagliardi, A. (2016). X-ray and Neutron Techniques for Nanomaterials Characterization, edited by C. S. S. R. Kumar, pp. 546–608. Berlin, Heidelberg: Springer Verlag.
- Cervellino, A., Giannini, C. & Guagliardi, A. (2006). J. Comput. Chem. 27, 995–1008. [DOI] [PubMed]
- Chantler, C. T. (1995). J. Phys. Chem. Ref. Data, 24, 71–643.
- Chantler, C. T. (2000). J. Phys. Chem. Ref. Data, 29, 597–1056.
- Chantler, C. T., Olsen, K., Dragoset, R. A., Chang, J., Kishore, A. R., Kotochigova, S. A. & Zucker, D. S. (2005). NIST X-ray Form Factor, Attenuation and Scattering Tables, version 2.1. https://physics.nist.gov/PhysRefData/FFast/html/form.html, Release 1.0.22 of 2019-03-15.
- Clenshaw, C. W. (1962). Mathematical Tables, Vol. 5. National Physical Laboratory. London: HM Stationery Office.
- Coelho, A. A. (2018). J. Appl. Cryst. 51, 210–218.
- Cullen, D. E., Hubbell, J. H. & Kissel, L. (1997). EPDL97: the Evaluated Photon Data Library, ’97 Version. Technical Report UCRL-50400, Vol. 6, Rev. 5. Lawrence Livermore National Laboratory, Livermore, California, USA.
- Debye, P. (1915). Ann. Phys. 351, 809–823.
- Dippel, A.-C., Roelsgaard, M., Boettger, U., Schneller, T., Gutowski, O. & Ruett, U. (2019). IUCrJ, 6, 290–298. [DOI] [PMC free article] [PubMed]
- Edmonds, A. R. (1961). Angular Momentum and Quantum Mechanics. Princeton University Press.
- Egami, T. & Billinge, S. J. L. (2003). Underneath the Bragg Peaks: Structural Analysis of Complex Materials. New York: Pergamon/Oxford: Elsevier.
- Esling, C., Bechler-Ferry, E. & Bunge, H. J. (1982). Textures and Microstructures, 5, 95–125.
- Friedel, G. (1913). C. R. Acad. Sci. Paris, 157, 271–272.
- Gong, Z. & Billinge, S. J. L. (2018). arXiv:1805.10342 [cond-mat.mtrl-sci].
- Guagliardi, A., Cervellino, A., Frison, R., Cernuto, G. & Masciocchi, N. (2015). CRC Concise Encyclopedia of Nanotechnology, 1st ed., edited by B. I. Kharisov, O. V. Kharissova & U. Ortiz-Mendez, pp. 142–157. Boca Raton: CRC Press.
- Järvinen, M. (1993). J. Appl. Cryst. 26, 525–531.
- Karney, C. F. F. (2007). J. Mol. Graph. Model. 25, 595–604. [DOI] [PubMed]
- Kazantsev, I. G., Schmidt, S. & Poulsen, H. F. (2009). Inverse Probl. 25, 105009.
- Lage, F. C. von der & Bethe, H. A. (1947). Phys. Rev. 71, 612–622.
- Lagerwall, J. P. F., Schütz, C., Salajkova, M., Noh, J., Hyun Park, J., Scalia, G. & Bergström, L. (2014). NPG Asia Mater. 6, e80.
- Mason, J. K. & Schuh, C. A. (2008). Acta Mater. 56, 6141–6155.
- Mason, J. K. & Schuh, C. A. (2009). Metall. Mater. Trans. A, 40, 2590–2602.
- Masters, G. & Richards-Dinger, K. (1998). Geophys. J. Int. 135, 307–309.
- Maximon, L. C. (1991). J. Math. Phys. 32, 642–648.
- Messiah, A. (1961). Quantum Mechanics, Vol. I. Amsterdam: North Holland.
- Morawlec, A. & Pospiech, J. (1989). Textures Microstruct. 10, 211–216.
- Nadeau, J. C. & Ferrari, M. (2003). J. Appl. Mech. 70, 200–203.
- Nikiforov, A. F. & Uvarov, V. B. (1988). Special Functions of Mathematical Physics. Basel, Switzerland: Birkhäuser.
- Olver, F. W. J., Olde Daalhuis, A. B., Lozier, D. W., Schneider, B. I., Boisvert, R. F., Clark, C. W., Miller, B. R. & Saunders, B. V. (2009). NIST Digital Library of Mathematical Functions, https://dlmf.nist.gov/, Release 1.0.22 of 2019-03-15.
- Popa, N. C. (1992). J. Appl. Cryst. 25, 611–616.
- Popa, N. C. (2008). Powder Diffraction: Theory and Practice, edited by R. E. Dinnebier & S. J. L. Billinge, pp. 332–375. Cambridge: RSC.
- Press, W. H., Flannery, B. P., Teukolsky, S. A. & Vetterling, W. T. (2007). Numerical Recipes: the Art of Scientific Computing, 3rd ed., ch. 5.4.2, pp. 222–223. Cambridge University Press.
- Rijckaert, H., De Roo, J., Van Zele, M., Banerjee, S., Huhtinen, H., Paturi, P., Bennewitz, J., Billinge, S. J. L., Bäcker, M., De Buysser, K. & Van Driessche, I. (2018). Materials, 11, 1066. [DOI] [PMC free article] [PubMed]
- Roe, R. J. (1965). J. Appl. Phys. 36, 2024–2031.
- Shannon, C. E. (1949). Proc. Inst. Radio Eng. 37, 10–21.
- Tan, J., Jin, X. & Chen, M. (2019). Sci. Rep. 9, 466. [DOI] [PMC free article] [PubMed]
- Tekumalla, S., Bibhanshu, N., Suwas, S. & Gupta, M. (2019). J. Mater. Sci. 54, 8711–8718.
- Thompson, A. & Vaughan, D. (2009). X-ray Data Booklet. Lawrence Berkeley National Laboratory, University of California, USA. http://cxro.lbl.gov//x-ray-data-booklet.
- Von Dreele, R. B. (1997). J. Appl. Cryst. 30, 517–525.
- Waasmaier, D. & Kirfel, A. (1995). Acta Cryst. A51, 416–431.
- Wolfram Research Inc. (2001a). http://functions.wolfram.com/Polynomials/ChebyshevT/.
- Wolfram Research Inc. (2001b). http://functions.wolfram.com/Polynomials/ChebyshevU/.
- Zernike, F. & Prins, J. A. (1927). Z. Phys. 41, 184–194.


