Abstract
We describe an implementation of a pilot integration to embed SDoH-based data visualizations into the EHR in real time for clinical staff treating children with asthma.i
Introduction
Increasing attention has been given to the complex role of Social Determinants of Health (SDoH) in determining the overall health of individuals1. SDoH cover environmental and social factors outside of the clinical context, and are defined as “The complex, integrated, and overlapping social structures and economic systems that are responsible for most health inequities. These social structures and economic systems include the social environment, physical environment, health services, and structural and societal factors.”2 Given that SDoH may have a more powerful effect on health than clinical care3, providing clinicians access to patient-centric SDoH information in real-time and embedded in existing clinical workflows is critical4.
SDoH data are a varied set of attributes measured at differing units of observation. Attempting to draw causal inferences from such data is risky. While there may be an association between a person’s income and their condition, trying to assert associations between a general region’s average income level and a specific patient’s condition is suspect5,6. More specifically, when looking at our use case of pediatric asthma, air quality may be measured by sensors spread over a few locations within a region. While air quality may affect asthma, using such broad measures to make assertions about individuals and their specific condition runs the risk of ecological fallacy. Further, disentangling the interactions between observations of SDoH data measured at different units of analysis can be difficult7.
And yet, a clinician facing a child struggling to breathe may well find it useful to know that regional air pollution or pollen levels have been unusually high in the past few weeks. While it may be an abuse of statistical inference to draw causal assertions or to posit physical mechanisms linking a population-based measure of SDoH and a clinical outcome, the clinician may be able to take the clinical data and their understanding of the patient, and mix in insights from the non-clinical data to develop a better plan of care for this patient. Even better would be to add much more proximate measures of SDoH applicable to that particular patient, so that the clinician could make specific recommendations for change. If having a tobacco smoker in the house is exacerbating a child’s asthma, educating the family about the risks of smoke and asking them to keep smoking outside of the home could benefit the child.
Ideally, health care providers would benefit from access to multiple levels of SDoH data that are relevant to a person’s condition. These data should be easy to access and interpret, and their access should not disrupt the clinical workflow or pose an onerous burden on clinical staff or patients and their families.
We have piloted an approach to this problem of data access and presentation to determine the feasibility of presenting timely information in the clinical setting. As a pilot, we focused on the technical and clinical implementation issues, but we have been collecting some information on outcomes. However, to actually determine the effect of our data platform system on asthma outcomes, we will need to conduct a much more rigorous and long- term study. So here we focus on the implementation.
Asthma is one of the most prevalent chronic diseases in children, a significant financial burden to the U.S. health care system and source of lost days at school and at work (parents)8,9. It is exemplified by a variety of phenotypes and its severity is exacerbated by both clinical and non-clinical determinants. The various phenotypes are not only dependent on the patient’s age, gender, or genetics, but also on their environmental exposures, including indoor and outdoor air pollutants and allergens. Community-level surveillance using socio-economic factors and demographic data has been useful in the management of pediatric asthma patients10. To date, though, access to recent community- level surveillance data about a specific patient’s environment has been unavailable during examinations at the clinics. Thus, for this project, called Breathe Austin, we planned to create a proof of concept technical platform to be used at the point of care that aggregates and calculates a personalized set of environmental indicators for asthmatic events based on real-time social and environmental determinants data. These environmental indicators and their underlying data, are displayed to the clinician at the point of care for review during the clinical decision-making process. After the data capture phase of the project, we will evaluate the system’s acceptance by the patients’ parents and their healthcare providers.
Methods
Breathe Austin was designed as a pilot study to assess whether it is feasible to create (and to a lesser degree, if there is a benefit in presenting) a real-time SDoH data visualization portal presented in the EHR at the point of care, specifically for the care of pediatric asthma. The data visualization portal provides SDoH data combined with clinical data in order to display additional information to the health care provider as they assess a child with pediatric asthma. We partnered with a local clinic to focus on pediatric patients (from 0 to 17 years of age) with recent diagnoses related to asthma. The original intent was to build the data visualization inside the EHR, but as we worked closely with our clinical partner it became apparent that this was not the best way to approach this. As will be described below, the system we built for the project is more portable and scalable than customization of a single EHR.
Platform Design
The platform we piloted has several components: 1) ongoing collection of regional SDoH information, 2) collecting patient-specific SDoH information and clinical information at the time of care, 3) presenting the data visualization within the EHR at the point of care based on the two sets of SDoH data combined with clinical information, 4) managing the consenting process for the research study, and 5) collecting information on the use and usability of the platform. The first three compose the clinical process of SDoH data visualization, while the last two are necessary for the research aspects of this pilot.
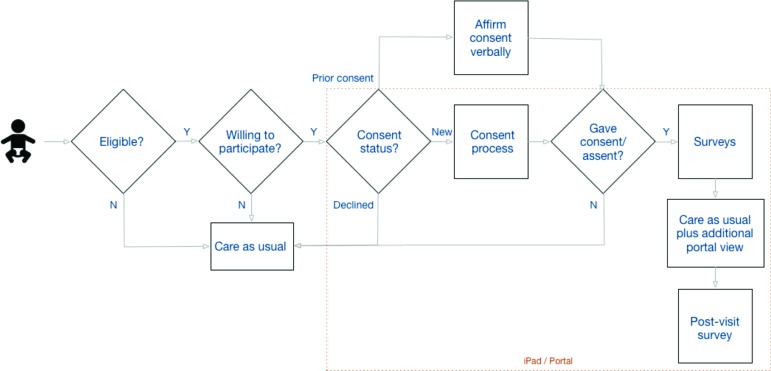
The clinical workflow for this study is presented in Figure 1. Because this was an IRB-approved research study, additional steps occur in the process for consenting and collecting data for evaluation. The core set of clinical steps are captured in the stack of boxes on the far right, with the rest describing the consenting steps.
Figure 1.
Clinical Workflow for Data Visualization
A list of eligible patients is presented to the Medical Assistant (MA), either during their review of the upcoming daily cases or when a patient arrives for a previously unscheduled visit. If an MA identifies a pediatric patient with asthma as a potential study participant, they inform the patient about the study, and ask if they would like to participate. If the patient and family/legally-authorized-representative are willing, they are consented. The presentation of the three consent forms is done via tablet. The parent is provided with a combined consent for their own (answering questionnaires) and their child’s (data-sharing) participation, followed by a HIPAA data sharing authorization. If the child is old enough (aged seven or older), they are presented with one of two versions of an age- appropriate assent form.
To ensure that the tablet is collecting information on the correct patient, we create a session-sharing process between the tablet and the patient list from the EHR. When the MA starts the patient consent and questionnaire process on the tablet, they are presented with a randomly-generated code. The MA enters the code into the portal within the EHR, with a response view presenting a second randomly-generated code. The MA is asked to confirm that this code is the same as the one which now appears on the tablet. If confirmed, the tablet is connected to the correct patient information within the portal and a shared session has been established. As we will discuss below, all communications between systems are sent over encrypted (e.g., HTTPS/TLS) channels.
When a previously or newly consented pediatric asthma patient presents to clinic, as part of clinical care the child’s symptomatology from both the parent’s and child’s (depending on the child’s age) perspectives, will be collected using previously validated asthma questionnaires (either the Asthma Control Test [ACT, http://www.memphischildrens.org/Asthma_Control-12-and-older.pdf. Accessed August 14, 2019] or the Test for Respiratory and Asthma Control in Kids [TRACK, http://www.memphischildrens.org/Asthma_Control-12-and- older.pdf. Accessed August 14, 2019]) presented on the tablet. At the same time, the indoor air quality of the patient’s primary home will also be assessed using a simplified questionnaire filled out by the parent. This questionnaire (presented in the appendix) was developed with guidance from clinical experts in pediatric asthma, but has not been validated.
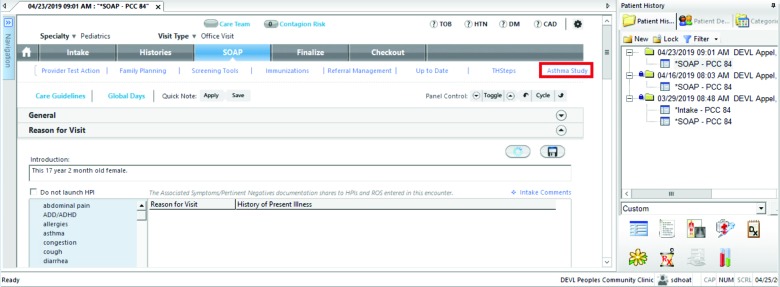
The clinic’s EHR (NextGen) was customized with one modification so that when a health care provider sees the patient during the clinic visit, an additional tab, “Asthma Study”, is available whenever the study participant’s patient’s chart is accessed (see Figure 2; all images were collected on a test system using test data). Selecting the tab establishes a ReST API connection to the data platform web site, with the response contents presented in the tab’s screen. The patient’s address is sent to the data platform, so the geo-location is matched with the nearest sources of SDoH information. When a provider clicks on this tab, a secure (HTTPS) connection is established to the data platform, the patient information and the SDoH data are processed, the results are sent back, and the EHR displays for the provider a data visualization dashboard relevant to that patient. The dashboard will display SDoH data visualizations and flags that can affect asthmatic patients. Note that while the dashboard is viewed inside the EHR, its contents have been created on the Breathe Austin study platform.
Figure 2.
EHR-embedded Access to the Data Visualization
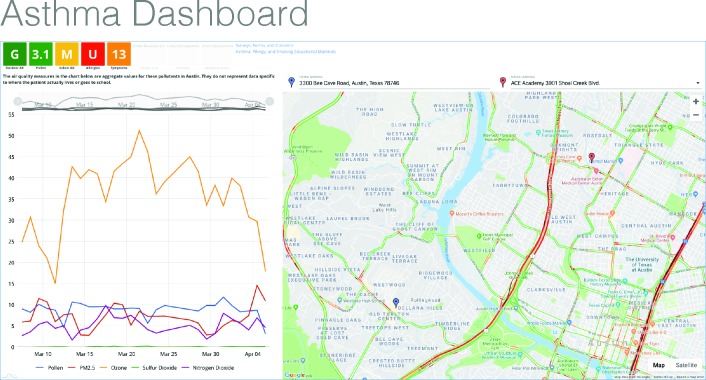
The SDoH visualization dashboard (see Figure 3) has three main areas of visualization: summary scores for the SDoH data, a graph of recent trends in the data, and a map locating the child within the local region.
Figure 3.
Asthma Dashboard View
First, the boxes on the upper left display summary score indicators based on the following:
-
Outdoor Air Quality (EPA)
∘ Ozone, particulate matter (PM2.5), nitrogen dioxide (NO2), sulfur dioxide (SO2)
-
Pollen (local sensors)
∘ Pollen levels
-
Indoor Air Quality (parental questionnaire)
∘ Smoker present, dampness, mold, allergens, dust mites, cockroaches, cats, dogs, rats/mice
-
Allergies (parental questionnaire)
∘ Allergy testing
-
Symptom control (ACT/TRACK)
∘ Overall control score
While a summary score or indicator is provided in each box, which serves as a drilldown link for more detailed information, we present the box in a typical red/yellow/green visualization to indicate whether the drilldown might contain useful information. Green indicates that the information should not be concerning for an asthmatic, while red indicates that the details might be useful for designing a care plan. The goal is to make the decision whether to drilldown convenient using the colored flags in the visualization dashboard, though the score is always available to an interested health care provider.
Second, the dashboard displays time-series trends on the outdoor air quality measures in the graph on the lower left. The health care provider can quickly assess if recent changes might be associated with the child’s current condition.
Third, we map the latitude and longitude of the patient’s primary residence (blue marker) and school (red marker, optionally collected within the dashboard from a dropdown list). The map allows the provider to assess the proximity of the patient’s home or school to roads (traffic), industrial plants, power generation, or other risks as well as open space. For example, the two highways which the map indicates in this figure as having heavy traffic at the moment may be areas of high vehicle exhaust.
Drilling down on one of the indicators provides more detailed information, as shown in Figure 4 for outdoor air quality. The outdoor air quality agents are implicated in clinical and environmental studies on asthma in children as potential aggravators in the exacerbation of asthmatic symptoms. The agents all have individual effects and also appear to have synergistic and/or additive effects. However, as noted in the introduction, many of these known associations have been shown only at the population level. Relative indicators are calculated for outdoor air quality for pollutants based on the U.S. Environmental Protection Agency’s (EPA) Air Quality Index (AQI, https://www.airnow.gov/index.cfm?action=aqibasics.aqi. Accessed August 14, 2019.). The AQI is provided by the EPA from monitors for U.S. latitudes and longitudes (https://www.epa.gov/outdoor-air-quality-data.
Figure 4.
Outdoor Air Quality Detail View
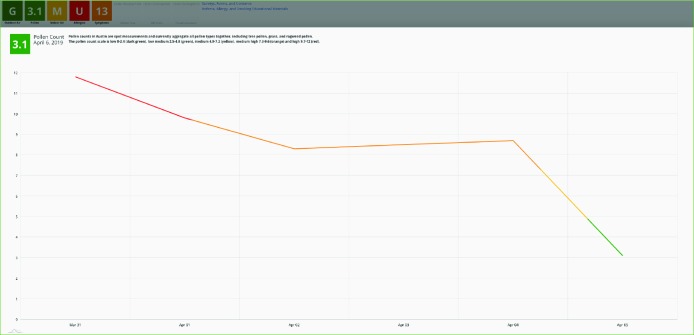
Should the health care provider decide to drill down for more detail on pollen levels, they would see the view shown in Figure 5. While pollen levels on the day of the visit were low, note that they had recently been higher, even reaching high levels (red part of the line). For the purposes of the feasibility pilot, we chose not to break this down by type of pollen, though that may be a next step for actual clinical use.
Figure 5.
Pollen Levels Detail View
To summarize, health care providers who access the dashboard via the embedded EHR tab are presented with both real-time and retrospective SDoH data on outdoor and indoor air quality and patient allergies. The dashboard displays aggregate indicators, and health care providers can drill down into specific data by clicking on each icon. Trend data of key pollutants and map data, as above, are also available. The intent is to provide relevant environmental and allergy data that are not currently available in the EHR that health care providers can use to educate, inform, and manage their pediatric asthma patients and their families.
To evaluate the data platform’s effectiveness, at the beginning and end of the study, we will be conducting study surveys of various types of participants. The pre-study clinician questionnaire was done to get feedback about the current available data before the dashboard is introduced. The post-study clinician questionnaire will assess the clinicians’ perceived utility of the additional SDoH information to the clinical evaluation of the patient. After each visit, we will also be conducting a post-visit survey of the parents to get their feedback about the impact of the intervention on their child’s asthma management. And we will conduct a post-study questionnaire of the MAs to determine the impact on clinical workflow.
Data Architecture
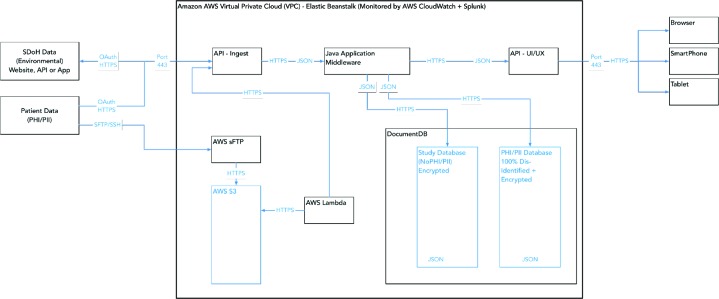
The data architecture for the Breathe Austin’s pediatric asthma portal is designed and implemented to protect personal health information (PHI/PII) in transit over networks and the Internet, as well as at rest in the database. Figure 6 illustrates the Breathe Austin Study data platform as implemented on Amazon Web Services (AWS) within Virtual Private Clouds (VPC). VPCs are secure private networked environments in AWS.
Figure 6.
Pediatric Asthma Portal AWS Asthma Study Infrastructure
There are two types of data utilized in the study. The first is SDoH data, which consist of environmental information from public sources. The second is PHI/PII patient-specific data from the clinic’s NextGen EHR as well as patient- specific data collected through the course of the study (e.g., ACT/TRACK results). The two types of data are maintained in separate databases, with the patient-specific data accessible only to clinic users through the Breathe Austin application user interface (UI) and system administrators. The PHI/PII patient-specific demographic data are securely uploaded to the system via a CSV-formatted demographics file over sFTP (Secure File Transfer Protocol using the SSH protocol) to AWS. Within AWS, the file is encrypted and stored on a secure file storage system known as Amazon S3. Authentication between servers and services is performed internal to AWS and all data are encrypted (HTTPS) in transit within the AWS environment.
When the file lands in S3, an AWS Lambda script detects the presence of the new file and sends the file, securely within AWS, to a data ingest API (Application Programming Interface). The data-ingest API parses the data, dis- identifies that data, then formats the data as JSON objects which are encrypted and stored in an AWS DocumentDB NoSQL database. The data are stored dis-identified and are encrypted at rest within the database for additional privacy controls. As shown in the figure, the separate types of data within a person’s record are each encrypted with a separate, unique high-grade encryption key (AES) before being stored in the database. The data are secure at rest.
As stated above, patient-specific protected data are available only through the Breathe Austin application interface and can only be accessed by clinic staff who have controlled access rights. Users must be authenticated by logging securely into the Breathe Austin application, or through single sign-on (SSO) through NextGen. Data in storage are encrypted and dis-identified.
Data are dis-identified by the ingest API, stored in the DocumentDB JSON database dis-identified, and are only re- identified in the secure Java application middleware running inside the Amazon AWS Asthma Study Virtual Private Cloud (VPC). That re-identification supports MAs and clinicians in consent and clinic workflow, for display of the asthma dashboard, and the collection of survey data. Survey data that comes back from the UI (User Interface) on clinic computers or tablets is also dis-identified and encrypted. Therefore, all patient-specific data, including those containing PHI/PII as well as demographics or survey data, are protected, dis-identified and stored as encrypted files.
Results
The system we originally envisioned changed as we worked with our clinical partner to implement a data- visualization platform that could be presented within the EHR as part of the existing clinical workflow. Rather than customize the EHR to present the visualization directly, we embedded in the EHR a tab providing a link to our data platform’s visualization views. The decision was made in response to the difficulty we faced in getting modifications to the EHR. But with hindsight, this was a fortuitous choice because it allows us to more easily develop the platform as EHR-agnostic and easily to be adapted to a different EHR system.
We will be collecting performance, usage, and usability study through the end of the year. Initial anecdotal feedback has been both positive and negative. The clinicians have suggested that the visualizations are useful information that they can use in their decision-making process. The MAs have found the consenting part of the study onerous. We are, at the moment, seeking approvals to add additional staff on-site to better assist with this process. We will be paying close attention to the perceived distinction between the platform as a research study and as a potential clinical tool.
Conclusion
We have described a data platform system that we developed to present SDoH information, collected about the locality and from the patient, to health care providers as a part of their routine clinical workflow using the EHR system to which they are accustomed. With an ever-increasing appreciation of the role of SDoH in affecting health outcomes, we believe this is the first implementation of a system that seamlessly delivers patient-specific SDoH data into a provider’s EHR without significant disruption of the clinical workflow. The system will improve our understanding of how to use SDoH data, particularly environmental data, in clinical settings for management of chronic conditions like pediatric asthma.
Appendix: Indoor Air Quality Questionnaire
This questionnaire was presented to patients via tablet to assess any potential conditions or triggers in the home that might be useful information for the clinical staff as they interact with a child with asthma.
The purpose of this survey is to learn about the indoor air quality that your child is exposed to at home or school. Your child’s doctor may use this information to better manage your child’s health.
1. Does anyone in any of the homes your child lives in, or the cars they ride in, smoke cigarettes, or any other tobacco product, including e-cigarettes, or other substance? (choose one)
□ Yes □ No □ Don’t Know
2. Do you ever notice mold or dampness other than in the bathroom in the child’s home? (choose one)
□ Never
□ A Few Times A Year □ Monthly
□ Weekly □ Daily
3. During the past 12 months, have there been water problems or dampness in the child’s home from broken pipes, leaks, heavy rain, or floods? (choose one)
□ Yes □ No □ Don’t Know
4. Has your child ever been tested for allergies? (choose one)
□ Yes □ No □ Don’t Know
5. Whether tested or not, does your child have any allergies that you know of? (choose all that apply)
□ None That We Know Of □ Dust or Dust Mites
□ Pollen
□ Cats (Pet Dander) □ Dogs (Pet Dander) □ Mold
□ Cockroaches □ Mice or Rats
6. Do you have any pets in the child’s home? (choose all that apply)
□ Cats □ Dogs □ Other
7. How often do you see cockroaches in the child’s home? (choose one)
□ Never
□ Less than once a week (rarely)
□ Once to three times a week (some days) □ Four to six times a week (most days) □ Once a day
□ More than once a day
8. How often do you notice rats or mice, or their droppings or chewed material in the child’s home? (choose one)
□ Never
□ Less than once a week (rarely)
□ Once to three times a week (some days) □ Four to six times a week (most days) □ Once a day
□ More than once a day
We sincerely thank you for your time completing this survey.
Footnotes
This work was supported by a grant from the Michael & Susan Dell Foundation and the cooperation of the People’s Community Clinic in Austin, TX.
Figures & Tables
References
- 1.Galea S, Tracy M, Hoggatt KJ, DiMaggio C, Karpati A. Estimated deaths attributable to social factors in the united states. Am J Public Health [Internet] 2011;101(8):1456–65. doi: 10.2105/AJPH.2010.300086. Aug [cited 2018 Jun 6]; Available from: https://www.ncbi.nlm.nih.gov/pmc/articles/PMC3134519/ [DOI] [PMC free article] [PubMed] [Google Scholar]
- 2.Centers for Disease Control and Prevention. Definitions | social determinants of health | nchhstp | cdc [Internet] 2019. [cited 2019 Aug 13]. Available from: https://www.cdc.gov/nchhstp/socialdeterminants/definitions.html .
- 3.Cantor MN, Thorpe L. Integrating data on social determinants of health into electronic health records. Health Aff (Millwood) [Internet] 2018;37(4):585–90. doi: 10.1377/hlthaff.2017.1252. Apr 1 [cited 2018 Jun 6]; Available from: https://www.healthaffairs.org/doi/abs/10.1377/hlthaff.2017.1252 . [DOI] [PMC free article] [PubMed] [Google Scholar]
- 4.Gold R, Cottrell E, Bunce A, Middendorf M, Hollombe C, Cowburn S, et al. Developing electronic health record (ehr) strategies related to health center patients’ social determinants of health. J Am Board Fam Med [Internet] 2017;30(4):428–47. doi: 10.3122/jabfm.2017.04.170046. Jul 1 [cited 2018 Jun 6]; Available from: http://www.jabfm.org/content/30/4/428 . [DOI] [PMC free article] [PubMed] [Google Scholar]
- 5.Worku EB, Woldesenbet SA. Poverty and inequality - but of what - as social determinants of health in africa? Afr Health Sci [Internet] 2015;15(4):1330–8. doi: 10.4314/ahs.v15i4.36. Dec [cited 2019 Aug 13]; Available from: https://www.ncbi.nlm.nih.gov/pmc/articles/PMC4765411/ [DOI] [PMC free article] [PubMed] [Google Scholar]
- 6.Mackenbach JP, Kulhánová I, Bopp M, Deboosere P, Eikemo TA, Hoffmann R, et al. Variations in the relation between education and cause-specific mortality in 19 european populations: a test of the “fundamental causes” theory of social inequalities in health. Soc Sci Med [Internet] 2015;127:51–62. doi: 10.1016/j.socscimed.2014.05.021. Feb 1 [cited 2019 Aug 13]; Available from: http://www.sciencedirect.com/science/article/pii/S0277953614003153 . [DOI] [PubMed] [Google Scholar]
- 7.Markwick A, Ansari Z, Sullivan M, Parsons L, McNeil J. Inequalities in the social determinants of health of aboriginal and torres strait islander people: a cross-sectional population-based study in the australian state of victoria. Int J Equity Health [Internet] 2014. p. 13. Oct 18 [cited 2019 Aug 13]; Available from: https://www.ncbi.nlm.nih.gov/pmc/articles/PMC4209035/ [DOI] [PMC free article] [PubMed]
- 8.Serebrisky D, Wiznia A. Pediatric asthma: a global epidemic. Ann Glob Health [Internet] 2019;85(1):6. doi: 10.5334/aogh.2416. Jan 22 [cited 2019 Aug 15]; Available from: http://www.annalsofglobalhealth.org/articles/10.5334/aogh.2416/ [DOI] [PMC free article] [PubMed] [Google Scholar]
- 9.Sullivan PW, Ghushchyan V, Navaratnam P, Friedman HS, Kavati A, Ortiz B, et al. The national burden of poorly controlled asthma, school absence and parental work loss among school-aged children in the united states. J Asthma [Internet] 2018;55(6):659–67. doi: 10.1080/02770903.2017.1350972. Jun 3 [cited 2019 Aug 15]; Available from: https://doi.org/10.1080/02770903.2017.1350972 . [DOI] [PubMed] [Google Scholar]
- 10.DePriest K, Butz A. Neighborhood-level factors related to asthma in children living in urban areas: an integrative literature review. J Sch Nurs [Internet] 2017;33(1):8–17. doi: 10.1177/1059840516674054. Feb 1 [cited 2019 Aug 15]; Available from: https://doi.org/10.1177/1059840516674054 . [DOI] [PMC free article] [PubMed] [Google Scholar]


