

Abstract
Human milk oligosaccharides play a vital role in the development of the gut microbiome in the human infant. Although oligosaccharides derived from bovine milk (BMO) differ in content and profile with those derived from human milk (HMO), several oligosaccharide structures are shared between the species. BMO are commercial alternatives to HMO, but their fate in the digestive tract of healthy adult consumers is unknown. Healthy human subjects consumed two BMO doses over 11-day periods each and provided fecal samples. Metatranscriptomics of fecal samples were conducted to determine microbial and host gene expression in response to the supplement. Fecal samples were also analyzed by mass spectrometry to determine levels of undigested BMO. No changes were observed in microbial gene expression across all participants. Repeated sampling enabled subject-specific analyses: four of six participants had minor, yet statistically significant, changes in microbial gene expression. No significant change was observed in the gene expression of host cells exfoliated in stool. Levels of BMO excreted in feces after supplementation were not significantly different from baseline and were not correlated with dosage or expressed microbial enzyme levels. Collectively, these data suggest that BMO are fully fermented in the human gastrointestinal tract upstream of the distal colon. Additionally, the unaltered host transcriptome provides further evidence for the safety of BMO as a dietary supplement or food ingredient. Further research is needed to investigate potential health benefits of this completely fermentable prebiotic that naturally occurs in cow’s milk.
Keywords: Milk oligosaccharides, Metatranscriptome, Glycome, Microbiome, Nutrition, Milk
1. Introduction
The human gut microbiome is a complex community with hundreds of unique species and trillions of total microbes present [1]. Like a fingerprint, each individual possesses a unique microbiome composition, which is based on a host of factors including diet [2–4], host genetics [5] and other genetic and environmental variables [6]. In humans, the gut microbiome plays an important role in modulating interactions with the host immune system [7], along with contributing to digestion through mediated breakdown of complex polysaccharides [4,8,9]. Composition and activity of gut microbiome species have been linked with multiple diseases [4,10–14], although exact mechanisms of disease and/or dysbiosis are not yet fully understood. The vast number of species and genetic data present in the gut microbiome presents a challenge for analysis and interpretation. Recent advances and developments in high-throughput sequencing and analysis of metagenomes [15–19] and metatranscriptomes [20–25] offer new techniques and opportunities to identify and quantify organism-specific transcriptional activity changes in response to a shift in diet, environment, supplementation or other factors.
The human gut microbiome is established very shortly after birth, with colonization by multiple species occurring fewer than 72 h after birth, sourced largely from the mother’s vaginal and fecal inocula [26]. However, the infant microbiome is under constant flux and pressure over the first year of life, exacerbated by shifts in diet and any fever or antibiotic treatments, and shows wide variety between individuals [26,27]. Diet in particular plays a large role in the composition of the infant microbiome during the first few months; breastfeeding encourages a microbiome comprised primarily of Bifidobacterium, while infant formula instead promotes other faculative anaerobes, including the genera Clostridium and Streptococcus [28]. One component of particular importance to fostering microbial growth are human milk oligosaccharides (HMO), complex sugars with varied linkages connecting sugar rings. Bifidobacterium species, namely B. longum subsp. infantis, preferentially consume these sugars to outcompete other bacterial genera [29–32].
The effects of milk-derived oligosaccharides on the human gut have been previously studied [33,34], particularly for their role in nurturing the growth of Bifidobacterium in the infant gut [29,30,33,35]. Milk oligosaccharides also serve as decoys for pathogens [36] and interact directly with host intestinal cells [37]. HMO can serve as the sole carbon source for Bacteroides and Bifidobacterium growth [38,39], and these bacteria possess dedicated enzymes for the degradation of HMO [40,41]. HMO are structurally similar to intestinal cell wall glycans, serving as a decoy target for the binding of pathogenic bacteria and preventing them from adhering to the intestinal cell wall [36]. HMO interactions with intestinal cells inhibit proliferation and promote differentiation, and can modify glycan presence on the cells’ exterior [37,42,43].
Bovine milk oligosaccharides (BMO) differ from HMO in both concentration (1–2 g/L vs. 12–14 g/L in colostrum) and structure [44–46]. HMO are predominantly type I oligosaccharides (OS) with high fucosylation rate, while BMO are predominantly type II OS with highly sialyated and little fucosylated OS [44–46]. Despite these structural differences, many of the BMO structures are identical to those in human milk [46,47], and BMO are commercially viable alternatives to HMO [48,49]. However, the prebiotic potential of BMO in human consumers is not yet known. Therefore, the purpose of this study was to determine the effects of BMO on microbial function when added to the diet of healthy adults.
A clinical trial of healthy adults evaluated the safety and tolerability of dietary supplementation with bovine milk oligosaccharides [50]. In that trial, it was shown that BMO supplementation did not alter the fecal microbiome of healthy adults [50]. Given that microbiome function can be altered without microbiome population modification [20], we hypothesized that fermentation of BMO occurred via alterations to microbial gene expression rather than alterations to microbiome composition. Fecal metatranscriptomes are a proxy measurement of microbial gene expression in the distal colon [25]. In addition, mRNA from host colonocytes exfoliated into the stool is an indirect measure of the host intestinal cell response [51]. Likewise, fecal oligosaccharide abundances are a measurement of the undigested oligosaccharides that remain in the distal colon. We therefore interrogated fecal oligosaccharides and fecal metatranscriptomes using samples from the prior clinical trial [50] to determine the fate of BMO in healthy adults.
2. Materials and methods
2.1. Ethics statement
The UC Davis Institutional Review Board approved all aspects of the study, and written informed consent was obtained from all participants prior to study procedures. This study was registered on clinicaltrials.gov (NCT01814540).
2.2. Participants
Recruitment and screening of 36 individuals from the Davis, CA, area were previously described in the parent study [50]. Subject inclusion is summarized in Fig. 1A. Inclusion criteria included the following: healthy men and women aged 18–40 years, normal fasting glucose and lipid values, fiber intake <30 g/d, fecal bifidobacterial populations <25% of total bacteria, born by vaginal birth and breastfed for a minimum of 2 months. Exclusion criteria included regular consumption of high-fiber cereals or fiber supplements, or yogurt containing Bifidobacterium (within the last 4 weeks); lactose intolerance or allergies to dairy products or wheat; tobacco use; pregnancy or lactation; presence of gastrointestinal (GI)/malabsorption disorders or autoimmune disease; or use of prescription or over-the-counter medications/supplements that include pre- and probiotics, corticosteroids, antiobesity agents, laxatives, antibiotics and lipid-altering medications. The 16 individuals who met prescreening criteria provided a fasting blood sample and a stool sample. Blood samples were analyzed for fasting lipid and glucose profiles, and stool samples were analyzed for fecal bifidobacteria. Average daily fiber intake was estimated using an online Muldoon Omega-3 Food Frequency Questionnaire that contains 444 items (Modified Block 2006-Bodnar FFQ, 2006; NutritionQuest/Block Dietary Data Systems). Twelve participants eligible for enrollment were instructed to complete a Baecke physical activity questionnaire [52], which was used to calculate the doses of each dietary treatment as described previously [50]. Participants filled out a 3-day diet record on 2 weekdays and 1 weekend day within 7 days of initiating each supplement arm. To reduce the influence of diet on the gut microbiome, participants were instructed to maintain their habitual diet but to refrain from consuming high-fiber diets and fiber supplements and to avoid consumption of yogurt containing Bifidobacterium. On the morning of each study day, participants filled out a questionnaire regarding their intake of any study-prohibitive foods/supplements/medications within the past 24 h, which was used to determine compliance.
Fig. 1.
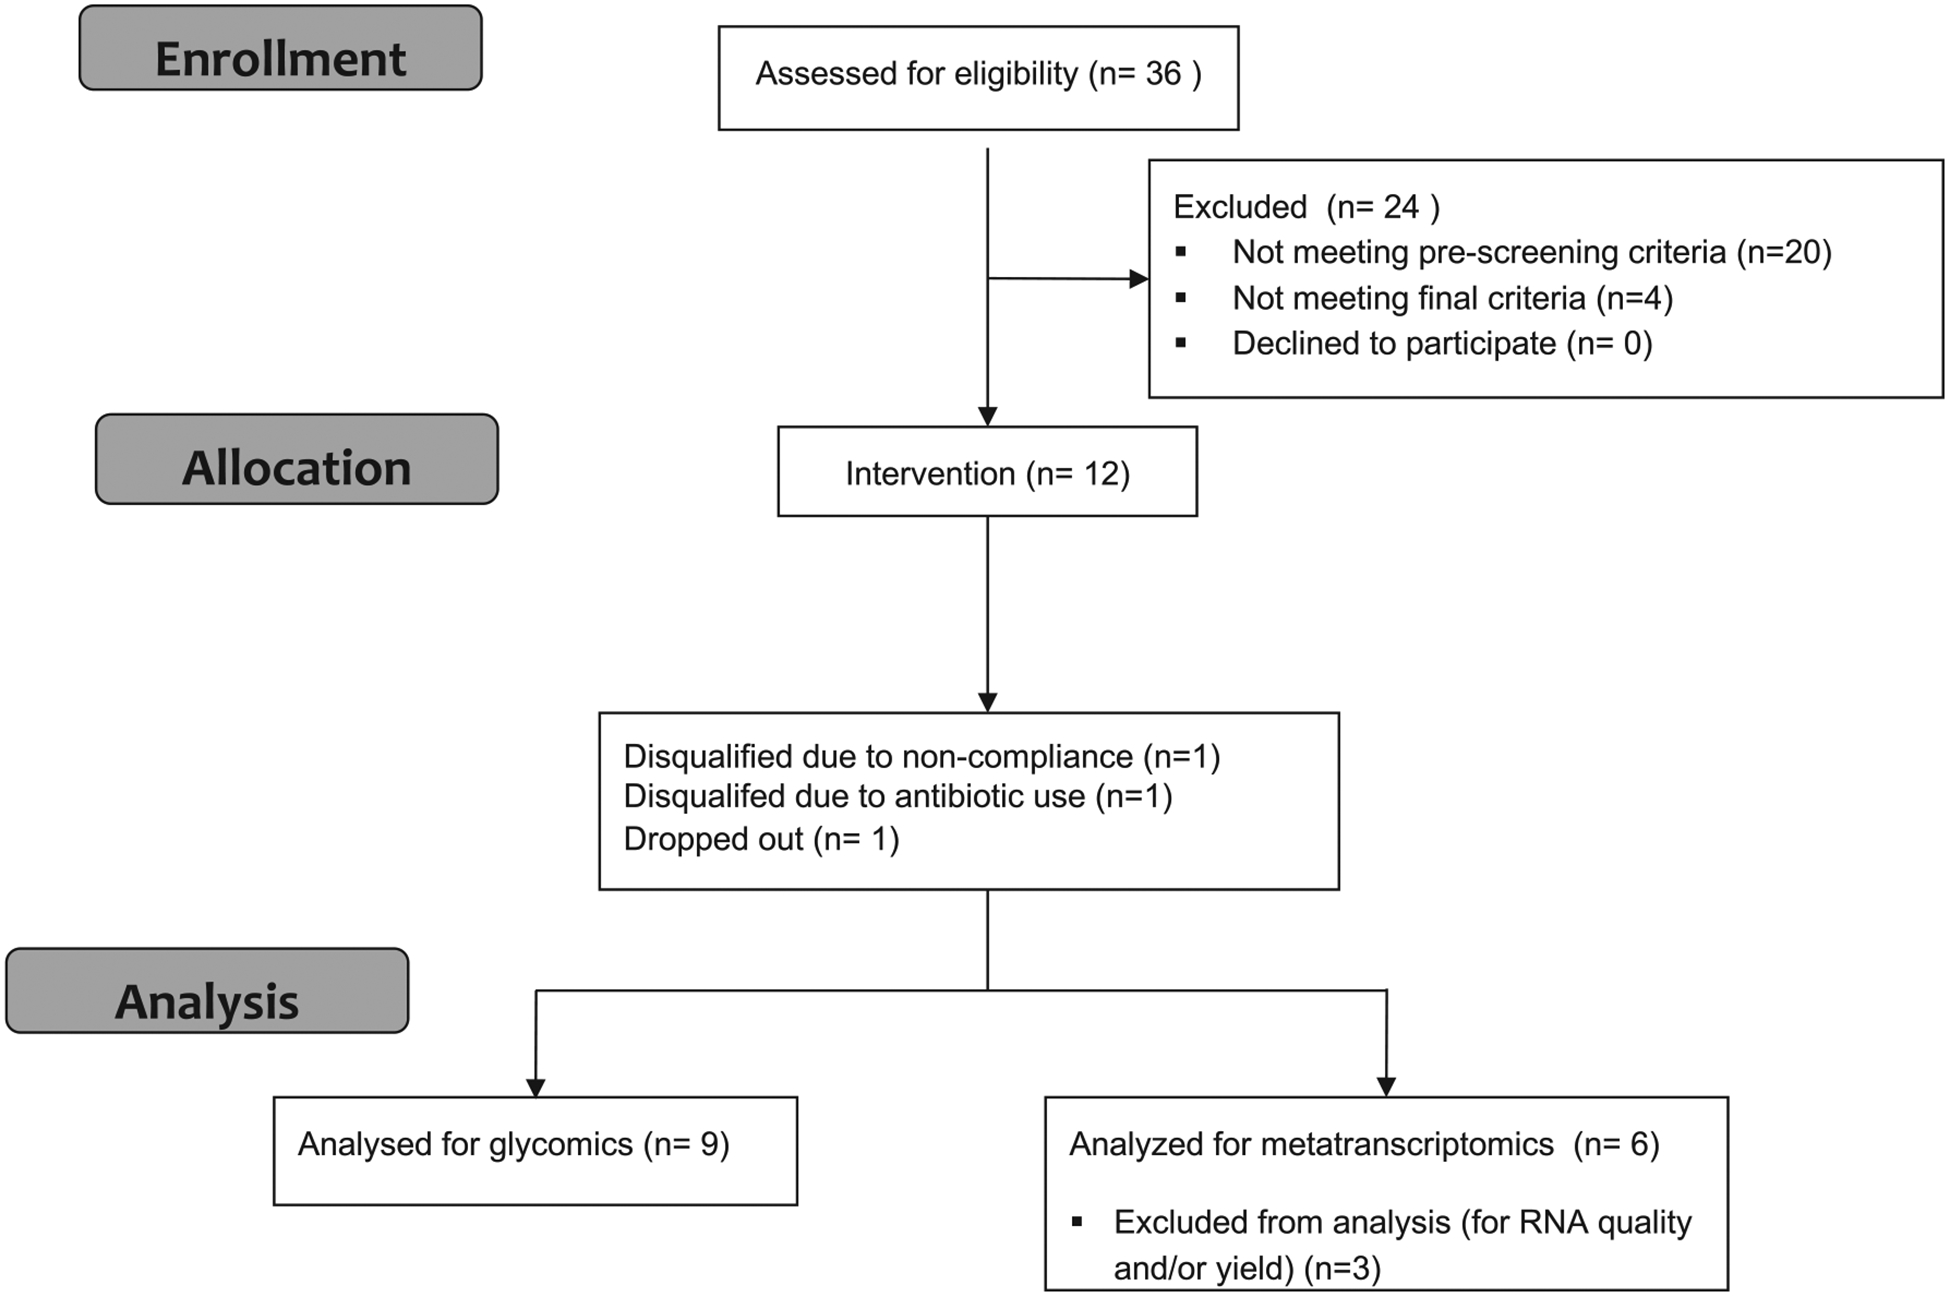
Flow diagram of clinical trial.This flow diagram displays the progress of all participants through the trial.
Participant progress through the trial is illustrated in Fig. 1. Of the 12 participants who were enrolled in the parent study, 9 completed all 3 arms of the trial. Fecal samples from all nine participants were included in the current study for glycomics analysis. Fecal samples from the six participants with the best quality fecal RNA were selected for metatranscriptomics analysis.
2.3. Study design
As described previously [50], this was a single-blind, placebo controlled, crossover trial with 3 dietary treatment arms administered in the following order for 11 consecutive days each (day 0 to day 10):(1) placebo control, (2) low-BMO (9.4±1.5 g/day) and (3) high-BMO (13.1±2.2 g/day) doses. Each treatment arm was followed by a 2-week washout. The dietary treatments were not randomized in order to eliminate possible carryover effects by the BMO supplement. The placebo control was composed of Polycose, a glucose polymer powder (Abbott Nutrition), and the pure lactose-free BMO powder was supplied by Hilmar Ingredients, the composition of which has been previously reported [50] and summarized in Table 1. As described previously [50], the placebo control and low-BMO treatments were calculated as the number of grams of carbohydrate equivalent to 25% of daily fiber intake based on individual energy consumption, and the high-BMO dose was calculated as 35% of daily fiber intake. Doses were consumed on site during weekday mornings as part of a mixed meal, and the remaining evening and weekend doses were provided in sachets for mixing with lactose-free milk by the study subjects. Compliance was monitored as previously described [50].
Table 1.
Composition of the BMO supplement and measures of detected levels before and after supplementation
| Presupplementation | Postsupplementation | |||||||||
|---|---|---|---|---|---|---|---|---|---|---|
| Mass [H+] | Monosaccharide composition | Abundance in supplement (%) | Mean | S.D. | Minimum | Maximum | Mean | S.D. | Minimum | Maximum |
| 505.1763 | 3 Hex | 19.9 | 3.62 | 5.45 | 0.27 | 22.34 | 2.51 | 2.09 | 0.15 | 7.21 |
| 546.2029 | 2 Hex 1 HexNAc | 9.4 | 0.12 | 0.16 | 0.01 | 0.51 | 0.28 | 0.37 | 0.01 | 1.43 |
| 634.2189 | 2 Hex 1 NeuAc | 45.7 | 1.03 | 0.84 | 0.20 | 2.69 | 1.15 | 0.75 | 0.11 | 2.34 |
| 667.2293 | 4 Hex | 5.8 | 5.53 | 9.17 | 0.52 | 37.77 | 4.30 | 2.98 | 0.59 | 11.40 |
| 675.2454 | 1 Hex 1 HexNAc 1 NeuAc | 0.4 | 0.05 | 0.06 | 0.00 | 0.24 | 0.06 | 0.10 | 0.01 | 0.43 |
| 691.2404 | 1 Hex 1 HexNAc 1 NeuGc | 0.7 | n.m. | n.m. | n.m. | n.m. | n.m. | n.m. | n.m. | n.m. |
| 708.2557 | 3 Hex 1 HexNAc | 3.8 | 0.86 | 2.63 | 0.02 | 10.69 | 0.77 | 2.48 | 0.03 | 10.36 |
| 749.2822 | 2 Hex 2 HexNAc | 0.7 | n.m. | n.m. | n.m. | n.m. | n.m. | n.m. | n.m. | n.m. |
| 796.2717 | 3 Hex 1 NeuAc | 0.9 | 0.14 | 0.21 | 0.01 | 0.61 | 0.19 | 0.24 | 0.00 | 0.61 |
| 829.2821 | 5 Hex | 4.1 | 2.55 | 2.06 | 0.16 | 6.77 | 3.41 | 3.05 | 0.40 | 13.24 |
| 870.3085 | 4 Hex 1 HexNAc | 3.2 | 0.19 | 0.29 | 0.00 | 0.87 | 0.35 | 0.84 | 0.01 | 3.54 |
| 911.3352 | 3 Hex 2 HexNAc | 0.7 | 0.70 | 0.94 | 0.02 | 3.48 | 1.11 | 1.44 | 0.01 | 6.12 |
| 991.335 | 6 Hex | 2.6 | 2.39 | 4.81 | 0.01 | 15.12 | 1.15 | 2.22 | 0.01 | 9.73 |
| 1073.388 | 4 Hex 2 HexNAc | 0.7 | 0.41 | 0.69 | 0.00 | 1.68 | 0.52 | 1.23 | 0.00 | 3.92 |
| 1114.415 | 3 Hex 3 HexNAc | 0.6 | 0.13 | 0.23 | 0.01 | 0.88 | 0.21 | 0.39 | 0.01 | 1.45 |
| 1153.387 | 7 Hex | 0.6 | n.m. | n.m. | n.m. | n.m. | n.m. | n.m. | n.m. | n.m. |
| 1315.440 | 8 Hex | 0.2 | n.m. | n.m. | n.m. | n.m. | n.m. | n.m. | n.m. | n.m. |
“Presupplementation” includes all day 0 samples from arms T2 and T3. “Postsupplementation” includes all day 11 samples from arms T2 and T3. Hex, hexose (glucose or galactose); HexNAc, N-acetyl-hexosamine; NeuAc, N-acetylneuraminic acid; NeuGc, N-glycolylneuraminic acid.
2.4. Stool sample collection
Participants were instructed to collect stool samples within 1 to 2 days of three time points: days −2 (used for the day 0 time point), 4 and 11 of each treatment arm. Stool samples were collected in empty tubes for glycomics analysis and in RNAlater-containing tubes for metatranscriptomics analysis. The latter tubes contained 25 ml of RNAlater. Subjects were instructed to add stool to the RNAlater tube until the volume reached 30 ml and to screw the cap tightly, seal in a ziploc bag and shake vigorously until uniform consistency. Both tubes were stored in participants’ home freezers in secondary containment until transported on ice packs by the participant or picked up by study personnel. Samples were then stored at −80°C until further processing.
2.5. Selection and processing of stool samples for RNA sequencing
Stool samples collected on day 0 of the placebo and low-BMO arms (subject never having been explosed to the BMO supplement) and on day 11 of the low- and high-BMO arms (maximal exposure to the BMO supplement) of the nine participants who completed the parent study were proccesed for RNA extraction and purification. These 36 samples were vortexed and homogenized after thawing for 10 min. Approximately 0.6 g of stool slurry was incubated with lysis buffer and periodically vortexed. Further homogenization of the sample was obtained using a bead beater with 0.1-ml beads followed by QIAshredder treatment. Extraction was performed on the homogenized samples using the Qiagen RNeasy RNA Isolation kit, with additional Turbo DNAse treatment to remove lingering DNA contamination. RNA concentration and integrity were verified using Nano- Drop and Bioanalyzer traces. From the 36 samples associated with the 9 participants, a set of 24 samples from 6 participants was selected for metatranscriptome sequencing based on RNA quality and yield levels for all 4 samples per individual (2 control, 2 BMO treatment).
2.6. Metatranscriptome sequencing
For each sample, RNA-Seq libraries were prepared using N2 μg total extracted RNA at the DNA Sequencing Core of the UC Davis Genome Center. All extracted RNA samples were first ribodepleted using the RiboZero Magnetic Gold Kit (Epidemiology), catalog number MRZE706. The Illumina TruSeq protocol, without poly(A) selection, was then used to prepare the RNA-Seq libraries. The 24 samples were run on 6 lanes of Illumina HiSeq 3000 at 100 bp, paired-end, with indexing to allocate ~25% of the lane to each sample metatranscriptome. The raw sequencing data have been deposited in the NCBI GEO repository, in BioProject PRJNA428720, GEO accession GSE108809.
2.7. Annotation and analysis of metatranscriptome reads
The raw metatranscriptome files were preprocessed, annotated and analyzed using a modified version of the SAMSA2 pipeline [53]. Preprocessing involved removal of low-quality sequences and adaptor contamination with Trimmomatic [54] and paired-end alignment with PEAR [55]. Sequences were annotated by DIAMOND [16]; reads were mapped against NCBI’s most recent RefSeq bacterial release, RefSeq human proteome (for host data), the Carbohydrate Active Enzymes (CAZy) database [56] and SEED Subsystems [57]. For downstream analysis, the resulting annotation files were aggregated and merged using custom Python and R scripting [25]. Statistical computations were performed using the DESeq2 package for R, version 1.16 [58]. Individual organism and functional identifications were drawn from NCBI’s RefSeq database and SEED [57,59]. Subsequent subsetting of data to profile specific organisms in regards to their functional activity was performed using Python scripting included with the SAMSA2 pipeline [53].
2.8. Version control and access to the SAMSA pipeline
The version of SAMSA used in this paper was version 2.0.0 [53]. All components and tools used in the SAMSA pipeline, as well as documentation files, are freely available from GitHub at http://github.com/transcript/SAMSA2.
2.9. Measurement of BMO content in fecal samples
One hundred and fifty milligrams of fecal material from each participant at each time point for each treatment was thawed and thoroughly mixed with 500 μl of nanopure water using a shaker at 4°C for 1 h. The mixture was then centrifuged at 4000×g for 30 min at 4°C; the supernatant was collected (supernatant A) and kept in refrigeration (4°C), while precipitate was dissolved in 500 μl of nanopure water and left in the shaker at 4°C overnight. The mixture was then centrifuged at 4000×g for 30 min at 4°C, and this supernatant was pooled with supernatant A. Extraction and purification were done as described by De Leoz et al.,with slight modifications. Fecal samples were purified twice through porous graphitic carbon solid phase extraction, and the BMO profile and relative abundances were measured by Nano-LC Chip QToF mass spectrometry (MS) as described by DeLeoz et al. [60]. Fecal oligosaccharides were identified using the “Find Compounds by Formula” function of Mass Hunter Qualitative Analysis Version B.06.00 (Agilent Technologies), which generates a list of deconvoluted masses in a range of 450–1500 m/z with a ≥1000 height count threshold and a typical isotopic distribution of small biological molecules (charge states allowed were limited to 1–2). Oligosaccharide compositions were confirmed by tandem MS (MS/MS) analysis. Once fecal oligosaccharides were confirmed and their retentions times established, the relative abundance of each oligosaccharide was determined by integration of individual peaks using the Batch Targeted Feature Extractor from MassHunter Profinder Version B.06.00 (Agilent Technologies). To minimize instrument variability, all samples were spiked with 2-fucosyllactose as an internal standard, and the data were expressed as the ratio oligosaccharide peak area/internal standard peak area. Once ratios were calculated, they were normalized considering the exact amount of feces initially weighted.
2.10. Statistical analysis of fecal oligosaccharide abundances
Due to the presence of observations below the limit of detection (LOD), analyses comparing oligosaccharide levels between arms and days were conducted using log-normal tobit models [61] in which below-LOD observations were treated as censored at the lowest observed value for that oligosaccharide. Batch effects were assessed by comparing observations at day 0 between the placebo arm and low-BMO arm using log-normal tobit models, including covariates for arm and subject. As most oligosaccharides differed significantly between these arms at day 0, batch effects were assumed to be non-negligible, and data from the placebo arm were excluded from subsequent analyses. Differences between arms in changes over time in oligosaccharide profiles were modeled using log-normal tobit models, including covariates for day, arm, the interaction between day and arm, and subject. Analyses were conducted using R, version 3.4.0.
3. Results
3.1. Fecal metatranscriptomes are subject-specific with small and inconsistent responses to BMO supplementation
The metatranscriptome of the gut microbiome was examined at four time points for six participants enrolled in the study. Samples from day 0 of the first two study arms were used as controls compared to the metatranscriptome after 11 days of low-dose BMO supplementation and after 11 days of high-dose BMO supplementation. RNA was extracted, sequenced and mapped to microbial genes (see Methods). Clustering based on transcripts aggregated at the genus level reveals that between-participant microbiome differences are the largest contributor to overall variance (Fig. 2).
Fig. 2.
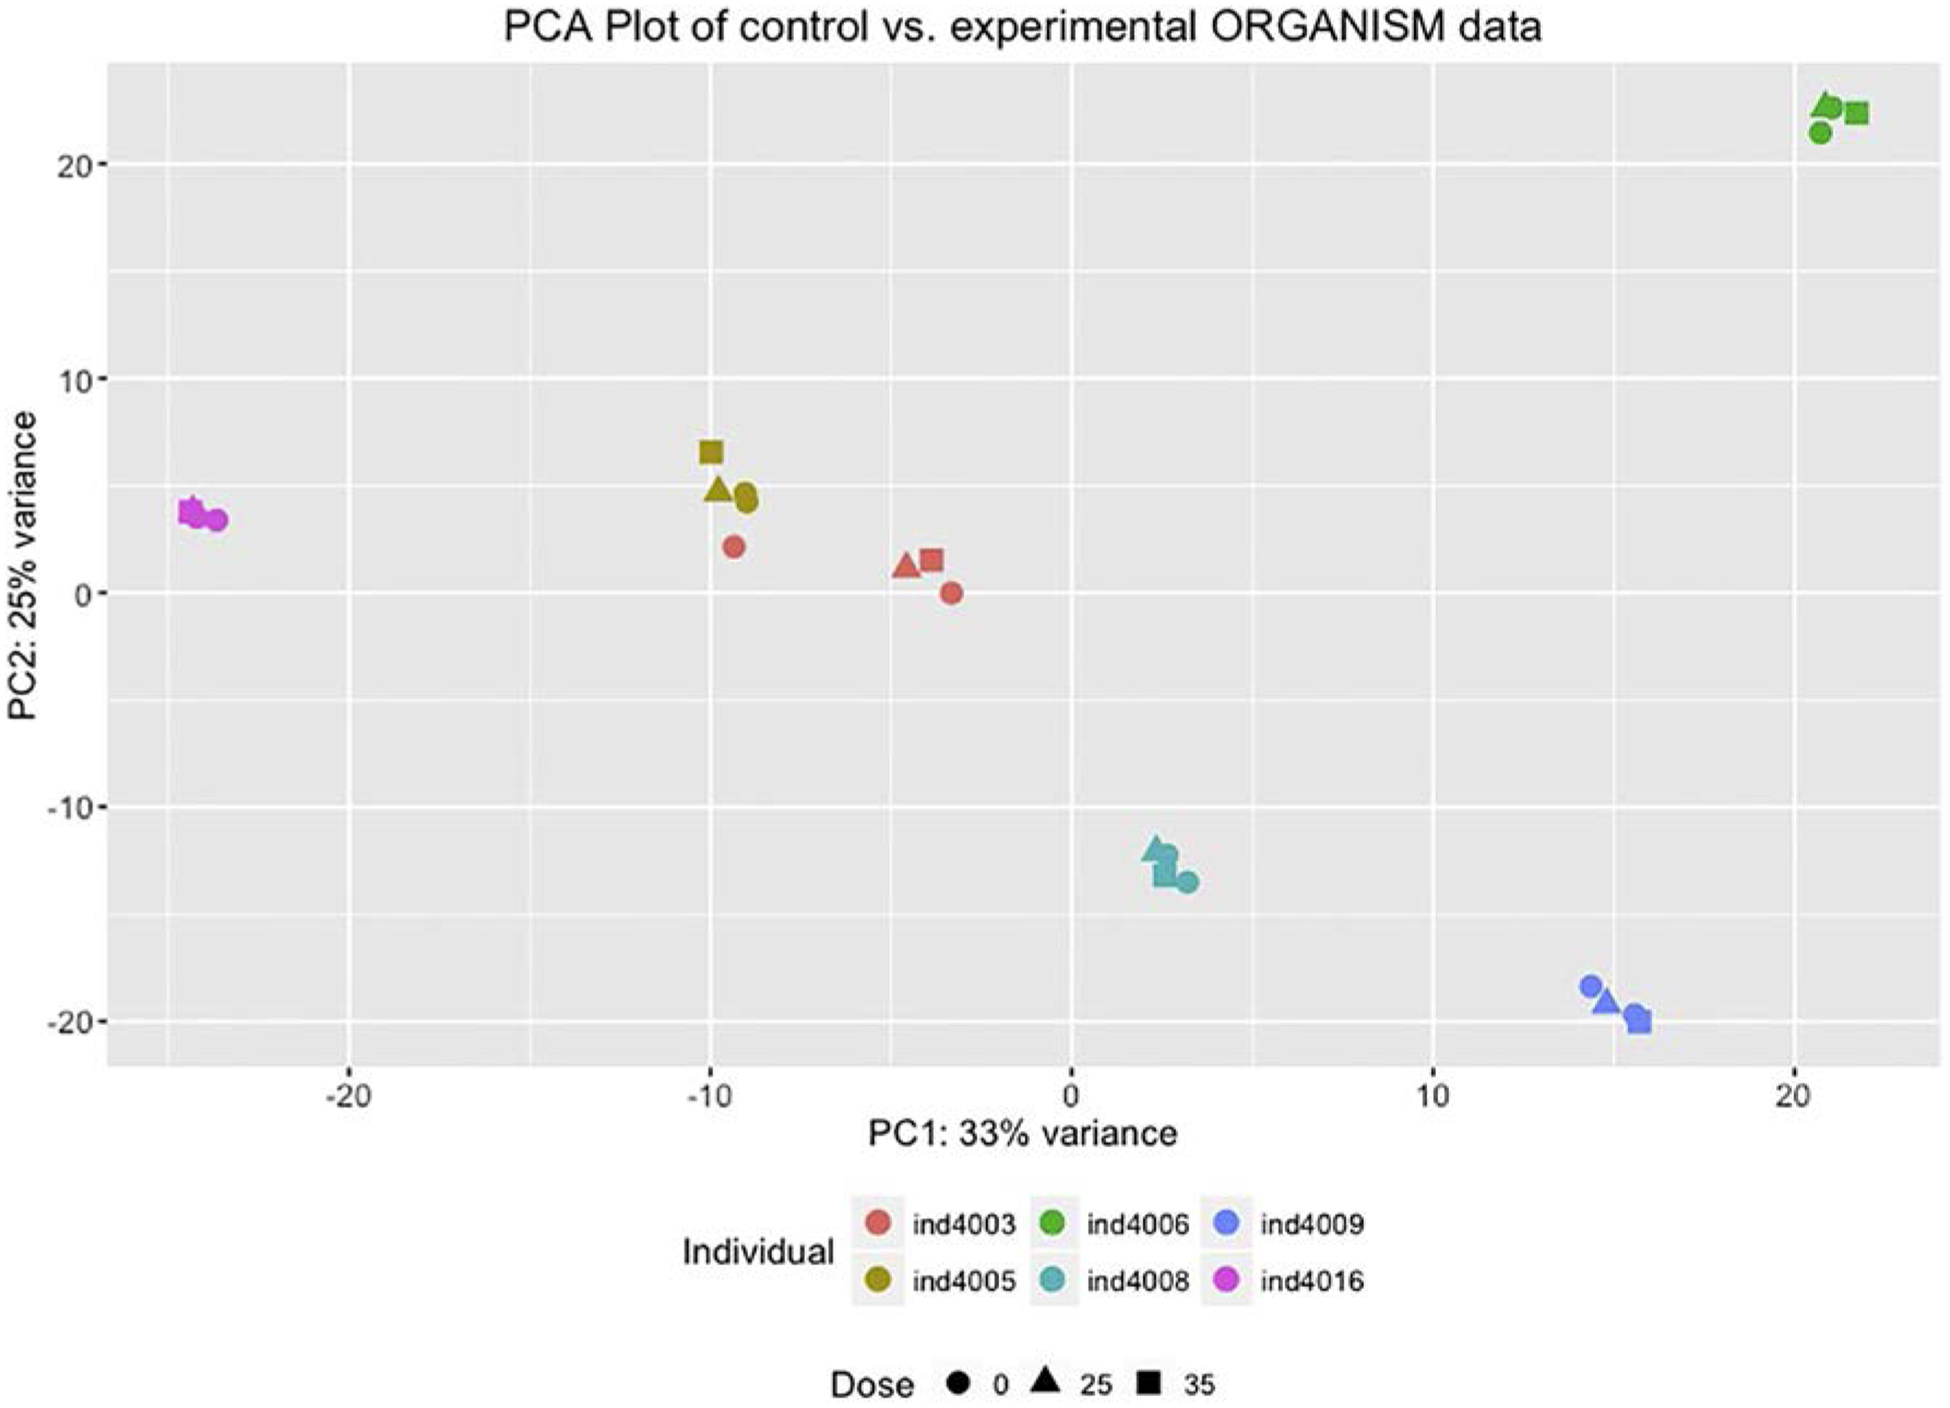
Principal components analysis indicates that the participant is the largest source of variance in whole metatranscriptomes.The x-axis is the first principal component, which accounts for 33% of the variance. The y-axis is the second principal component, which accounts for 25% of the variance. Each point (square, circle or triangle) represents a whole metatranscriptome. Each color represents a different particpant. The shape indicates the dose of BMO: 0 g (circle), grams of BMO equivalent to 25% of daily fiber intake (triangle) or grams of BMO equivalent to 35% of daily fiber intake (square).
Microbial genera with the most total gene expression in the distal colon in these healthy human subjects include Bacteroides, Clostridium, Faecalibacterium, Ruminococcus, Eubacterium, Lactobacillus, Alistipes, Roseburia and Prevotella. Observation of the organisms with the most abundant gene expression within the gut environment suggests no obvious large-scale changes in response to the BMO supplement consistent across the entire cohort (Fig. 3), and examination of individual gene expression for these most active organisms reveals no significantly differentially active genes.
Fig. 3.
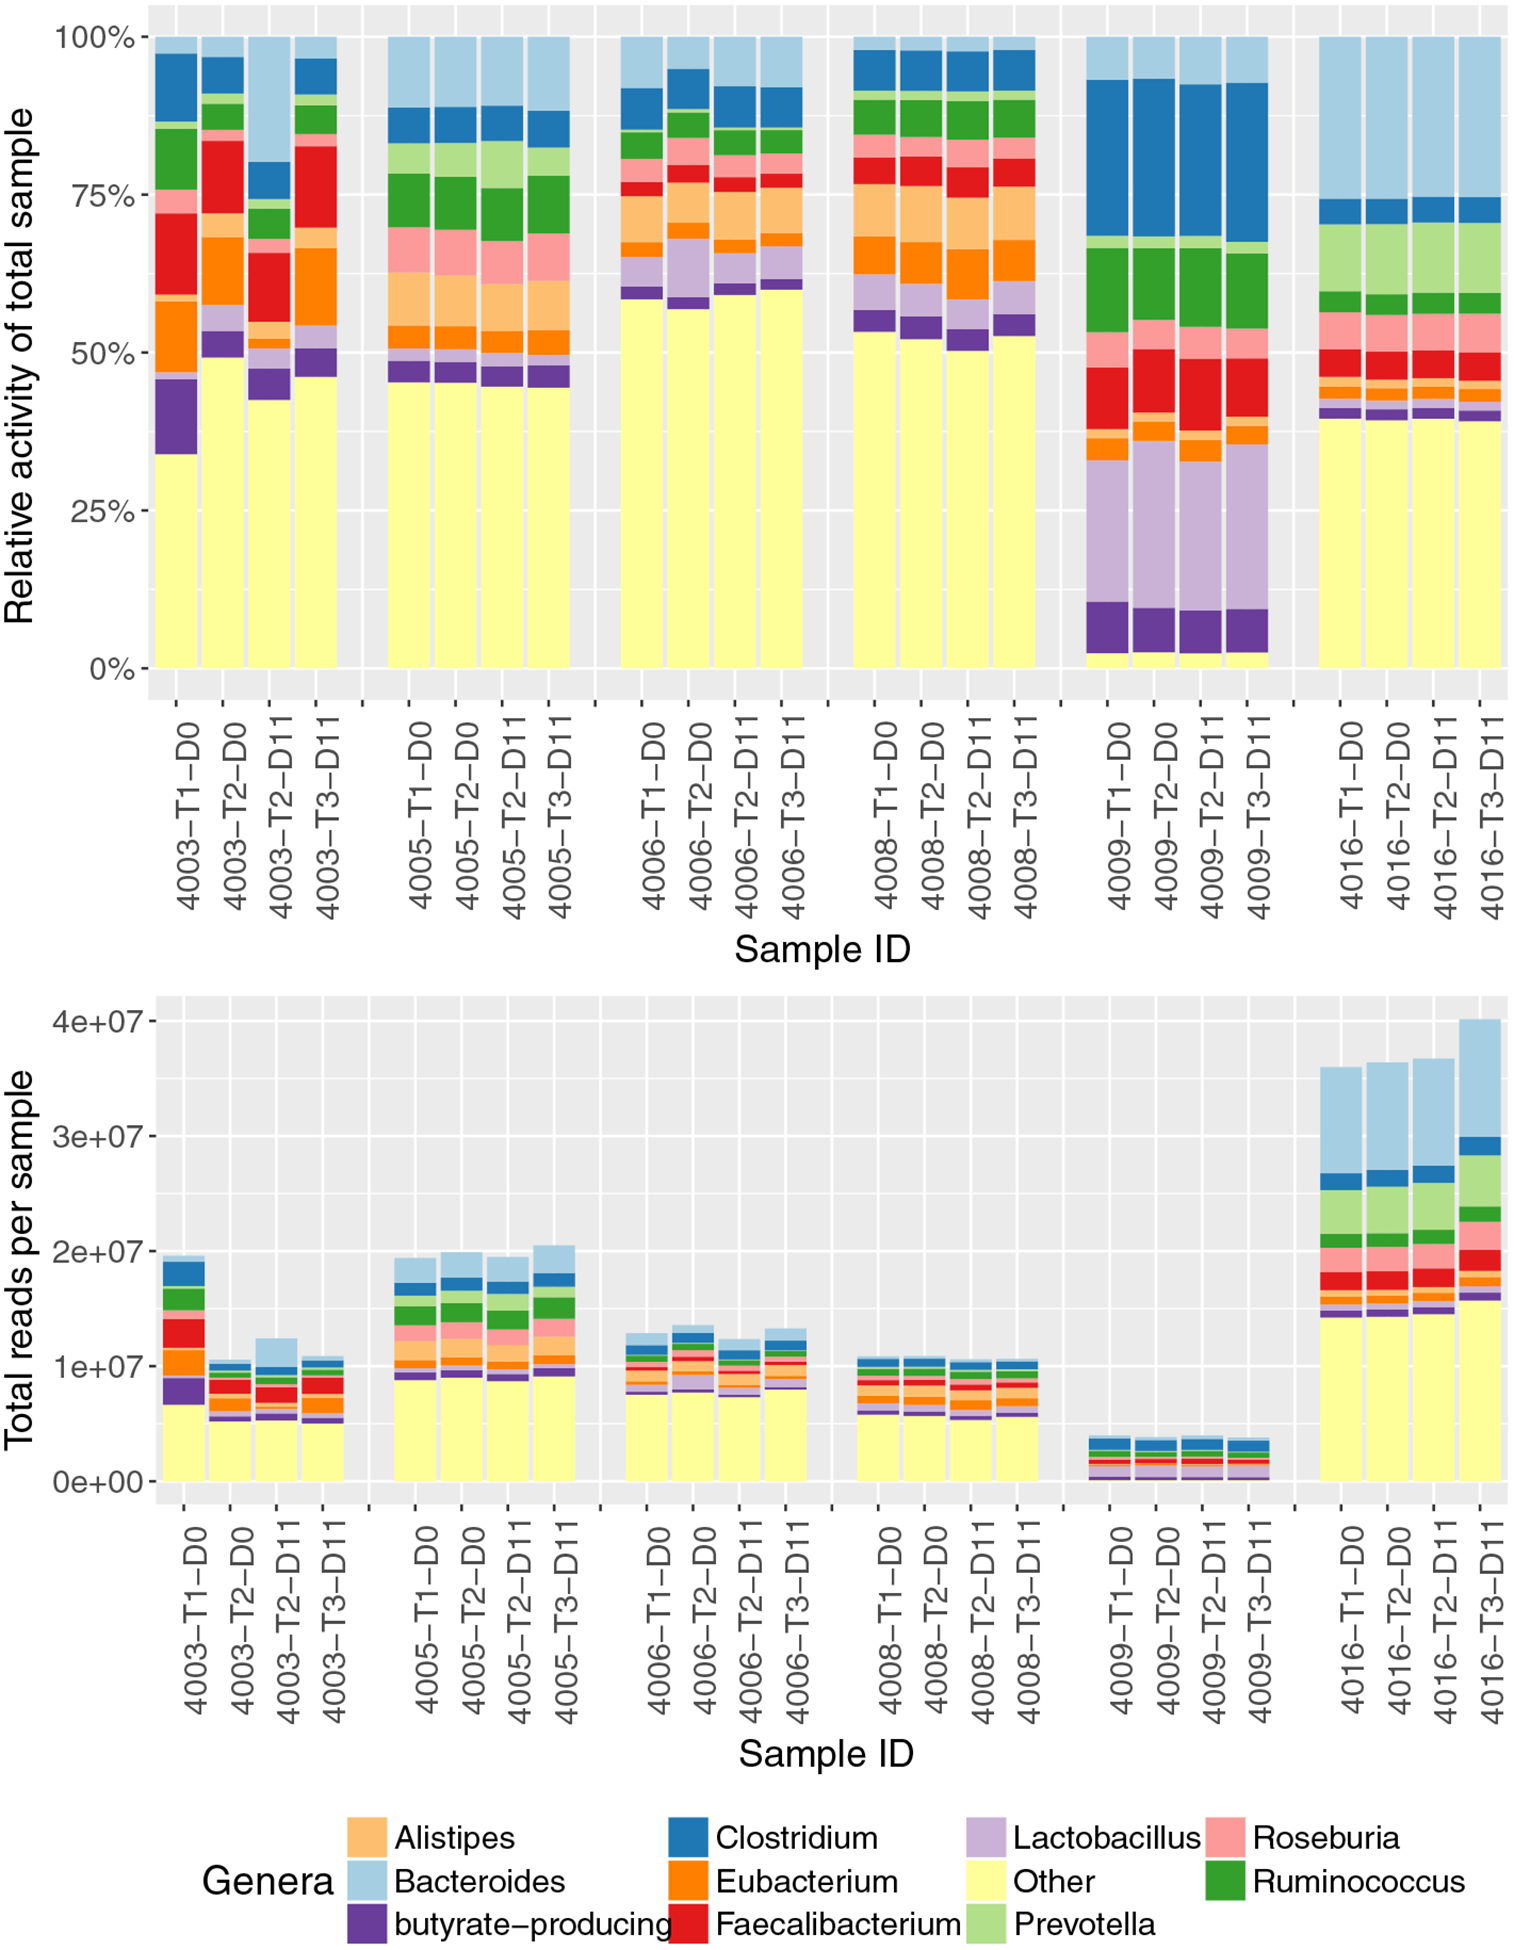
Composition of genera with the highest number of transcripts in the 24 stool samples.The stacked bar graphs are relative (top) and absolute (bottom) transcript counts per genus in each sample. Only the top 10 genera from the 24 stool samples are depicted; all remaining genera are summarized as the “Other” category (yellow). Samples are grouped by participant (4003, 4005, 4006, 4008, 4009, 4016). For the T1_D0 and T2_D0 samples, the participants have not yet been exposed to BMO. The T2_D11 sample was the last day of the low- BMO dose; T3_D11 was the last day of the high-BMO dose.
Evaluation of pre- and postsupplement metatranscriptomes for each participant was performed by Wald test, with total values below 1000 normalized reads eliminated as noise. Some of the participants showed significant microbial gene expression changes (Fig. 4). Participant 4003 showed significant changes in 26 genera; the most significant (Pb.01) decreases were observed for Corynebacterium (1.04e4 mean reads, 0.26-log2fold decrease, adjusted P=3.99e-5), Fusobacterium (1.24e4 mean reads, 0.56-log2fold decrease, adjusted P=2.57e-4), Geobacillus (1.35e5 mean reads, 0.20-log2fold decrease, adjusted P=6.9e-3), Helicobacter (3.72e3 mean reads, 0.21-log2fold decrease, adjusted P=2.48e-4), Ilyobacter (7.76e3 mean reads, 0.57- log2fold decrease, adjusted P=6.2e-3), Tepidanaerobacter (8.62e3 mean reads, 1.53-log2fold decrease, adjusted P=5.17e-3) and Veillonella (3.7e4 mean reads, 1.86-log2fold decrease, adjusted P=2.42e-5), and a significant increase was found in Barnesiella (1.05e5 mean reads, 0.20-log2fold increase, adjusted P=1.76e-5) and Bacteroides (1.59e6 mean reads, 1.74-log2fold increase, adjusted P=3.15e-4). Participant 4005 showed highly significant decreases in Mycobacterium (2.8e4 mean reads, 1.10-log2fold decrease, adjusted P=2.5e-4) and Tannerella (1.75e5 mean reads, 0.21-log2fold decrease, adjusted P=2.1e-3). Participant 4008 showed a highly significant (Pb.01) change in Pedobacter (8.1e3 mean reads, 0.14-log2fold increase, adjusted P=2.09e-4) and significant (Pb.05) changes in Niabella (6.5e3 mean reads, 0.18-log2fold increase, adjusted P=.018) and Sphingobacterium (3.9e4 mean reads, 0..14-log2fold increase, adjusted P=.023). Participant 4009 showed significant (Pb.05) decreases in Chitinophaga (7.48e3 mean reads, 0.28-log2fold decrease, adjusted P=3.1e-2) and Pseudopedobacter (9.92e3 mean reads, 0.21-log2fold decrease, adjusted P=4.3e-2). Participants 4006 and 4016 showed no intraindividual changes in microbial gene expression.
Fig. 4.
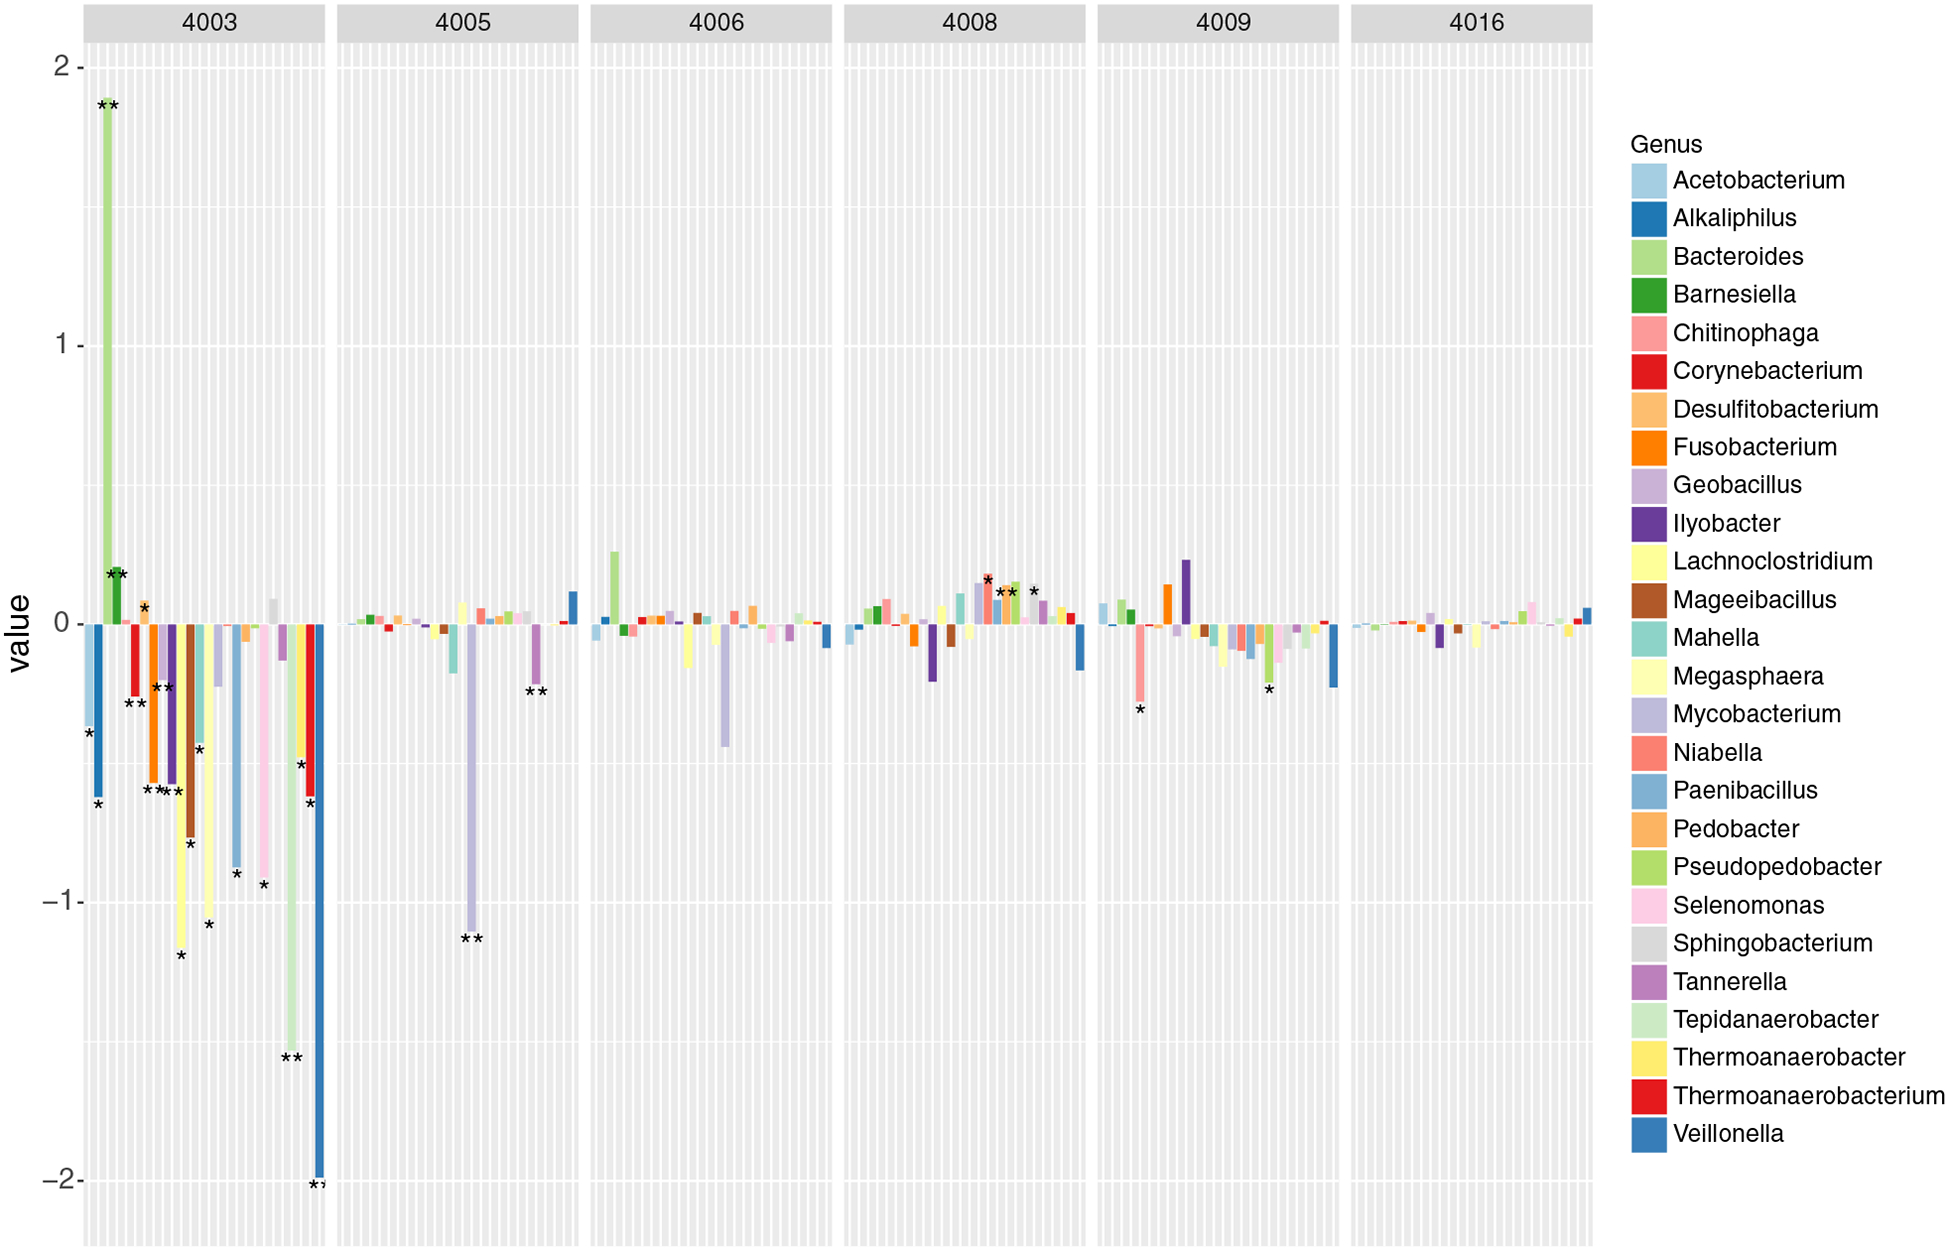
Significantly different genera for each individual.This barplot displays genera with total transcript abundances that were significantly different in at least one of the six participants (4003, 4005, 4006, 4008, 4009, 4016), shown as log2fold change in post-BMO supplement samples relative to controls, with stars (“*”) indicating significance (Pb.05) and double stars (“**”) indicating Pb.01.
3.2. Subsystems-based functional fecal metatranscriptome annotation showed limited individual-specific functional changes
Metatranscriptomic sequences can be annotated to a reference to match both the organism of origin and the specific function or functional category. Top functional categories include carbohydrates, protein metabolism, RNA metabolism, amino acids and derivatives, and others, each with more than a million normalized reads, on average, annotated to that category. Annotations to the SEED Subsystems database revealed no significant changes in functional categories at any hierarchy level associated with supplementation for the fecal metatranscriptome (Fig. 5A and B).
Fig. 5.
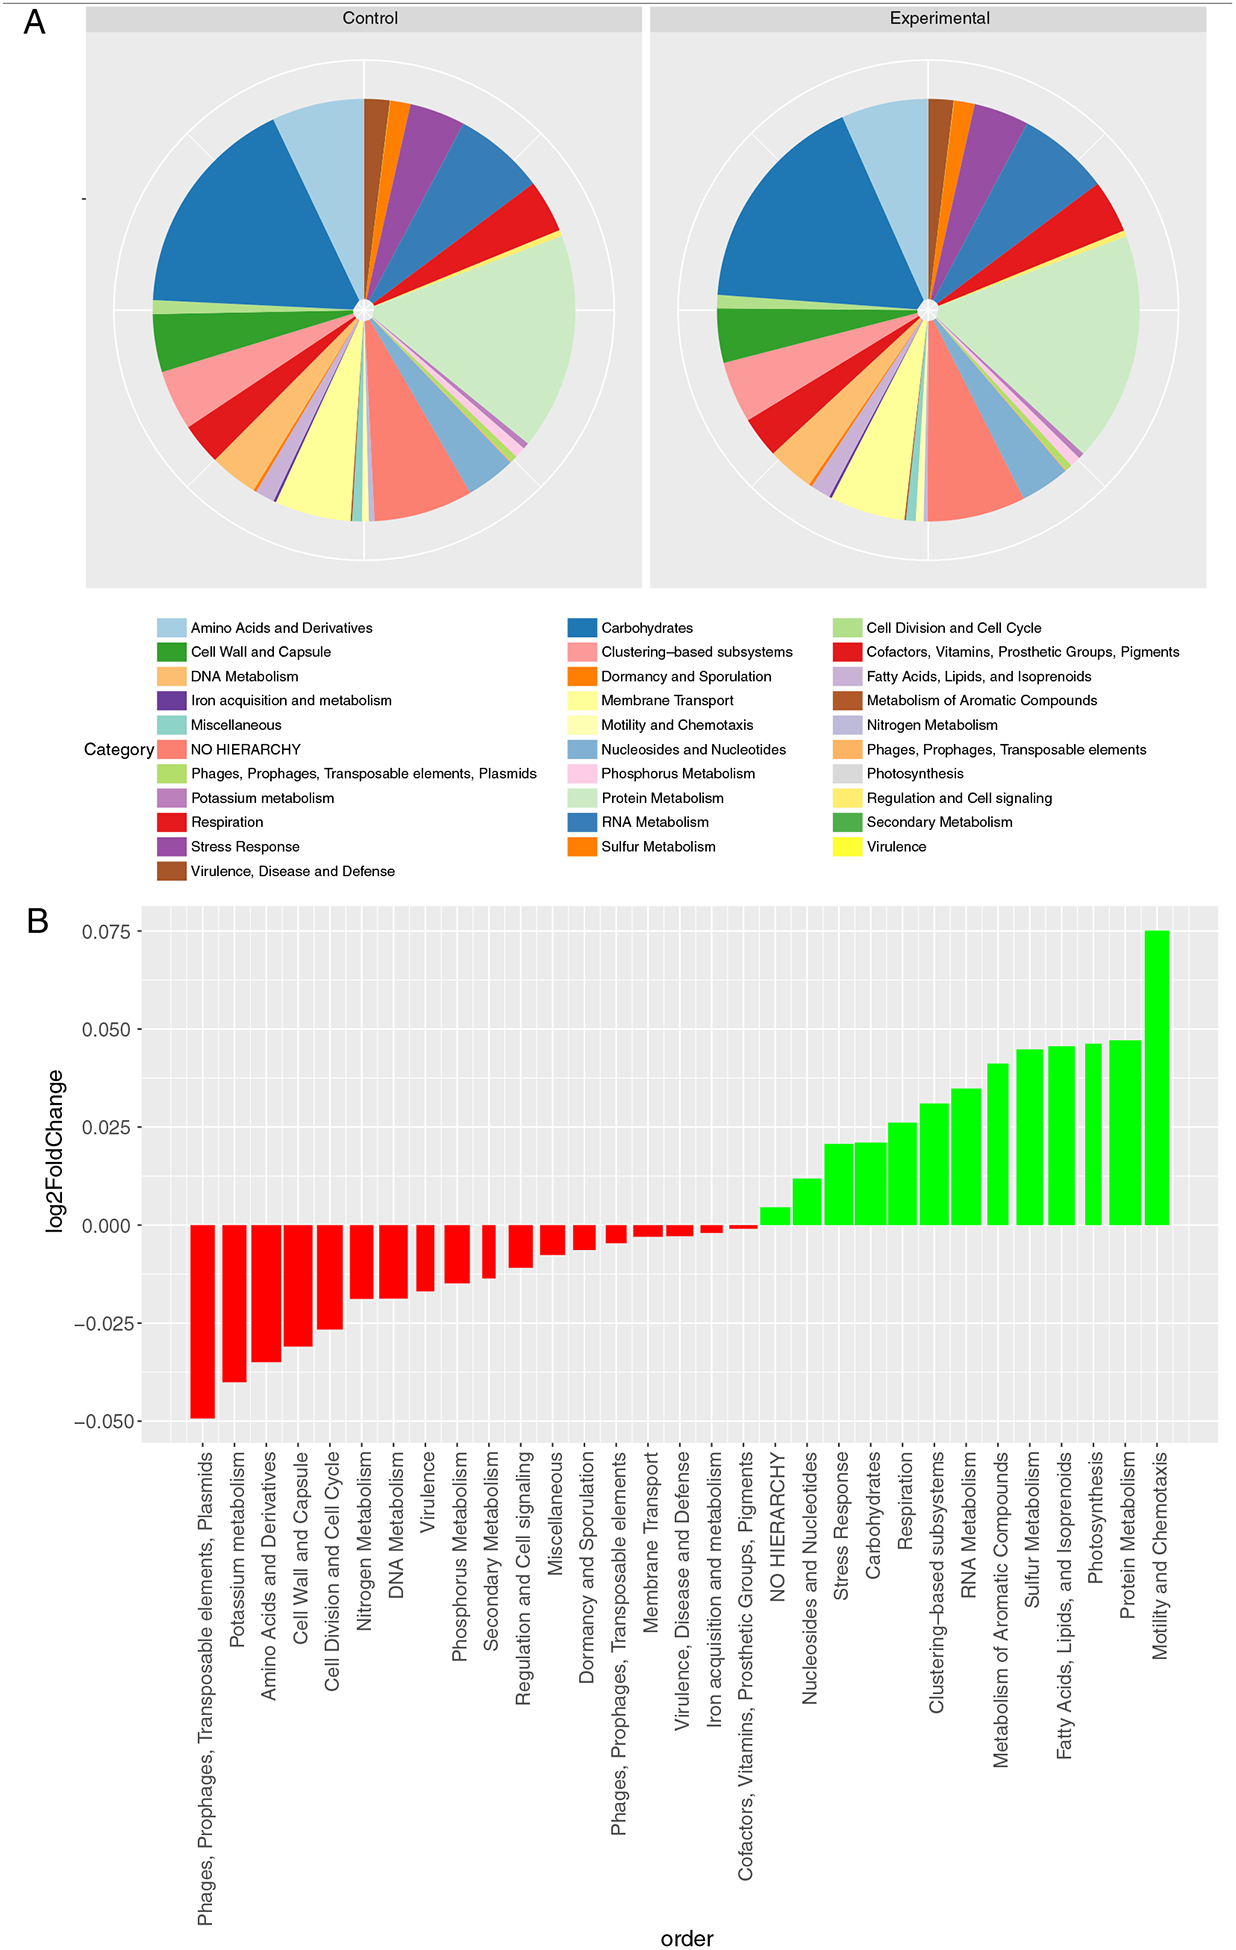
Functional annotations associated with expressed microbial transcripts in fecal samples from control (unsupplemented) and experimental (BMO-supplemented) participants.(A) Pie chart shows the distributions of SEED Subsystems level 1 (top level) hierarchical categories for all transcripts in controls (day 0 samples) compared to division of transcripts among categories for all experimental (BMO supplement) samples. (B) For each SEED Subsytems level 1 (top level) annotation, the barplot shows the log2fold change observed due to BMO supplementation relative to baseline. Red bars indicate numerically lower abundance with the BMO supplement. Green bars indicate numerically higher abundance with BMO supplement. The bar width denotes relative number of reads annotated in each category. No changes noted are statistically significant.
Replicate samples before and after supplementation in the same subject enabled participant-specific analyses. Participant-specific analysis was performed using the Wald test in the DESeq2 R package [58], with a noise threshold of 300 normalized reads per sample. Results can be found in Table 2; for two of the six participants, significant functional changes were noted. As noted in Table 2, at level 1, the broadest SEED hierarchy level, participant 4006 showed a significant increase in aromatic compound metabolism and a decrease in phage and transposable element activity, regulation and cell signaling, and DNA metabolism after supplementation. Participant 4016 showed significantly increased sulfur metabolism and functions linked to mobility/chemotaxis of the microbiome. No significant changes were observed at level 1 for participants 4003, 4005, 4008 or 4009. Levels 2 and 3 of the Subsystems hierarchy expand upon these areas, revealing more specifically the functional targets of activity in the microbiomes of the two participants showing individual-specific effects. In summary, no main effect of BMO supplementation was seen on microbial functional activity, but numerous subtle changes were observed in a minority of the subjects.
Table 2.
Participant-specific SEED functional changes for levels 1, 2 and 3 of Subsystems hierarchy
| Significant changes for SEED Subsystems activity | ||||||
|---|---|---|---|---|---|---|
| Level 1 | 4003 | 4005 | 4006 | 4008 | 4009 | 4016 |
| Aromatic compound metabolism | n.a. | n.a. | 0.24 | n.a. | n.a. | n.a. |
| Phage & transposable element activity | n.a. | n.a. | −0.28 | n.a. | n.a. | n.a. |
| Regulation & cell signaling | n.a. | n.a. | −0.04 | n.a. | n.a. | n.a. |
| DNA metabolism | n.a. | n.a. | −0.07 | n.a. | n.a. | n.a. |
| Sulfur metabolism | n.a. | n.a. | n.a. | n.a. | n.a. | 0.41 |
| Mobility/chemotaxis | n.a. | n.a. | n.a. | n.a. | n.a. | 1.03 |
| Level 2 | 4003 | 4005 | 4006 | 4008 | 4009 | 4016 |
| Anaerobic degradation of aromatic compounds | n.a. | n.a. | 0.40 | n.a. | n.a. | n.a. |
| Aminosugars | n.a. | n.a. | n.a. | n.a. | n.a. | 0.55 |
| Flagellar mobility | n.a. | n.a. | n.a. | n.a. | n.a. | 1.34 |
| Sulfur metabolism | n.a. | n.a. | n.a. | n.a. | n.a. | 0.45 |
| Tricarboxylate transporters | n.a. | n.a. | n.a. | n.a. | n.a. | 1.25 |
| Monosaccharides | n.a. | n.a. | n.a. | n.a. | n.a. | 0.56 |
| Osmotic stress | n.a. | n.a. | n.a. | n.a. | n.a. | 0.87 |
| Lipopolysaccharide biosynthesis | n.a. | n.a. | n.a. | n.a. | n.a. | 0.47 |
| Heat shock | n.a. | n.a. | n.a. | n.a. | n.a. | −0.64 |
| ATP synthesis | n.a. | n.a. | n.a. | n.a. | n.a. | −0.29 |
| Level 3 | 4003 | 4005 | 4006 | 4008 | 4009 | 4016 |
| Anaerobic benzoate metabolism | n.a. | n.a. | 0.41 | n.a. | n.a. | n.a. |
| Flavocytochrome C | n.a. | n.a. | n.a. | n.a. | 0.89 | n.a. |
| Lysine fermentation | n.a. | n.a. | n.a. | n.a. | n.a. | 0.89 |
| Coenzyme M biosynthesis | n.a. | n.a. | n.a. | n.a. | n.a. | 6.20 |
| Anaerobic oxidative degradation of L-ornithine | n.a. | n.a. | n.a. | n.a. | n.a. | 1.24 |
| Choline transport | n.a. | n.a. | n.a. | n.a. | n.a. | 3.34 |
| Aromatic amino acid degradation | n.a. | n.a. | n.a. | n.a. | n.a. | 1.70 |
| L-ascorbate utilization (and related gene clusters) | n.a. | n.a. | n.a. | n.a. | n.a. | 2.79 |
| O-antigen capsule important for environmental persistence | n.a. | n.a. | n.a. | n.a. | n.a. | 2.62 |
| Carbazol degradation cluster | n.a. | n.a. | n.a. | n.a. | n.a. | 1.00 |
| L-rhamnose utilization | n.a. | n.a. | n.a. | n.a. | n.a. | 1.40 |
| Dimethylarginine metabolism | n.a. | n.a. | n.a. | n.a. | n.a. | 0.70 |
| Hfl operon | n.a. | n.a. | n.a. | n.a. | n.a. | 0.64 |
| Chitin and N-acetylglucosamine utilization | n.a. | n.a. | n.a. | n.a. | n.a. | 0.54 |
| Glycerol and glycerol-3-phosphate uptake and utilization | n.a. | n.a. | n.a. | n.a. | n.a. | 1.08 |
| Sugar utilization in Thermotogales | n.a. | n.a. | n.a. | n.a. | n.a. | 1.52 |
| Formate hydrogenase | n.a. | n.a. | n.a. | n.a. | n.a. | 0.51 |
| Arginine deiminase pathway | n.a. | n.a. | n.a. | n.a. | n.a. | 1.56 |
| Phage shock protein (psp) operon | n.a. | n.a. | n.a. | n.a. | n.a. | 1.07 |
| Heme, hemin uptake and utilization systems in Gram positives | n.a. | n.a. | n.a. | n.a. | n.a. | −0.70 |
| Carotenoids | n.a. | n.a. | n.a. | n.a. | n.a. | 1.45 |
| D-galacturonate and D-glucuronate utilization | n.a. | n.a. | n.a. | n.a. | n.a. | 1.17 |
| ABC transporter alkylphosphonate (TC 3.A.1.9.1) | n.a. | n.a. | n.a. | n.a. | n.a. | 1.21 |
| D-tagatose and galactitol utilization | n.a. | n.a. | n.a. | n.a. | n.a. | 1.15 |
| ATP-dependent RNA helicases, bacterial | n.a. | n.a. | n.a. | n.a. | n.a. | 0.67 |
| Flagellar motility | n.a. | n.a. | n.a. | n.a. | n.a. | 1.33 |
| L-fucose utilization | n.a. | n.a. | n.a. | n.a. | n.a. | 0.96 |
| Periplasmic-binding-protein-dependent transport system | n.a. | n.a. | n.a. | n.a. | n.a. | 1.06 |
| Galactosylceramide and sulfatide metabolism | n.a. | n.a. | n.a. | n.a. | n.a. | 0.48 |
| Flagellum | n.a. | n.a. | n.a. | n.a. | n.a. | 1.02 |
| Heat shock dnaK gene cluster extended | n.a. | n.a. | n.a. | n.a. | n.a. | −0.66 |
| Cjejuni colonization of chick caeca | n.a. | n.a. | n.a. | n.a. | n.a. | 1.26 |
| D-sorbitol (D-glucitol) and L-sorbose utilization | n.a. | n.a. | n.a. | n.a. | n.a. | 1.97 |
| Purine utilization | n.a. | n.a. | n.a. | n.a. | n.a. | 0.86 |
| N-acetyl-galactosamine and galactosamine utilization | n.a. | n.a. | n.a. | n.a. | n.a. | 0.58 |
| Photorespiration (oxidative C2 cycle) | n.a. | n.a. | n.a. | n.a. | n.a. | 1.87 |
| Cobalt-zinc-cadmium resistance | n.a. | n.a. | n.a. | n.a. | n.a. | 0.27 |
| Cold shock, CspA family of proteins | n.a. | n.a. | n.a. | n.a. | n.a. | 1.07 |
| D-gluconate and ketogluconates metabolism | n.a. | n.a. | n.a. | n.a. | n.a. | 0.59 |
| Flagellum in Campylobacter | n.a. | n.a. | n.a. | n.a. | n.a. | 1.48 |
| Histidine degradation | n.a. | n.a. | n.a. | n.a. | n.a. | 0.56 |
| Lactose utilization | n.a. | n.a. | n.a. | n.a. | n.a. | 0.62 |
| L-arabinose utilization | n.a. | n.a. | n.a. | n.a. | n.a. | 0.39 |
| Lipid A-Ara4N pathway (polymyxin resistance) | n.a. | n.a. | n.a. | n.a. | n.a. | −0.16 |
| Melibiose utilization | n.a. | n.a. | n.a. | n.a. | n.a. | 1.32 |
| Putative sugar ABC transporter (ytf cluster) | n.a. | n.a. | n.a. | n.a. | n.a. | 1.32 |
| Sucrose utilization | n.a. | n.a. | n.a. | n.a. | n.a. | −0.49 |
| Cluster Ytf and putative sugar transporter | n.a. | n.a. | n.a. | n.a. | n.a. | 0.95 |
| Sulfatases and sulfatase modifying factor 1 | n.a. | n.a. | n.a. | n.a. | n.a. | 0.56 |
| Transcription initiation, bacterial sigma factors | n.a. | n.a. | n.a. | n.a. | n.a. | 0.21 |
| Choline and betaine uptake and betaine biosynthesis | n.a. | n.a. | n.a. | n.a. | n.a. | 1.05 |
| Carnitine metabolism in microorganisms | n.a. | n.a. | n.a. | n.a. | n.a. | 1.46 |
| ABC transporter tungstate (TC 3.A.1.6.2) | n.a. | n.a. | n.a. | n.a. | n.a. | 0.51 |
| Protein chaperones | n.a. | n.a. | n.a. | n.a. | n.a. | −1.14 |
| ABC transporter peptide (TC 3.A.1.5.5) | n.a. | n.a. | n.a. | n.a. | n.a. | 0.31 |
| Zinc regulated enzymes | n.a. | n.a. | n.a. | n.a. | n.a. | −0.18 |
| Bacterial hemoglobins | n.a. | n.a. | n.a. | n.a. | n.a. | 0.51 |
| Glycerol fermenation to 1,3-propanediol | n.a. | n.a. | n.a. | n.a. | n.a. | 0.67 |
| Trehalose uptake and utilization | n.a. | n.a. | n.a. | n.a. | n.a. | 0.86 |
| ABC transporter dipeptide (TC 3.A.1.5.2) | n.a. | n.a. | n.a. | n.a. | n.a. | 0.56 |
| Glutathionylspermidine and trypanothione | n.a. | n.a. | n.a. | n.a. | n.a. | 0.93 |
| Heme biosynthesis orphans | n.a. | n.a. | n.a. | n.a. | n.a. | −0.28 |
| Serine biosynthesis | n.a. | n.a. | n.a. | n.a. | n.a. | 0.53 |
| Lactose and galactose uptake and utilization | n.a. | n.a. | n.a. | n.a. | n.a. | 0.49 |
Significant changes were only observed for individuals 4006 and 4016; the other participants showed no significantly differently expressed functional categories.
3.3. CAZy annotations reveal changes in Bacteroides and Eubacterium specific carbohydrate-related enzymes in one participant
The CAZy database is a collection of enzyme sequences utilized by microbes for carbohydrate and oligosaccharide breakdown [56]. Annotation against the CAZy database reveals no significant changes in carbohydrate-focused enzyme activity for the cohort. However, individual-specific annotation results revealed significant enzyme expression changes for participant 4003, with an increase in carbohydrate-associated enzymes from Eubacterium and decreases in carbohydrate-associated enzymes from Bacteroides. Eubacterium linked sucrose-6-phosphate hydrolase increased in level (3.55-log2fold increase, adjusted P=1.1e-4), while multiple Bacteroides associated glycoside hydrolases decreased (glycoside hydrolase families 2, 3, 28, 33, 43 and 51, mean reads=1.42e3, 1.45-log2fold mean change, mean adjusted P=.014). No significant changes were seen for CAZy enzyme activity in the other five participants. Interestingly, based on their completed 3-day diet records, 4003 increased their fiber intake by 8.8 g/d before initiating the high-BMO (27.1 g/d) arm compared with the placebo control (18.6 g/d) and low-BMO (18.1 g/d) arms. No other participants increased their fiber intake over the course of the study period. Partcipant 4006 decreased their fiber intake by 10.8 g/d over the course of the study period.
3.4. Bacteroides did not show significant changes in functional activity across the cohort
Members of the Bacteroides genus are known consumers of milk oligosaccharides within the gut environment [38,41]. To determine the Bacteroides-specific transcriptome, metatranscriptomic reads annotated to Bacteroides as a genus were matched to specific functions in RefSeq’s nonredundant bacterial database and to function annotations (bottom-level hierarchy) in SEED Subsystems. No significant changes were observed among specific functional transcription activities of Bacteroides across the entire cohort. Additionally, individual-specific examination of Bacteroides functional transcripts, using a Wald test for each participant, showed no significant changes in Bacteroides-specific reads at any hierarchy level of SEED Subsystems for any of the participants.
3.5. Fecal BMO are not significantly higher after supplementation
To determine the levels of BMO that reach the distal colon, fecal samples from all participants who completed the prior study [50] were assayed using specific standards for the oligosaccharides that were in the supplement. The detection of oligosaccharides in the fecal samples was complicated by the presence of fragments of food components and even host glycoproteins. Out of the 17 oligosaccharides identified in the supplement, 13 oligosaccharide species were monitored in fecal samples. A few oligosaccharides were excluded due to potential confounding effects induced by other dietary compounds. Levels of BMO found in feces did not increase significantly with BMO supplementation (Table 1). Detected levels for sialyllactose, the most abundant BMO, are shown in Fig. 6A; abundances of all other oligosaccharides are available in Supplementary Materials. In conclusion, BMO supplements consumed at these doses do not appear to reach the distal colon.
Fig. 6.
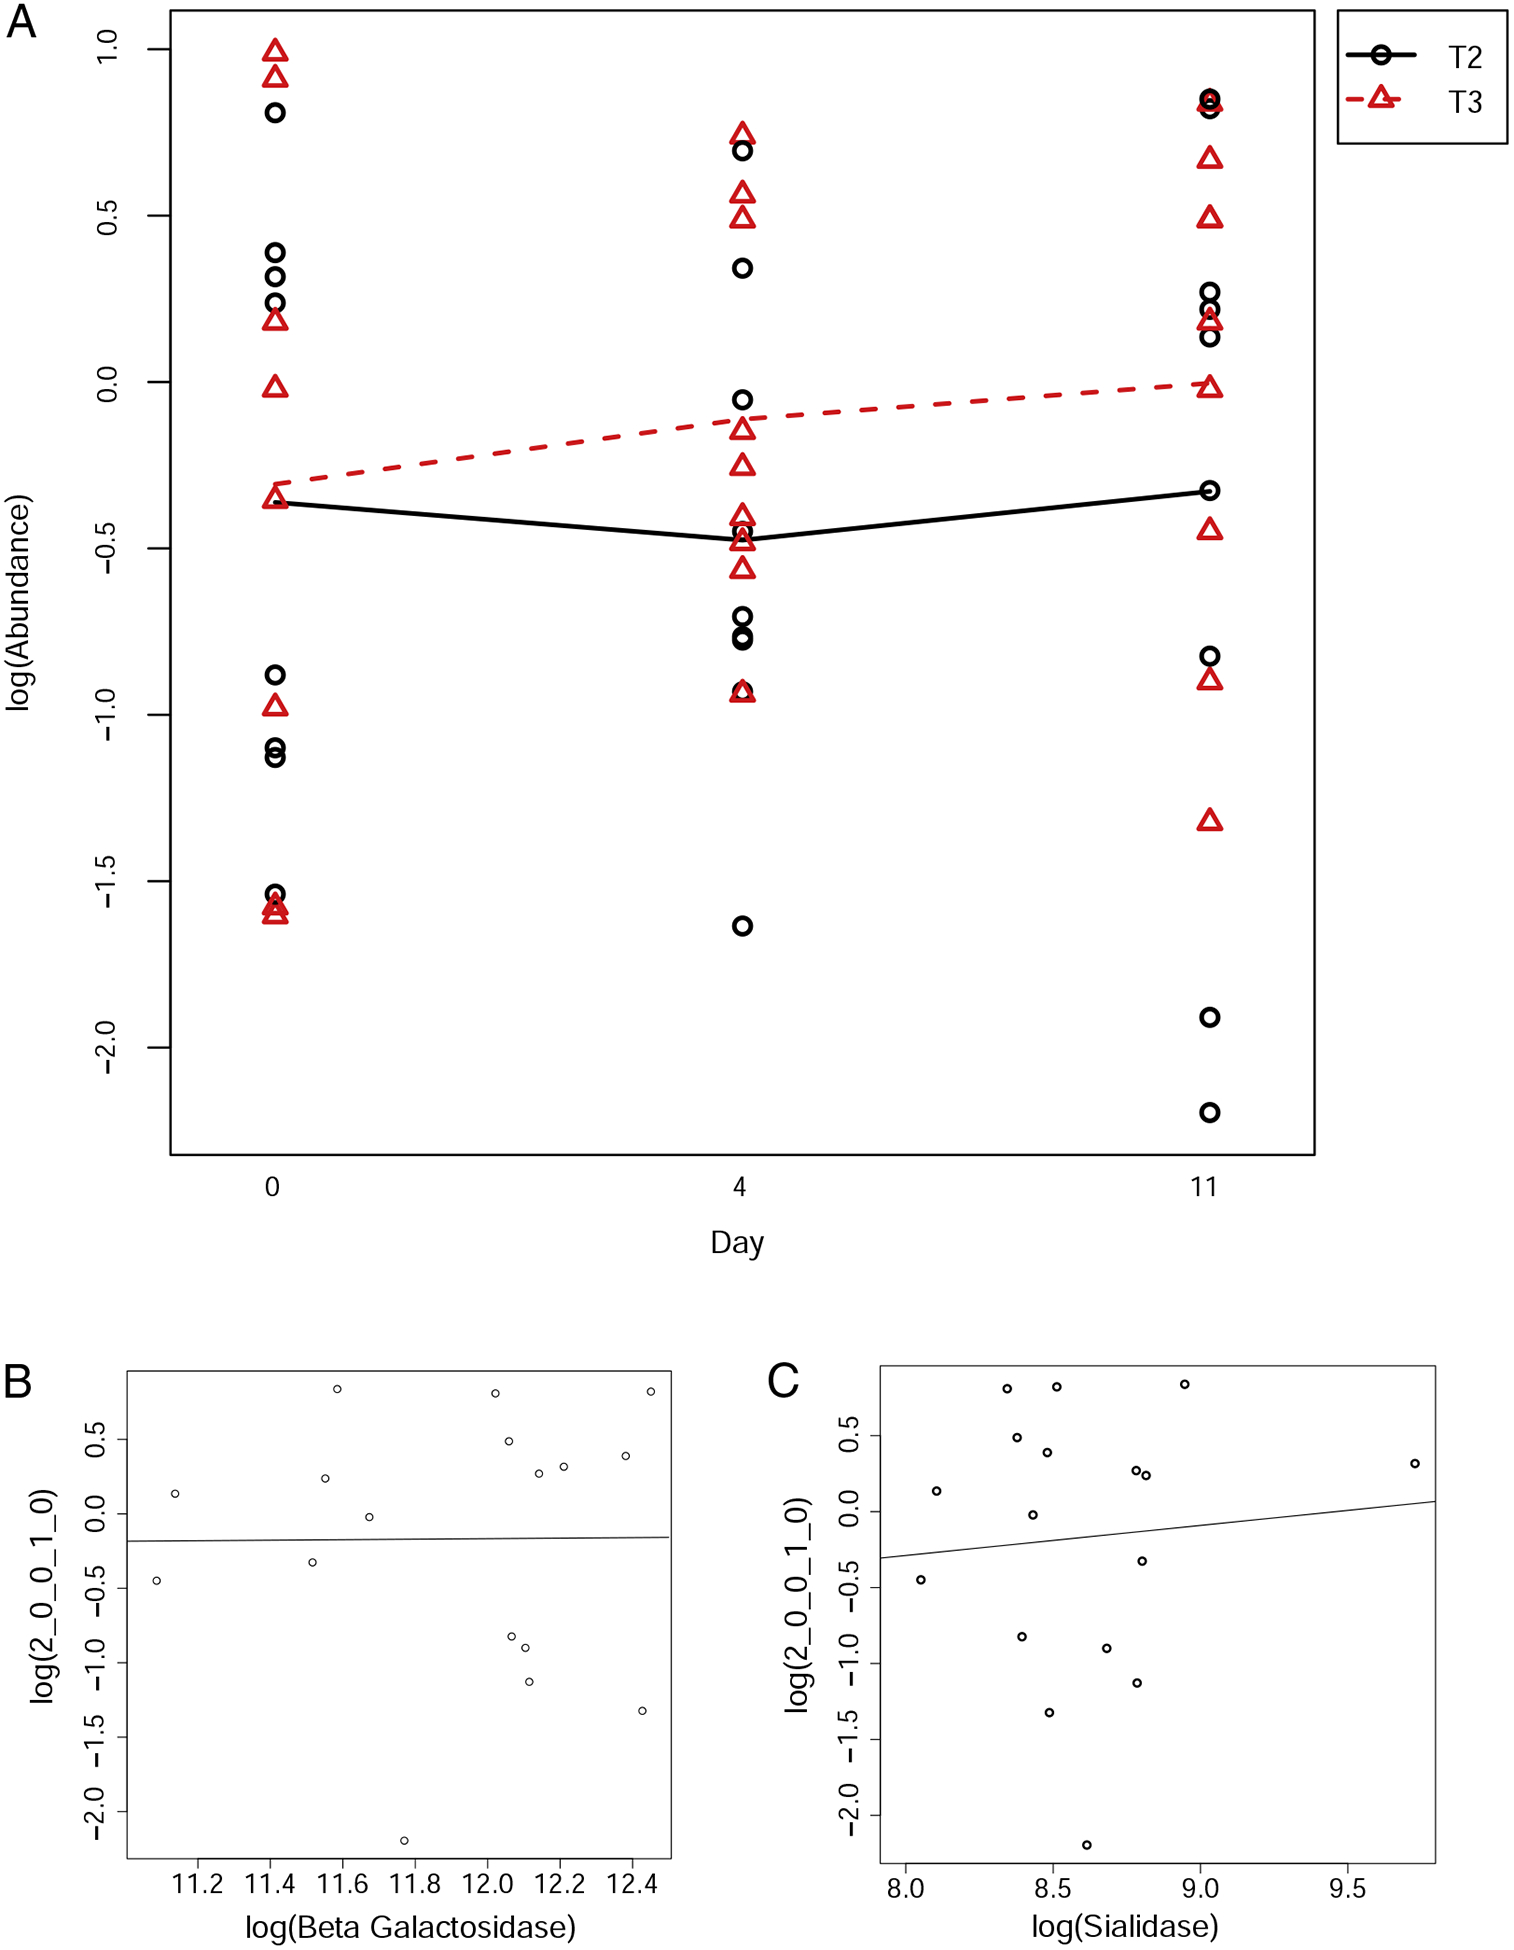
Correlation of BMO abundance in feces to BMO supplement dosage and expressed enzymes.(A) The y-axis indicates the abundance of sialyl-lactose, the most abundant oligosaccharide in the supplement, with each arm of the trial: T2 is the low-BMO dose arm, T3 is the high-BMO dose arm. The x-axis indicates the day of the arm (day 0, day 4 or day 11). Black circles indicate observed abundance levels for the low-BMO arm; red triangles indicate observed levels for the high-BMO arm. (B) Correlation of microbial beta-galactosidase transcript abundance with sialyl-lactose abundance in fecal samples (slope=10.83, P=.17). (C) Correlation of microbial sialidase transcript abundance with sialyl-lactose abundance in fecal samples (slope=2.85, P=.14).
3.6. Fecal BMO levels are not significantly correlated with production of saccharolytic microbial enzymes in the distal colon
Messenger RNA levels of two enzymes used by Bifidobacterium sp. and Bacteroides sp. for oligosaccharide consumption, betagalactosidase and sialidase [41] were quantified in the stool using metatranscriptomics. The absolute abundances of beta-galactosidase and sialidase were not significantly different after BMO supplementation (beta-galactosidase adjusted P=.886, sialidase adjusted P= .889). Relative expression levels of beta-galactosidase and sialidase produced by Bacteroides and Bifidobacteria do not correlate significantly with MS detection of any oligosaccharides within fecal samples (correlations with sialyl-lactose, the most abundant BMO structure in the supplement, are shown in Fig. 4B and C; correlations of other BMOs with beta-galactosidase and sialidase are available in Supplementary Materials).
3.7. Observation of host transcripts reveals no significant changes from BMO supplementation
The human intestinal tract constantly sheds a mixture of cells, which comprise a minority of the total cells and genetic information present in feces [62]. Using the RefSeq human proteome, sequences were annotated to determine functional activity of host cells present in fecal samples. Approximately 0.7% of all genetic material was mapped to the human proteome. Requiring a total number of annotations greater than 500 normalized reads, 2472 unique human transcripts were expressed. Statistical analysis revealed no human genes with significant change in expression. These data suggest that BMO supplementation does not alter the expression of genes in host-derived cells in stool.
4. Discussion
Milk oligosaccharides have beneficial effects on the microbiomes of infants. In humans, HMO consumption spurs growth of Bifidobacterium and Bacteroides species [30,34,35,38,41]; in mice, BMO alleviate symptoms of a high-fat Western diet and provide a restorative effect on dysbiotic gut microbiomes [63,64]. BMO have not yet been tested for prebiotic efficacy in humans. A previous clinical trial demonstrated that BMO supplementation does not affect stool consistency, GI symptoms or fecal microbiome composition [50]. This study extends that work by investigating the change in microbial gene expression, fecal BMO composition and exfoliated colonocytes gene expression in the same healthy cohort. We demonstrated that supplementation of the diet of adult healthy humans with BMO did not provoke consistent changes in the activity of organisms or of functions in the gut microbiome and did not modulate gene expression of exfoliated colonocytes. We performed MS of fecal samples to test for the presence of intact BMO and detected that fecal BMO levels did not increase with supplementation. Oligosaccharide levels also did not correlate with levels of expressed enzymes from the microbiome of the distal colon. Given that the BMO substrate was also not differentially detected in the stool of BMO-supplemented subjects relative to baseline, this provides strong evidence that insufficient BMO persist to the distal colon to change the microbial metatranscriptome. Microbial genes for enzymes that would be expected to digest BMO were expressed even in samples from participants at baseline. This evidence suggests that healthy adult microbiomes are enzymatically equipped to readily ferment BMO. Because these data are derived from fecal samples, the microbial profile only reveals activities of the distal colon. Together, these results further support that BMO fermentation by gut microbes occurs in the GI tract proximal to the distal colon in healthy adults.
Studies of milk oligosaccharide supplementation in humans are rare. Formula supplemented with 2’fucosyllactose (2’FL) and/or lacto-N-neotetraose (LNnT) has been tested for growth and tolerance in infants but not for effects on microbiota [65,66]. Supplementation with two HMO — 2’FL and LNnT — was previously shown to be bifidogenic in healthy Danish adults [67]. Meanwhile, we did not find milk oligosaccharides to be bifidogenic in our similarly sized cohort [50]: n=10 per group in the former study vs. n=9 in our crossover study. In the present study, the transcriptional activity of Bifidobacterium sp. was not changed by BMO supplementation. There are several possible reasons for the discrepancies in findings. First, the expansion of Actinobacteria in the Danish cohort was due to a single OTU that most closely mapped to a species of bifidobacteria (B. adolescentis) that is not known to consume HMO [67]. Bifidobacterial species and strains are known to be variable in their ability to consume HMO [68–72]. It is possible that the Danish cohort shared a strain of HMO-consuming bifidobacteria, while the American cohort did not. Notably, Bifidobacterium does not appear as one of the most active genera in adults in our cohort. Second, in the present study, the BMO supplement was quite different in composition in that it was enriched for sialylated oligosaccharides and contained very little 2’FL (<1%) or LNnT (b 3.8%) (Table 1). It is possible that 2’FL and/or LNnT have a stronger effect on microbiota and that more of these substrates survive the length of the GI tract. Moreover, the heterogeneous mix of BMO makes it more difficult to demultiplex the heterogeneous effects of individual milk oligosaccharides.
Studies in animal models are supportive of fermentation of BMO in the ileum, cecum or proximal colon, albeit not via Bifidobacteria. The supplementation of sialylated BMO (S-BMO) in gnotobiotic mice and pigs inoculated with an infant gut microbiome did not alter the transcription of Bifidobacterium sp. [73]. The transcription of a Bacteroides species, B. fragilis, was increased by the S-BMO in the mice and to a lesser extent in the pigs as it was only found after relaxing the multiple hypothesis testing correction. Also, these minor transcriptional changes in mice and pigs in response to S-BMO supplementation were noted in the cecum, not the colon. In conventional mice fed a Western Diet, the addition of BMO increased the abundance of Lactobacillus in the cecum and proximal colon [63]. In a mouse model of high-fat diet-induced obesity, Lactobacillus bloomed in the ileum of BMO-fed animals but not in the proximal colon [64]. These results are consistent with our finding that the primary site of fermentation of BMO is not the distal colon.
Previous studies have used mRNA extracted from stool as a marker of gene expression by host colonocytes. The human GI tract sheds epithelial cells, which are passed in stool and can be extracted as intact colonocytes [74]. These cells, once harvested, can provide a source of mRNA to measure changes in host gut expression, which has been previously used for evaluating drug-induced pathophysiology [75] and quantifying changes in gene expression from dietary changes in humans [76]. We annotated sequences against the human proteome to identify a small fraction of total mRNA from the shed colonocytes and analyzed gene expression. We observed no significant changes in host colonocyte gene expression from supplementation. This provides further evidence for tolerability of the supplement.
Fecal glycomics is especially challenging. The method leveraged in the current study [60] was originally developed for use with infant fecal samples. Adults consume a considerably more variable diet; many plant foods and host-derived glycans may be contributing to oligosaccharide levels in feces. As a result, the glycan contents of fecal samples from adults are difficult to analyze and to interpret. We minimized this complexity using standards for milk oligosaccharides and only analyzed spectra corresponding to those specific oligosaccharides for which high-quality MS/MS spectra were obtained.
The fact that the measured BMO in stool at baseline were nonzero suggests that BMO structures may not be completely distinguishable from fragments of host-derived glycans by MS since the identification is based on accurate mass. For example, “2 Hex 1 NeuAc” could be Glc-Gal-Neu5Ac or Gal-Gal-NeuAc, the latter of which could be a host-derived glycan fragment [77]. Given that each participant serves as their own control, we reasoned that host-derived glycans would have similar contamination effects at baseline and postsupplementation. Secondly, the quantity of the BMO supplement consumed was high — approximately 14 g/day, equivalent to at least 14 liters of commercial cow’s milk — such that it should be easily detectable if present. Likewise, the amount of BMO expected in an unsupplemented diet would be vanishingly small (b0.01 g/day) and therefore not influencing abundance measurements at any time point.
Metatranscriptomics is a new technique that has not yet been adopted in the nutrition field. Therefore, it is worth noting some difficult lessons learned in the context of nutrition studies. First, the greatest source of variation in this study came from differences between individuals, which underscores the importance of a crossover study design when monitoring the effects of dietary supplementation on the gut microbiome. Second, this study did not control participants’ diets, and although individuals typically eat similarly in a given season, we observed large differences in fiber intake across the study period in two of the six participants. Third, repeated measures on each subject enabled us to examine subject-specific effects. Finally, it should not be assumed that a fermentable fiber will survive the length of the GI tract to cause observable changes in the fecal metatranscriptome.
Another limitation of this study is the relatively small size, having sequenced 24 metatranscriptomes from only 6 participants profiled. Although the crossover study design helps to remove some variability by allowing comparisons before and after supplementation on a perparticipant basis, some small and subtle changes to the microbiome may fall below the limit of detection. However, the use of repeated sampling did enable us to detect even vary small effect sizes (e.g., 1.03-log2fold change) as signficant in individual participants.
In summary, metatranscriptomics of fecal samples from healthy human adult individuals consuming a dietary supplement of BMO shows that the supplement does not cause significant changes, either in microbial organism or in functional activities in fecal samples as a proxy for the distal colon. MS of fecal samples demonstrates that intact BMO are not higher after supplementation. Exfoliated colonocyte gene expression is unaltered by the BMO supplement. All of these results confirm that BMO supplementation is safe and tolerable, without inducing changes in the microbial community or host-derived gut cells. Further, the BMO supplement appears to be fully digested, likely with the assistance of microbes that harbor the appropriate saccharolytic enzymes. Future investigation should focus on potential benefits of this fully fermented substrate, determining whether BMO supplementation, either with or without corresponding probiotic strains, may be able to restore balance and stability to a compromised or otherwise damaged microbiome and whether additional health benefits are conferred.
Supplementary Material
Acknowledgments
We thank Joyce Lee (California National Primate Research Center) for aid in RNA extraction from fecal samples. For library preparation and sequencing, we thank the DNA Technologies and Expression Analysis Cores at the UC Davis Genome Center.
Funding sources: This work was funded by Arla Food Ingredients. The parent clinical trial was funded by Dairy Research Institute. Additional support provided by the Shields Chair in Dairy Sciences and National Institutes of Health (NIH) grants AT008759 and AT007079. D.G.L. is supported by the U.S. Department of Agriculture project 2032-53000-001-00-D. The DNA Technologies and Expression Analysis Cores at the UC Davis Genome Center is supported by NIH Shared Instrumentation Grant 1S10OD010786-01. Funding organizations had no role in the design of the study or collection, analysis and interpretation of data or in writing the manuscript. The United States Department of Agriculture is an equal opportunity provider and employer.
Footnotes
Conflicts of interest
D.G.L., I.K., D.A.M. and D.B. received funding from Arla Food Ingredients for this project. D.B., J.T.S. and D.A.M. received research funding from National Dairy Council for the parent clinical trial. D.B. and D.A.M. are co-founders of Evolve Biosystems Inc., a company focused on diet-based manipulation of the fecal microbiota. None of the funding sponsors, nor Evolve Biosystems Inc., had any role in the design of the study; in the collection, analyses or interpretation of data; in the writing of the manuscript; or in the decision to publish the results.
Appendix A. Supplementary data
Supplementary data to this article can be found online at https://doi.org/10.1016/j.jnutbio.2020.108340.
References
- [1].Human Microbiome Project C. Structure, function and diversity of the healthy human microbiome. Nature 2012;486:207–14. [DOI] [PMC free article] [PubMed] [Google Scholar]
- [2].Sonnenburg ED, Sonnenburg JL. Starving our microbial self: the deleterious consequences of a diet deficient in microbiota-accessible carbohydrates. Cell Metab 2014;20:779–86. [DOI] [PMC free article] [PubMed] [Google Scholar]
- [3].Chen T, Long W, Zhang C, Liu S, Zhao L, Hamaker BR. Fiber-utilizing capacity varies in Prevotella-versus Bacteroides-dominated gut microbiota. Sci Rep 2017;7:2594. [DOI] [PMC free article] [PubMed] [Google Scholar]
- [4].Desai MS, Seekatz AM, Koropatkin NM, Kamada N, Hickey CA, Wolter M, et al. A dietary fiber-deprived gut microbiota degrades the colonic mucus barrier and enhances pathogen susceptibility. Cell. 2016;167:1339–53 e21. [DOI] [PMC free article] [PubMed] [Google Scholar]
- [5].Zhernakova A, Kurilshikov A, Bonder MJ, Tigchelaar EF, Schirmer M, Vatanen T, et al. Population-based metagenomics analysis reveals markers for gut microbiome composition and diversity. Science 2016;352:565–9. [DOI] [PMC free article] [PubMed] [Google Scholar]
- [6].Sonnenburg ED, Smits SA, Tikhonov M, Higginbottom SK, Wingreen NS, Sonnenburg JL. Diet-induced extinctions in the gut microbiota compound over generations. Nature 2016;529:212–5. [DOI] [PMC free article] [PubMed] [Google Scholar]
- [7].Round JL, Mazmanian SK. The gut microbiota shapes intestinal immune responses during health and disease. Nat Rev Immunol 2009;9:313–23. [DOI] [PMC free article] [PubMed] [Google Scholar]
- [8].Parthasarathy G, Chen J, Chen X, Chia N, O’Connor HM, Wolf PG, et al. Relationship between microbiota of the colonic mucosa vs feces and symptoms, colonic transit, and methane production in female patients with chronic constipation. Gastroenterology. 2016;150:367–79 e1. [DOI] [PMC free article] [PubMed] [Google Scholar]
- [9].El Kaoutari A, Armougom F, Gordon JI, Raoult D, Henrissat B. The abundance and variety of carbohydrate-active enzymes in the human gut microbiota. Nat Rev Microbiol 2013;11:497–504. [DOI] [PubMed] [Google Scholar]
- [10].Cho I, Blaser MJ. The human microbiome: at the interface of health and disease. Nat Rev Genet 2012;13:260–70. [DOI] [PMC free article] [PubMed] [Google Scholar]
- [11].Kostic AD, Howitt MR, Garrett WS. Exploring host-microbiota interactions in animal models and humans. Genes Dev 2013;27:701–18. [DOI] [PMC free article] [PubMed] [Google Scholar]
- [12].Lennon G, Balfe A, Earley H, Devane LA, Lavelle A, Winter DC, et al. Influences of the colonic microbiome on the mucous gel layer in ulcerative colitis. Gut Microbes 2014;5:277–85. [DOI] [PMC free article] [PubMed] [Google Scholar]
- [13].Levy M, Kolodziejczyk AA, Thaiss CA, Elinav E. Dysbiosis and the immune system. Nat Rev Immunol 2017;17:219–32. [DOI] [PubMed] [Google Scholar]
- [14].McKenna P, Hoffmann C, Minkah N, Aye PP, Lackner A, Liu Z, et al. The macaque gut microbiome in health, lentiviral infection. and chronic enterocolitis PLoS Pathog 2008;4:e20. [DOI] [PMC free article] [PubMed] [Google Scholar]
- [15].Abubucker S, Segata N, Goll J, Schubert AM, Izard J, Cantarel BL, et al. Metabolic reconstruction for metagenomic data and its application to the human microbiome. PLoS Comput Biol 2012;8:e1002358. [DOI] [PMC free article] [PubMed] [Google Scholar]
- [16].Meyer F, Paarmann D, D’Souza M, Olson R, Glass EM, Kubal M, et al. The metagenomics RAST server — a public resource for the automatic phylogenetic and functional analysis of metagenomes. BMC bioinformatics 2008;9:386. [DOI] [PMC free article] [PubMed] [Google Scholar]
- [17].Richter DC, Ott F, Auch AF, Schmid R, Huson DH. MetaSim: a sequencing simulator for genomics and metagenomics. PLoS One 2008;3:e3373. [DOI] [PMC free article] [PubMed] [Google Scholar]
- [18].Wang J, Jia H. Metagenome-wide association studies: fine-mining the microbiome. Nat Rev Microbiol 2016;14:508–22. [DOI] [PubMed] [Google Scholar]
- [19].Wang WL, Xu SY, Ren ZG, Tao L, Jiang JW, Zheng SS. Application of metagenomics in the human gut microbiome. World J Gastroenterol 2015;21:803–14. [DOI] [PMC free article] [PubMed] [Google Scholar]
- [20].Franzosa EA, Morgan XC, Segata N, Waldron L, Reyes J, Earl AM, et al. Relating the metatranscriptome and metagenome of the human gut. PNAS 2014;10. [DOI] [PMC free article] [PubMed] [Google Scholar]
- [21].Gosalbes MJ, Durban A, Pignatelli M, Abellan JJ, Jimenez-Hernandez N, Perez-Cobas AE, et al. Metatranscriptomic approach to analyze the functional human gut microbiota. PLoS One 2011;6:e17447. [DOI] [PMC free article] [PubMed] [Google Scholar]
- [22].Kopylova E, Noe L, Touzet H. SortMeRNA: fast and accurate filtering of ribosomal RNAs in metatranscriptomic data. Bioinformatics 2012;28:3211–7. [DOI] [PubMed] [Google Scholar]
- [23].Leimena MM, Ramiro-Garcia J, Davids M, Bogert B, Smidt H, Smid EJ, et al. A comprehensive metatranscriptome analysis pipeline and its validation using human small intestine microbiota datasets. BMC Genomics 2013;14:14. [DOI] [PMC free article] [PubMed] [Google Scholar]
- [24].Martinez X, Pozuelo M, Pascal V, Campos D, Gut I, Gut M, et al. MetaTrans: an open-source pipeline for metatranscriptomics. Sci Rep 2016;6:26447. [DOI] [PMC free article] [PubMed] [Google Scholar]
- [25].Westreich ST, Korf I, Mills DA, Lemay DG. SAMSA: A comprehensive metatranscriptome analysis pipeline. BMC Bioinformatics 2016;17(1):399. [DOI] [PMC free article] [PubMed] [Google Scholar]
- [26].Koenig JE, Spor A, Scalfone N, Fricker AD, Stombaugh J, Knight R, et al. Succession of microbial consortia in the developing infant gut microbiome. PNAS 2011;108:8. [DOI] [PMC free article] [PubMed] [Google Scholar]
- [27].Munyaka PM, Khafipour E, Ghia JE. External influence of early childhood establishment of gut microbiota and subsequent health implications. Front Pediatr 2014;2:109. [DOI] [PMC free article] [PubMed] [Google Scholar]
- [28].Stark PL, Lee A. The microbial ecology of the large bowel of breastfed and formula-fed infants during the first year of life. J Med Microbiol 1982;15: 189–203. [DOI] [PubMed] [Google Scholar]
- [29].Garrido D, Barile D, Mills DA. A molecular basis for bifidobacterial enrichment in the infant gastrointestinal tract. Adv Nutr 2012;3:415S–21S. [DOI] [PMC free article] [PubMed] [Google Scholar]
- [30].Zivkovic AM, German JB, Lebrilla CB, Mills DA. Human milk glycobiome and its impact on the infant gastrointestinal microbiota. Proc Natl Acad Sci U S A 2011; 108(Suppl. 1):4653–8. [DOI] [PMC free article] [PubMed] [Google Scholar]
- [31].Frese SA, Hutton AA, Contreras LN, Shaw CA, Palumbo MC, Casaburi G, et al. Persistence of supplemented Bifidobacterium longumsubsp. infantis EVC001 in breastfed infants mSphere 2017;2. [DOI] [PMC free article] [PubMed] [Google Scholar]
- [32].Asakuma S, Hatakeyama E, Urashima T, Yoshida E, Katayama T, Yamamoto K, et al. Physiology of consumption of human milk oligosaccharides by infant gut-associated bifidobacteria. J Biol Chem 2011;286:34583–92. [DOI] [PMC free article] [PubMed] [Google Scholar]
- [33].Newburg DS. Neonatal protection by an innate immune system of human milk consisting of oligosaccharides and glycans. J Anim Sci 2009;87:26–34. [DOI] [PubMed] [Google Scholar]
- [34].Sela DA, Mills DA. Nursing our microbiota: molecular linkages between bifidobacteria and milk oligosaccharides. Trends Microbiol 2010;18:298–307. [DOI] [PMC free article] [PubMed] [Google Scholar]
- [35].German JB, Freeman SL, Lebrilla CB, Mills DA. Human milk oligosaccharides: evolution, structures and bioselectivity as substrates for intestinal bacteria. Nestle Nutr Workshop Ser Pediatr Program 2008;62:205–18 [discussion 18–22]. [DOI] [PMC free article] [PubMed] [Google Scholar]
- [36].Coppa GV, Zampini L, Galeazzi T, Facinelli B, Ferrante L, Capretti R, et al. Human milk oligosaccharides inhibit the adhesion to Caco-2 cells of diarrheal pathogens: Escherichia coli, Vibrio cholerae. and Salmonella fyris Pediatr Res 2006;59: 377–82. [DOI] [PubMed] [Google Scholar]
- [37].Kuntz S, Rudloff S, Kunz C. Oligosaccharides from human milk influence growthrelated characteristics of intestinally transformed and non-transformed intestinal cells. Br J Nutr 2008;99:462–71. [DOI] [PubMed] [Google Scholar]
- [38].Marcobal A, Barboza M, Froehlich JW, Block DE, German JB, Lebrilla CB, et al. Consumption of human milk oligosaccharides by gut-related microbes. J Agric Food Chem 2010;58:5334–40. [DOI] [PMC free article] [PubMed] [Google Scholar]
- [39].Katayama T. Host-derived glycans serve as selected nutrients for the gut microbe: human milk oligosaccharides and bifidobacteria. Biosci Biotechnol Biochem 2016; 80:621–32. [DOI] [PubMed] [Google Scholar]
- [40].Sela DA, Chapman J, Adeuya A, Kim JH, Chen F, Whitehead TR, et al. The genome sequence of Bifidobacterium longum subsp. infantis reveals adaptations for milk utilization within the infant microbiome. PNaS 2008;105:18964–9. [DOI] [PMC free article] [PubMed] [Google Scholar]
- [41].Marcobal A, Barboza M, Sonnenburg ED, Pudlo N, Martens EC, Desai P, et al. Bacteroides in the infant gut consume milk oligosaccharides via mucus-utilization pathways. Cell Host Microbe 2011;10:507–14. [DOI] [PMC free article] [PubMed] [Google Scholar]
- [42].Angeloni S, Ridet JL, Kusy N, Gao H, Crevoisier F, Guinchard S, et al. Glycoprofiling with micro-arrays of glycoconjugates and lectins. Glycobiology 2005;15:31–41. [DOI] [PubMed] [Google Scholar]
- [43].Morrin ST, Lane JA, Marotta M, Bode L, Carrington SD, Irwin JA, et al. Bovine colostrum-driven modulation of intestinal epithelial cells for increased commensal colonisation. Appl Microbiol Biotechnol 2019;103:2745–58. [DOI] [PubMed] [Google Scholar]
- [44].Albrecht SLJ, Marino K, Al Busadah KA, Carrington SD, Hicjey RM. Rudd PM. A comparative study of free oligosaccharides in the milk of domestic animals. Br J Nutr 2014;111:1313–28. [DOI] [PubMed] [Google Scholar]
- [45].Marino KLJ, Abraham JL, Struwe WB, Harvey DJ, Marotta M, Hickey RM, et al. Method for milk oligosaccharides profiling by 2-aminobenzamide labeling and hydrophilic interaction chromatography. Glycobiology 2011;21:1317–30. [DOI] [PubMed] [Google Scholar]
- [46].Urashima TTE, Fukuda K, Asakuma S. Recent advances in studies on milk oligosaccharides of cows and other domestic farm animals. Biosci Biotech Biochem 2013;77:455–66. [DOI] [PubMed] [Google Scholar]
- [47].Aldredge DL, Geronimo MR, Hua S, Nwosu CC, Lebrilla CB, Barile D. Annotation and structural elucidation of bovine milk oligosaccharides and determination of novel fucosylated structures. Glycobiology 2013;23:664–76. [DOI] [PMC free article] [PubMed] [Google Scholar]
- [48].Barile D, Tao N, Lebrilla CB, Coisson JD, Arlorio M, German JB. Permeate from cheese whey ultrafiltration is a source of milk oligosaccharides. Int Dairy J 2009; 19:524–30. [DOI] [PMC free article] [PubMed] [Google Scholar]
- [49].Tao N, DePeters EJ, German JB, Grimm R, Lebrilla CB. Variations in bovine milk oligosaccharides during early and middle lactation stages analyzed by high-performance liquid chromatography-chip/mass spectrometry. J Dairy Sci 2009; 92:2991–3001. [DOI] [PubMed] [Google Scholar]
- [50].Smilowitz JT, Lemay DG, Kalanetra KM, Chin EL, Zivkovic AM, Breck MA, et al. Tolerability and safety of the intake of bovine milk oligosaccharides extracted from cheese whey in healthy human adults. J Nutr Sci 2017;6:e6. [DOI] [PMC free article] [PubMed] [Google Scholar]
- [51].Davidson LA, Lupton JR, Miskovsky E, Fields AP, Chapkin RS. Quantification of human intestinal gene expression profiles using exfoliated colonocytes: a pilot study. Biomarkers 2003;8:51–61. [DOI] [PubMed] [Google Scholar]
- [52].Baecke JA, Burema J. Frijters JE. A short questionnaire for the measurement of habitual physical activity in epidemiological studies. Am J Clin Nutr 1982;36: 936–42. [DOI] [PubMed] [Google Scholar]
- [53].Westreich ST, Treiber ML, Mills DA, Korf I, Lemay DG. SAMSA2: a standalone metatranscriptome analysis pipeline. BMC bioinformatics. 2018;19:175. [DOI] [PMC free article] [PubMed] [Google Scholar]
- [54].Bolger AM, Lohse M, Usadel B. Trimmomatic: a flexible trimmer for Illumina sequence data. Bioinformatics 2014;30:2114–20. [DOI] [PMC free article] [PubMed] [Google Scholar]
- [55].Zhang J, Kobert K, Flouri T, Stamatakis A. PEAR: a fast and accurate Illumina Paired-End reAd mergeR. Bioinformatics 2014;30:614–20. [DOI] [PMC free article] [PubMed] [Google Scholar]
- [56].Cantarel BL, Coutinho PM, Rancurel C, Bernard T, Lombard V, Henrissat B. The Carbohydrate-Active EnZymes database (CAZy): an expert resource for glycogenomics. Nucleic Acids Res 2009;37:D233–8. [DOI] [PMC free article] [PubMed] [Google Scholar]
- [57].Overbeek R, Olson R, Pusch GD, Olsen GJ, Davis JJ, Disz T, et al. The SEED and the Rapid Annotation of microbial genomes using Subsystems Technology (RAST). Nucleic Acids Res 2014;42:D206–14. [DOI] [PMC free article] [PubMed] [Google Scholar]
- [58].Love MI, Huber W, Anders S. Moderated estimation of fold change and dispersion for RNA-seq data with DESeq2. Genome Biol 2014;15:550. [DOI] [PMC free article] [PubMed] [Google Scholar]
- [59].Tatusova T, Ciufo S, Fedorov B, O’Neill K, Tolstoy I. RefSeq microbial genomes database: new representation and annotation strategy. Nucleic Acids Res 2014; 42:D553–9. [DOI] [PMC free article] [PubMed] [Google Scholar]
- [60].De Leoz MLA, Wu S, Strum JS, Niñonuevo MR, Gaerlan SC, Mirmiran M, et al. A quantitative and comprehensive method to analyze human milk oligosaccharide structures in the urine and feces of infants. Anal Bioanal Chem 2013;405: 4089–105. [DOI] [PMC free article] [PubMed] [Google Scholar]
- [61].Tobin J. Estimation of relationships for limited dependent variables. Econometrica 1958;26:24–36. [Google Scholar]
- [62].Loktionov A. Cell exfoliation in the human colon: myth, reality and implications for colorectal cancer screening. Int J Cancer 2007;120:2281–9. [DOI] [PubMed] [Google Scholar]
- [63].Boudry G, Hamilton MK, Chichlowski M, Wickramasinghe S, Barile D, Kalanetra KM, et al. Bovine milk oligosaccharides decrease gut permeability and improve inflammation and microbial dysbiosis in diet-induced obese mice. J Dairy Sci 2017;100:2471–81. [DOI] [PMC free article] [PubMed] [Google Scholar]
- [64].Hamilton MK, Ronveaux CC, Rust BM, Newman JW, Hawley M, Barile D, et al. Prebiotic milk oligosaccharides prevent development of obese phenotype, impairment of gut permeability, and microbial dysbiosis in high fat-fed mice. Am J Physiol Gastrointest Liver Physiol 2017;312:G474–G87. [DOI] [PMC free article] [PubMed] [Google Scholar]
- [65].Marriage BJ, Buck RH, Goehring KC, Oliver JS, Williams JA. Infants fed a lower calorie formula with 2’FL show growth and 2’FL uptake like breast-fed infants. J Pediatr Gastroenterol Nutr 2015;61:649–58. [DOI] [PMC free article] [PubMed] [Google Scholar]
- [66].Puccio G, Alliet P, Cajozzo C, Janssens E, Corsello G, Sprenger N, et al. Effects of infant formula with human milk oligosaccharides on growth and morbidity: a randomized multicenter trial. J Pediatr Gastroenterol Nutr 2017;64:624–31. [DOI] [PMC free article] [PubMed] [Google Scholar]
- [67].Elison E, Vigsnaes LK, Rindom Krogsgaard L, Rasmussen J, Sorensen N, McConnell B, et al. Oral supplementation of healthy adults with 2’-O-fucosyllactose and lacto- N-neotetraose is well tolerated and shifts the intestinal microbiota. Br J Nutr 2016;116:1356–68. [DOI] [PMC free article] [PubMed] [Google Scholar]
- [68].Ward RE, Ninonuevo M, Mills DA, Lebrilla CB, German JB. In vitro fermentability of human milk oligosaccharides by several strains of bifidobacteria. Mol Nutr Food Res 2007;51:1398–405. [DOI] [PubMed] [Google Scholar]
- [69].Yu ZT, Chen C, Newburg DS. Utilization of major fucosylated and sialylated human milk oligosaccharides by isolated human gut microbes. Glycobiology 2013;23: 1281–92. [DOI] [PMC free article] [PubMed] [Google Scholar]
- [70].Ruiz-Moyano S, Totten SM, Garrido DA, Smilowitz JT, German JB, Lebrilla CB, et al. Variation in consumption of human milk oligosaccharides by infant gut-associated strains of Bifidobacterium breve. Appl Environ Microbiol 2013;79. [DOI] [PMC free article] [PubMed] [Google Scholar]
- [71].Garrido D, Ruiz-Moyano S, Lemay DG, Sela DA, German JB, Mills DA. Comparative transcriptomics reveals key differences in the response to milk oligosaccharides of infant gut-associated bifidobacteria. Sci Rep 2015;5:13517. [DOI] [PMC free article] [PubMed] [Google Scholar]
- [72].Garrido D, Ruiz-Moyano S, Kirmiz N, Davis JC, Totten SM, Lemay DG, et al. A novel gene cluster allows preferential utilization of fucosylated milk oligosaccharides in Bifidobacterium longum subsp. longum SC596 Sci Rep 2016;6:35045. [DOI] [PMC free article] [PubMed] [Google Scholar]
- [73].Charbonneau MR, O’Donnell D, Blanton LV, Totten SM, Davis JC, Barratt MJ, et al. Sialylated milk oligosaccharides promote microbiota-dependent growth in models of infant undernutrition. Cell 2016;164:859–71. [DOI] [PMC free article] [PubMed] [Google Scholar]
- [74].Iyengar V, Albaugh GP, Lohani A, Nair PP. Human stools as a source of viable colonic epithelial cells. FASEB 2017;5:2856–9. [DOI] [PubMed] [Google Scholar]
- [75].Whitfield-Cargile CM, Cohen ND, He K, Ivanov I, Goldsby JS, Chamoun-Emanuelli A, et al. The non-invasive exfoliated transcriptome (exfoliome) reflects the tissue-level transcriptome in a mouse model of NSAID enteropathy. Sci Rep 2017; 7:14687. [DOI] [PMC free article] [PubMed] [Google Scholar]
- [76].Chapkin RS, Zhao C, Ivanov I, Davidson LA, Goldsby JS, Lupton JR, et al. Noninvasive stool-based detection of infant gastrointestinal development using gene expression profiles from exfoliated epithelial cells. Am J Physiol Gastrointest Liver Physiol 2010;298:G582–9. [DOI] [PMC free article] [PubMed] [Google Scholar]
- [77].Tailford LECE, Kavanaugh D, Juge N. Mucin glycan foraging in the human gut microbiome. Front Genet 2015;6. [DOI] [PMC free article] [PubMed] [Google Scholar]
Associated Data
This section collects any data citations, data availability statements, or supplementary materials included in this article.