

Abstract
To prevent scaling and to recycle aqueous solutions in industrial processes, the thermodynamic properties of the CaSO4–H2SO4–H2O system are studied by thermodynamic modeling with the Pitzer model. The published solubility data of calcium sulfate hydrates in sulfuric acid solutions were collected and reviewed critically. Then, the CaSO4–H2SO4–H2O system was modeled using the Pitzer activity coefficient approach from critically selected experimental data to obtain optimized parameters. The model reproduces the solubility data with good accuracy up to 5 m sulfuric acid at temperatures of 283.15–368.15, 283.15–473.15, and 298.15–398.15 K for gypsum (CaSO4·2H2O), anhydrite (CaSO4), and hemihydrate (CaSO4·0.5H2O), respectively. However, at temperatures above 398.15 K and sulfuric acid concentration above 0.5 mol/kg, the solubility of anhydrite predicted by our model deviates significantly from the literature data. Our model predicts that the solubility of anhydrite would first increase but then decrease in more concentrated sulfuric acid solutions, which is in disagreement with the experimental data showing constantly increasing solubilities as a function of increasing sulfuric acid concentration. This discrepancy has been discussed. The transformations of gypsum to anhydrite and hemihydrate were predicted in sulfuric acid solutions. With increasing H2SO4 concentration, the transformation temperatures of gypsum to anhydrite and hemihydrate will decrease. Thus, gypsum is stable at low temperatures in solutions of low H2SO4 concentrations and transforms to anhydrite at high temperatures and in concentrated H2SO4 solutions, while hemihydrate is always a metastable phase. Furthermore, the predicted results were compared with previous experimental studies to verify the accuracy of the model.
1. Introduction
Calcium sulfate is one of the most common inorganic salts with a high scaling potential existing in many industrial processes.1 It mainly precipitates as a solid scale on equipment surfaces or piping networks, causing production losses, downtime, and efficiency decrease. Calcium sulfate scaling appears commonly in industrial processes when treating natural ores containing calcium minerals with sulfuric acid, especially in the hydrometallurgical processes of primary tungsten, copper, nickel, and zinc manufacturing.2−5 Despite its negative influences, the small solubility of calcium sulfate is beneficial for recycling aqueous solutions in the processing circuit since it limits the accumulation of calcium and sulfate in the process solutions. Therefore, understanding the detailed thermodynamic properties of the CaSO4–H2SO4–H2O system is of great theoretical and practical importance to prevent scaling and the aqueous process solution circulation.
In aqueous solutions, calcium sulfate forms two hydrates with the chemical names hemihydrate (HH, CaSO4·0.5H2O) and dihydrate or gypsum (DH, CaSO4·2H2O), in addition to anhydrite (AH, CaSO4). The stability regions of calcium sulfates depend on the solution conditions, such as temperature and sulfuric acid concentration, which complicate the prediction and control of calcium sulfate scaling.1 The solubilities of calcium sulfates in water and electrolyte salt systems have been extensively studied experimentally and theoretically over recent decades ever since the mid-19th century.6 Several experimental data sets are also focused on the solubilities of calcium sulfates in H2SO4 solutions.
The aim of this study was to compile and reassess the experimental data of calcium sulfate in sulfuric acid solutions and model the CaSO4–H2SO4–H2O system up to 473.15 K. The assessment procedure was similar to that in our recent article concerning modeling the CaSO4–H2O system.7 The difference from the earlier assessment for the FeSO4–H2SO4–H2O8 and NiSO4–H2SO4–H2O9 systems is the model used for the H2SO4–H2O system.
All of the experimental data adopted in the modeling were taken from the published literature and reviewed critically. The optimized thermodynamic model parameters were obtained using thermodynamic equilibrium calculation software MTDATA, which uses a Gibbs energy minimization routine and includes the Pitzer activity coefficient model for the excess Gibbs energy of aqueous solutions. The CALPHAD method was used in the modeling to ensure internal consistency of the thermodynamic database.10 Furthermore, the modeling results were compared in detail with the previous studies to ensure the accuracy of this model and the completed critical analysis.
2. Thermodynamic Data
The experimental data about the solubilities of calcium sulfates in sulfuric acid solutions were collected from the available literature. The solubilities of gypsum and anhydrite in H2SO4 solutions have attracted many researchers, while that of hemihydrate has gained limited attention due to its metastable nature compared to gypsum and anhydrite.
Wang et al.11 determined the solubilities of gypsum and insoluble anhydrite in the CaSO4–H2SO4–H2O system at temperatures of 298.15 K, 323.15, 348.15, and 363.15 K in the H2SO4 concentration range of 0–4.6531 molality. Furthermore, Wang et al.11 studied the kinetics of transformation between gypsum and anhydrite in H2SO4 solutions at 298.15 and 363.15 K. They applied the Pitzer model to the stability regions of gypsum and anhydrite in the CaSO4–H2SO4–H2O system, used Pitzer parameters for the H2SO4–H2O system by Reardon and Beckie,12 and fitted Pitzer parameters for the interactions of calcium with HSO4(−), SO4(−2), and H(+).
Ling and Demopoulos13 measured the solubilities of calcium sulfates in 0–7.90 mol/kg H2SO4 solutions at 373.15 K using either calcium dihydrate or hemihydrate as the starting raw materials. They characterized the solid phase after 2 h of equilibration by X-ray diffraction. They found that when using calcium dihydrate as the starting material, the solid phase is a mixture of gypsum and hemihydrate in H2SO4 concentrations below 0.41 mol/kg, hemihydrate only in H2SO4 concentrations of 0.51–1.93 mol/kg H2O, and anhydrite with H2SO4 concentrations above 2.64 mol/kg H2O. If hemihydrate was used as the starting material, it was the only primary solid equilibrium phase with H2SO4 concentrations up to 1.93 mol/kg and anhydrite above 2.64 mol/kg H2O.
Azimi et al.14 measured the solubility of gypsum in 0.5 molarity H2SO4 solutions at temperatures of 298.15, 318.15, 343.15, and 363.15 K when researching the solubility of gypsum in the MgSO4–H2SO4–H2O system. Farrah et al.15 conducted experiments in 36 and 72 g of H2SO4/kg solution to determine the solubilities of gypsum and anhydrite at temperatures from 303.15 to 378.15 K in the MnSO4–H2SO4–H2O system. Zdanovskii et al.16,17 measured the solubilities of gypsum from 283.15 to 368.15 K, anhydrite from 283.15 to 323.15 K, and hemihydrate from 298.15 to 368.15 K in 0–40 mass % H2SO4 solutions when studying the dehydration of gypsum. Marshall and Jones18 determined the solubilities of gypsum from 298.15 to 333.15 K, hemihydrate at 398.15 K, and anhydrite from 398.15 to 623.15 K in 0–4.7 m solutions when assessing the second dissociation constant for sulfuric acid. Cameron and Breazeale19 measured the solubilities of gypsum in 0–292.92 g/L H2SO4 solutions at 298.15, 308.15, and 316.15 K.
When studying the ZnSO4–H2SO4–H2O system, Dutrizac5 determined the solubilities of gypsum on heating and cooling in two series of experiments. The first one was carried out from 293.15 to 368.15 K in 0–0.6 mol/L H2SO4 solutions and the second one from 293.15 to 353.15 K in 0.8–1.8 mol/L H2SO4 solutions. Dutrizac used excess gypsum as the raw material and examined the solid phase by X-ray diffraction. He discovered that gypsum was the only solid phase during heating and cooling in the first series up to 368.15 K and up to 0.6 mol/L H2SO4 solution. In the second series, a hysteresis behavior was found. When heating gypsum with increasing sulfuric acid concentrations, it remained the only solid to temperatures varying from 363.15 to 353.15 K. Then, anhydrite was formed, and the solubility dropped. The transition temperature decreased with increasing sulfuric acid concentration. On cooling, the anhydrite remained as a solid phase down to around 323.15 K, where gypsum was formed. Dutrizac further fitted the data for the solubilities and saturated solution densities as a function of temperature at different H2SO4 concentrations. The solubility data by Dutrizac used in this work were calculated from the smoothed equations and were not included in the assessment of this work but used in comparison, due to the absence of the original experimental data.
Huang and Luo20 presented the solubility of calcium sulfate in concentrated sulfuric acid (∼96 mass % H2SO4) from 283.15 to 473.15 K. Dvegubskii and Shchiponikova21 measured the solubilities and phase transformation of calcium sulfate in concentrated sulfuric acid in the temperature range of 393.15–453.15 K. Tsikaeva22 studied the solubilities of anhydrite in 65–95 mass % sulfuric acid at temperatures of 313.15, 353.15, and 373.15 K. Ostrovskii et al.23 carried out solubility experiments of calcium sulfate in 94, 98, and 100 mass % sulfuric acid solutions from 313.15 to 353.15 K. All of these solubility data are in concentrated sulfuric acid and were not considered in this work.
All of the solubility data for gypsum, anhydrite, and hemihydrate in aqueous sulfuric acid solutions were collected and are classified in Table 1. The unit of all data was converted to molality (mol/(kg H2O)) for the solubilities of calcium sulfates and sulfuric acid concentrations. The values of 136.14, 98.078, and 18.015 g/mol were adopted for the molar masses of CaSO4, H2SO4, and H2O in the data conversion to obtain the accurate data.
Table 1. Solubility Data of Calcium Sulfates in H2SO4 Solutions from the Literature.
| T, K | H2SO4, molality | pointsa | reported experimental error (%) | solid phase | reference |
|---|---|---|---|---|---|
| 298.15–363.15 | 0–4.0030 | 20 (20) | 0.1–2 | CaSO4·2H2O | Wang et al.11 |
| 298.15–363.15 | 0.4854–0.4990 | 4 (4) | 5 | CaSO4·2H2O | Azimi and Papangelakis14 |
| 303.15–353.15 | 0–0.7931 | 12 (12) | 6 | CaSO4·2H2O | Farrah et al.15 |
| 298.15–333.15 | 0–4.7000 | 74 (76)b | 4 | CaSO4·2H2O | Marshall and Jones18 |
| 283.15–368.15 | 0–6.8429 | 31(44)c | CaSO4·2H2O | Zdanovskii et al.16,17 | |
| 298.15–316.15 | 0–3.4081 | 2 (26)d | 0.1 | CaSO4·2H2O | Cameron and Breazeale19 |
| 298.15–363.15 | 0–4.6531 | 23 (28)e | 0.1–2 | CaSO4 | Wang et al.11 |
| 363.15–378.15 | 0–0.7922 | 0 (8) | 6 | CaSO4 | Farrah et al.15 |
| 398.15–623.15 | 0–1.2090 | 17(145)f | 4 | CaSO4 | Marshall and Jones18 |
| 283.15–323.15 | 0–4.3767 | 24 (26)g | CaSO4 | Zdanovskii16 | |
| 373.15 | 2.64–7.90 | 0 (3) | 0.45–4.117 | CaSO4 | Ling and Demopoulos13 |
| 398.15 | 0–1.0450 | 12 (12) | 4 | CaSO4·0.5H2O | Marshall and Jones18 |
| 298.15–368.15 | 0–6.8246 | 27 (32)h | CaSO4·0.5H2O | Zdanovskii et al.17 | |
| 373.15 | 0–1.93 | 14 (14) | 1.70–7.52 | CaSO4·0.5H2O | Ling and Demopoulos13 |
Total number of data points in the parentheses.
Except points 2.384 and 4.7 mol/kg H2SO4 at 313.15 K.
All points at 283.15 excluded except at 2.5525 mol/kg H2SO4, excluded points from 1.8038 to 6.8011 mol/kg H2SO4 at 298.15 K, excluded 0.8296 mol/kg H2SO4 at 308.15 K, all points excluded at 315.15 K, excluded 4.3781 and 6.8047 mol/kg H2SO4 at 323.15 K, excluded 6.8146 mol/kg H2SO4 at 348.15 K and 6.8429 mol/kg H2SO4 at 368.15 K.
Included only 0.0831 mol/kg H2SO4 at 298.15 K and 0.0496 mol/kg H2SO4 at 316.15 K.
Except points 3.0 and 4.5007 mol/kg H2SO4 at 323.15 K, 0.2001 and 3.0021 mol/kg H2SO4 at 348.15 K, and 3.0002 mol/kg H2SO4 at 363.15 K.
All points included at 398.15 K, included only 0.476–0.564 mol/kg H2SO4 at 423.15 K, included 0.00085–0.0023 and 0.481–0.578 mol/kg H2SO4 at 448.15 K, included 0.00014 and from 0.488 to 0.585 mol/kg H2SO4 at 473.15 K, all data above 473.15 K excluded.
Included all points except 2.5565 and 4.3767 mol/kg H2SO4 at 323.15 K.
Included all except points 6.8036 mol/kg H2SO4 at 298.15 K, 4.3823 and 6.8053 mol/kg H2SO4 at 323.15 K, 6.8121 mol/kg H2SO4 at 348.15 K, and 6.8246 mol/kg H2SO4 at 368.15 K.
Solubility data for the CaSO4–H2O system listed in our previous article7 was also included in the assessment, unchanged. The criteria used to include or exclude data points have been explained later in this article in Section 4.1.
3. Modeling the Aqueous Solutions
The Pitzer model, one of the most used activity coefficient models, has been extensively used for modeling thermodynamic properties of aqueous electrolyte systems. Pitzer and co-workers have provided the details of the model in the literature.24−26 It was developed by combining the expression of the Debye–Hückel electrostatic theory for long-range interactions and composition for short-range ion-specific interactions with a virial-type expansion. Harvie and Weare27 and Harvie et al.28 further included unsymmetrical electrostatic mixing terms in their modified Pitzer models to improve the fit in multicomponent systems. All of the necessary Pitzer model equations, variables, and parameters have been explained in the Supporting Information, where the typographical error in eq A-15 existing in previous works30−33 has been corrected. This correction does not have any effect on results presented in them.
3.1. Thermodynamic Functions
The consistent concentration unit in aqueous solutions is molality of CaSO4 and H2SO4 (mol/kg of water), used throughout this paper. The temperature dependency of Gibbs energy change for forming a solid phase has the following form
| 1 |
The general temperature dependency of the parameters for the Pitzer equation parameter (p) available in MTDATA is
| 2 |
3.2. Parameter Optimization
MTDATA version 6.0 was used for parameter fitting in this work. In MTDATA, there are several excess models available, including the Pitzer equation with Harvie et al.’s28 modification and the mole-fraction-based NPL Pitzer model.29 MTDATA solves thermodynamic equilibrium using the Gibbs energy minimization technique and also includes several thermodynamic databases for pure substances and several excess Gibbs energy models for different kinds of solutions. It also has an assessment module to fit model parameters from many types of experimental data. The objective function (OF) used in MTDATA is
| 3 |
where wi is the weight of the experimental value, Ci is the calculated value, Ei is the experimental value, and Ui is the uncertainty. All weights for the adopted experimental data, except for the rejected values, were set to 1 in the assessment and parameterization. For duplicates, the weight was set to 0.5.
In this work, the mean absolute percentage error (MAPE), also known as the absolute average relative deviation (AARD %), is used in the comparison between the experimental data and the predicted values of this study
| 4 |
4. Results and Discussion
4.1. Fitted Parameters
In a ternary system, the parameters of binary systems are very important. According to the Calphad methodology, the binary systems are fitted first. After critical evaluation of the binaries, the critical evaluation of the ternary system is based on the binaries. Sometimes, during the assessment of the ternary system, it becomes obvious that either Gibbs energies or activity coefficient parameters obtained from binary systems need to be refitted. So, the assessment of the ternary system will also serve as a quality test for binary assessments. As far as solubility is concerned, there is only one experimental data point for each temperature in the binary system, while in the ternary system, there can be several experimental data points at the same temperature as a function of the third component’s concentration.
Sulfuric acid dissociates completely to hydrogen and bisulfate ions, while bisulfate does not further dissociate completely to hydrogen and sulfate ions except in very dilute solutions. Sippola30,31,32 critically evaluated six different equilibrium constants (K2) for the dissociation of the bisulfate ion in the H2SO4–H2O system and discovered that four of them can describe the H2SO4–H2O system equally well in the temperature range of 273.15–323.15 K. Finally, Sippola and Taskinen33 reassessed the H2SO4–H2O system using the Pitzer equation in the temperature range of 273.15–443.15 K up to 6 m sulfuric acid. They fitted simultaneously the dissociation constant of the bisulfate ion as well as Pitzer parameters. The number of used Pitzer parameters was four, and the total number of used terms was only eight. Recently, we critically assessed the solubility data of gypsum, anhydrite, and hemihydrate in the available literature up to 473.15 K and obtained an excellent Pitzer model7 using only two Pitzer parameters, β(1) and β(2), with simple temperature dependency consisting of only two fitted terms in each. Our model for the CaSO4–H2SO4–H2O system will be based on these two critically fitted binary systems.
The critically evaluated solubility data of calcium sulfate in sulfuric acid solutions listed in Table 1 as well as the solubility in water18,34−52 applied in a previous work7 were used in the assessment of the CaSO4–H2SO4–H2O system. No change in the weights for the solubility in the CaSO4–H2O system was made.7
Due to the small values for solubilities of calcium sulfate hydrates in aqueous solutions, the same optimization technique was applied as in the assessment of the CaSO4–H2O system.7 Instead of comparing the calculated and measured solubilities, the difference in Gibbs energy was selected to fit the parameters of the Pitzer model. According to eq 1, in the solubility limit ΔG°(T) + RT ln(Ksp) = 0. Thus, we obtain
| 5 |
| 6 |
where ΔG° is the Gibbs energy change for each of the reactions
| 7 |
| 8 |
| 9 |
In this approach, Ci and Ei do not present the calculated and experimental solubilities, respectively. Ci presents the calculated standard Gibbs energy change ΔG° based on thermodynamic difference in standard state values for the solubility reaction, and Ei presents the Gibbs energy change calculated from the solubility product calculated from the activities of calcium sulfate and water in an aqueous solution. Ui will serve as an acceptable difference between these two values.
The uncertainty value (Ui) was set to 100 J/mol for stable phases, while 500 J/mol was used for metastable phases. Only the first three parameters AG–CG were found adequate to describe ΔG°(T).
The critical evaluation of the solubility data for the CaSO4–H2SO4–H2O system was performed during the assessment using the following procedure:
-
(1).
If all of the tested sets failed to model an experimental data point within given uncertainty, its weight was changed to zero.
-
(2).
If any of the tested sets were able to model it within a given uncertainty, its weight was changed to or retained as 1.
-
(3).
After changing the weights in solubility data, all parameter sets were refitted.
-
(4).
This procedure was repeated until no change was made in weights.
As a result, we considered achieving an internally consistent solubility data for the calcium sulfate in sulfuric acid.
Different sets of Pitzer parameters were tested in the assessment. The Pitzer parameters for the Ca2+–HSO4– ion interaction, β(1), β(2), and Cϕ, were included in all sets, but the temperature dependency used varied from one set to another. In most sets, the values of parameters β(1) and β(2) for the Ca2+–SO42– ion interaction were from model D in the previous work7 and were kept unchanged in the assessment. The parameter β(0) for the Ca2+–SO42– ion interaction was included in set-5, and all parameters of the Pitzer model in set-6 were released and refitted. In all of the sets, the parameters of Gibbs energy changes for forming the solid phase were refitted but described with the same temperature dependency as A + B × T + C × T ln T as in model D.
The summary of the assessment results for different Pitzer parameter sets is shown in Tables 2 and 3, indicating that set-1 is the best in the assessment with an OF value of 0.23, and its thermodynamic values are very close to other sets and the HSC 9 database53 in addition to NBS tables54 and CODATA values.55 Even though set-0 has also an equally small OF value, it uses one extra term for the Cϕ parameter. Moreover, analyzing the results revealed that the calculated activity of water with this set in some cases was exceeding 1. Including parameter β(0) for the Ca2+–SO42– ion interaction in set-5 improves the assessment so slightly that one extra parameter cannot be justified. Set-6 has the smallest OF value with released Ca2+–SO42– ion interaction parameters, but the resulted enthalpy change (ΔH°) for gypsum is much lower than the one in the literature. Also, the entropy change (ΔS°) differs distinctly from other values obtained with other sets as well as literature values. As a conclusion, six calcium ion interaction Pitzer parameters with 12 terms are required for the assessment of the CaSO4–H2SO4–H2O system.
Table 2. Summary of the Optimization of Pitzer Parameters for the CaSO4–H2SO4–H2O Systema.
| Ca2+–SO42– ion interaction |
Ca2+–HSO4– ion interaction |
||||||||||||||||||
|---|---|---|---|---|---|---|---|---|---|---|---|---|---|---|---|---|---|---|---|
| β(0) |
β(1) |
β(2) |
β(0) |
β(1) |
Cϕ |
||||||||||||||
| model | OF | a | bT | f/T | a | bT | f/T | a | bT | f/T | a | bT | f/T | a | bT | f/T | a | bT | f/T |
| set-0b | 0.23 | D | D | D | D | x | x | x | x | x | x | x | x | x | |||||
| set-1b | 0.23 | D | D | D | D | x | x | x | x | x | x | x | x | ||||||
| set-2b | 0.71 | D | D | D | D | x | x | x | x | x | x | ||||||||
| set-3b | 0.30 | D | D | D | D | x | x | x | x | x | x | x | |||||||
| set-4b | 0.39 | D | D | D | D | x | x | x | x | x | x | x | |||||||
| set-5b | 0.22 | x | x | D | D | D | D | x | x | x | x | x | x | x | x | ||||
| set-6 | 0.16 | x | x | x | x | x | x | x | x | x | x | x | x | ||||||
The parameters of Gibbs energy changes for forming the solid phase use the A + B × T + C × T ln T form.
Values of parameters β(1) and β(2) for Ca2+–SO42– ion interactions are from model D in a previous work7 and kept unchanged in the assessment.
Table 3. Summary of the Thermodynamic Values of Solubility Reactions at 298.15 Ka.
| gypsum |
anhydrite |
hemihydrate |
||||||||||
|---|---|---|---|---|---|---|---|---|---|---|---|---|
| model | ΔG° | ΔS° | ΔH° | ΔCp | ΔG° | ΔS° | ΔH° | ΔCp | ΔG° | ΔS° | ΔH° | ΔCp |
| model D7 | 26 372 | –95 | –1814 | –213 | 25 644 | –132 | –13 774 | –325 | 23 164 | –131 | –15 840 | –262 |
| set-0 | 26 392 | –95 | –2063 | –204 | 25 549 | –135 | –14 753 | –312 | 23 101 | –134 | –16 951 | –250 |
| set-1 | 26 394 | –95 | –2007 | –207 | 25 523 | –136 | –15 158 | –309 | 23 100 | –135 | –17 152 | –247 |
| set-2 | 26 353 | –94 | –1685 | –227 | 25 472 | –138 | –15 672 | –297 | 23 125 | –135 | –17 128 | –246 |
| set-3 | 26 428 | –95 | –1968 | –195 | 25 560 | –135 | –14 636 | –309 | 23 114 | –133 | –16 555 | –255 |
| set-4 | 26 416 | –94 | –1741 | –201 | 25 606 | –130 | –13 291 | –341 | 23 096 | –134 | –16 918 | –251 |
| set-5 | 26 360 | –96 | –2224 | –205 | 25 496 | –137 | –15 306 | –303 | 22 985 | –137 | –17 950 | –240 |
| set-6 | 26 797 | –114 | –7080 | –204 | 26 005 | –153 | –19 565 | –240 | 24 102 | –151 | –20 948 | –189 |
| HSC 953 | 26 518 | –92 | –1716 | 24 460 | –144 | –18 577 | 21 195 | –133 | –18 525 | |||
| NBS54 | 24 893 | –87 | –1130 | 23 662 | –140 | –17 990 | 20 051 | –129 | –18 275 | |||
| CODATA55 | 26 140 | –91 | –1130 | 25 223 | –140 | –17 990 | ||||||
ΔG° and ΔH°, J/mol; ΔS° and ΔCp, J/(mol·K). Clearly deviating values are indicated in bold.
The optimized Pitzer parameters of set-1 obtained in this work are given in Table 4, together with the parameters of the binary systems used in this work.
Table 4. Parameters of the Pitzer Model for the CaSO4–H2SO4–H2O System.
| ion interactions | coefficients | APitz | BPitz | FPitz | reference |
|---|---|---|---|---|---|
| Ca2+–SO42– | β(1) | –3.20249 | 0 | 1149.4 | model D7 |
| β(2) | 32.0227 | –0.27033 | 0 | ||
| Ca2+–HSO4– | β(0) | 1.20201 | –0.00420415 | 226.9 | set-1, this work |
| β(1) | –56.3747 | 0.096100 | 8930 | ||
| Cϕ | –0.75151556 | 0.00207479 | 0 | ||
| H+–SO42– | β(0) | 12.04250 | Sippola and Taskinen33 | ||
| Cϕ | 0.137684 | –30.395 | |||
| H+–HSO4– | β(0) | 0.24106 | –3.5118 × 10⁻⁴ | 22.0454 | |
| β(1) | 0.333982 | 39.296 |
The accessed temperature dependences of Gibbs energy change for solubility reactions for CaSO4(s), CaSO4·0.5H2O(s), and CaSO4·2H2O(s) are presented in Table 5. The experimental temperature ranges in the assessment were 273.15–368.15, 273.15–473.15, and 273.15–473.15 K for gypsum, anhydrite, and hemihydrate, respectively, with the H2SO4 concentrations covering the range of 0–5.0 mol/kg. The maximum differences in Gibbs energy change compared to model D in a previous work for gypsum, anhydrite, and hemihydrate are (temperature in parenthesis) −35 J/mol (331.15 K), 306 J/mol (473.15 K), and 184 J/mol (473.15 K), respectively. The average changes were 0.1, −0.2, and 0.1%, respectively.
Table 5. Assessed Temperature Dependences of Gibbs Energy Changes (J/mol) for Formation of the Equilibrium Solid Phases in This Work.
| phase | A | B | C | temperature range (K) |
|---|---|---|---|---|
| CaSO4·2H2O | –59 567.2 | 1287.94 | –206.522 | 273.15–368.15 |
| CaSO4 | –75 436.6 | 1898.65 | –303.855 | 273.15–473.15 |
| CaSO4·0.5H2O | –56 468.74 | 1518.79 | –246.924 | 273.15–473.15 |
The errors between experimental and calculated values of Gibbs energy changes for calcium sulfates in the assessment with optimized parameters are shown in Figure 1, in which the solid symbol means an adopted point, while the hollow means a point not used in the assessment of Pitzer parameters.
Figure 1.

Difference between calculated and experimental values of Gibbs energy for calcium sulfates in sulfuric acid solutions in the assessment. Error = (Ci–Ei)/Ui (solid symbol, adopted value; open symbol, unadopted in the assessment).
The adopted solubility data of gypsum in sulfuric acid solutions were from the data sets by Wang et al.,11 Farrah et al.,15 and Azimi and Papangelakis;14 most data were from Zdanovskii et al.16,17 and Marshall and Jones.18 Few individual points by Cameron and Breazeale19 at 298.15 and 316.15 K were also included in the assessment.
Most of the solubility data of anhydrite in sulfuric acid from Wang et al.11 and Zdanovskii et al.16 were included in the assessment. Also, individual data points by Marshall and Jones18 were included in the assessment despite the scattering points. Solubility data for anhydrite by Ling and Demopoulos13 and Farrah et al.15 were excluded completely.
All of the solubility data for the hemihydrate in sulfuric acid from Ling and Demopoulos13 and Marshall and Jones18 were accepted. Most of the data by Zdanovskii et al.17 were included except for 4.38228 mol H2SO4/kg at 323.15 K and five points at temperatures of 298.15, 323.15, 348.15, and 368.15 K, where the sulfuric acid concentration was over 5 mol H2SO4/kg.
4.2. Solubility of Calcium Sulfate in Water
A comparison of calculated solubilities of gypsum between set-1 and our previous model D7 is presented in Figure 2, with the experimental data from the literature.18,34−52 The difference with the models is that the HSO4– ion and the Pitzer parameters for Ca2+–HSO4– ion interactions are also included in the set-1 model. There is no significant change in the solubility of gypsum, but at lower temperatures, the metastable solubilities of anhydrite and hemihydrate are slightly increased due to the small change in thermodynamic values for solubility reactions, thus improving the accuracy. This also verifies that set-1 is capable of modeling the binary CaSO4–H2O.
Figure 2.

Comparison between set-1 and model D for the CaSO4–H2O system.
4.3. Solubility in H2SO4 Solution
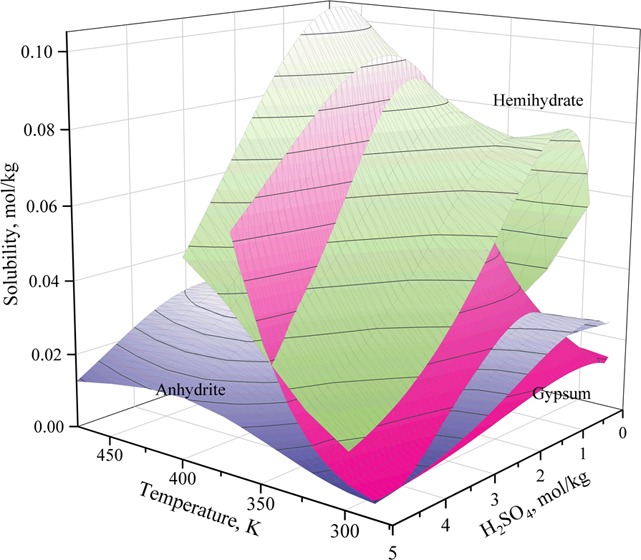
The solubilities of calcium sulfates in 0–5.0 mol/kg sulfuric acid solutions were calculated in the temperature ranges of 273.15–368.15, 273.15–473.15, and 273.15–398.15 K for gypsum, anhydrite, and hemihydrate, respectively, using the optimized parameters of this work. The solubility curves of each phase as a function of the H2SO4 concentration at different temperatures are shown in Figures 3–5, respectively, together with the compiled experimental data.
Figure 3.


Assessed and experimental solubilities5,11,14−19 of gypsum in the CaSO4–H2SO4–H2O system at (a) 283.15 K, (b) 298.15 K, (c) 303.15 K, (d) 308.15 K, (e) 313.15 K, (f) 315.15 K, (g) 316.15 K, (h) 318.15 K, (i) 323.15 K, (j) 333.15 K, (k) 343.15 K, (l) 348.15 K, (m) 353.15 K, (n) 363.15 K, and (o) 368.15 K.
Figure 5.

Assessed and experimental solubilities13,17,18 of hemihydrate in the CaSO4–H2SO4–H2O system at (a) 298.15 K, (b) 323.15 K, (c) 348.15 K, (d) 368.15 K, (e) 373.15 K, and (f) 398.15 K.
4.3.1. Gypsum
In Figure 3, the calculated solubility values for gypsum in sulfuric acid solutions are presented at different temperatures, compared with the experimental data. The temperature dependency of the solubility curve reproduces well most data points. Wang et al.11 carried out excellent experiments on the solubility of gypsum in sulfuric acid solutions at 298.15, 323.15, and 348.15 K. At 363.15 K, two data points of four around H2SO4 molalities 1.5 and 4.0 mol/kg scatter. The same result can be observed in their own modeling, but the data points are around molalities 1.5 and 3.0 mol/kg. However, at this temperature, metastable gypsum is easily transformed to stable anhydrite in sulfuric acid solutions.
The gypsum solubility data points reported by Azimi and Papangelakis14 are very close to the calculated curves but slightly lower at higher temperatures. Farrah et al.15 presented data points very close to the calculated ones, even though only two solubility data points in solutions of different H2SO4 concentrations are reported at each temperature set. Only data at 353.15 K deviate from our prediction.
The metastable gypsum solubility study carried out by Marshall and Jones18 at low temperatures of 298.15–333.15 K gives remarkable data sets in sulfuric acid solutions. Their data are in excellent agreement with our model but scatter slightly in H2SO4 solutions above 1.0 mol/kg.
The gypsum solubility data in H2SO4 concentration solutions by Zdanovskii et al.16,17 agree with the others’ and the calculated data in this work, despite several slightly scattered points. The data sets by Cameron and Breazeale19 are very scattered and show larger values than other researchers’ data and the calculated values of this work.
4.3.2. Anhydrite
The calculated solubility curves of anhydrite in sulfuric acid solutions are shown in Figure 4 at different temperatures, together with all experimental data. The data sets by Wang et al.11 are in good agreement with the calculated points but scatter little around the calculated values. Farrah et al.15 gave the solubility data in ∼0.38 and ∼0.79 mol/kg H2SO4 solutions at the temperature range of 363.15–378.15 K, which deviate from other studies and the calculated values of this work. Their data are constantly higher than predicted values.
Figure 4.

Assessed and experimental solubilities of anhydrite11,13,15,16,18 in the CaSO4–H2SO4–H2O system at (a) 283.15 K, (b) 298.15 K, (c) 308.15 K, (d) 315.15 K, (e) 323.15 K, (f) 348.15 K, (g) 363.15 K, (h) 368.15 K, (i) 373.15 K, (j) 378.15 K, (k) 398.15 K, (l) 423.15 K, (m) 448.15 K, and (n) 473.15 K.
The results obtained by Ling and Demopoulos13 for the solubility of anhydrite at 373.15 K are much higher than those in our model maybe due to the short time of 2 h used in their experiments. Furthermore, since their focus was on the solubility of gypsum and hemihydrate, they did not use anhydrite as a starting material in their dissolution experiment.
Marshall and Jones18 carried out a solubility study of anhydrite at temperatures over 398.15 K. In dilute solutions, our model agrees with their data, but at higher concentrations, our model predicts that the solubility of anhydrite will decrease as it does at lower temperatures, while according to their data, the solubility of anhydrite continues to increase. Marshall and Jones18 pointed out that the experimental solubility data at high temperatures and high pressures may lose accuracy due to the negligible density changes caused by the loss of H2O and H2SO4 to the vapor phase, and at times, the high-pressure vessels may have leaked. Moreover, the stirring time at temperatures of 150–200 K in sulfuric acid concentrations above 0.5 mol/kg was only 1.5 h, which could be too short a time to attain equilibrium.
Zdanovskii et al.16 investigated the solubility data of anhydrite at low temperatures in H2SO4 solutions. The data at 308.15, 315.15, and 323.15 K are in agreement with our model, but the metastable solubility data at 283.15 and 298.15 K are below our predictions and the experimental data by Wang et al.11
4.3.3. Hemihydrate
The assessed solubility of hemihydrate as a function of sulfuric acid concentration is demonstrated in Figure 5 at different temperatures, together with the experimental data.
The solubility study carried out by Zdanovskii et al.17 in sulfuric acid solutions gives important data for hemihydrate solubility at temperatures of 298.15, 323.15, 348.15, and 368.15 K, even though the data show slight scatter. The data by Ling and Demopoulos13 agree well at 373.15 K solutions with the assessed solubility curve. The solubility data at 398.15 K of Marshall and Jones18 also agree well with the predicted values of this work. Considering the metastable nature of hemihydrate, the modeling of this work is adequate for predicting the solubility of hemihydrate.
4.4. Phase Transformation
The transformation points of calcium sulfates in sulfuric acid solutions are important in predicting and controlling calcium sulfate formation in its solutions. When the concentration of sulfuric acid increases in the solution at a given temperature, the activity of water will decrease. So although gypsum is the most stable phase in pure water, addition of sulfuric acid with decreasing water activity will change the most stable phase to a less hydrated one. Thus, the transition temperature from gypsum to anhydrite or hemihydrate will decrease in ternary CaSO4–H2SO4–H2O with increasing sulfuric acid concentration.
Wang et al.11 reported that gypsum is generally stable in H2SO4 solutions at relatively low temperatures and low sulfuric acid concentrations. As temperature or concentration of sulfuric acid rises, the stable phase will change to insoluble anhydrite. In pure water, the transition temperature is 315 K and it will decrease as a function of increasing sulfuric acid concentration. In H2SO4 concentrations of 1.8, 3.2, and 4.6 mol/kg, the transition temperatures are 308, 298, and 283 K, respectively. Zdanovskii et al.16 gave those points in H2SO4 concentrations of 0.316, 1.261, 2.551, and 5.257 mol/kg at temperatures of 315.15, 308.15, 298.15, and 283.15 K, respectively.
Zdanovskii et al.17 also determined the transformation points of gypsum to hemihydrate locating in H2SO4 concentrations of 1.391, 3.968, 7.091, and 9.804 mol/kg at 368.15, 348.15, 323.15, and 298.15 K, respectively.
The curves of phase transformations calculated in this work using the obtained parameterization are shown in Figure 6. The results agree well with those of Wang et al.11 and Zdanovskii et al.16,17 The above results confirm that gypsum is stable at low temperatures in solutions of low H2SO4 concentrations and transformed to anhydrite at high temperatures and in concentrated H2SO4 solutions, while hemihydrate is always a metastable phase. This is also in agreement with experimental X-ray predictions by Dutrizac.5 Furthermore, the transformation temperatures of gypsum to anhydrite and hemihydrate will decrease on increasing the H2SO4 concentration.
Figure 6.
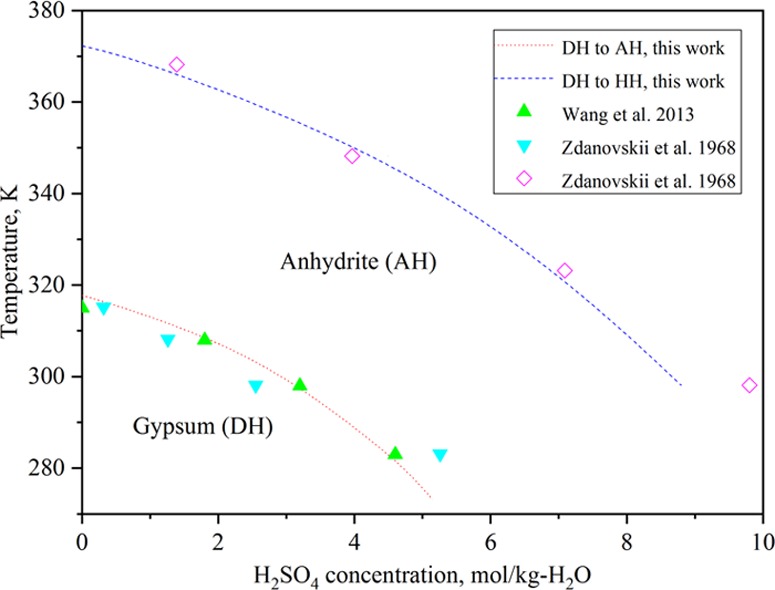
Transformation of gypsum to anhydrite and hemihydrate in the CaSO4–H2SO4–H2O system.
4.5. Comparison with Previous Works
As mentioned previously, the solubility data of gypsum measured by Dutrizac5 were used to compare with the parameterization of this work. The experimental data of Dutrizac were calculated from the quadratic equations of volumetric concentration and solution density as a function of temperature in his study. Dutrizac had obviously some difficulties in transforming his data to quadratic equations since he used two sets of parameters in three sulfuric acid concentrations of 0.025, 0.8 and 1.0 mol/L.
The calculated mean absolute percentage errors (MAPEs) for our model at temperatures of 298.15, 323.15, 348.15, and 363.15 K in comparison to the experimental solubility of gypsum by Dutrizac5 are collected in Table 6. Wang et al.11 also compared their model against this data, but they did not compare the entire data set of Dutrizac; thus, MAPE was not calculated for their model. The deviation plots for the data of Dutrizac5 at temperatures of 298.15, 323.15, 348.15, and 363.15 K are shown in Figure 7. Wang et al.’s11 data are included in the figures, too.
Table 6. Comparison of the Experimental Data for Solubility of Gypsum from Dutrizac5 and the Predicted Values of This Work in the CaSO4–H2SO4–H2O System.
| H2SO4 | 298.15 K | 323.15 K | 348.15 K | 363.15 K | all | |
|---|---|---|---|---|---|---|
| MAPE | 0–1.8 mol/L | 1.8% | 1.9% | 3.6% | 4.7% | 3.0% |
Figure 7.

Difference between calculated and experimental values of solubility of gypsum in sulfuric acid solutions at (a) 298.15 K, (b) 323.15 K, (c) 348.15 K, and (d) 363.15 K. Hollow symbol indicates this work; filled symbol is the work by Wang et al.11
As can be seen from Table 6, the MAPE increases with increasing temperature and metastability of gypsum.
After the assessment was made, we became aware of additional solubility data of gypsum,56−59 which was not included in the assessment, so we used them for comparison. The deviation plots are shown in Figure 8, with the calculated MAPE being presented in Table 7. As can be seen in Figure 8, the predicted solubilities differ from −3 to 1.5 mmol/L from the experimental values.
Figure 8.

Difference between calculated and experimental values of solubility of gypsum in sulfuric acid solutions. (a) Schäfer and Hunger,56 at 298.15 K; (b) Beremzhanov and Kruchenko,57 at 298.15 and 323.15 K; (c) Zhang and Muhammed,58 at 298.15 K; and (d) Calmanovici et al.,59 at 298.15, 323.15, and 343.15 K.
Table 7. Comparison of the Experimental Data for Solubility of Gypsum from the Literature56−59 and the Predicted Values of This Work in the CaSO4–H2SO4–H2O System.
5. Summary and Conclusions
The aim of this study is to give an accurate thermodynamic description for the CaSO4–H2SO4–H2O system for a better understanding of its detailed thermodynamic properties of solution chemistry to prevent scaling and to recycle aqueous solutions in industrial processes. The experimental solubility data of calcium sulfates in sulfuric acid solutions previously published in the literature were reviewed and selected critically for parameter optimization.
The Pitzer activity coefficient approach was adopted to model the CaSO4–H2SO4–H2O system by assessing the adopted experimental data with MTDATA software. Gypsum was found to be stable at low temperatures in low H2SO4 concentrations and transformed to anhydrite at high temperatures and in more concentrated H2SO4 solutions, while hemihydrate is always a metastable phase. The transformation temperatures of gypsum to anhydrite and hemihydrate will decrease with increasing H2SO4 concentration.
The parameters were fitted to obtain an accurate Pitzer model for the solubility of calcium sulfates in 0–5.0 mol/kg H2SO4 solutions from 273.15 to 473.15 K. The obtained model is in good agreement with most experimental data in sulfuric acid concentrations up to 5.0 mol/kg, at temperatures of 283.15–368.15, 283.15–473.15, and 298.15–473.15 K for gypsum (CaSO4·2H2O), anhydrite (CaSO4), and hemihydrate (CaSO4·0.5H2O), respectively.
At higher temperatures, our predicted solubility deviates significantly from the solubility data of Marshall and Jones.18 At 398.15 K, our model is in agreement with their solubility data for anhydrite (Figure 4k) and hemihydrate (Figure 5f). However, in sulfuric acid concentrations above 0.5 mol/kg, the solubility of anhydrite predicted by our model deviates significantly from the solubility data of Marshall and Jones18 at temperatures of 423.15, 448.15, and 473.15 K. Our model predicts that the solubility of anhydrite would first increase and then decrease in more concentrated sulfuric acid solutions as it does at lower temperatures. This behavior is confirmed with experimental data at higher concentrations of sulfuric acid where the measured solubility21,22 is less than the solubility of anhydrite in dilute sulfuric acid. For example, when studying the solubility of anhydrite in 50–97 wt % sulfuric acid, Dvegubskii and Shchiponikova21 discovered that the measured solubilities of anhydrite at temperatures of 393.15 and 413.15 K in 60 wt % (15 mol/kg) sulfuric acid are 0.03 and 0.06 g/100 g solution (0.006 and 0.011 mol/kg), respectively. However, the experimental data by Marshall and Jones does show this phenomenon. Their measured solubility increased in the whole concentration range up to around 1 m sulfuric acid at the measured temperature range of 398.15–623.15 K.
We modeled the solubility data by Marshall and Jones18 alone in the temperature range of 393.15–473.15 K releasing all of the binary Pitzer parameters (β(0), β(1), β(2), and Cϕ) for Ca2+–SO42– and Ca2+–HSO4– interactions as well as the Gibbs energy change for the solubility reaction. Only the thermodynamic description of sulfuric acid was retained. We were able to get a better fit for the experimental data, but the solubility of CaSO4 drops to zero around 2 m sulfuric acid solution in every case (Figure 9).
Figure 9.
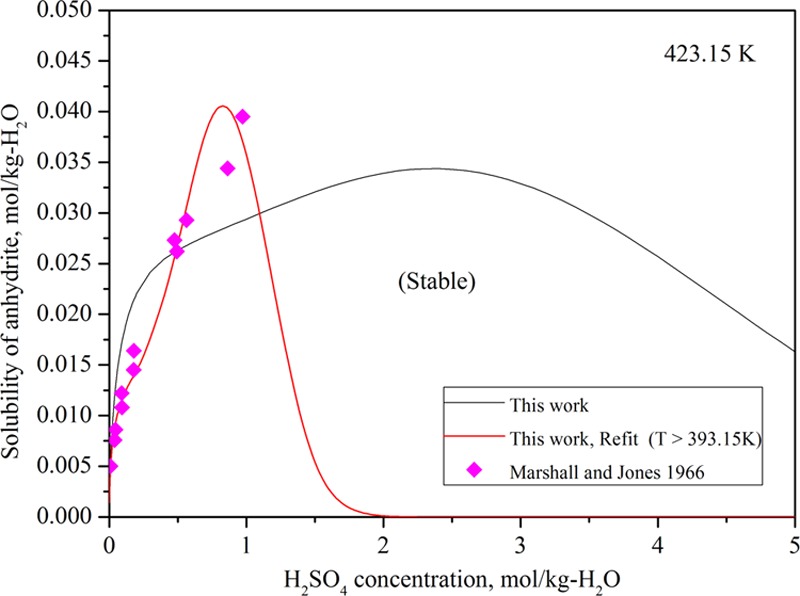
Refitted solubility of anhydrite at 423.15 K based on the data of Marshall and Jones18 only. The predicted solubility by the original model is also included.
We found three possible explanations for this discrepancy.
-
(a).
Our Pitzer model for sulfuric acid is incorrect.
-
(b).
An associate CaSO4(aq) should be included in the Pitzer model.
-
(c).
The precipitated substance is not insoluble anhydrite but something else, for example, soluble anhydrite, or the precipitated substance is insoluble anhydrite, but the measured solubility is incorrect.
At 473.21 K, our model for the sulfuric acid–water system can predict the measured osmotic coefficient, which was not included in the assessment of the model, quite well. The predicted values are 0.009 higher on average, and the mean absolute average error (MAPE) is 1.45%. It is also one of the few Pitzer models that can predict at 298.15 K the standard state potentials of electrochemical cells generally used in the assessment of sulfuric acid within experimental accuracy.33
Marshall and Jones used their solubility data to predict the second dissociation constant (K2) for sulfuric acid. At lower temperatures, their value for K2 agrees well with the literature data, but at higher temperatures, their value for K2 is about double compared to the literature data (Table 8).
Table 8. Ratio of the Second Dissociation Constant (K2,MJ) of Sulfuric Acid by Marshall and Jones17 Compared to the Literature Values (K2,lit) at Various Temperatures.
| (K2,MJ/K2,lit) |
||||
|---|---|---|---|---|
| 298.15 K | 313.15 K | 323.15 K | 333.15 K | |
| Matsushima and Okuwaki60 | 1.0 | 1.2 | 1.2 | 1.4 |
| Dickson et al.61 | 0.9 | 1.1 | 1.1 | 1.3 |
| Christov and Møller62 | 0.9 | 1.1 | 1.1 | 1.3 |
| Lietzke et al.63 | 1.0 | 1.1 | 1.1 | 1.2 |
| Knopf et al.64 | 1.0 | 1.0 | 1.0 | 1.0 |
| Hovey and Hepler65 | 1.0 | 1.1 | 1.2 | 1.4 |
| Sippola and Taskinen33 | 0.9 | 1.1 | 1.1 | 1.3 |
Møller66 and later Greenberg and Møller67 modeled the system Na–K–Ca–Cl–SO4–H2O system to high temperatures and concentrations. They used β(2) in the temperature range 298.15–348.15 K to improve the fit to the pure gypsum water data. The CaSO4(aq) complex was also included with two temperature ranges: from 273.15 to 423.15 K and from 424.15 to 523.15 K. Still, they had severe problems in fitting the higher order systems including CaSO4 with consistent thermodynamic data. They also found that reasonable values of the θ parameter have little effect on solubilities of gypsum and anhydrite in potassium sulfate solutions.
Our conclusion is that more solubility measurements of anhydrite above 393 K in aqueous sulfuric acid are needed to ensure the solubility of calcium sulfate in aqueous sulfuric acid at higher temperatures.
According to our model at lower temperatures, the solubility of gypsum will first decrease in dilute sulfuric acid concentrations. At 298.15 K, this phenomenon disappears, as can be seen in Figure 10.
Figure 10.

Predicted solubility of gypsum by our model in dilute sulfuric acid in the temperature range of 273.15–298.15 K.
Acknowledgments
The first author, L.S., gratefully acknowledges the financial support from EDUFI Fellowship TM-18-10745 for his exchange and doctoral study at Aalto University, Finland. Funding from the Academy of Finland Mineral Resources and Material Substitution MISU program—Protocol development for evaluation of water-saving alternatives in minerals processing—“Bridging North to South” project and the European Union H2020 program under grant agreement no. 730480 is gratefully acknowledged (H.S.). We are deeply grateful to anonymous reviewers who advised us on four articles we had missed in our literature search as well as the behavior of gypsum solubility at lower temperatures.
Supporting Information Available
The Supporting Information is available free of charge at https://pubs.acs.org/doi/10.1021/acs.jced.9b00829.
The authors declare no competing financial interest.
Supplementary Material
References
- Azimi G.Evaluating the Potential of Scaling Due to Calcium Compounds in Hydrometallurgical Process. Ph.D. thesis, University of Toronto, 2010. [Google Scholar]
- Li X. B.; Shen L. T.; Qiu S. Z.; Peng Z. H.; Liu G. H.; Tian G. Q. Scheelite conversion in sulfuric acid together with tungsten extraction by ammonium carbonate solution. Hydrometallurgy 2017, 171, 106–115. 10.1016/j.hydromet.2017.05.005. [DOI] [Google Scholar]
- Dutrizac J. E.; Kuiper A. The solubility of calcium sulphate in simulated copper sulphate electro-refining solutions. Hydrometallurgy 2008, 92, 54–68. 10.1016/j.hydromet.2008.01.004. [DOI] [Google Scholar]
- Dutrizac J. E.; Kuiper A. The solubility of calcium sulphate in simulated nickel sulphate chloride processing solutions. Hydrometallurgy 2006, 82, 13–31. 10.1016/j.hydromet.2005.12.013. [DOI] [Google Scholar]
- Dutrizac J. E. Calcium sulphate solubilities in simulated zinc processing solutions. Hydrometallurgy 2002, 65, 109–135. 10.1016/S0304-386X(02)00082-8. [DOI] [Google Scholar]
- Krumgalz B. S. Temperature Dependence of Mineral Solubility in Water. Part 3. Alkaline and Alkaline Earth Sulfates. J. Phys. Chem. Ref. Data 2018, 47, 023101 10.1063/1.5031951. [DOI] [Google Scholar]
- Shen L. T.; Sippola H.; Li X. B.; Lindberg D.; Taskinen P. Thermodynamic modelling of calcium sulfate hydrates in CaSO4-H2O system from 273.15 K to 473.15 K with extension to 573.15 K. J. Chem. Eng. Data 2019, 64, 2697–2709. 10.1021/acs.jced.9b00112. [DOI] [PMC free article] [PubMed] [Google Scholar]
- Kobylin P. M.; Sippola H.; Taskinen P. A. Thermodynamic model for acidic Fe(II) sulphate from solubility data. CALPHAD 2012, 38, 185–193. 10.1016/j.calphad.2012.06.011. [DOI] [Google Scholar]
- Kobylin P. M.; Sippola H.; Taskinen P. A. Thermodynamic model for acidic Ni(II) sulphate from solubility data. CALPHAD 2013, 40, 41–47. 10.1016/j.calphad.2012.10.002. [DOI] [Google Scholar]
- Spencer P. J. A brief history of CALPHAD. CALPHAD 2008, 32, 1–8. 10.1016/j.calphad.2007.10.001. [DOI] [Google Scholar]
- Wang W. L.; Zeng D. W.; Chen Q. Y.; Yin X. Experimental determination and modeling of gypsum and insoluble anhydrite solubility in the system CaSO4-H2SO4-H2O. Chem. Eng. Sci. 2013, 101, 120–129. 10.1016/j.ces.2013.06.023. [DOI] [Google Scholar]
- Reardon E. J.; Beckie R. D. Modelling chemical equilibria of acid mine-drainage: The FeSO4-H2SO4-H2O system. Geochim. Cosmochim. Acta 1987, 51, 2355–2368. 10.1016/0016-7037(87)90290-0. [DOI] [Google Scholar]
- Ling Y. B.; Demopoulos G. P. Solubility of calcium sulfate hydrates in (0 to 3.5) mol·kg–1 sulfuric acid solutions at 100 °C. J. Chem. Eng. Data 2004, 49, 1263–1268. 10.1021/je034238p. [DOI] [Google Scholar]
- Azimi G.; Papangelakis V. G. Thermodynamic modeling and experimental measurement of calcium sulfate in complex aqueous solutions. Fluid Phase Equilib. 2010, 290, 88–94. 10.1016/j.fluid.2009.09.023. [DOI] [Google Scholar]
- Farrah H. E.; Lawrance G. A.; Wanless E. J. Solubility of calcium sulfate salts in acidic manganese sulfate solutions from 30 to 105 °C. Hydrometallurgy 2007, 86, 13–21. 10.1016/j.hydromet.2006.10.003. [DOI] [Google Scholar]
- Zdanovskii A. B.; Vlasov G. A. Determination of the boundaries of the reciprocal transformations of CaSO4·2H2O and −CaSO4 in H2SO4 solutions. Russ. J. Inorg. Chem. 1968, 13, 1318–1319. [Google Scholar]
- Zdanovskii A. B.; Vlasov G. A.; Sotnikova L. I. Dehydration of gypsum in sulphuric acid solutions. Russ. J. Inorg. Chem. 1968, 13, 1418–1420. [Google Scholar]
- Marshall W. L.; Jones E. V. Second dissociation constant of sulfuric acid from 25 to 350° evaluated from solubilities of calcium sulfate in sulfuric acid solutions. J. Phys. Chem. A. 1966, 70, 4028–4040. 10.1021/j100884a045. [DOI] [Google Scholar]
- Cameron F. K.; Breazeale J. F. Solubility of calcium sulphate in aqueous solutions of sulphuric acid. J. Phys. Chem. B. 1903, 7, 571–577. 10.1021/j150053a003. [DOI] [Google Scholar]
- Huang Y.; Luo D. Solubilities and Phase Change of Calcium Sulfate in Concentrated Sulfuric Acid from 10 to 200 °C. Chengdu Keji Daxue Xuebao 1988, 4, 83–86. [Google Scholar]
- Dvegubskii N. S.; Shchiponikova L. V. Solubility and Phase Conversions of Calcium Sulfate in Concentrated Sulfuric Acid at 120-180 °C. J. Appl. Chem. 1981, 54, 132–137. [Google Scholar]
- Tsikaeva D. V. Solubilities of Calcium Sulfate in Concentrated Solutions of Sulfuric Acid. Zh. Neorg. Khim. 1980, 25, 3073–3075. [Google Scholar]
- Ostrovskii S. V.; Amirova S. A.; Kalugina M. K. Solubility of Calcium Sulfate in Concentrated Sulfuric Acid. Zh. Neorg. Khim. 1969, 14, 2503–2506. [Google Scholar]
- Pitzer K. S. Thermodynamics of electrolytes. I. Theoretical basis and general equations. J. Phys. Chem. C. 1973, 77, 268–277. 10.1021/j100621a026. [DOI] [Google Scholar]
- Pitzer K. S.; Mayorga G. Thermodynamics of electrolytes. II. Activity and osmotic coefficients for strong electrolytes with one or both ions univalent. J. Phys. Chem. D. 1973, 77, 2300–2308. Errata, 1978, 78, 2698 10.1021/j100638a009. [DOI] [Google Scholar]
- Pitzer K. S.; Mayorga G. Thermodynamics of electrolytes. III. Activity and osmotic coefficients for 2-2 electrolytes. J. Solution Chem. 1974, 3, 539–546. 10.1007/BF00648138. [DOI] [Google Scholar]
- Harvie C. E.; Weare J. H. The prediction of mineral solubilities in natural waters: the Na-K-Mg-Ca-SO4-Cl-H2O system from zero to high concentration at 25 °C. Geochim. Cosmochim. Acta 1980, 44, 981–997. 10.1016/0016-7037(80)90287-2. [DOI] [Google Scholar]
- Harvie C. E.; Moller N.; Weare J. H. The prediction of mineral solubilities in natural waters: the Na-K-Mg-Ca-H-Cl-SO4-OH-HCO3-CO3-CO2-H2O system to high ionic strengths at 25 °C. Geochim. Cosmochim. Acta 1984, 48, 723–751. 10.1016/0016-7037(84)90098-X. [DOI] [Google Scholar]
- Sippola H. Critical evaluation of the 2nd dissociation constants for aqueous sulfuric acid. Thermochim. Acta 2012, 532, 65–77. 10.1016/j.tca.2011.04.030. [DOI] [Google Scholar]
- Sippola H. Critical Evaluation of the Second Dissociation Constants for Aqueous Sulfuric Acid over a Wide Temperature Range. J. Chem. Eng. Data 2013, 58, 3009–3032. 10.1021/je4004614. [DOI] [Google Scholar]
- Sippola H.; Taskinen P. A. Thermodynamic Properties of Aqueous Sulfuric Acid. J. Chem. Eng. Data 2014, 59, 2389–2407. 10.1021/je4011147. [DOI] [Google Scholar]
- Pihlasalo J.; Davies H.; Taskinen P. A. In Validation of a New Pitzer Type Model and Database for Aqueous Solutions with Outotec HydroCopper Process Data, Paper presented in CALPHAD XXXVII, 2008.
- Sippola H. Thermodynamic modelling of concentrated sulfuric acid solutions. CALPHAD: Comput. Coupling Phase Diagrams Thermochem. 2012, 38, 168–176. 10.1016/j.calphad.2012.06.008. [DOI] [Google Scholar]
- D’Ans J.; Bredtscheider D.; Eick H.; Freund H. E. Untersuchungen uber die calcium sulfate. Kali Steinsalz 1955, 9, 17–38. [Google Scholar]
- Innorta G.; Rabbi E.; Tomadin L. The gypsum-anhydrite equilibrium by solubility measurements. Geochim. Cosmochim. Acta 1980, 44, 1931–1936. 10.1016/0016-7037(80)90192-1. [DOI] [Google Scholar]
- Sun J.; Wang L. S.; Yu G. M. Effect of Na, Ca, Mg, and Al chloride salts on dissolution and phase stability of calcium sulfate dehydrate in aqueous solutions at 278.15 K to 308.15 K. J. Chem. Eng. Data 2015, 60, 2559–2566. 10.1021/acs.jced.5b00005. [DOI] [Google Scholar]
- Tian P.; Ning P. G.; Cao H. B.; Li Z. B. Determination and modeling of solubility for CaSO4·2H2O-NH4+-Cl–-SO42–-NO3–-H2O system. J. Chem. Eng. Data 2012, 57, 3664–3671. 10.1021/je300871p. [DOI] [Google Scholar]
- Azimi G.; Papangelakis V. G. The solubility of gypsum and anhydrite in simulated laterite pressure acid leach solutions up to 250 °C. Hydrometallurgy 2010, 102, 1–13. 10.1016/j.hydromet.2009.12.009. [DOI] [Google Scholar]
- Li Z. B.; Demopoulos G. P. Solubility of CaSO4 phase in aqueous HCl + CaCl2 solutions from 283 K to 353 K. J. Chem. Eng. Data 2005, 50, 1971–1982. 10.1021/je050217e. [DOI] [Google Scholar]
- Marshall W. L.; Slusher R. Thermodynamics of calcium sulfate dehydrate in aqueous sodium chloride solutions, 0-110°. J. Phys. Chem. E. 1966, 70, 4015–4027. 10.1021/j100884a044. [DOI] [Google Scholar]
- Marshall W. L.; Slusher R.; Jones E. V. Aqueous systems at high temperature XIV. Solubility and Thermodynamic Relationships for CaSO4 in NaCl-H2O Solutions from 40 to 200 C., 0 to 4 Molal NaCl. J. Chem. Eng. Data 1964, 9, 187–191. 10.1021/je60021a011. [DOI] [Google Scholar]
- Ostroff A. G.; Metler A. V. Solubility of calcium sulfate dehydrate in the system NaCl-MgCl2-H2O from 28 °C to 70 °C. J. Chem. Eng. Data 1966, 11, 346–350. 10.1021/je60030a016. [DOI] [Google Scholar]
- Power W. H.; Fabuss B. M. Transient solubilities in the calcium sulfate-water system. J. Chem. Eng. Data 1964, 9, 437–442. 10.1021/je60022a046. [DOI] [Google Scholar]
- Power W. H.; Fabuss B. M.; Satterfield C. N. Transient solute concentrations and phase changes of calcium sulfate in aqueous sodium chloride. J. Chem. Eng. Data 1966, 11, 149–154. 10.1021/je60029a005. [DOI] [Google Scholar]
- Bock E. On the solubility of anhydrous calcium sulphate and of gypsum in concentrated solutions of sodium chloride at 25 °C, 30 °C, 40 °C, and 50 °C. Can. J. Chem. 1961, 39, 1746–1754. 10.1139/v61-228. [DOI] [Google Scholar]
- Block J.; Waters O. B. The CaSO4-Na2SO4-NaCl-H2O system at 25° to 100 °C. J. Chem. Eng. Data 1968, 13, 336–344. 10.1021/je60038a011. [DOI] [Google Scholar]
- Hill A. E.; Wills J. H. Ternary systems. XXIV. Calcium sulfate, sodium sulfate and water. J. Am. Chem. Soc. 1938, 60, 1647–1655. 10.1021/ja01274a037. [DOI] [Google Scholar]
- Hill A. E. Ternary systems. XIX. Calcium sulfate, potassium sulfate and water. J. Am. Chem. Soc. 1934, 56, 1071–1078. 10.1021/ja01320a019. [DOI] [Google Scholar]
- Partridge E. P.; White A. H. The solubility of calcium sulfate from 0 to 200°. J. Am. Chem. Soc. 1929, 51, 360–370. 10.1021/ja01377a003. [DOI] [Google Scholar]
- Sborgi U.; Bianchi C. Solubilita condusibilita e röntgen analisi del solfato di calcio anidro e semiidrato. Gazz. Chim. Ital. 1940, 70, 823–835. [Google Scholar]
- Seidell A.Solubilities of Inorganic and Metal Organic Compounds, 3rd ed.; David Van Nostrand: New York, 1940; Vol. 1. [Google Scholar]
- Zdanovskii A. B.; Vlasov G. A.; Sotnikova L. I. Dehydration of Gypsum in Sulphuric acid solutions. Russ. J. Inorg. Chem. 1968, 13, 1418–1420. [Google Scholar]
- Roine A.HSC Chemistry, version 9; Outotec Research Oy: Pori, Finland, 2016; http://www.outotec.com/products/digital-solutions/hsc-chemistry/ (accessed Jan 5, 2019). [Google Scholar]
- Wagman D. D.; Evans W. H.; Parker V. B.; Schumm R. H.; Halow I.; Balley S. M.; Churney K. L.; Nuttal R. L.. The NBS Tables of Chemical Thermodynamic Properties: Selected Values for Inorganic and C1 and C2 Organic Substances in SI Units; NBS: Washington, 1982; p 392. [Google Scholar]
- Cox J.; Wagman D. D.; Medvedev V. A.. CODATA Key Values for Thermodynamics; Hemisphere Publishing Corporation: New York, 1989; p 271. [Google Scholar]
- Schäfer W.; Hunger E. Solubility of Calcium Sulfate in salt-containing sulfuric acid solutions. Z. Chem. 1969, 9, 462. 10.1002/zfch.19690091221. [DOI] [Google Scholar]
- Beremzhanov B. A.; Kruchenko V. P. Solubility of Calcium Sulfate in CaSO4–HNO3–H2SO4–H2O System at 25 and 50 °C. Zh. Neorg. Khim. 1972, 17, 1996–2000. [Google Scholar]
- Zhang Y.; Muhammed M. Solubility of calcium sulfate dehydrate in nitric acid solutions containing calcium nitrate and phosphoric acid. J. Chem. Eng. Data 1989, 34, 121–124. 10.1021/je00055a032. [DOI] [Google Scholar]
- Calmanovici C. E.; Gabas N.; Laguerie C. Solubility measurements for calcium sulfate dehydrate in acid solutions at 20, 50, and 70 °C. J. Chem. Eng. Data 1993, 38, 534–536. 10.1021/je00012a013. [DOI] [Google Scholar]
- Matsushima Y.; Okuwaki A. The second dissociation constant of sulfuric acid at elevated temperatures from potentiometric measurements. Bull. Chem. Soc. Jpn. 1988, 61, 3344–3346. 10.1246/bcsj.61.3344. [DOI] [Google Scholar]
- Dickson A. G.; Wesolowski D. J.; Palmer D. A.; Mesmer R. E. Dissociation constant of bisulfate ion in aqueous sodium chloride solutions to 250 °C. J. Phys. Chem. F. 1990, 94, 7978–7985. 10.1021/j100383a042. [DOI] [Google Scholar]
- Christov C.; Møller N. Chemical equilibrium model of solution behavior and solubility in the H-Na-K-OH-Cl-HSO4-SO4-H2O system to high concentration and temperature. Geochim. Cosmochim. Acta 2004, 68, 1309–1331. 10.1016/j.gca.2003.08.017. [DOI] [Google Scholar]
- Lietzke M. H.; Stoughton R. W.; Young T. F. The bisulfate acid constant from 25 to 225° as computed from solubility data. J. Phys. Chem. G. 1961, 65, 2247–2249. 10.1021/j100829a036. [DOI] [Google Scholar]
- Knopf D. A.; Luo B. P.; Krieger U. K.; Koop T. Thermodynamic dissociation constant of the bisulfate ion from Raman and ion interaction modeling studies of aqueous sulfuric acid at low temperatures. J. Phys. Chem. A 2003, 107, 4322–4332. 10.1021/jp027775+. [DOI] [PubMed] [Google Scholar]
- Hovey J. K.; Hepler L. G. Thermodynamics of sulphuric acid: apparent and partial molar heat capacities and volumes of aqueous HSO4 from 10–55 °C and calculation of the second dissociation constant to 350 °C. J. Chem. Soc., Faraday Trans. 1990, 86, 2831–2839. 10.1039/FT9908602831. [DOI] [Google Scholar]
- Møller N. The prediction of mineral solubilities in natural waters: A chemical equilibrium model for the Na-Ca-Cl-SO4-H2O system, to high temperature and concentration. Geochim. Cosmochim. Acta 1988, 52, 821–837. 10.1016/0016-7037(88)90354-7. [DOI] [Google Scholar]
- Greenberg J. P.; Møller N. The prediction of mineral solubilities in natural waters: A chemical equilibrium model for the Na-K-Ca-Cl-SO4-H2O system to high concentration from 0 to 250 °C. Geochim. Cosmochim. Acta 1989, 53, 2503–2518. 10.1016/0016-7037(89)90124-5. [DOI] [Google Scholar]
Associated Data
This section collects any data citations, data availability statements, or supplementary materials included in this article.