

Abstract
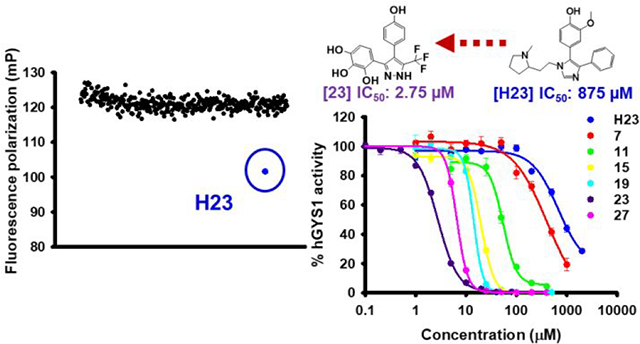
The over-accumulation of glycogen appears as a hallmark in various glycogen storage diseases (GSDs), including Pompe, Cori, Andersen and Lafora disease. Accumulating evidence suggests that suppression of glycogen accumulation represents a potential therapeutic approach for treating these GSDs. Using a fluorescence polarization assay designed to screen for inhibitors of the key glycogen synthetic enzyme, glycogen synthase (GS), we identified a substituted imidazole, (rac)-2-methoxy-4-(1-(2-(1-methylpyrrolidin-2-yl)ethyl)-4-phenyl-1H-imidazol-5-yl)phenol (H23), as a first-in-class inhibitor for yeast glycogen synthase 2 (yGsy2p). Data from X-ray crystallography at 2.85 Å, as well as kinetic data, revealed that H23 bound within the UDP-glucose binding pocket of yGsy2p. The high conservation of residues between human and yeast GS in direct contact with H23 informed the development of around 500 H23 analogs. These analogs produced a structure-activity relationship (SAR) profile that led to the identification of a substituted pyrazole, 4-(4-(4-hydroxyphenyl)-3-(trifluoromethyl)-1H-pyrazol-5-yl)pyrogallol, with 300-fold improved potency against human GS. These substituted pyrazoles possess a promising scaffold for drug development efforts targeting GS activity in GSDs associated with excess glycogen accumulation.
Graphical Abstract
INTRODUCTION
Glycogen is a branched polymer of glucose, composed of chains thirteen residues long on average, arranged in layers to form a molecule of up 107 daltons, corresponding to 55,000 glucose units. The biosynthesis of glycogen is a highly conserved, complex and coordinated process that involves two key events. Glycogen synthase (GS) lengthens linear chains through the progressive addition of α−1,4-linked glucose residues to the non-reducing end of the polymer, and glycogen-branching enzyme (GBE) catalyzes the intramolecular transfer of seven glucose residues from the end of a linear chain to a C-6 hydroxyl group to produce α−1,6 branch points for further elongation1,2,3,4.
GS is the rate-limiting enzyme for glycogen biosynthesis5. Higher eukaryotes have two isoforms, GYS1 and GYS26,7, that share approximately 70% sequence identity at the amino acid level and display the greatest variation within the N- and C-terminal sequence extensions where regulatory sites are located. The two GS isoenzymes are differentially expressed: GYS2 is exclusively expressed in the liver, while expression of GYS1 is highest in skeletal muscle but is also expressed in most other tissues. These two principal storage tissues for glycogen serve distinct physiological roles. Glycogen in the liver plays an essential, regulatory role in glucose homoeostasis, but glycogen in other tissues acts as an intracellular energy reserve such as during muscle contraction8. Similar to higher eukaryotes, Saccharomyces cerevisiae has two genes encoding GS, GSY1 and GSY2, with Gsy2p as the predominant isoform9. GS undergoes activation allosterically through glucose-6-phosphate (G6P) binding and inactivation by phosphorylation at a number of sites through the action of multiple protein kinases, including glycogen synthase kinase-3 (GSK-3) in mammals10,11. After transport into cells, glucose undergoes phosphorylation to G6P and enters one of several metabolic pathways. Increased levels of intracellular G6P stimulates GS activity that in turn drives the incorporation of glucose into glycogen in a feed-forward mechanism12. The dephosphorylation of GS is mediated by forms of type 1 protein phosphatase (PP1), the catalytic subunit of which is held in close proximity to the glycogen granule and GS by a family of glycogen targeting subunits, including protein-targeting-to-glycogen (PTG), an indirect activator of GS13.
Glycogen metabolism constitutes a key pathway in living cells that regulates systemic carbon or energy allocation14. A number of diseases are associated with abnormal glycogen metabolism including type 2 diabetes (T2D) and glycogen storage diseases (GSDs)15,16,17. Defects in enzymes directly involved in either glycogen synthesis or degradation18 are the basis for more than 12 different GSDs, and glycogen over-accumulation is characteristic of most GSDs. In Pompe disease (GSD2), a deficiency of the enzyme, acid-α-glucosidase (GAA), leads to lysosomal glycogen accumulation in many tissues including skeletal, cardiac, and smooth muscle19. In Cori disease (GSD3) and Andersen disease (GSD4), defects in the glycogen debranching enzyme (AGL) and glycogen branching enzyme (GBE1), respectively, result in the accumulation of glycogen with abnormal structure20,21. Lafora disease is a fatal progressive myoclonus epilepsy accompanied by neurodegeneration for which the presence of abnormal glycogen inclusions known as Lafora bodies22 are the hallmark. Lafora bodies consist of poorly branched, hyperphosphorylated, and insoluble forms of glycogen that occur in neuronal, muscle and other tissues23,24,25. Notably, impaired glycogen metabolism and consequent glycogen accumulation was also found to be pathological for β-cell dysfunction in T2D16,17.
A common finding with excess glycogen accumulation is an association with impaired autophagy and dysregulated mitochondrial metabolism. These derangements often lead to cell death and early-onset lethal, disease progression in GSD-affected patients16,26,27. Currently, there are no effective treatments for GSDs that ameliorate all cellular and organ dysfunction. For example, in Pompe disease, the administration of a genetically engineered enzyme (i.e., Enzyme Replacement Therapy, ERT) that rescues the defective GAA in peripheral tissues fails to reverse the neurological defects. Partial suppression of glycogen synthesis through inhibition of GS activity represents an alternative, potentially effective strategy for treating various types of GSDs where ERT may not provide a complete solution. For instance, mouse models of Lafora disease that lack either of the causative genes, EPM2A or EPM2B, recapitulate aspects of the patient phenotype, in that they accumulate polyglucosan bodies and misfolded proteins, display increased endoplasmic reticulum stress, and show signs of neurodegeneration23,27. Such animal models provided a venue for disrupting either PTG or GYS1 in these EPM2A(−/−) and EPM2B(−/−) knock-out mice as a mechanism for diminishing glycogen accumulation, Lafora body formation and the associated neurological and epileptic symptoms27,28,29,30. Inhibition of GS activity via suppression of mTOR signaling also increases the effectiveness of treatments for Pompe disease in conjunction with ERT31. Moreover, a recent report has shown that GYS2 inhibition with RNAi prevents liver injury in mouse models of GSDs32. Although human clinical characteristics may vary from animal phenotypes, the availability of mouse models and the appearance of promising therapeutic approaches suggest the feasibility of using small-molecule interventions to treat GSDs. We now report efforts to develop small-molecule inhibitors of human GS based on a multicomponent study involving high-throughput screening (HTS), X-ray crystallography and extensive SAR development work that led to substituted pyrazoles with low micromolar, inhibitory IC50 values against human glycogen synthase 1 (hGYS1).
RESULTS
Development of fluorescence polarization assay for HTS
The standard radiochemical assay for GS activity utilizes a time-consuming 14C-glucose incorporation assay (i.e., UDP-[U-14C]glucose and glycogen(n) affords [14C]glycogen(n+1) and UDP) that involves appropriate safety measures for handling radioisotopes as well as multiple transfer and washing steps to remove residual substrates33. The combination of laboratory effort, cost, safety and waste disposal favored the development of a fluorescence polarization (FP) assay for HTS as a sensitive, inexpensive, and rapid alternative34. We reserved the classical radiochemical assay for subsequent studies to confirm the hits emerging from the FP assay. An FP assay utilizes a fluorescently-labeled tracer molecule that binds to GS to form a slower rotating complex than fluorophore alone and that leads to enhanced polarization of the emitted light. Incubation of the GS-fluorophore complex with small-molecules that displace the fluorescent tracer produces greater rotational motion of fluorophore than that of the GS-fluorophore complex and causes relative depolarization of the emitted light. Using this assay system as a vehicle for HTS, we identified small-molecules that reduce the fluorescence polarization signal as GS-interacting agents.
The development of any FP assay involves the design and synthesis of a functional, fluorescent probe. Although G6P is a well-known, allosteric activator of GS, the regioselective modification of similarly reactive hydroxyl groups in G6P presented an unwelcome challenge. Because glucosamine-6-phosphate (GlcN6P) also activated GS35 and has a single, reactive amine group, its selection as a platform on which to incorporate a fluorophore was an attractive alternative to G6P. Using the 14C-glucose incorporation assay, we confirmed that either G6P or GlcN6P activated hGYS1 with AC50 values of 1.6 ± 0.1 mM or 5.9 ± 0.1 mM, respectively (Supplemental Figure 1A). With direct evidence in hand that GlcN6P activated hGS, we synthesized a fluorophore-modified GlcN6P (aka GlcN6P-fluorescein-5-Ex) using GlcN6P and the N-hydroxysuccinimidyl ester of fluorescein-5-Ex (Figure 1A), purified the fluorophore by high-performance liquid chromatography (HPLC) and confirmed the expected molecular mass by mass spectrometry in which it displayed a M+H+ peak at m/z 735.1267 consistent with [C31H31N2O15PS + H]+ with calculated exact mass within acceptable limits (i.e., calculated m/z 735.1256) (Supplemental Figure 1B).
Figure 1. Development of fluorescence polarization assay for HTS.

(A) 2-(6-Hydroxy-3-oxo-3H-xanthen-9-yl)-5-(2-((3-oxo-3-(((2R,3R,4R,5S,6R)-2,4,5-trihydroxy-6-(hydroxymethyl)tetrahydro-2H-pyran-3-yl)amino)propyl)thio)acetamido)benzoic acid (β-anomer of GlcN6P-fluorescein-5-Ex). (B) Saturation binding isotherm for GlcN6P-fluorescein-5-Ex binding to yGsy2p. The binding affinity was determined by adding GlcN6P-fluorescein-5-Ex to a final concentration of 20 nM in the presence of varying yGsy2p concentrations (0 to 50 μM). Kd= 7.6 ± 0.7 μM. Averages of triplicate assays ± SEM are shown. (C) Displacement of GlcN6P-fluorescein-5-Ex binding to yGsy2p by G6P. A mixture of yGsy2p and GlcN6P-fluorescein-Ex was added to various G6P concentrations (0.68 μM to 40 mM). Kd= 70.9 ± 3.6 μM. Averages of triplicate assays ± SEM are shown. (D) Z′-factor determination: fluorescence polarization values of the bound (-G6P), and the free (+2 mM G6P) GlcN6P-fluorescein-5-Ex are shown, for the 16 rows with each row containing 12 columns of either the bound or free state. The graphs depict a representative experiment from at least three independent experiments.
We examined the binding of the fluorophore, GlcN6P-fluorescein-5-Ex, to GS by adding the tracer to varying concentrations of yGsy2p to generate a saturation binding curve and calculate a dissociation constant of 7.6 ± 0.7 μM (Figure 1B). Furthermore, a competitive displacement by G6P (Kd = 70.9 ± 3.6 μM) demonstrated that the tracer molecule bound to the G6P allosteric site (Figure 1C). For comparison, we determined yGsy2p activation by G6P using the standard 14C-glucose incorporation assay which yielded an AC50 of 98.1 ± 3.1 μM (Supplemental Figure 1C). We also tested the binding of GlcN6P-fluorescein-5-Ex and displacement by G6P using hGYS1. While the GlcN6P-coupled fluorophore and the fluorophore alone bound to hGYS1, G6P was unable to displace either compound, a finding that suggested nonspecific binding of the fluorophore to hGYS1. This reason, combined with the fact that production of human GYS1 in insect cells results in a heavily phosphorylated enzyme that requires very high concentrations of G6P for activity measurements, makes the full-length recombinant human enzyme unsuitable for an assay designed to displace G6P. However, since the fluorescent probe could be fully displaced from yGsy2p through competition with G6P, we used yGsy2p and not hGYS1 for HTS. The high conservation of residues within the G6P allosteric site, the active site, and overall protein sequence identity (~55%) between yGsy2p and hGYS1 further supported the decision to use the yeast enzyme as a screening surrogate for the human enzyme (Supplemental Figure 2). The robustness of the FP assay for HTS was assessed by determining the Z′-factor, a parameter reflective of both the signal dynamic range and data variability36. While the ideal Z′-factor is 1, a Z′-factor between 0.5 and 1 is considered excellent and suitable for screening assays. The FP values for the positive controls (maximal binding, without G6P) and negative controls (fully displaced tracer, with G6P) were 109.23 ± 1.97 and 26.48 ± 1.93 (mean ± SD) from the 384-wells, respectively. The Z′-factor for this assay was determined as 0.86, indicating that this assay is well suited for HTS (Figure 1D).
Hits identification and validation
We used the aforementioned FP displacement assay to screen the 50K ChemBridge Diversity library at a final assay concentration of 10 μM against the yGsy2p enzyme. The HTS was adapted to the 384-well plate format using three columns for the DMSO negative controls and one column for unlabeled G6P as the positive control, resulting in a total of 157 screening plates (Supplemental Table 1 and 2). We used a Z’-score threshold of −1, corresponding to a separation of 3 standard deviations between μc (means of the control DMSO signal) and μs (means of the library sample signal) as a signal cutoff (Supplemental Table 2). These standards produced 117 hits and an overall 0.23% hit rate. Initial stock availability led to re-purchasing of 110 compounds (designated H1-H110) from ChemBridge and validation of their activity using the standard 14C-glucose incorporation assay at 100 μM concentration. This approach validated 16 hits with greater than 40% inhibition of yGsy2p activity (Figure 2A).
Figure 2. Hits identification and validation.


(A) In the FP assay, setting a Z’-score threshold of −1 gave 117 initial hits, out of which 110 (designated H1-H110) were re-purchased and tested. The blue column represents the percentage of fluorescence polarization signal to control. The hits were screened at 10 μM in single measurement. The orange column is the percentage of yGsy2p activity to control measured through 14C-glucose incorporation assay. The hits were tested at 100 μM. Averages of triplicate assays ± SEM are shown. (B) Schematic representation of yGsy2p and hGYS1 protein. Phosphorylation residues are shown in red. To generate hGYS1Δ634S8,11N mutant, hGSY1 was truncated at position 634 with mutations of Ser8/11 to Asn to eliminate potential phosphorylation sites. (C) Percentage of hGYS1Δ634S8,11N activity to control measured through 14C-glucose incorporation assay. The hits were tested at 100 μM. Averages of triplicate assays ± SEM are shown. (D) Screening triaging strategy.
Since the yeast yGsy2p enzyme was used as a surrogate for the human hGYS1 enzyme, we next examined if the 16 validated compounds were also active as inhibitors of hGYS1 activity. To accomplish this necessary confirmation, we redesigned the hGYS1 construct to create a constitutively active enzyme through deletion of the C-terminal phosphorylation domain (residues 635–737) and through the substitution of the two N-terminal phosphorylation sites (Ser8, Ser11) with Asn residues (designated hGYS1Δ634S8,11N) (Figure 2B). Purification of this truncated form of GS in significant quantity led to an enzyme that exhibited an activation state of ~0.2, a ratio of GS activity in the absence over the presence of G6P as an index of the phosphorylation state of the enzyme37. Unlike the heavily phosphorylated, full-length enzyme produced in insect cells that had an activation state of <0.0138, this truncated form of GS was well suited for validation assays designed to look for inhibitors because the enzyme was neither overly inhibited by phosphorylation nor rendered insensitive to the effects of G6P. At a test concentration of 100 μM, only 1 hit, namely a substituted imidazole, (rac)-2-methoxy-4-(1-(2-(1-methylpyrrolidin-2-yl)ethyl)-4-phenyl-1H-imidazol-5-yl)phenol (H23), demonstrated greater than 20% inhibition using this truncated hGYS1 (Figure 2C and 2D).
Crystal structure of the H23-yGsy2p complex
Although there are no mammalian GS crystal structures, the structures of two eukaryotic enzymes, namely yGsy2p from Saccharomyces cerevisiae10 and GS from Caenorhabditis elegans39 encouraged our undertaking crystallization experiments. As previously described, yeast Gsy2p existed as tetramer in the crystal structure, and each subunit contained two Rossmann-fold domains with the catalytic site in the interdomain cleft10. In the crystal packing environment in crystals of the activated form of GS, one subunit appeared 13.3° more closed than the other three “open” subunits40. We successfully determined the crystal structure of the H23-yGsy2p complex to a resolution of 2.85 Å (Table 1), and we observed H23 binding in three of the four subunits, all of which corresponded to the “open” domain positions (Figure 3B). The structure showed H23 bound within the active site of GS in a location that overlapped with the binding site for UDP-glucose (UDPG)40 (Figure 3C and 3D). Structural alignment of the R589/592A2·UDP complex to the WT·H23 complex using their Cα carbons generated an overall root mean square deviation (rmsd) of 0.36 Å, indicating a high degree of similarity. The binding of H23 to yGsy2p was mediated by hydrogen-bond formation between the phenolic hydroxyl group of H23 and the nitrogen backbone of Leu481; hydrophobic interactions of the 2-methoxyphenol sandwiched between Tyr492 and Phe480; van der Waals interactions of the benzene group with the side chains of Phe480 and Arg320; and additional van der Waals interactions of the N-methylpyrrolidine moiety with Tyr492, Thr514, and Glu517 (Figure 3D).
Table 1.
Structural data and refinement statistics
| Data collection | Refinement | ||
|---|---|---|---|
| Space group | I222 | No. reflections | 95326 |
| Cell dimensions | Rwork/Rfree | 0.20/0.26 | |
| a, b, c (Å) | 192.3, 206.6, 205.0 | r.m.s. deviations | |
| α, β, γ (°) | 90.0, 90.0, 90.0 | Bond lengths (Å) | 0.010 |
| Resolution (Å) | 50–2.85 | Bond angles (°) | 1.44 |
| Rmerge | 0.091 (0.766) | Ramachandran plot | |
| Rmeas | 0.100 (0.843) | Preferred/Allowed (%) | 99.01 |
| Rpim | 0.040 (0.347) | Outliers (%) | 0.99 |
| CC1/2 | 0.999 (0.857) | B-factors | |
| I/σ(I) | 20.3 (2.0) | Protein | Chain A, 80.1; B, 83.7; C, 91.9; D, 94.6 |
| Completeness (%) | 99.7 (100) | ||
| Ligand (H23) | Chain A, 100.9; C, 128.3; D, 107.5 | ||
| Redundancy | 6.3 (5.5) | ||
Figure 3. Crystal structure of the H23-yGsy2p complex (PDB: 6U77).

(A) Chemical structure of H23. (B) Ribbon diagram representation of the crystal structure of H23-yGsy2p complex. H23 is represented by space-filling models in cyan, and binds to three subunits of yGsy2p which are colored differently. (C) The electron density for H23 prior to the inclusion of the ligand in refinement. The map shown is the original unbiased 2Fo-Fc map contoured at 1 standard deviation. (D) Stick representation of the superposed UDP (purple) and H23 (yellow) structures and their interactions with the surrounding amino acids.
Kinetic characterization of H23
In a study of the inhibitory potential for H23 against yeast and human GS using the standard 14C-glucose incorporation assay, H23 exhibited IC50 values of 280 μM and 263 μM in the absence and presence, respectively, of G6P for yGsy2p (Figure 4A). The similarity in IC50 values indicated H23 was not in direct competition with G6P. Under subsaturating G6P concentrations, the IC50 values of H23 against either hGYS1Δ634S8,11N or wild-type hGYS1 were 161 μM and 875 μM, respectively (Figure 4B). Even though the presence or absence of G6P did not impact H23 potency, the activity state of the human GS enzyme had a five-fold effect on the binding of H23.
Figure 4. Kinetic characterization of H23.

(A) Inhibition of H23 to yGsy2p in the absence or presence of G6P. (B) Inhibition of H23 to hGYS1Δ634S8,11N and hGYS1 wild type. All IC50 curves represent one of three experiments performed using triplicate measurements for each condition, with mean ± SEM shown. (C) Michaelis-Menten curves fit to the competitive inhibition equation for varied H23 versus UDPG. The values of goodness of fit (R2) are shown for all equations evaluated. H23 has a Ki of 370 ± 30 μM in the presence of G6P and a Ki of 290 ± 20 μM in the absence of G6P. UDP is used as a positive control for competitive inhibition against varied UDPG for yGsy2p, which displayed a Ki of 350 ± 10 μM. The reported Ki values are the mean ± SEM from three independent experiments in duplicate.
To understand H23 mode of inhibition, we performed co-variation experiments by simultaneously varying the concentrations of UDPG at different fixed concentrations of H23 and fitting the kinetic data against the competitive, non-competitive and uncompetitive inhibition equations. For yGsy2p, the inhibition data with H23 was consistent with a competitive mode of inhibition with respect to varied UDPG, with Ki values of 370 μM in the presence of G6P, and 290 μM in the absence of G6P. UDP displayed a similar competitive mode of inhibition with a Ki value of 350 μM (Figure 4C).
Development of structure-activity relationships for analogs of H23 toward hGYS1
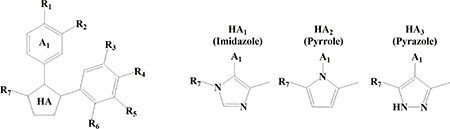
The overall protein sequence alignment demonstrates 55% sequence identity between yGsy2p and hGYS1. Because the amino acids in the binding site for H23, including Arg320, Phe480, Leu481, Tyr492, and Glu517 in yGsy2p, are completely conserved across yeast and human species (Supplemental Figure 2), the structural information derived from H23-yGsy2p crystal structure provided a useful guide for structure-activity studies focused on hGYS1. We examined a total of 491 analogs that shared at least 50% structural similarity with H23, and we tested their activities against yGsy2p, hGYS1Δ634S8,11N, and wild-type hGYS1 using the 14C-glucose incorporation assay. Our initial kinetic studies showed that a five-membered, heteroaryl (HA) core with a phenyl group at the A1 position, and a second, vicinal phenyl group were essential elements of H23 (Table 2). Consequently, analog development modified the HA core, A1 and substructures at R1-R7 positions shown in the structure in Table 2. In this study, all H23 analogs possessed one of the following HA cores: imidazole (designated as HA1), pyrrole (designated as HA2) or pyrazole (designated as HA3). Active compounds appeared in structures with any of these three cores, but the most potent compounds had a pyrazole (HA3) scaffold. Commercial libraries were the source of HA1 and HA2 compounds in Table 2, and a three-step synthesis provided the HA3 compounds as outlined in Scheme 1.
Table 2.
Structure-activity relationships for H23 analogs
 | |||||||||||||
|---|---|---|---|---|---|---|---|---|---|---|---|---|---|
| %Activity @ 300μM compound | IC50 (μM) | ||||||||||||
| Compound | HA | A1 | R1 | R2 | R3 | R4 | R5 | R6 | R7 | yGsy2p | hGYS1Δ 634S8,11N | hGYS1 | hGYS1 |
| H23 | HA1 |  |
OH | OCH3 | H | H | H | H |  |
36.5±0.6 | 46.5±0.4 | 77.1±1.2 | 875±43 |
| 1 | HA1 |  |
H | H | H | H | H | H |  |
NI | 93.3±1.5 | NI | ND |
| 2 | HA1 |  |
H | H | H | H | H | H |  |
72.7±0.4 | 94.4±2.2 | NI | ND |
| 3 | HA1 |  |
OH | H | H | H | H | H |  |
66.6±1.3 | 56.6±1.3 | 93.4±2.8 | ND |
| 4 | HA1 |  |
OH | H | H | H | H | H | 94.8±2.9 | NI | NI | ND | |
| 5 | HA2 |  |
OH | H | H | H | H | H | CH3 | 79.7±1.0 | 84.3±0.5 | NI | ND |
| 6 | HA2 |  |
OH | H | H | H | H | H |  |
86.0±3.1 | NI | NI | ND |
| 7 | HA2 |  |
OH | H | H | H | H | H |  |
40.1±0.9 | 40.1±0.4 | 58.9±0.3 | 384±28 |
| 8 | HA2 |  |
OH | H | H | OCH3 | H | H |  |
34.5±0.4 | 50.6±3.0 | 84.0±0.1 | ND |
| 9 | HA2 |  |
CONH2 | H | H | H | H | H |  |
49.3±0.6 | 40.6±0.1 | 78.7±0.9 | ND |
| 10 | HA2 |  |
F | H | H | H | H | H |  |
84.7±0.1 | 72.1±4.1 | 87.5±0.4 | ND |
| 11 | HA3 |  |
Cl | H | H | OH | OH | OH | CH3 | 3.52±0.67 | 6.47±0.09 | 4.34±0.94 | 52.9±3.8 |
| 11 | HA3 |  |
Cl | H | H | OH | OH | OH | CH3 | NI | NI | 91.8±0.3 | 52.9±3.8 |
| 12 | HA3 |  |
Cl | C1 | H | OH | OH | OH | CH3 | NI | 81.7±2.7 | 84.7±2.5 | ND |
| 13 | HA3 |  |
Cl | H | H | OH | OH | OH | H | NI | 79.4±0.9 | 85.4±0.1 | ND |
| 14 | HA3 |  |
Cl | C1 | H | OH | OH | OH | H | 76.7±0.5 | 26.4±2.3 | 52.5±4.4 | 19.5±1.3 |
| 15 | HA3 |  |
Cl | H | H | OH | OH | OH |  |
51.5±0.4 | 11.8±2.4 | 47.5±1.7 | 19.8±0.5 |
| 16 | HA3 |  |
Cl | H | H | OH | H | OH |  |
NI | 87.9±1.5 | NI | ND |
| 17 | HA3 |  |
Cl | Cl | H | OH | OH | OH |  |
47.4±4.4 | 5.28±0.16 | 12.2±1.3 | 13.7±0.6 |
| 18 | HA3 |  |
F | H | H | OH | OH | OH | CH3 | NI | 89.0±1.5 | 94.0±2.4 | ND |
| 19 | HA3 |  |
F | H | H | OH | OH | OH |  |
45.7±12.4 | 11.7±0.1 | 47.8±7.0 | 14.1±0.8 |
| 20 | HA3 |  |
H | H | H | OH | OH | OH | H | NI | 25.2±1.6 | 84.7±2.7 | ND |
| 21 | HA3 |  |
H | H | H | OH | OH | OH |  |
51.8±1.8 | 5.68±0.16 | 47.2±1.2 | 16.4±0.6 |
| 22 | HA3 |  |
OH | H | H | OH | OH | OH | H | 6.21±0.59 | 23.0±1.9 | 22.6±0.4 | 9.82±1.06 |
| 23 | HA3 |  |
OH | H | H | OH | OH | OH |  |
0.97±0.01 | −1.01±0.37 | −0.26±0.34 | 2.75±0.08 |
| 24 | HA3 |  |
OH | H | F | OH | H | OH |  |
65.2±2.4 | 74.2±4.0 | 78.4±0.9 | 72.4±6.5 |
| 25 | HA3 |  |
 |
H | H | OH | OH | OH |  |
51.2±1.5 | 8.14±0.65 | 42.0±1.5 | 10.1±0.8 |
| 26 | HA3 |  |
 |
H | H | OH | OH | OH | H | 78.4±5.1 | 85.0±2.6 | 66.8±3.7 | 34.0±7.6 |
| 27 | HA3 |  |
 |
H | H | OH | OH | OH |  |
18.8±0.5 | 10.5±0.1 | 1.43±0.13 | 6.54±0.09 |
| 28 | HA3 |  |
 |
H | H | OH | H | OH |  |
82.3±7.5 | 92.7±1.6 | 89.2±6.4 | ND |
| 29 | HA3 |  |
 |
H | H | OH | OH | OH | CH3 | 90.6±5.8 | NI | 80.1±3.6 | ND |
| 30 | HA3 |  |
 |
H | H | OH | OH | OH |  |
91.6±0.6 | 40.3±2.3 | 81.4±2.1 | ND |
For HA3 Scaffold, IC50(S) were determined using a cut-off of 70% activity to hGYS1. Compound 24 is an exception since it has a unique F at R3 position. NI: no inhibition, greater than 95% activity; ND: not determined. Values are the mean ± SEM from at least three independent experiments in duplicate.
Scheme 1. Synthesis of pyrazoles 11–30.

Reagents and conditions: (a) (i) arylacetonitrile, BF3·Et2O, HCl (gas), rt, 6–8 h, (ii) H+/H2O, 0.5–2 h; (b) (i) arylacetic acid, BF3·Et2O, 80–90 °C, 2 h, (ii) H2O; (c) (i) DMF, BF3·Et2O, POCl3, 50–60 °C, 2 h, (ii) H2O; (d) (i) Ac2O, KOAc, reflux, 8 h, (ii) H2SO4, EtOH, reflux, 0.5 h; (e) (i) (CF3CO)2O, pyridine, rt, 48–120 h, (ii) H2O; (f) N2H4·H2O, reflux, 0.5–6 h.
A step-by-step program of modifying positions in H23 involved changes designed either to augment or diminish interactions with substituents in H23 and the adjoining residues in yGsy2p. Briefly, starting from the imidazole core (HA1), we determined that the R1 hydroxyl group that formed a hydrogen bond with the peptide nitrogen of Leu481 was essential to retain good inhibitory activity (i.e., compare H23 versus 1 in Table 2). The addition of an extra methylene unit to the R7 chain eliminated inhibitory potential (4 versus 3). In a similar fashion, the most potent of the pyrrole HA2 compounds also had a hydroxyl group at R1 position (7 versus 9 or 10). Interestingly, substitution of a carboxyl group at R7 position improved the potency to hGYS1 by 2-fold (IC50 values for H23 versus 7), a finding that suggested different conformational binding modes for H23 and 7 for hGYS1.
Because none of the analogs within the HA1 or HA2 series generated noteworthy improvements in potency, we turned to the pyrazole (HA3) series. Within the HA3 series, SAR studies demonstrated the importance of a hydrogen bond acceptor at the R1 position as displayed in the following order of potency: −OH > −NO2 > −CN > −F > −H > −Cl (i.e., 23 versus 27, 25, 19, 21 and 15). When a chlorine is present at the R1 position, adding a second chlorine substituent at the R2 position improved potency (12 versus 11 or 14 versus 13 or 17 versus 15). The most potent compounds in this series had a pyrrogallol group at the R4–6 positions, and the hydroxyl groups on this substituent conferred inhibition to GS even if the R1 position was non-optimal. For instance, 11 was 16-fold more potent than H23. Strikingly, the meta-hydroxyl group (R5) was critical to binding. Substitution of this hydroxyl groups with just hydrogen decreased potency significantly (16 versus 15 or 28 versus 27). SAR studies also indicated that substituents at the R7 position had an effect on activity in the following order of −CF3 > −H > −CH3 (15 or 13 versus 11; 17 or 14 versus 12). In summary, analog development initiated from the substituted imidazole H23 led to a substituted pyrazole, namely 4-(4-(4-hydroxyphenyl)-3-(trifluoromethyl)-1H-pyrazol-5-yl)pyrogallol (23) that had an in vitro IC50 value of 2.75 μM, an improvement in potency toward hGYS1 of more than 300-fold.
Kinetic characterization of compound 23
In order to understand the molecular features of our most potent analog, compound 23, we examined the kinetic characteristics of its interaction with GS (Figure 5A). Compound 23 has a competitive mode of inhibition for wild-type hGYS1, with a Ki value of 1.31 ± 0.14 μM (Figure 5B). In light of the SAR and our kinetic results, we hypothesized that the binding of 23 to the active site of yGsy2p resembled the binding of H23 in the active site. In this model, the hydroxyl group at R1 position formed a hydrogen bond with the nitrogen backbone of Leu481. The three hydroxyl groups in the pyrogallol subunit formed hydrogen bonds with Thr514 or Glu517. Additional structural flexibility of hydrogen-bond formation depended on the relative position of 23 in the binding pocket. As our SAR study showed, the hydroxyl group at R5 position was important to confer inhibition, and an additional hydrogen-bond formation between Arg320 and the pyrazole ring may also strengthen binding, particularly when an electron-withdrawing trifluoromethyl group was present, and diminish binding when electron-donating methyl group was present in the same position in the pyrazole ring (Figure 5C). To validate whether compound 23 bound within the active site as modelled, we generated mutation within the active site where Y513 was mutated to L513. This mutation, Y513L, did not abolish GS activity. Unlike other active site mutations that almost completely eliminated enzyme activity, the Y513L mutant decreased GS catalytic activity by only 10-fold. Consistent with our modelled mode of binding, we found that inhibition by 23 toward Y513L was compromised compared to wild type (Figure 5D).
Figure 5. Kinetic characterization of 23.

(A) Dose response curves for parent compound H23 and the most potent analog 23 against wild-type hGYS1. (B) Michaelis-Menten curve of competitive inhibition for 23 versus UDPG. The values of goodness of fit (R2) are shown for all equations. 23 shows a Ki of 1.31 ± 0.14 μM under the tested condition. Ki value for 23 is the mean ± SEM from three independent experiments performed using duplicate measurements for each condition. (C) Hypothetical binding model of 23 to GS in the active site. The hydroxyl group at R1 position forms a hydrogen bond with the nitrogen backbone of Leu481. The three hydroxyl groups flanking the benzene form hydrogen bonds with Tyr514 or Glu517. An additional hydrogen bond is formed between Arg320 and the pyrazole ring, which is strengthened when electron-withdrawing group (like CF3) is present and diminished when electron-donating group (like CH3) is present. Manual docking of 23 in the active site was performed based on SAR and mode of inhibition studies. (D) Validation of 23 binding in the active site. Compound 23 showed decreased potency against the active-site mutant Y513L compared with wild-type yGsy2p. All IC50 curves represent one of three experiments performed using triplicate measurements for each condition, with mean ± SEM shown.
Inhibition of glycogen synthase activity in cell lysates
We next examined these substituted pyrazoles as inhibitors of GS activity in cell lysates. Cultured cells normally do not accumulate large amounts of glycogen, largely due to the high levels of phosphorylation and the resulting low activity state of GS26. Lysates from two cell lines were prepared for GS activity measurement: the HEK293-PTG overexpressing PTG, a regulatory subunit of protein phosphatase 1, that recruits the phosphatase to glycogen where it promotes the dephosphorylation and activation of GS41,42, and glycogen accumulation; and the Rat-1 fibroblasts which have low GS activity and glycogen as previously described43,44. The HEK293-PTG cells have a seven-fold increase in the GS activity ratio from 0.02 to 0.15. To determine GS activity in lysates and optimize the conditions for measurement, we measured the incorporation of 14C-glucose into glycogen at 0.2 mM UDPG and 1 mM G6P initially as a function of different lysate concentrations. We observed a linear increase in GS activity within the range of 0.075–1.5 mg/ml lysate. Under the conditions of the assay, the lysate from the HEK293-PTG cells had 10-fold more activity than the Rat-1 cell lysate (Figure 6A). To limit substrate utilization to under 10%, we used 0.15 mg/mL HEK293-PTG lysate and 0.75 mg/mL Rat-1 lysate with imidazole H23, pyrrole 7 and pyrazoles 15, 19, 27 and 23. When tested at 100 μM, H23 and 7 did not significantly inhibit GS activity in lysates. However, the remaining four substituted pyrazoles, namely 15, 19, 27 and 23, reduced synthase activity in both HEK293-PTG and Rat-1 cell lysates by >30%. Consistent with its greatest potency toward purified enzyme, pyrazole 23 exhibited almost complete inhibition of synthase activity in lysates (Figure 6B). In summary, these analogs targeted GS activity in the context of the glycogen particles present in cellular lysates with potencies similar to those observed in purified enzyme preparations.
Figure 6. Inhibition of glycogen synthase activity in cell lysates.

(A) Synthase activity in HEK293-PTG and Rat-1 cell lysates in the presence of 0.2 mM UDPG and 1 mM G6P. The data was fit to linear regression line with equations showing synthase activity rate (nmole/min, y-value) under various lysate concentrations (mg/ml, x-value). The data represent averages of triplicate assays ± SEM. (B) Percent of 14C-glucose incorporation to control (DMSO) by cell lysates and recombinant hGYS1 in the presence of H23 and its analogs. For cell lysates and recombinant hGYS1, 100 μM and 20 μM compounds were used respectively. Averages of triplicate assays ± SEM are shown.
DISCUSSION
The suppression of glycogen accumulation emerged as an attractive therapeutic approach for GSDs whose etiology derived from excessive glycogen storage. Animal models supported this approach in which genetic or chemical depletion of glycogen alleviated disease symptoms in models of Lafora disease27,28,29,30,45, Pompe disease31, and Cori disease32. Interestingly, recent studies suggested that type 2 diabetes (T2D) might also be within the GSD spectrum, as glycogen accumulation in pancreatic β cells under hyperglycemia contributed to the pathology of β-cell dysfunction16,17.
Only a few studies identified molecules that targeted glycogen accumulation, including the widely-used glucose lowering T2D drug metformin46,47, mTORC1 inhibitor rapamycin that indirectly suppress GS activity through signaling regulation31, GYS2 RNAi that mediates enzyme reduction32, and the newly developed antibody-enzyme fusion that can degrade polyglucosan45. However, these molecules either targeted glycogen synthesis in an indirect manner, or present a challenge for the delivery of therapeutics to the central nervous system. In this study, we adapted a high-throughput fluorescence polarization assay to screen directly for small-molecule modulators of GS. A HTS of a commercial 50K chemical library identified 117 primary hits against yGsy2p, and through 14C-glucose incorporation assay only 1 hit was validated as hGYS1 inhibitor (Figure 2). The low translation between these two assays might lie in the nature of these two systems, since fluorescence polarization assay is affinity-based whereas the radiochemical assay is activity-based. In addition, the kinetic aspects of the two enzyme systems differ as the impact of regulatory input on the enzyme results in different outcomes where regulation of yeast GS by G6P primarily impacts kcat, whereas in mammalian systems the impact is primarily on Km for substrate48,49. There is no evidence that the kinetic steps in catalysis differ between the two enzymes, but it is clear that the manner in which the rates for those individual steps are impacted by regulatory input does differ. A more sensitive assay directly targeting hGYS1 is likely to offer better screening outcome. Nonetheless, our FP assay provided a novel HTS assay as a starting point, and did indeed identify a competitive inhibitor of UDPG, namely (rac)-2-methoxy-4-(1-(2-(1-methylpyrrolidin-2-yl)ethyl)-4-phenyl-1H-imidazol-5-yl)phenol (H23), that bound within the active site of yeast yGsy2p. This outcome was supported by both an X-ray structure and by kinetic studies using H23 and analogs developed in a subsequent SAR study. The site of interaction was surprising because the assay identified small-molecule inhibitors that displaced G6P binding. However, a close inspection of the known, eukaryotic GS structures demonstrated that the UDPG and G6P binding sites resided on opposing ends of the same alpha-helix, with Tyr492 stacked against the uracil ring of UDP and His500 forming a hydrogen bond with the phosphate moiety of G6P (Supplemental Figure 3). Considering this structural proximity and the cooperative nature of the structural transitions in GS, it was not surprising that binding at one site could transmit structural information to the other site and that under the subsaturating conditions of our HTS assay, binding of compounds within the active site could promote displacement of the fluorophore from the G6P site.
Humans have two isoforms of GS, namely hGYS1 and hGYS2. The fact that hGYS1 is universally expressed in most tissues while hGYS2 is restrictively expressed in liver prompted us to identify inhibitors against hGYS1 in the hope of diminishing brain glycogen stores, aberrantly accumulated in some GSDs such as Lafora disease26. The high sequence homology between hGYS1 and hGYS2 enzymes could make it difficult to develop isoform-specific inhibitors. Nonetheless, inhibition of hGYS2 might aid in the therapeutic efficacy of GSDs with excessive glycogen accumulation in liver that would ultimately lead to liver damage. Recently, Pursell et al. showed that GYS2 inhibition with RNAi prevents liver injury in mouse models of Cori disease and had no adverse effects32.
Mutations in GYS150 or GYS251 in rare GSDs lead to decreased glycogen in muscle and liver respectively. Disruption of the mouse GYS1 gene resulted in 90% perinatal lethality, likely due to cardiac developmental problems during embryogenesis, but the surviving mice were ostensibly normal and lived normal lifetimes52. Disruption of GYS2 in mice largely mimicked the phenotype of human GSD0 patients, namely tendencies to post-prandial hyperglycemia and to hypoglycemia upon fasting but compatible with a relatively normal life51,53. Given that small-molecule inhibition will not have the penetrance of genetic defects, inhibition of GS activity by small-molecules is unlikely to elicit extreme phenotypes, and small-molecule inhibition remains as a potentially valuable means of treating these devastating diseases.
CONCLUSIONS
In summary, this study described a strategy for developing a high-throughput FP assay for the screening of small-molecule inhibitors of GS, the binding mode of a leading imidazole H23 validated through both X-ray crystallographic and kinetic data; and an SAR study leading to analogs, such as pyrazole 23, with low micromolar potency. These outcomes suggest that targeting glycogen synthase with small-molecule inhibitors represents an attractive approach for developing new therapeutics for diseases in the GSD family. Unlike other enzyme-based strategies where complete inhibition is the ultimate objective, a partial reduction of GS activity may be sufficient to alleviate unwanted and damaging levels of glycogen deposition in the neural tissue of patients suffering from Lafora disease27,28,30. The challenges of developing any therapeutic, nevertheless, remain the same, and the gulf that stretches between our identification of a pyrazole inhibitor 23 with activity in the low micromolar range and a therapeutic candidate is wide and deep. Initial efforts will involve microsomal studies to evaluate anticipated pharmacokinetic concerns about unwanted redox reactions of pyrazole 23 to 4-(4H-pyrazol-4-ylidene)- or 2,3-dihydroxy-4-(3H-pyrazol-3-ylidene)cyclohexa-2,5-dien-1-ones. We will use a combination of synthesis (i.e., SAR studies) and computational modeling to identify analogs that avoid this concern and retain desired physiochemical properties (i.e., water solubility; bioavailability); we will evaluate any promising, new leading structures for potential toxicity issues (e.g., hERG studies); and we will explore biotinylated analogs to confirm the specificity of these pyrazole analogs for the desired target. These initial, encouraging results bode well for the future development of small-molecule strategies to study and potentially treat GSDs.
EXPERIMENTAL SECTION
Materials
The 50K compound Diversity set library, the primary hits H1-H110, and analogs 1-4, 7-9 were purchased from ChemBridge Corporation (San Diego, CA). Analogs 5, 6 and 10 were purchased from Vitas-M Laboratory (Champaign, IL). The purity of these purchased compounds were > 95% based on the spectra (either LC/MS or NMR) provided by the vendors. All pyrazoles were characterized and validated by both LC/MS and NMR analyses.
Synthesis and purification of GlcN6P-fluorescein-5-Ex
The tracer was synthesized by using a standard coupling reaction between an amine and N-hydroxysuccinimidyl (NHS) ester. The reaction included: 100 mM NaHCO3 (pH 8.4), 130 mM glucosamine-6-phosphate (GlcN6P) pH 8.0, 41.6% DMSO and 14 mM fluorescein-Ex, succinimidyl ester. The reaction was incubated for 1 hour at 37°C followed by an overnight incubation at 25°C with continuous stirring, the reaction was stopped by addition of Tris-HCl (pH 8.0) to a final concentration of 0.2 M. Purification of GlcN6P-fluorescein-5-Ex was carried out by HPLC on a semi-preparative Luna C18 column (250×10 mm, 5 μm) from Phenomenex. The eluents used were 25 mM NH4OAc (pH 5.5) (E1) and 100% methanol (E2). Elution was performed by the following gradient: T0= 5% (v/v) E2, T10= 50% (v/v) E2, T30= 50% (v/v) E2, T45= 75% (v/v) E2, T55= 5% (v/v) E2 at a flow rate of 4 mL/min. The fractions containing the UV-containing fractions were collected, dried using a SpeedVac, dissolved in water and stored at −20°C. The fractions containing GlcN6P-fluorescein-5-Ex were identified and confirmed by mass spectrometric analysis. The final tracer concentration was determined by UV spectroscopy (Abs492~9.2 × 10⁴ M−1 cm−1).
Fluorescence polarization assay
All the fluorescence polarization (FP) experiments were performed on an EnVision multimode plate reader (Perkin Elmer) with the λex= 485 nm and λem= 535 nm. The FP experiments were performed in 384-well, black, flat bottom microplates at 25°C. After addition of all reagents, plates were spun down for a minute at 1000g in a centrifuge followed by measurement of the FP signals, where each well was flashed 10 times and the average values were used. All polarization values were expressed as milli-Polarization units (mP), calculated from equation 1:
| (1) |
Where: S= fluorescence intensity measured when the excitation and emission polarizers are parallel and P= fluorescence intensity measured when the excitation and emission are perpendicular and G= grating factor that corrects for instrument bias. All the nonlinear regression analyses were performed by fitting the experimental data to the defined equations using SigmaPlot version 13.0.
Determination of the GlcN6P-fluorescein-5-Ex/yGsy2p equilibrium dissociation constant
The concentration of the tracer was initially varied from 0–100 nM in order to determine the optimal assay concentration. Based on total fluorescence intensity and mP values, the optimal concentration was determined to lie between 10–40 nM in the final assay. The binding affinity for the tracer for yGsy2p was determined by adding the tracer to a final concentration of 20 nM to each well in the presence of varying yGsy2p concentrations (0 to 50 μM) in a final volume of 50 μL. The final assay buffer consisted of 15 mM Tris-HCl (pH 7.8) and 15 mM NaCl, the plate was incubated at 25°C for 10 minutes before reading. The dissociation constant, i.e. Kd was calculated by fitting the experimental data to equation 2:
| (2) |
Where f=mP, y0=mPmin, a= mPmax-mPmin, b= Kd and x= Concentration of yGsy2p. Experiments were performed in triplicate.
Activation of yGsy2p or hGYS1 in the presence of G6P or GlcN6P
The activation of hGYS1 or yGsy2p in the presence of G6P or GlcN6P was determined using the radiochemical assay previously described33 and the data was fit to equation 2. However, the parameters were defined as: f= % activation, y0 = % activationmin, a=% activationmax − % activationmin, x= Concentration of G6P or GlcN6P and b= AC50. Experiments were performed in triplicate.
Competitive displacement experiments
G6P was serially diluted in 15 mM Tris-HCl (pH 7.8) to provide a final concentration ranging from 0.68 μM to 40 mM. The reaction mixture contained a final concentration of 15 mM Tris-HCl (pH 7.8), 15 mM NaCl, 20 nM GlcN6P-fluorescein-5-Ex, 4.2 μM yGsy2p and varying concentrations of G6P in a final volume of 50 μL. The plate was incubated for 10 minutes at 25°C before reading. The Kd was determined by fitting the observed mP changes to equation 3:
| (3) |
Where f1= mP, EC50= Kd, x= Concentration of G6P. Experiments were performed in triplicate.
Determination of Z′-factor
To determine the quality of the FP-displacement assay for adaptation for HTS, the Z′-factor was calculated using equation 4:
| (4) |
where σp and σn are the standard deviations of the signal for the positive and negative controls. For the negative control 2 μL of H2O was added and for the positive control 2 μL of G6P was added to a final concentration of 2 mM in a 384-well plate. The protein sample was prepared in 25 mM Tris-HCl (pH 7.8), 25 mM NaCl, 7 μM yGsy2p, 40 nM tracer and dispensed by a Multi-drop 384 liquid dispenser (Titertek) into the wells with either H2O or G6P. The plate was spun down in a centrifuge followed by measurement of the FP signals.
Expression and purification of yGsy2p and hGYS1
The His-tagged yGsy2p recombinant enzyme was expressed in BL21 (DE3) Escherichia coli and purified using a two-step procedure including affinity chromatography on Ni2+-nitrilotriacetic acid-agarose and ion exchange purification on Q-sepharose column10. The hGYS1 in the pFL vector38 was modified by deleting the intein-chitin binding domain fusion at the C-terminus and replacing it with a simple non-cleavable 6 × His-tag at the C-terminus. Purification of the construct was achieved using Ni-NTA resin (Qiagen product #31314) following manufacturer’s instructions. Separately, a construct of hGYS1 was generated in which the C-terminus was truncated at position 634 and the N-terminal phosphorylation sites at positions 8 and 11 were simultaneously mutated to Asn residues, that avoids solubility issues associated with mutation of these residues to Ala, in order to generate the hGYS1Δ634S8,11N construct. This construct was also fused to the same C-terminal 6 × His-tag for purification using Ni-NTA resin.
Determination of kinetic parameters
Enzyme activity of GS was determined using UDPG as a substrate through 14C-glucose incorporation assay by monitoring the amount of radiolabeled glucose being incorporated into glycogen33. Unless otherwise noted, yGsy2p activity was measured in reaction solution containing 0.3 mM UDPG in the absence or presence of 0.04 mM G6P. The activity of mutant hGYS1Δ634S8,11N enzyme was measured using 0.2 mM UDPG and 0.4 mM G6P, while the activity of wild-type hGYS1 was measured using 0.2 mM UDPG and 1 mM G6P. All kinetic data analyses were performed using the program package SigmaPlot (version 13.0) by fitting the data to the appropriate kinetic equation. The IC50 curves for H23 and its analogs were fit to the four parameter logistic equation. Titration experiments for Michaelis–Menten curves were performed by covarying inhibitor and substrate concentrations. The reaction mixture contained 5 μg/ml yGsy2p, varied UDPG (0.2–8 mM in the absence or presence of 7.2 mM G6P) and H23 concentrations (0–0.8 mM). All data were fit to competitive, non-competitive and uncompetitive inhibition models in SigmaPlot (Version 13.0). Appropriate model was selected through analysis of goodness-of-fit and the residuals of those fits. All experiments include the controls contained 2% (v/v) DMSO. The values presented here are the averages ± the standard errors of the mean of three independent experiments with duplicate measurements for each data point in each experiment.
Crystallization and structure determination
Yeast Gsy2p crystals were obtained using hanging drop vapor diffusion method10. Briefly, the protein solution was prepared at 3 mg/ml containing 25 mM G6P. The protein solution was mixed with crystallization reservoir solution containing 0.1 M Bis-Tris, pH 5.9 and 13–15% PEG300. The crystals were soaked with compounds (0.5 mM) on sitting drop plates to obtain inhibitor-bound yGsy2p complex. The crystals were cryo-protected and frozen. Diffraction data sets were collected using X-ray crystallography at the Advanced Photon Source at beamline 19-ID, operated by the Structural Biology Center at Argonne National Laboratory. The data sets were then indexed, integrated and scaled using the HKL3000 program package. The structures were solved by molecular replacement using MOLREP, as implemented in the Collaborative Computational Project Number 4 (CCP4) program suite. The G6P bound yGsy2p-R589/592A2 mutant structure (pdb code: 3NB0) was used as the model for molecular replacement. The structures were initially refined with a single round of rigid body refinement for individual domains, followed by iterative rounds of restrained refinement with the application of domain-based TLS and NCS restraints using REFMAC5 as implemented in CCP4. COOT (version 0.7.2.1) was used to visually inspect and manually adjust the refined models.
Compound synthesis
Synthesis of pyrazoles 11–30 was performed in a 3-step procedures which include 1) synthesis of polyhydroxydeoxybenzoins; 2) ring-closure reaction for the synthesis of isoflavones with or without de-acetylation of phenolic groups; and 3) recyclization reaction of chromones under hydrazine actions (Scheme 1). Initial Hoesch reaction of substituted polyphenols and arylacetonitriles in boron trifluoride etherate with passing of anhydrous HCl led to formation of A-ring polyhydroxylated deoxybenzoins I2–1 – I2–5 and I2–9 – I2–1254. Alternative condensation of pyrrogallol or 4-flouroresorcinol with phenylacetic acids in boron trifluoride etherate at heating was performed for the synthesis of 4’-hydroxy- or 4’-cyano deoxybenzoins I2–6 – I2–855. Ring-closure reaction with Vilsmeier reagent or trifluoroacetic anhydride in pyridine after workup with water afford 2-unsubstituted or 2-trifloromethyl isoflavones. Synthesis of 2-methyl isoflavones I3–1, I3–2, I3–8, and I3–19 was performed by reaction of polyhydroxydeoxybenzoins with acetic anhydride in presence of potassium acetate with the following deacylation in ethanol without purification of intermediate acetates. Target pyrazoles 11–30 were synthesized by the reaction of synthesized 2 (un)substituted isoflavones I3–1 – I3–20 with hydrazine hydrate in ethanol under reflux.
Analysis of GS activity from cell lysates
HEK293-PTG cells were generated by transfecting HEK293 cells56 with the plasmid pCDH-FLAG-PTG, harboring the mouse PTG coding region and the hygromycin antibiotic resistance gene utilizing Lipofectamine following manufacturer specifications. Mixed clones were selected for ~10 days in the presence of 0.2 mg/mL hygromycin, expanded and stored in liquid N2. Analyses of protein expression, GS activity ratio in the absence and presence of saturating concentrations of UDPG (4.4 mM) and of G6P (7.2 mM) and glycogen levels indicated that the protein was expressed, the GS activity ratio was increased 7-fold, from 0.02 in control cells to 0.15 in transfected cells, and that glycogen was increased by 90-fold. Quantitation of the expression of PTG is difficult because the basal levels are very low, undetectable under our conditions.
For lysate preparation the HEK293-PTG cells were cultured in 100 mm plate with 5.5 mM αMEM, 10% FBS, 6 μg/mL penicillin, 10 μg/mL streptomycin, and 0.2 mg/ml hygromycin. Rat-1 cells were cultured in 100 mm plate with 25 mM DMEM, 10% FBS, 6 μg/mL penicillin and 10 μg/mL streptomycin. Cells were grown for 3–4 days till confluency. Before harvest, cells were washed twice with 5 mL ice-cold GS buffer (50 mM Tris-HCl pH 7.8, 20 mM EDTA, 25 mM KF). Then 400 μL GS homogenization buffer (50 mM Tris-HCl pH 7.8, 10 mM EDTA, 2 mM EGTA, 100 mM NaF) with protease inhibitor (0.1 mM TLCK, 10 μg/ml leupeptin, 1 mM benzamidine, 0.5 mM PMSF, 1 mM Na3VO4) and β-mercaptoethanol (0.4%) plus Triton × 100 (0.2%) were added to each 100 mm plate. Plates were frozen on liquid N2 and scraped. Then lysates were transferred to 2 ml Eppendorf tube, sonicated for 15 seconds twice on ice, and placed on nutator for 10 minutes at 4 °C. Protein concentrations were measured using the Bradford reagent and indicated that the protein concentration was the same in both lysates. GS activity was initially measured with varying concentration of the lysates. For monitoring the effect of small-molecules on GS, HEK293-PTG cell lysates were diluted 10-fold while Rat-1 cell lysates were diluted 2-fold in homogenization buffer to achieve steady-state kinetics under the conditions we used in 14C-glucose incorporation assay33. GS activity in cell lysates was measured in 50 mM Tris-HCl buffer at pH 7.8 with 6.7 mg/ml glycogen, and subsaturating concentrations of UDPG (0.2 mM) and G6P (1 mM) in the absence or presence of 100 μM H23 and its analogs. All assays including the controls contained 2% (v/v) DMSO.
Generation of yGsy2p Y513L mutant
To characterize the binding pattern of compound 23, active site mutation Y513L was made without necessarily compensating enzyme activity. Point mutation of Y513L was performed using QuikChange II Site-Directed Mutagenesis Kit (Agilent Technologies) in the pET-28A harboring the yeast Gsy2p cDNA49 using forward primer 5′-CTACGAGCCTTGGGGTCTCACACCTGCAGAATGTAC-3′ and its complement primer, and was confirmed by DNA sequencing. The mutant protein was purified exactly the same way as was yGsy2p. However, the yield was significantly less compared to WT protein. Additionally, the activity of Y513L mutant is around 10-fold lower than WT enzyme. Kinetics experiments with Y513 mutant were performed under saturating G6P concentration (7.2 mM).
Supplementary Material
ACKNOWLEDGEMENTS
We would like to thank the staff at the Structural Biology Center Beamline 19-ID. Results shown in this report were derived from work performed at Argonne National Laboratory, Structural Biology Center at the Advanced Photon Source. Argonne is operated by UChicago Argonne, LLC, for the U.S. Department of Energy, Office of Biological and Environmental Research under contract DE-AC02-06CH11357. This research used resources of the Advanced Photon Source, a U.S. Department of Energy (DOE) Office of Science User Facility operated for the DOE Office of Science by Argonne National Laboratory under Contract DE-AC02-06CH11357. We also thank Dr. Lifan Zeng and Ms. Erica Woodall in the Chemical Genomics Core Facility for assistance with LC/MS. We also specifically thank Dr. Steven M. Johnson for his valuable discussions and recommendations.
Funding Sources
The work at IUPUI was supported by NIH grants R01-DK079887 (TDH), R01-DK27221 (PJR) and P01-NS056454 (Project 3, PJR). BT was supported by the DeVault Fellowship of the Indiana University Diabetes and Obesity Program. The work at UK was supported by the Organic Synthesis Core under NIH P01 NS097197 (to M. Gentry), NIH P30 CA177558 (to L. Hersh), the Office of the Dean of the College of Medicine, the Center for Pharmaceutical Research and Innovation in the College of Pharmacy, and NIH UL1 TR000117 from the National Institutes of Health for University of Kentucky’s Center for Clinical and Translational Science.
Conflict of Interest
Thomas D. Hurley holds significant financial equity in SAJE Pharma, LLC and Maze Therapeutics. Peter J. Roach and Anna A. DePaoli-Roach hold equities with Maze Therapeutics. However, none of the work described in this study is based on or supported by either company. David S. Watt has partial ownership in a private venture, Epionc, Inc., to develop small-molecule inhibitors for cancer treatment. In accord with University of Kentucky policies, David S. Watt has disclosed this work to the University of Kentucky’s Intellectual Property Committee and complied with stipulations of the University’s Conflict of Interest Oversight Committee.
ABBREVIATIONS USED
- GSD
glycogen storage disorder
- GS
glycogen synthase
- yGsy2
yeast glycogen synthase 2
- hGYS1
human glycogen synthase 1
- SAR
structure-activity relationship
- GlcN6P
glucosamine-6-phosphate
- G6P
glucose-6-phosphate
- PTG
protein-targeting-to-glycogen
- HTS
high-throughput screening
- UDPG
Uridine diphosphate glucose
- FP
fluorescence polarization
Footnotes
The authors declare no competing interests.
Supporting Information
Supplemental Figures S1-S3; Supplemental Tables S1-S2; Vendor Supplied Compound Purity; LC/MS and NMR Confirmation of Author Provided Compound Purity (PDF) Molecular Formula Strings (CSV)
Accession Code
The structure-factors and derived atomic coordinates for the complex between H23 and yeast Gsy2p have been deposited with the RCSB under the code 6U77. Authors will release the atomic coordinates and experimental data upon article publication.
Publisher's Disclaimer: “Just Accepted” manuscripts have been peer-reviewed and accepted for publication. They are posted online prior to technical editing, formatting for publication and author proofing. The American Chemical Society provides “Just Accepted” as a service to the research community to expedite the dissemination of scientific material as soon as possible after acceptance. “Just Accepted” manuscripts appear in full in PDF format accompanied by an HTML abstract. “Just Accepted” manuscripts have been fully peer reviewed, but should not be considered the official version of record. They are citable by the Digital Object Identifier (DOI®). “Just Accepted” is an optional service offered to authors. Therefore, the “Just Accepted” Web site may not include all articles that will be published in the journal. After a manuscript is technically edited and formatted, it will be removed from the “Just Accepted” Web site and published as an ASAP article. Note that technical editing may introduce minor changes to the manuscript text and/or graphics which could affect content, and all legal disclaimers and ethical guidelines that apply to the journal pertain. ACS cannot be held responsible for errors or consequences arising from the use of information contained in these “Just Accepted” manuscripts.
REFERENCES
- 1.Roach PJ Glycogen and its metabolism. Curr. Mol. Med. 2002, 2, 101–120. [DOI] [PubMed] [Google Scholar]
- 2.Roach PJ; Depaoli-Roach AA; Hurley TD; Tagliabracci VS Glycogen and its metabolism: some new developments and old themes. Biochem. J. 2012, 441, 763–787. [DOI] [PMC free article] [PubMed] [Google Scholar]
- 3.Melendez R; Melendez-Hevia E; Canela EI The fractal structure of glycogen: a clever solution to optimize cell metabolism. Biophys. J. 1999, 77, 1327–1332. [DOI] [PMC free article] [PubMed] [Google Scholar]
- 4.Prats C; Graham TE; Shearer J The dynamic life of the glycogen granule. J. Biol. Chem. 2018, 293, 7089–7098. [DOI] [PMC free article] [PubMed] [Google Scholar]
- 5.Skurat AV; Peng HL; Chang HY; Cannon JF; Roach PJ Rate-determining steps in the biosynthesis of glycogen in COS cells. Arch. Biochem. Biophys. 1996, 328, 283–288. [DOI] [PubMed] [Google Scholar]
- 6.Browner MF; Nakano K; Bang AG; Fletterick RJ Human muscle glycogen synthase cDNA sequence: a negatively charged protein with an asymmetric charge distribution. Proc. Natl. Acad. Sci. U. S. A. 1989, 86, 1443–1447. [DOI] [PMC free article] [PubMed] [Google Scholar]
- 7.Nuttall FQ; Gannon MC; Bai G; Lee EY Primary structure of human liver glycogen synthase deduced by cDNA cloning. Arch. Biochem. Biophys. 1994, 311, 443–449. [DOI] [PubMed] [Google Scholar]
- 8.Jensen J; Rustad PI; Kolnes AJ; Lai YC The role of skeletal muscle glycogen breakdown for regulation of insulin sensitivity by exercise. Front. Physiol. 2011, 2, 112. [DOI] [PMC free article] [PubMed] [Google Scholar]
- 9.Farkas I; Hardy TA; Goebl MG; Roach PJ Two glycogen synthase isoforms in Saccharomyces cerevisiae are coded by distinct genes that are differentially controlled. J. Biol. Chem. 1991, 266, 15602–15607. [PubMed] [Google Scholar]
- 10.Baskaran S; Roach PJ; DePaoli-Roach AA; Hurley TD Structural basis for glucose-6-phosphate activation of glycogen synthase. Proc. Natl. Acad. Sci. U. S. A. 2010, 107, 17563–17568. [DOI] [PMC free article] [PubMed] [Google Scholar]
- 11.Mahalingan KK; Baskaran S; DePaoli-Roach AA; Roach PJ; Hurley TD Redox switch for the inhibited state of yeast glycogen synthase mimics regulation by phosphorylation. Biochemistry 2017, 56, 179–188. [DOI] [PMC free article] [PubMed] [Google Scholar]
- 12.Bouskila M; Hunter RW; Ibrahim AF; Delattre L; Peggie M; Van Diepen JA; Voshol PJ; Jensen J; Sakamoto K Allosteric regulation of glycogen synthase controls glycogen synthesis in muscle. Cell Metab. 2010, 12, 456–466. [DOI] [PubMed] [Google Scholar]
- 13.Printen JA; Brady MJ; Saltiel AR PTG, a protein phosphatase 1-binding protein with a role in glycogen metabolism. Science 1997, 275, 1475–1478. [DOI] [PubMed] [Google Scholar]
- 14.Buschiazzo A; Ugalde JE; Guerin ME; Shepard W; Ugalde RA; Alzari PM Crystal structure of glycogen synthase: homologous enzymes catalyze glycogen synthesis and degradation. EMBO J. 2004, 23, 3196–3205. [DOI] [PMC free article] [PubMed] [Google Scholar]
- 15.Wolfsdorf JI; Weinstein DA Glycogen storage diseases. Rev. Endocr. Metab. Disord. 2003, 4, 95–102. [DOI] [PubMed] [Google Scholar]
- 16.Brereton MF; Rohm M; Shimomura K; Holland C; Tornovsky-Babeay S; Dadon D; Iberl M; Chibalina MV; Lee S; Glaser B; Dor Y; Rorsman P; Clark A; Ashcroft FM Hyperglycaemia induces metabolic dysfunction and glycogen accumulation in pancreatic β-cells. Nat. Commun. 2016, 7, 13496. [DOI] [PMC free article] [PubMed] [Google Scholar]
- 17.Ashcroft FM; Rohm M; Clark A; Brereton MF Is type 2 diabetes a glycogen storage disease of pancreatic β cells? Cell Metab. 2017, 26, 17–23. [DOI] [PMC free article] [PubMed] [Google Scholar]
- 18.Hicks J; Wartchow E; Mierau G Glycogen storage diseases: a brief review and update on clinical features, genetic abnormalities, pathologic features, and treatment. Ultrastruct. Pathol. 2011, 35, 183–196. [DOI] [PubMed] [Google Scholar]
- 19.Kishnani PS; Steiner RD; Bali D; Berger K; Byrne BJ; Case LE; Crowley JF; Downs S; Howell RR; Kravitz RM; Mackey J; Marsden D; Martins AM; Millington DS; Nicolino M; O’Grady G; Patterson MC; Rapoport DM; Slonim A; Spencer CT; Tifft CJ; Watson MS Pompe disease diagnosis and management guideline. Genet. Med. 2006, 8, 267–288. [DOI] [PMC free article] [PubMed] [Google Scholar]
- 20.Sentner CP; Hoogeveen IJ; Weinstein DA; Santer R; Murphy E; McKiernan PJ; Steuerwald U; Beauchamp NJ; Taybert J; Laforet P; Petit FM; Hubert A; Labrune P; Smit GPA; Derks TGJ Glycogen storage disease type III: diagnosis, genotype, management, clinical course and outcome. J. Inherit. Metab. Dis. 2016, 39, 697–704. [DOI] [PMC free article] [PubMed] [Google Scholar]
- 21.Ferguson IT; Mahon M; Cumming WJ An adult case of andersen’s disease--type IV glycogenosis: a clinical, histochemical, ultrastructural and biochemical study. J. Neurol. Sci. 1983, 60, 337–351. [DOI] [PubMed] [Google Scholar]
- 22.Ortolano S; Vieitez I; Agis-Balboa RC; Spuch C Loss of GABAergic cortical neurons underlies the neuropathology of Lafora disease. Mol. Brain 2014, 7, 7. [DOI] [PMC free article] [PubMed] [Google Scholar]
- 23.Gentry MS; Guinovart JJ; Minassian BA; Roach PJ; Serratosa JM Lafora disease offers a unique window into neuronal glycogen metabolism. J. Biol. Chem. 2018, 293, 7117–7125. [DOI] [PMC free article] [PubMed] [Google Scholar]
- 24.Ganesh S; Puri R; Singh S; Mittal S; Dubey D Recent advances in the molecular basis of Lafora’s progressive myoclonus epilepsy. J. Hum. Genet. 2006, 51, 1–8. [DOI] [PubMed] [Google Scholar]
- 25.Roach PJ Glycogen phosphorylation and Lafora disease. Mol. Aspects Med. 2015, 46, 78–84. [DOI] [PMC free article] [PubMed] [Google Scholar]
- 26.Vilchez D; Ros S; Cifuentes D; Pujadas L; Valles J; Garcia-Fojeda B; CriadoGarcia O; Fernandez-Sanchez E; Medrano-Fernandez I; Dominguez J; Garcia-Rocha M; Soriano E; Rodriguez de Cordoba S; Guinovart JJ Mechanism suppressing glycogen synthesis in neurons and its demise in progressive myoclonus epilepsy. Nat. Neurosci. 2007, 10, 1407–1413. [DOI] [PubMed] [Google Scholar]
- 27.Duran J; Gruart A; Garcia-Rocha M; Delgado-Garcia JM; Guinovart JJ Glycogen accumulation underlies neurodegeneration and autophagy impairment in Lafora disease. Hum. Mol. Genet. 2014, 23, 3147–3156. [DOI] [PubMed] [Google Scholar]
- 28.Turnbull J; DePaoli-Roach AA; Zhao X; Cortez MA; Pencea N; Tiberia E; Piliguian M; Roach PJ; Wang P; Ackerley CA; Minassian BA PTG depletion removes Lafora bodies and rescues the fatal epilepsy of Lafora disease. PLoS Genet. 2011, 7, e1002037. [DOI] [PMC free article] [PubMed] [Google Scholar]
- 29.Pederson BA; Turnbull J; Epp JR; Weaver SA; Zhao X; Pencea N; Roach PJ; Frankland PW; Ackerley CA; Minassian BA Inhibiting glycogen synthesis prevents Lafora disease in a mouse model. Ann. Neurol. 2013, 74, 297–300. [DOI] [PMC free article] [PubMed] [Google Scholar]
- 30.Turnbull J; Epp JR; Goldsmith D; Zhao X; Pencea N; Wang P; Frankland PW; Ackerley CA; Minassian BA PTG protein depletion rescues malin-deficient Lafora disease in mouse. Ann. Neurol. 2014, 75, 442–446. [DOI] [PubMed] [Google Scholar]
- 31.Ashe KM; Taylor KM; Chu Q; Meyers E; Ellis A; Jingozyan V; Klinger K; Finn PF; Cooper CG; Chuang WL; Marshall J; McPherson JM; Mattaliano RJ; Cheng SH; Scheule RK; Moreland RJ Inhibition of glycogen biosynthesis via mTORC1 suppression as an adjunct therapy for Pompe disease. Mol. Genet. Metab. 2010, 100, 309–315. [DOI] [PubMed] [Google Scholar]
- 32.Pursell N; Gierut J; Zhou W; Dills M; Diwanji R; Gjorgjieva M; Saxena U; Yang JS; Shah A; Venkat N; Storr R; Kim B; Wang W; Abrams M; Raffin M; Mithieux G; Rajas F; Dudek H; Brown BD; Lai C Inhibition of glycogen synthase II with RNAi prevents liver injury in mouse models of glycogen storage diseases. Mol. Ther. 2018, 26, 1771–1782. [DOI] [PMC free article] [PubMed] [Google Scholar]
- 33.Thomas JA; Schlender KK; Larner J A rapid filter paper assay for UDPglucose-glycogen glucosyltransferase, including an improved biosynthesis of UDP-14C-glucose. Anal. Biochem. 1968, 25, 486–499. [DOI] [PubMed] [Google Scholar]
- 34.Lea WA; Simeonov A Fluorescence polarization assays in small molecule screening. Expert Opin. Drug Discov. 2011, 6, 17–32. [DOI] [PMC free article] [PubMed] [Google Scholar]
- 35.Brady MJ; Kartha PM; Aysola AA; Saltiel AR The role of glucose metabolites in the activation and translocation of glycogen synthase by insulin in 3T3-L1 adipocytes. J. Biol. Chem. 1999, 274, 27497–27504. [DOI] [PubMed] [Google Scholar]
- 36.Zhang JH; Chung TD; Oldenburg KR A simple statistical parameter for use in evaluation and validation of high throughput screening assays. J. Biomol. Screening 1999, 4, 67–73. [DOI] [PubMed] [Google Scholar]
- 37.Roach RJ; Larner J Covalent phosphorylation in the regulation glycogen synthase activity. Mol. Cell Biochem. 1977, 15, 179–200. [DOI] [PubMed] [Google Scholar]
- 38.Khanna M; Imasaki T; Chikwana VM; Perez-Miller S; Hunter GO; Mosley A; Takagi Y; Hurley TD Expression and purification of functional human glycogen synthase-1 (hGYS1) in insect cells. Protein Expr. Purif. 2013, 90, 78–83. [DOI] [PMC free article] [PubMed] [Google Scholar]
- 39.Zeqiraj E; Tang X; Hunter RW; Garcia-Rocha M; Judd A; Deak M; von Wilamowitz-Moellendorff A; Kurinov I; Guinovart JJ; Tyers M; Sakamoto K; Sicheri F Structural basis for the recruitment of glycogen synthase by glycogenin. Proc. Natl. Acad. Sci. U. S. A. 2014, 111, E2831–2840. [DOI] [PMC free article] [PubMed] [Google Scholar]
- 40.Chikwana VM; Khanna M; Baskaran S; Tagliabracci VS; Contreras CJ; DePaoli-Roach A; Roach PJ; Hurley TD Structural basis for 2’-phosphate incorporation into glycogen by glycogen synthase. Proc. Natl. Acad. Sci. U. S. A. 2013, 110, 20976–20981. [DOI] [PMC free article] [PubMed] [Google Scholar]
- 41.Berman HK; O’Doherty RM; Anderson P; Newgard CB Overexpression of protein targeting to glycogen (PTG) in rat hepatocytes causes profound activation of glycogen synthesis independent of normal hormone- and substrate-mediated regulatory mechanisms. J. Biol. Chem. 1998, 273, 26421–26425. [DOI] [PubMed] [Google Scholar]
- 42.Greenberg CC; Meredith KN; Yan L; Brady MJ Protein targeting to glycogen overexpression results in the specific enhancement of glycogen storage in 3T3-L1 adipocytes. J. Biol. Chem. 2003, 278, 30835–30842. [DOI] [PubMed] [Google Scholar]
- 43.Crook ED; Daniels MC; Smith TM; McClain DA Regulation of insulin-stimulated glycogen synthase activity by overexpression of glutamine: fructose-6-phosphate amidotransferase in rat-1 fibroblasts. Diabetes 1993, 42, 1289–1296. [DOI] [PubMed] [Google Scholar]
- 44.Skurat AV; Dietrich AD; Roach PJ Glycogen synthase sensitivity to insulin and glucose-6-phosphate is mediated by both NH2- and COOH-terminal phosphorylation sites. Diabetes 2000, 49, 1096–1100. [DOI] [PubMed] [Google Scholar]
- 45.Brewer MK; Uittenbogaard A; Austin GL; Segvich DM; DePaoli-Roach A; Roach PJ; McCarthy JJ; Simmons ZR; Brandon JA; Zhou Z; Zeller J; Young LEA; Sun RC; Pauly JR; Aziz NM; Hodges BL; McKnight TR; Armstrong DD; Gentry MS Targeting pathogenic Lafora bodies in Lafora disease using an antibody-enzyme fusion. Cell Metab. 2019, 30, 689–705. [DOI] [PMC free article] [PubMed] [Google Scholar]
- 46.Otto M; Breinholt J; Westergaard N Metformin inhibits glycogen synthesis and gluconeogenesis in cultured rat hepatocytes. Diabetes Obes. Metab. 2003, 5, 189–194. [DOI] [PubMed] [Google Scholar]
- 47.Berthier A; Paya M; Garcia-Cabrero AM; Ballester MI; Heredia M; Serratosa JM; Sanchez MP; Sanz P Pharmacological interventions to ameliorate neuropathological symptoms in a mouse model of Lafora disease. Mol. Neurobiol. 2016, 53, 1296–1309. [DOI] [PMC free article] [PubMed] [Google Scholar]
- 48.Roach PJ; Takeda Y; Larner J Rabbit skeletal muscle glycogen synthase. I. relationship between phosphorylation state and kinetic properties. J. Biol. Chem. 1976, 251, 1913–1919. [PubMed] [Google Scholar]
- 49.Pederson BA; Cheng C; Wilson WA; Roach PJ Regulation of glycogen synthase identification of residues involved in regulation by the allosteric ligand glucose-6-P and by phosphorylation. J. Biol. Chem. 2000, 275, 27753–27761. [DOI] [PubMed] [Google Scholar]
- 50.Kollberg G; Tulinius M; Gilljam T; Ostman-Smith I; Forsander G; Jotorp P; Oldfors A; Holme E Cardiomyopathy and exercise intolerance in muscle glycogen storage disease 0. N. Engl. J. Med. 2007, 357, 1507–1514. [DOI] [PubMed] [Google Scholar]
- 51.Orho M; Bosshard NU; Buist NR; Gitzelmann R; Aynsley-Green A; Blumel P; Gannon MC; Nuttall FQ; Groop LC Mutations in the liver glycogen synthase gene in children with hypoglycemia due to glycogen storage disease type 0. J. Clin. Invest. 1998, 102, 507–515. [DOI] [PMC free article] [PubMed] [Google Scholar]
- 52.Pederson BA; Chen H; Schroeder JM; Shou W; DePaoli-Roach AA; Roach PJ Abnormal cardiac development in the absence of heart glycogen. Mol. Cell Biol. 2004, 24, 7179–7187. [DOI] [PMC free article] [PubMed] [Google Scholar]
- 53.Irimia JM; Meyer CM; Peper CL; Zhai L; Bock CB; Previs SF; McGuinness OP; DePaoli-Roach A; Roach PJ Impaired glucose tolerance and predisposition to the fasted state in liver glycogen synthase knock-out mice. J. Biol. Chem. 2010, 285, 12851–12861. [DOI] [PMC free article] [PubMed] [Google Scholar]
- 54.Otsalyuk VM; Tkachuk TM; Bondarenko SP; Chkhalo VV; Khilya VP Synthetic analogs of xanthocercin. Chem. Nat. Compd. 1998, 34, 284–288. [Google Scholar]
- 55.Wahala K; Hase TA Expedient synthesis of polyhydroxyisoflavones. J. Chem. Soc., Perkin Trans 1 1991, 3005–3008. [Google Scholar]
- 56.Graham FL; Smiley J; Russell WC; Nairn R Characteristics of a human cell line transformed by DNA from human adenovirus type 5. J. Gen. Virol. 1977, 36, 59–74. [DOI] [PubMed] [Google Scholar]
Associated Data
This section collects any data citations, data availability statements, or supplementary materials included in this article.