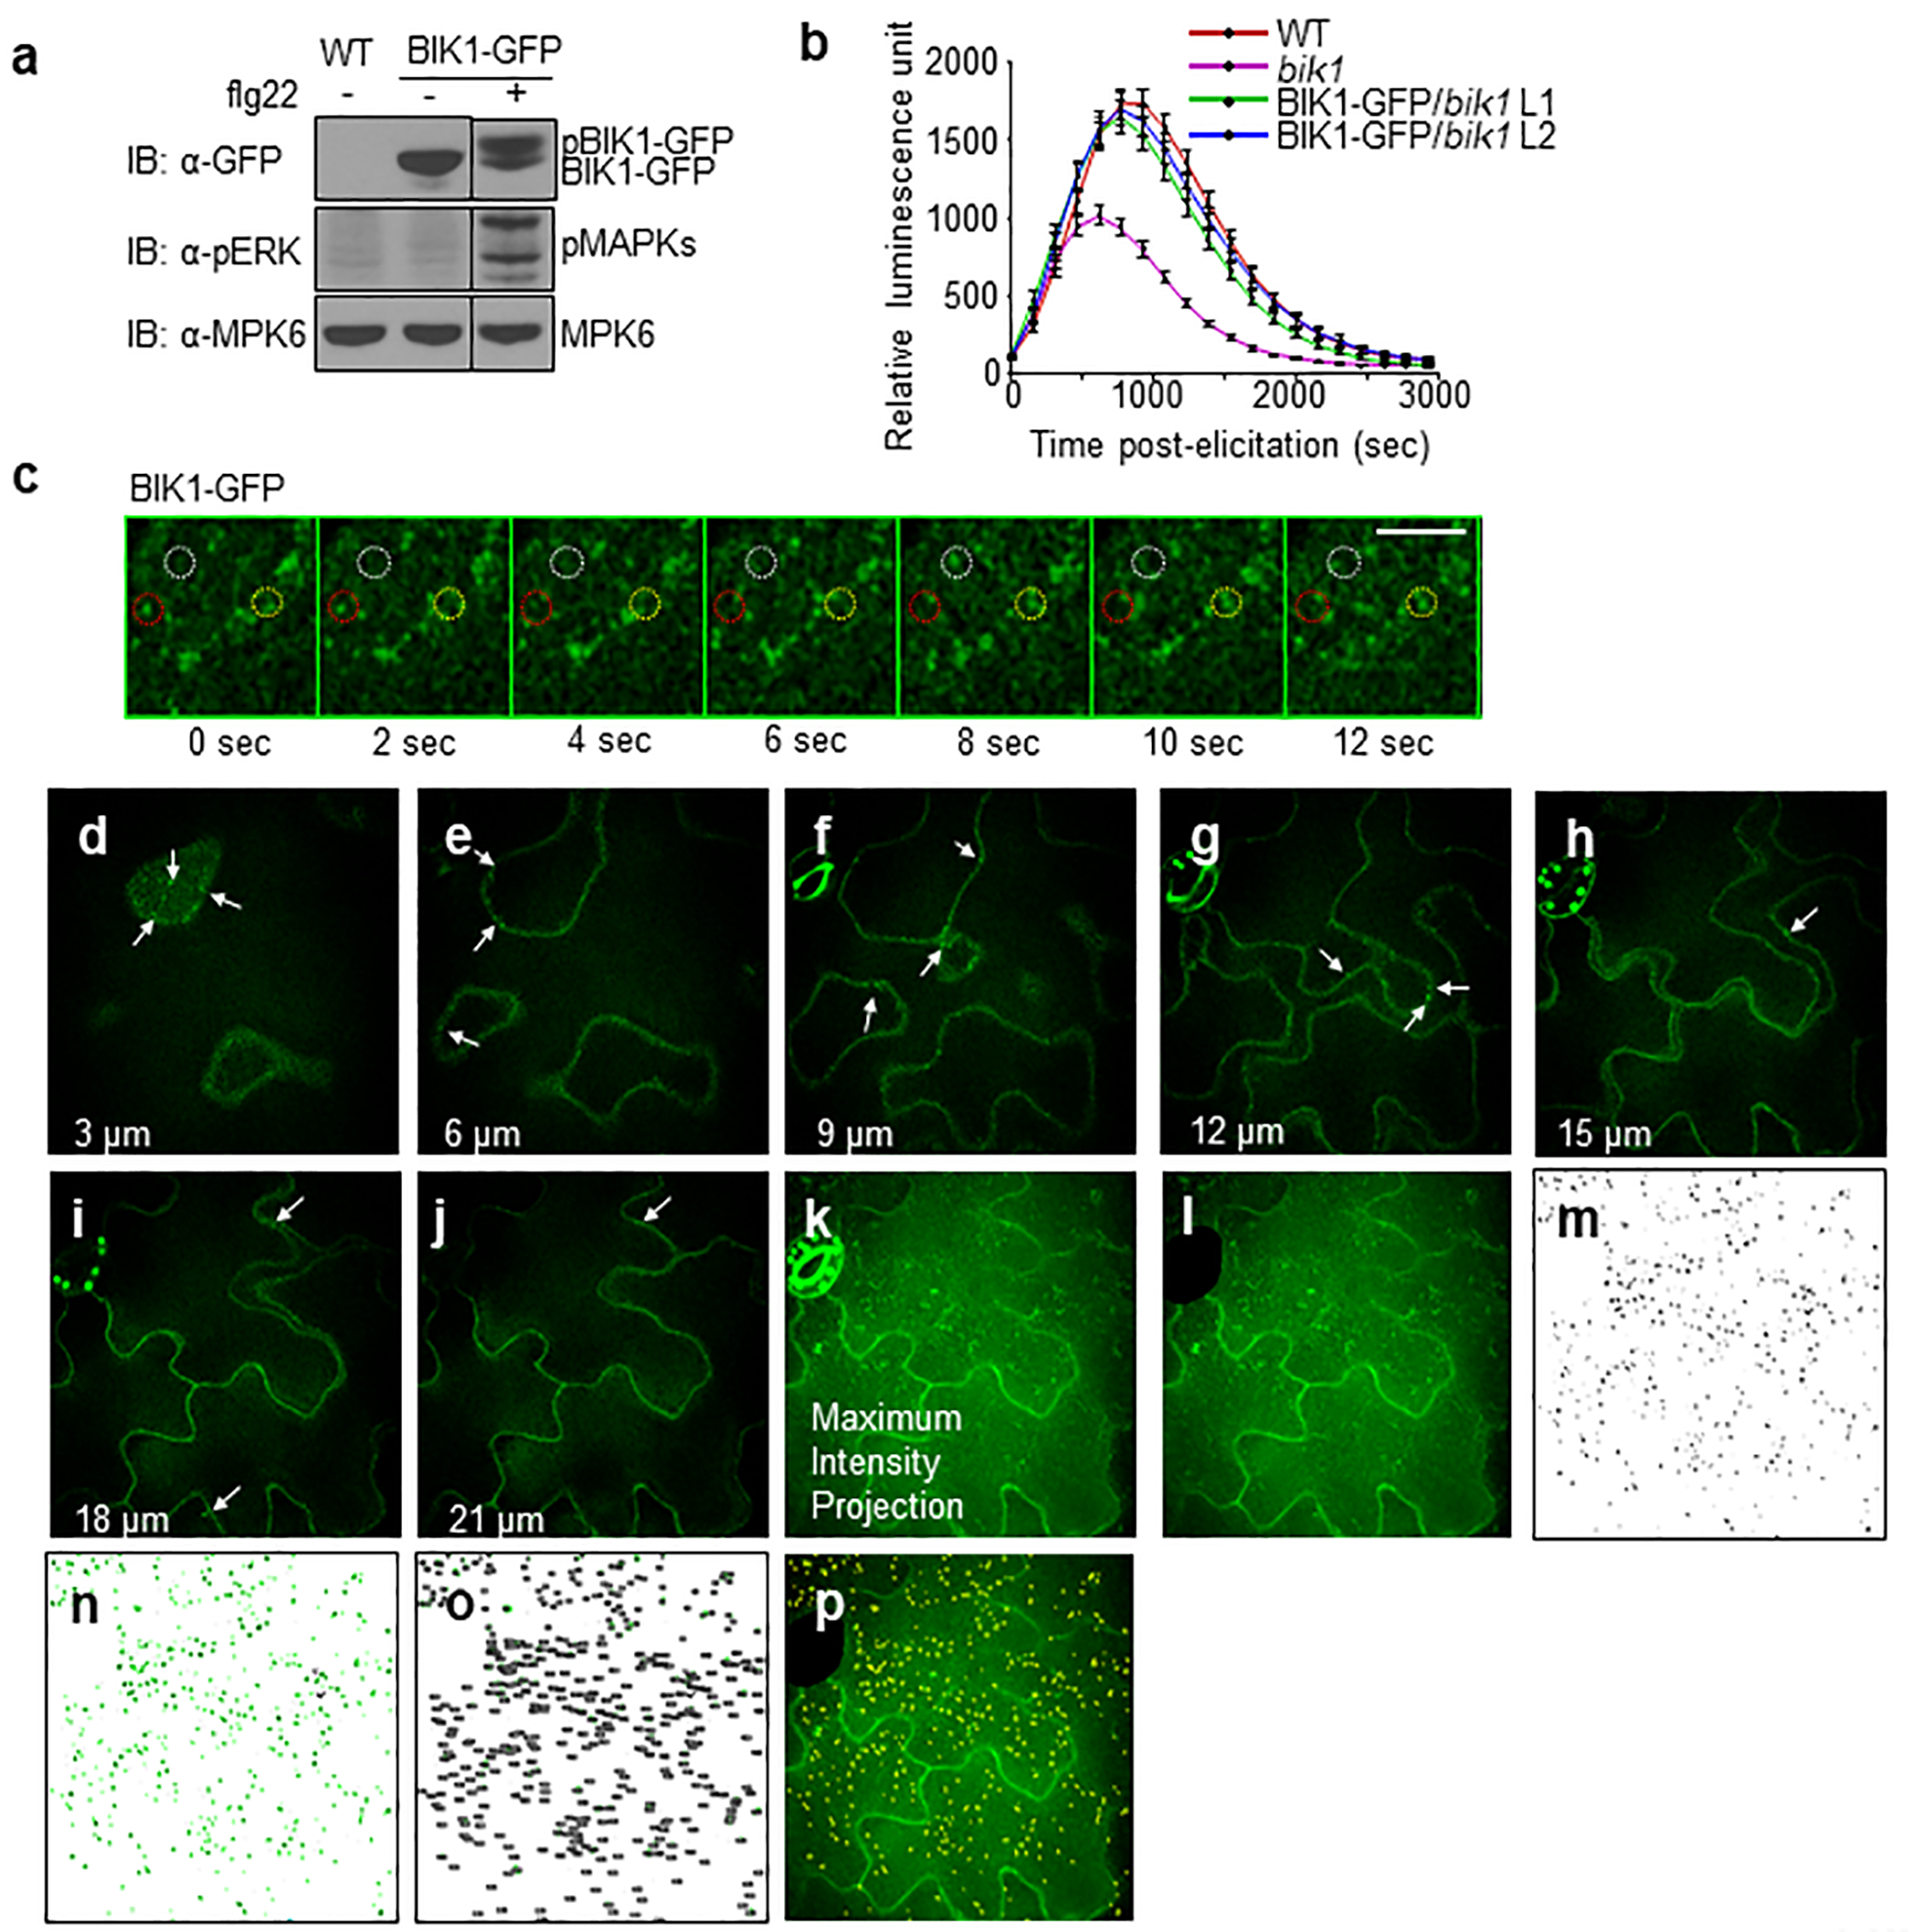
Extended Data Figure 1. BIK1-GFP is functional in plants and undergoes endocytosis.

a. BIK1-GFP is functional as confirmed by BIK1 phosphorylation in 35S::BIK1-GFP expressing Col-0 cotyledons after 1 μM flg22 treatment. MPK6 is a loading control and the black stippled line indicates discontinuous segments from the same gel. b. BIK1-GFP restored ROS production in bik1 upon flg22 treatment. Leaf discs from WT, bik1 and BIK1-GFP complementation (Line 1 and 2) were treated with 100 nM flg22 for ROS measurement using a luminometer over 50 min. Data are shown as means ± SEM (WT, bik1: n = 42; BIK1-GFP/bik1 n =45). c. Time-lapse SDCM shows that BIK1-GFP endosomal puncta are highly mobile with puncta that disappear (red circle), appear (yellow circle), and rapidly move in and out of the plane of view (white circle). Scale bar, 5 μm. d-k. BIK1-GFP localizes to endosomal puncta and PM in cross-sectional images of epidermal cells. The abaxial epidermal cells of cotyledons expressing BIK1-GFP were imaged with SDCM with a Z-step of 0.3 μm. A subset of the cross-sectional images is shown at the indicated depth (3, 6, 9, 12, 15, 18 and 21 μm) along with the maximum-intensity projection of all 67 images through epidermis. BIK1-GFP localizes to both PM and endosomal puncta (white arrows) within all sections. k-p. Quantification method for BIK1-GFP puncta within maximum-intensity projections of SDCM images. k. Maximum-intensity projections (MIP) were generated using Fiji distribution of ImageJ 1.51 (https://fiji.sc/) for each Z-series captured by SDCM imaging of BIK1-GFP cotyledons. l. Regions of MIP with non-pavement cells (e.g. stomata) are removed from the image using the Line Draw and Crop functions. The total surface area (μm2) of the image is measured using the Analyze Measure function. m. Puncta within the cropped MIP are recognized using a customized model generated and applied with the Trainable Weka Segmentation plug-in for Fiji. The same model is applied to all images to generate binary images showing the physical location of each BIK1-GFP puncta (black). n-o. Puncta within the size range of 0.1–2.5 μm2 are highlighted in green (n) and counted (o) using the Analyze Particles function in Fiji. BIK1-GFP endocytosis is quantified as the number of puncta per 1000 μm2. p. An overlay of the BIK1-GFP puncta (yellow highlight) over the cropped MIP confirms correct identification of puncta. The experiments in a-c were repeated three times with similar results.
