

Abstract
Background
Current COVID-19 radiological literature is dominated by CT and a detailed description of chest x-ray (CXR) appearances in relation to the disease time course is lacking.
Purpose
To describe the time course and severity of the CXR findings of COVID-19 and correlate these with real time reverse transcription polymerase chain reaction (RT-PCR) testing for SARS-Cov-2 nucleic acid.
Materials and Methods
Retrospective study of COVID-19 patients with RT-PCR confirmation and CXRs admitted across 4 hospitals evaluated between January and March 2020. Baseline and serial CXRs (total 255 CXRs) were reviewed along with RT-PCRs. Correlation with concurrent CTs (total 28 CTs) was made when available. Two radiologists scored each CXR in consensus for: consolidation, ground glass opacity (GGO), location and pleural fluid. A severity index was determined for each lung. The lung scores were summed to produce the final severity score.
Results
There were 64 patients (26 men, mean age 56±19 years). Of these, 58, 44 and 38 patients had positive initial RT-PCR (91%, [CI: 81-96%]), abnormal baseline CXR (69%, [CI: 56-80%]) and positive initial RT-PCR with abnormal baseline CXR (59 [CI:46-71%]) respectively. Six patients (9%) showed CXR abnormalities before eventually testing positive on RT-PCR. Sensitivity of initial RT-PCR (91% [95% CI: 83-97%]) was higher than baseline CXR (69% [95% CI: 56-80%]) (p = 0.009). Radiographic (mean 6 ± 5 days) and virologic recovery (mean 8 ± 6 days) were not significantly different (p= 0.33). Consolidation was the most common finding (30/64, 47%), followed by GGO (21/64, 33%). CXR abnormalities had a peripheral (26/64, 41%) and lower zone distribution (32/64, 50%) with bilateral involvement (32/64, 50%). Pleural effusion was uncommon (2/64, 3%). The severity of CXR findings peaked at 10-12 days from the date of symptom onset.
Conclusion
Chest x-ray findings in COVID-19 patients frequently showed bilateral lower zone consolidation which peaked at 10-12 days from symptom onset.
Summary
Chest x-ray abnormalities in COVID-19 mirror those of CT, demonstrating bilateral peripheral consolidation. Chest x-ray findings have a lower sensitivity than initial RT-PCR testing (69% versus 91%, respectively).
Key Results
■ In a cohort of patients with COVID-19 infection and imaging follow-up, baseline chest x-ray had a sensitivity of 69%, compared to 91% for initial RT-PCR.
■ Chest x-ray abnormalities preceded positive RT-PCR in 6/64 (9%) patients.
■ Common chest x-ray findings mirror those previously described for CT: bilateral, peripheral, consolidation and/or ground glass opacities.
Introduction
The recent COVID-19 radiological literature is primarily focused on CT findings5–10, which is more sensitive than chest x-ray (CXR). In mainland China, CT was often a first-line investigation for COVID-1911,12. However, this practice placed a huge burden on radiology departments and posed an immense challenge for infection control in the CT suite. Some hospitals in China dedicated specific CT scanners for examining suspected COVID-19 patients only13, a practice that is being instituted with difficulty in the United Kingdom14. The American College of Radiology notes that CT decontamination required after scanning COVID-19 patients may disrupt radiological service availability, and suggests that portable chest x-ray (CXR) may be considered to minimize the risk of cross-infection15. Italian and British hospitals are beginning to employ CXR as a first-line triage tool due to long reverse transcription polymerase chain reaction (RT-PCR) turnaround times14,16. Therefore, in some countries, CXR cannot be superseded by CT in the current pandemic. As the prevalence of COVID-19 increases, it is also imperative for clinicians of all specialties to recognize COVID-19 features on CXR that may be performed for other purposes.
To further our understanding of the radiographic features of COVID-19, our study aims to: (i) describe the chest x-ray appearances of COVID-19, (ii) correlate the chest x-ray appearances with reverse transcription polymerase chain reaction (RT-PCR), (iii) compare chest x-ray findings with CT findings, and (iv) describe the time course of chest x-ray appearances relative to symptom onset.
Materials & Methods
This retrospective study was approved by the Institutional Review Boards of the Hong Kong Hospital Authority Hong Kong West, Hong Kong East, and Kowloon Central Clusters. Written consent was waived.
Patients
A total of 64 patients from four tertiary and regional hospitals in Hong Kong (Queen Mary Hospital, Pamela Youde Nethersole Eastern Hospital, Queen Elizabeth Hospital, and Ruttonjee Hospital) were included from 1st January 2020 to 5th March 2020 (see figure 1). COVID-19 infection was confirmed by RT-PCR on nasopharyngeal swabs and throat swabs. Thirty-nine patients had serial RT-PCR results available at the time of writing. All patients had CXR upon admission, with follow-up CXRs available for all but one patient. Timing of symptom onset was obtained from public epidemiological data provided by the Hong Kong Center for Health Protection17. In the case of asymptomatic patients (9/64, 14%), date of first positive RT-PCR was substituted for symptom onset.
Figure 1:

Study flow chart
Image Acquisition & Analysis
All CXRs were acquired as computed or digital radiographs following usual local protocols. CXRs were acquired in the posteroanterior (PA) or anteroposterior (AP) projection. Follow-up CXRs were acquired in the AP projection using portable X-ray units. Over half of the CXRs at presentation were performed in the AP projection (36/64, 56%), with the rest in the PA projection. All follow-up CXRs were performed in the AP projection using portable X-ray units in the isolation wards.
Two radiologists (HYSL, thoracic radiologist with 15 years of experience; HYFW, general radiologist with 5 years of experience) reviewed all CXRs by consensus. Further review was undertaken by a third radiologist (MYN, thoracic radiologist with 8 years of experience) if there was disagreement. Radiographic features including consolidation, ground glass opacities (GGO), and pulmonary nodules were diagnosed according to the Fleischner Society glossary of terms18. Distribution of the lung changes was categorized into (i) peripheral predominance, perihilar predominance (peripheral and perihilar demarcation was defined as halfway between lateral edge of the lung and hilum), or neither; (ii) right, left, or bilateral lung involvement; and (iii) upper zone, lower zone (defined as upper/ lower halves) or no zonal predominance. Presence of pleural effusion was also recorded.
All CTs were acquired as non-contrast enhanced volumetric scans of the thorax at 1 to 1.25mm slice thickness following usual local protocols. HYSL and HYFW reviewed the CTs for presence or absence of consolidation and ground glass opacities.
Radiograph Scoring
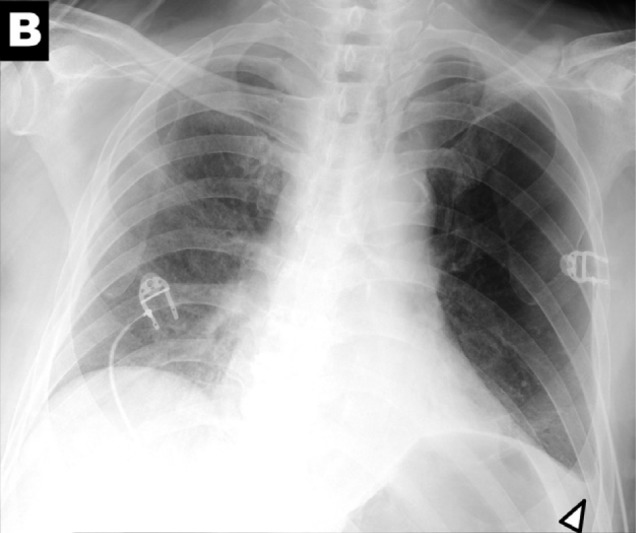
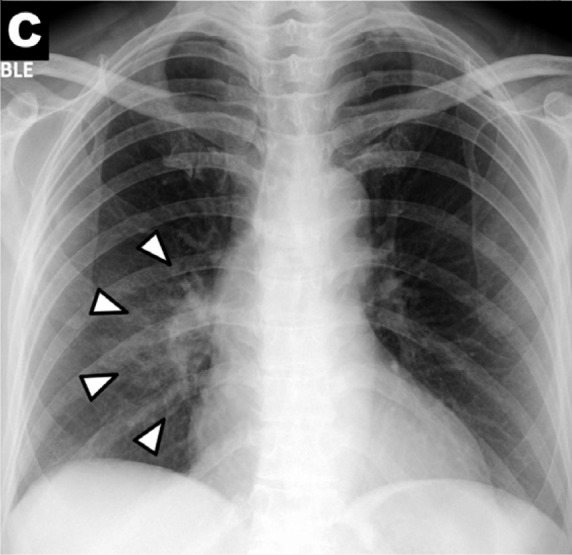
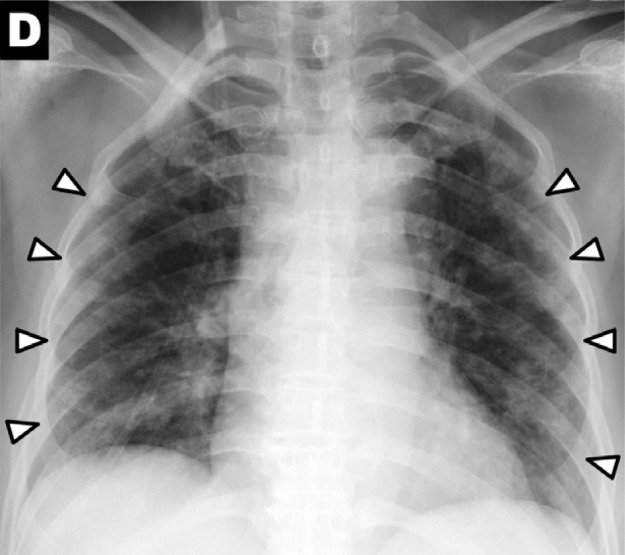
To quantify the extent of infection, a severity score was calculated by adapting and simplifying the Radiographic Assessment of Lung Edema (RALE) score proposed by Warren et al.19 A score of 0-4 was assigned to each lung depending on the extent of involvement by consolidation or GGO (0 = no involvement; 1 = <25%; 2 = 25-50%; 3 = 50-75%; 4 = >75% involvement). The scores for each lung were summed to produce the final severity score. Examples are given in Figure 2.
Figure 2a:
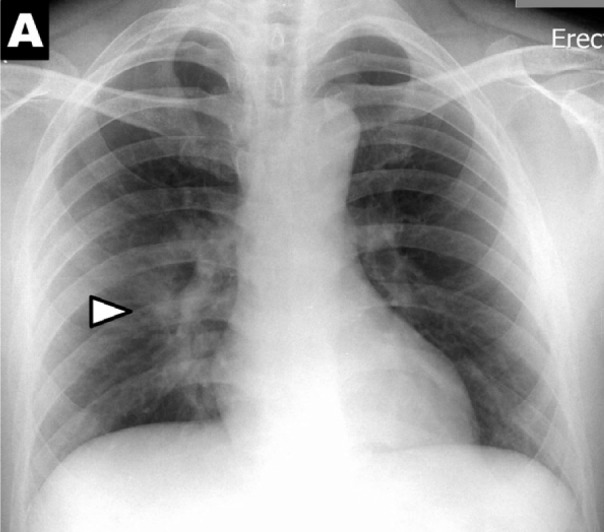
Chest x-ray scoring system. A score of 0-4 was assigned to each lung depending on the extent of involvement by consolidation or GGO (0 = no involvement; 1 = <25%; 2 = 25-50%; 3 = 50-75%; 4 = >75% involvement). The scores for each lung were summed to produce the final severity score. Examples of chest x-ray severity scoring in patients with COVD-19 (Days from symptom onset; R lung score + L lung score = total score): (A) Day 12; 1 + 0 = 1. (B) Day 5; 2 + 1 = 3. (C) Day 3; 1 + 3 = 4. (D) Day 10; 4 + 3 = 7.
Figure 2c:
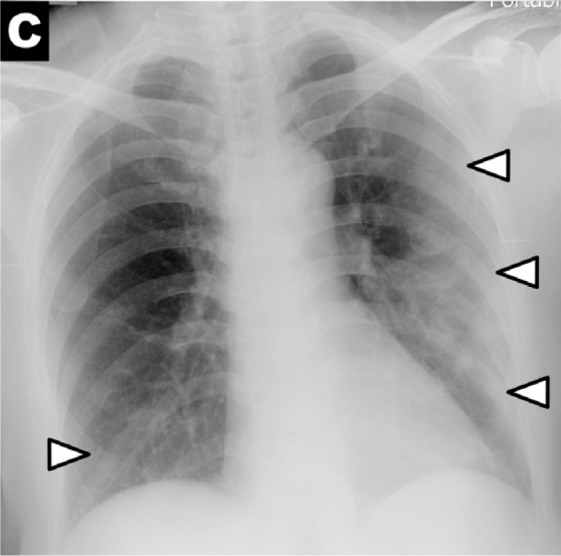
Chest x-ray scoring system. A score of 0-4 was assigned to each lung depending on the extent of involvement by consolidation or GGO (0 = no involvement; 1 = <25%; 2 = 25-50%; 3 = 50-75%; 4 = >75% involvement). The scores for each lung were summed to produce the final severity score. Examples of chest x-ray severity scoring in patients with COVD-19 (Days from symptom onset; R lung score + L lung score = total score): (A) Day 12; 1 + 0 = 1. (B) Day 5; 2 + 1 = 3. (C) Day 3; 1 + 3 = 4. (D) Day 10; 4 + 3 = 7.
Figure 2d:
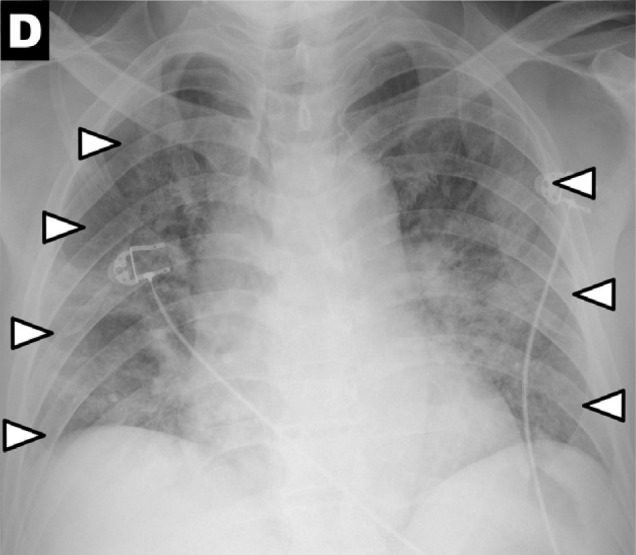
Chest x-ray scoring system. A score of 0-4 was assigned to each lung depending on the extent of involvement by consolidation or GGO (0 = no involvement; 1 = <25%; 2 = 25-50%; 3 = 50-75%; 4 = >75% involvement). The scores for each lung were summed to produce the final severity score. Examples of chest x-ray severity scoring in patients with COVD-19 (Days from symptom onset; R lung score + L lung score = total score): (A) Day 12; 1 + 0 = 1. (B) Day 5; 2 + 1 = 3. (C) Day 3; 1 + 3 = 4. (D) Day 10; 4 + 3 = 7.
Real-time Reverse Transcription-Polymerase Chain Reaction (RT-PCR)
Apart from 10 patients who were tested and confirmed using standard Hong Kong Hospital Authority and Department of Health RT-PCR protocol for diagnosis, virologic monitoring was performed using using QuantiNova Probe RT-PCR Kit (QIAGEN, Hilden, Germany) targeting the RNA-dependent RNA polymerase (RdRp)/helicase (Hel) gene of SARS-CoV-2 until patient discharge. The technical methodology of the nucleic acid testing has been previously described 20.
Statistical Analysis
Statistical analysis was performed with IBM SPSS Statistics Subscription software (Build 1.0.0.1347; IBM, New York, USA). The difference between CXR severity scores at various time points during the disease course was analyzed by Kruskal-Wallis test. To evaluate the sensitivity of CXR, baseline CXR severity scores of >0 were interpreted as positive, which were then compared to initial RT-PCR results by McNemar Chi-squared test. Comparison of the baseline CXR severity score between initial positive and negative RT-PCR results was assessed by Mann-Whitney U test. Radiographic and virologic recovery (defined as reaching a CXR severity score of 0 and RT-PCR negative respectively) were compared using paired-sample ttest. Statistical significance was defined as p <0.05.
Results
Patient Characteristics
The clinical characteristics of the 64 patients on presentation are summarized in Table 1. There were 26 males (41%) and 38 females (59%), with a mean age of 56 years (range 16 to 96 years). Fever (59%) and cough (41%) were the most frequent symptoms. Nine patients (14%) were asymptomatic. The most common co-morbidities were hypertension (20%) and diabetes (13%).
Table 1:
Patient characteristics on presentation (n=64). Age is presented with mean age and standard deviation.

Chest x-ray Features
Fifty-one of 64 patients demonstrated abnormalities on CXRs at some point during their illness (Table 2, Figure 3). On baseline CXR, consolidation was the most common finding (30/64, 47%), followed by GGO (21/64, 33%). Peripheral (26/64, 41%) and lower zone distribution (32/64, 50%) were the more common locations, and most had bilateral involvement (32/64, 50%). Pleural effusion was found in 2 cases (3%).
Table 2:
Overall radiographic findings on chest x-ray (CXR) in 64 patients. Figures are presented as whole numbers with percentages in brackets.

Figure 3a:
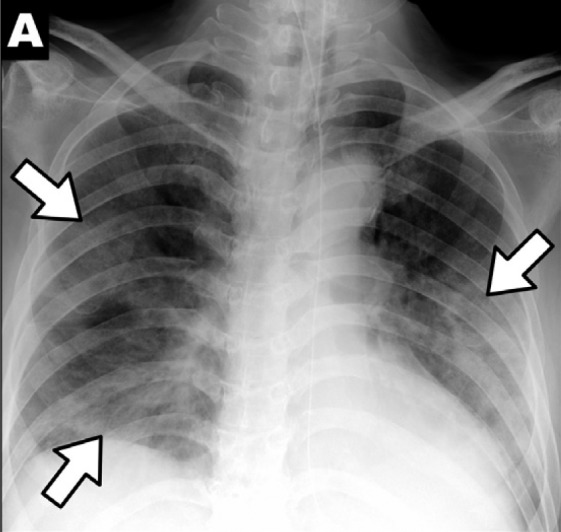
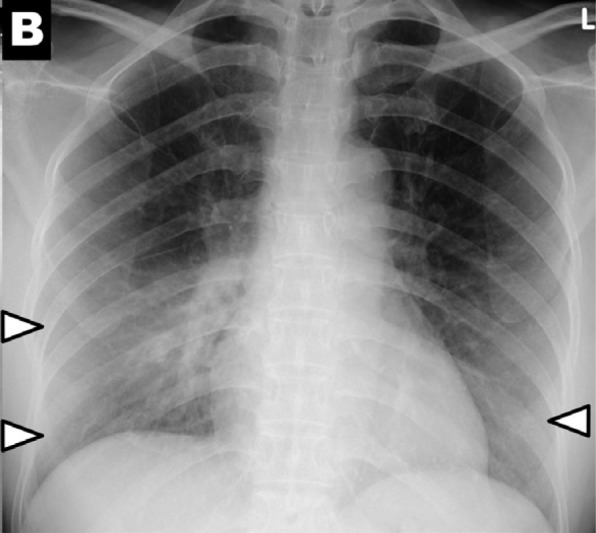
Chest x-ray findings in COVID-19: (A) patchy consolidations, (B) pleural effusion, (C) perihilar distribution, and (D) peripheral distribution.
Figure 3b:
Chest x-ray findings in COVID-19: (A) patchy consolidations, (B) pleural effusion, (C) perihilar distribution, and (D) peripheral distribution.
Figure 3c:
Chest x-ray findings in COVID-19: (A) patchy consolidations, (B) pleural effusion, (C) perihilar distribution, and (D) peripheral distribution.
Figure 3d:
Chest x-ray findings in COVID-19: (A) patchy consolidations, (B) pleural effusion, (C) perihilar distribution, and (D) peripheral distribution.
Baseline CXR fFindings.—All patients had baseline CXRs upon presentation. Twenty patients (31%) had normal baseline CXRs. Twenty-six patients (41%) had mild findings with total severity score of 1-2. More extensive involvement was seen in 13 (20%) and 5 (8%) patients, who had severity scores of 3-4 and 5-6 respectively. No patient had a severity score of >6 on their baseline CXR.
Time Course of Radiographic Changes on CXR.—The CXR severity scores from symptom onset are illustrated in Figure 4. The highest CXR severity score recorded was 8 (of maximum possible score of 8). CXR severity scores changed over time (Figure 4, p=0.01). Peak severity was reached at 10-12 days, at which the median CXR severity score was 3. Of the 20 patients who had normal baseline CXRs, 7 developed abnormalities on follow-up radiographs.
Figure 4:

Change in COVID-19 chest x-ray (CXR) severity score with duration since symptom onset. A score of 0-4 was assigned to each lung depending on the extent of involvement by consolidation or GGO (0 = no involvement; 1 = <25%; 2 = 25-50%; 3 = 50-75%; 4 = >75% involvement). The scores for each lung were summed to produce the final severity score. Kruskal-Wallis test (p=0.01) indicated a significant difference between the scores at different time points.
CXR Correlation with RT-PCR
Each patient underwent a median of 3 (IQR: 1-4, range 1-15) RT-PCR tests. On presentation, 60 out of 64 patients (94%) had both baseline CXRs and initial RT-PCR testing performed within the first 24 hours, while 4 out of 64 patients (6%) had CXR and RT-PCR performed within 48 hours. The CXR severity scores at baseline showed no significant difference between patients with positive or negative PCR at initial testing (p=0.62) (Figure 5). Of the 58 (91%) patients who tested positive on initial RT-PCR, 38 (59%) had abnormalities on baseline CXR. Six patients (9%) were negative on initial RT-PCR, but demonstrated abnormalities on baseline CXR, two of which are shown in Figures 2a & 2b. Of these six patients, 5 subsequently tested positive after 24 hours, and 1 tested positive after 48 hours.
Figure 5:

Baseline chest x-ray (CXR) severity scores between COVID-19 patients with initially positive (n=58) and negative RT-PCR (n=6) for SARS-2COV nucleic acid. There was no statistical difference (p = 0.62).
Figure 2b:
Chest x-ray scoring system. A score of 0-4 was assigned to each lung depending on the extent of involvement by consolidation or GGO (0 = no involvement; 1 = <25%; 2 = 25-50%; 3 = 50-75%; 4 = >75% involvement). The scores for each lung were summed to produce the final severity score. Examples of chest x-ray severity scoring in patients with COVD-19 (Days from symptom onset; R lung score + L lung score = total score): (A) Day 12; 1 + 0 = 1. (B) Day 5; 2 + 1 = 3. (C) Day 3; 1 + 3 = 4. (D) Day 10; 4 + 3 = 7.
Using RT-PCR results as gold standard, the observed detection rate of baseline RT-PCR was 58/64, 91% sensitivity [95% CI: 83-97%]), which was higher than baseline CXR (44/64, 69% sensitivity [95% CI: 56-80%]) (p=0.009).
Twenty-three patients had follow-up virologic recovery; 18 patients had follow up to chest xray recovery. The mean time from initial positive RT-PCR to negative RT-PCR was 8±7 days (n=23, range 1-24 days). The mean time from initial positive CXR to negative CXR was 6±5 days (n=18, range 1-18 days). Five patients never exhibited radiographic abnormalities and were not included in the radiographic recovery group. There was no statistically significant difference in the recovery time for RT-PCR and CXR recovery groups (p=0.33).
Chest x-ray correlation with CT
Twenty-eight of 64 patients (44%) in our cohort had CT performed within 48 hours of a CXR at a mean of 11±7 days (range 0-26 days) after symptom onset. Twenty-four of 28 patients had CXR severity scores >0, all of whom had positive findings on CT. Four patients had negative CXRs, of whom 3 had negative CTs as well, while 1 demonstrated ground glass opacities on CT (Figure 6).
Figure 6a:
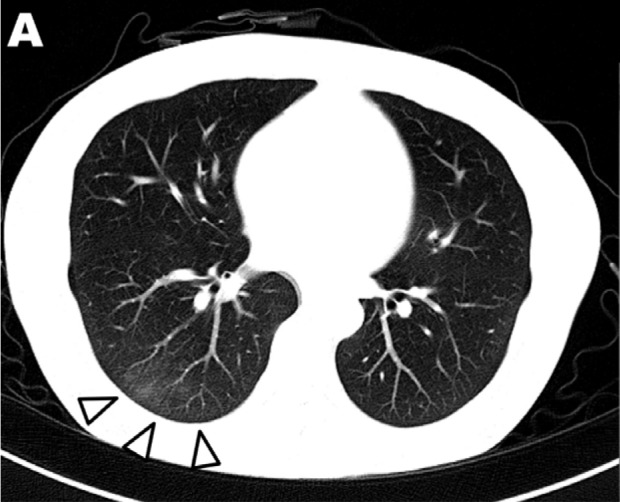
Ground glass opacities seen on computed tomography in a patient with COVID-19 (Image A) but not visible on CXR (Image B). Abbreviations RT-PCR – reverse transcriptase polymerase chain reaction, GGO- ground glass opacity
Figure 6b:
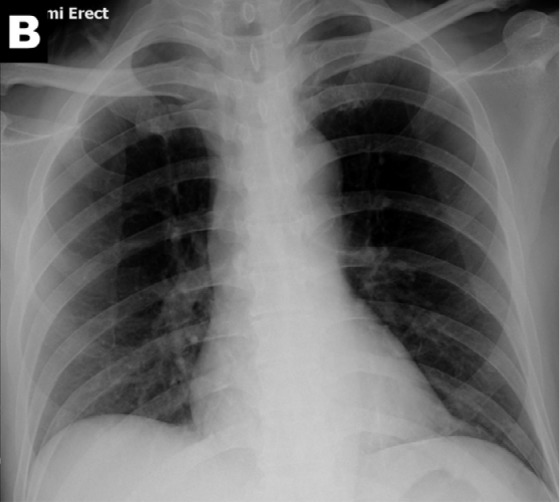
Ground glass opacities seen on computed tomography in a patient with COVID-19 (Image A) but not visible on CXR (Image B).
Discussion
The main feature of consolidation on chest x-ray in COVID-19 pneumonia is consistent with previously published case series9,21. Of the 58 (58/64, 91%) patients who tested positive on initial RT-PCR, 38 (38/64, 59%) had abnormalities on baseline chest x-ray (CXR). Forty patients had abnormal baseline CXR. Six patients showed CXR abnormalities before eventually testing positive on RT-PCR. Sensitivity of initial RT-PCR (91% [95% CI: 83-97%]) was higher than that of baseline CXR (69% [95% CI: 56-80%]) (p = 0.009). Radiographic (mean 6 ± 5 days) and virologic recovery (mean 8 ± 7 days) were not significantly different (p= 0.33). Consolidation was the most common finding (30/64, 47%), followed by GGO (21/64, 33%). These had a peripheral (26/64, 41%) and lower zone distribution (32/64, 50%) with bilateral involvement (32/64, 50%). Pleural effusion was not common (2/64, 3%). The severity of CXR findings peaked at 10-12 days from the date of symptom onset.
We demonstrated that the common CT findings of bilateral involvement, peripheral distribution, and lower zone dominance5,9,10,22 can also be appreciated on CXR. Peak CXR severity score at 10-12 days after symptom onset is commensurate with previous findings on CT, where peak severity was reported at 6-11 days8,23. The proportion of patients in our study exhibiting abnormal radiographic findings (51/64, 80%) is higher than that in the case series of 9 patients published by Yoon et al.21 (5/9, 56%). Furthermore, CXR abnormalities were detectable in 6 patients whose initial RT-PCR was negative (6/64, 9%). Baseline CXR sensitivity was 69% [95% CI: 56-80%]. Albeit lower than the reported 97-98% sensitivity of CT6,24, our results suggest that CXR can play a role in the initial screening of COVID-19. Although further studies are needed, in the scenario where there is high clinical suspicion of COVID-19 it is conceivable that a positive CXR may obviate the need for a CT, thus reducing burden on CT units in this pandemic.
In our patient subgroup with both CXR and CT available (n=28), all positive CXRs were also positive on CT, and only 1 patient (1/4, 25%) had a falsely negative CXR when compared to CT. A major caveat is that during the study period, our institutions did not routinely perform CT for all COVID-19 patients. CT was performed later in the disease course (11 days on average) than CXR. CT was reserved for patients with clinical deterioration or poor response to treatment. Thus, the CT group in our study was likely skewed towards patients with more severe radiological manifestations.
The role of CXR in clinical monitoring is less clear. In our subgroups that were followed to both virologic (n=23) and radiographic (n=18) recovery, there was no statistically significant difference in their mean durations to recovery. For comparison, in a subgroup analysis of 57 cases by Ai et al., 42% of patients showed improvement on CT prior to RT-PCR becoming negative, with the rest either showing progression on CT, or only showing improvement after RT-PCR normalization6. With the situation further confounded by reports of COVID-19 patients testing positive on RT-PCR again after discharge25,26, our opinion is that imaging should be used as an adjunct to clinical parameters in monitoring of disease course, until further evidence is available.
Our study has several limitations. First, not all patients were followed to their final outcome, thus correlation with disease course is truncated for some patients. The intervals between serial CXRs and RT-PCR testing were dictated by clinical need and not uniform, thus potentially affecting the precision of our analysis. Third, some of the radiographic features were subtle, which may limit reproducibility in suboptimal viewing conditions or by non-specialists. Fourth, there is a lack of a non-COVID-19 control group and CT was only available for a subgroup, thus limiting evaluation of the sensitivity and specificity of CXR. In summary, we describe the features of COVID-19 on CXR, to complement the publications on CT. Baseline CXR had a sensitivity of 69% in our cohort. As the COVID-19 pandemic threatens to overwhelm healthcare systems worldwide, CXR may be considered as a tool for identifying COVID-19, but is less sensitive than CT.
Acknowledgments
Acknowledgements
We would like to thank the Hong Kong doctors that have dedicated their time and efforts to treat COVID-19 patients and protect the health of Hong Kong’s citizens during this time.
Footnotes
Abbreviations:
- RT-PCR
- reverse transcriptase polymerase chain reaction
- GGO
- ground glass opacity
References
- 1.Zhu N, Zhang D, Wang W, et al. A Novel Coronavirus from Patients with Pneumonia in China, 2019. N Engl J Med. January 2020. doi:10.1056/nejmoa2001017. [DOI] [PMC free article] [PubMed] [Google Scholar]
- 2.Huang C, Wang Y, Li X, et al. Clinical features of patients infected with 2019 novel coronavirus in Wuhan, China. Lancet. 2020;395(10223):497-506. doi:10.1016/S0140-6736(20)30183-5. [DOI] [PMC free article] [PubMed] [Google Scholar]
- 3.World Health Organization . Coronavirus Disease 2019 (COVID-19) Situation Report - 51.; 2020. [Google Scholar]
- 4.World Health Organization . Coronavirus Disease 2019 (COVID-19) Situation Report - 62.; 2020. [Google Scholar]
- 5.Zhou S, Wang Y, Zhu T, Xia L. CT Features of Coronavirus Disease 2019 (COVID-19) Pneumonia in 62 Patients in Wuhan, China. Am J Roentgenol. March 2020:1–8. doi:10.2214/AJR.20.22975. [DOI] [PubMed] [Google Scholar]
- 6.Ai T, Yang Z, Hou H, et al. Correlation of Chest CT and RT-PCR Testing in Coronavirus Disease 2019 (COVID-19) in China: A Report of 1014 Cases. Radiology. February 2020:200642. doi:10.1148/radiol.2020200642. [DOI] [PMC free article] [PubMed] [Google Scholar]
- 7.Bernheim A, Mei X, Huang M, et al. Chest CT Findings in Coronavirus Disease-19 (COVID-19): Relationship to Duration of Infection. Radiology. February 2020:200463. doi:10.1148/radiol.2020200463. [DOI] [PMC free article] [PubMed] [Google Scholar]
- 8.Pan F, Ye T, Sun P, et al. Time Course of Lung Changes On Chest CT During Recovery From 2019 Novel Coronavirus (COVID-19) Pneumonia. Radiology. February 2020:200370. doi:10.1148/radiol.2020200370. [DOI] [PMC free article] [PubMed] [Google Scholar]
- 9.Ng M-Y, Lee EY, Yang J, et al. Imaging Profile of the COVID-19 Infection: Radiologic Findings and Literature Review. Radiol Cardiothorac Imaging. 2020;2(1):e200034. doi:10.1148/ryct.2020200034. [DOI] [PMC free article] [PubMed] [Google Scholar]
- 10.Chung M, Bernheim A, Mei X, et al. CT Imaging Features of 2019 Novel Coronavirus (2019-nCoV). Radiology. February 2020:200230. doi:10.1148/radiol.2020200230. [DOI] [PMC free article] [PubMed] [Google Scholar]
- 11.Chinese Society of Radiology . Chinese Society of Radiology. Radiological diagnosis of new coronavirus infected pneumonitis: Expert recommendation from the Chinese Society of Radiology (First edition). Chin J Radiol. 2020;54(00):E001-E001. doi:10.3760/cma.j.issn.1005-1201.2020.0001. [Google Scholar]
- 12.Zu ZY, Di Jiang M, Xu PP, et al. Coronavirus Disease 2019 (COVID-19): A Perspective from China. Radiology. February 2020:200490. doi:10.1148/radiol.2020200490. [DOI] [PMC free article] [PubMed] [Google Scholar]
- 13.Zhang H-W, Yu J, Xu H-J, et al. Corona Virus International Public Health Emergencies: Implications for Radiology Management. Acad Radiol. February 2020. doi:10.1016/j.acra.2020.02.003. [DOI] [PMC free article] [PubMed] [Google Scholar]
- 14.Lessons from the frontline of the covid-19 outbreak - The BMJ. https://blogs.bmj.com/bmj/2020/03/20/lessons-from-the-frontline-of-the-covid-19-outbreak/?utm_campaign=shareaholic&utm_medium=twitter&utm_source=socialnetwork. Accessed March 22, 2020. [Google Scholar]
- 15.ACR Recommendations for the use of Chest Radiography and Computed Tomography (CT) for Suspected COVID-19 Infection | American College of Radiology. https://www.acr.org/Advocacy-and-Economics/ACR-Position- Statements/Recommendations-for-Chest-Radiography-and-CT-for-Suspected-COVID19-Infection. Accessed March 22, 2020.
- 16.Imaging the coronavirus disease COVID-19. https://healthcare-ineurope.com/en/news/imaging-the-coronavirus-disease-covid-19.html. Accessed March 23, 2020.
- 17.Hong Kong SAR Government Centre for Health . Latest Situation of Cases of COVID-19.; 2020. https://www.chp.gov.hk/files/pdf/local_situation_covid19_en.pdf. [Google Scholar]
- 18.Hansell DM, Bankier AA, MacMahon H, McLoud TC, Müller NL, Remy J. Fleischner Society: Glossary of terms for thoracic imaging. Radiology. 2008;246(3):697-722. doi:10.1148/radiol.2462070712. [DOI] [PubMed] [Google Scholar]
- 19.Warren MA, Zhao Z, Koyama T, et al. Severity scoring of lung oedema on the chest radiograph is associated with clinical outcomes in ARDS. Thorax. 2018;73(9):840-846. doi:10.1136/thoraxjnl-2017-211280. [DOI] [PMC free article] [PubMed] [Google Scholar]
- 20.Chan JF-W, Yip CC-Y, To KK-W, et al. Improved molecular diagnosis of COVID-19 by the novel, highly sensitive and specific COVID-19-RdRp/Hel real-time reverse transcription-polymerase chain reaction assay validated in vitro and with clinical specimens. J Clin Microbiol. March 2020:JCM.00310-20. doi:10.1128/JCM.00310-20. [DOI] [PMC free article] [PubMed] [Google Scholar]
- 21.Yoon SH, Lee KH, Kim JY, et al. Chest Radiographic and CT Findings of the 2019 Novel Coronavirus Disease (COVID-19): Analysis of Nine Patients Treated in Korea. Korean J Radiol. 2020;21(PG-10.3348/kjr.2020.0132):10.3348/kjr.2020.0132. doi:10.3348/kjr.2020.0132. [DOI] [PMC free article] [PubMed]
- 22.Salehi S, Abedi A, Balakrishnan S, Gholamrezanezhad A. Coronavirus Disease 2019 (COVID-19): A Systematic Review of Imaging Findings in 919 Patients. Am J Roentgenol. March 2020:1–7. doi:10.2214/AJR.20.23034. [DOI] [PubMed] [Google Scholar]
- 23.Wang Y, Dong C, Hu Y, et al. Temporal Changes of CT Findings in 90 Patients with COVID-19 Pneumonia: A Longitudinal Study. Radiology. March 2020:200843. doi:10.1148/radiol.2020200843. [DOI] [PMC free article] [PubMed] [Google Scholar]
- 24.Fang Y, Zhang H, Xie J, et al. Sensitivity of Chest CT for COVID-19: Comparison to RTPCR. Radiology. February 2020:200432. doi:10.1148/radiol.2020200432. [DOI] [PMC free article] [PubMed] [Google Scholar]
- 25.Wang X, Xu H, Jiang H, et al. Follow-Up Study of 131 COVID-19 Discharged Patients: Is the Current Chinese Discharge Criteria Reliable? March 2020. https://ssrn.com/abstract=3551342. Accessed March 21, 2020.
- 26.Xing Y, Mo P, Xiao Y, Zhao O, Zhang Y, Wang F. Post-discharge surveillance and positive virus detection in two medical staff recovered from coronavirus disease 2019 (COVID-19), China, January to February 2020. Eurosurveillance. 2020;25(10):2000191. doi:10.2807/1560-7917.ES.2020.25.10.2000191. [DOI] [PMC free article] [PubMed] [Google Scholar]