Abstract
Background
Recent studies have suggested that chest computed tomography (CT) scans could be used as a primary screening or diagnostic tool for coronavirus disease 2019 (COVID-19) in epidemic areas.
Purpose
To perform a meta-analysis to evaluate diagnostic performance measures, including predictive values, of chest CT and initial reverse transcriptase-polymerase chain reaction (RT-PCR).
Materials and Methods
MEDLINE and Embase were searched from January 1, 2020 to April 3, 2020 for studies on COVID-19 that reported the sensitivity and/or specificity of CT scans and/or RT-PCR assays. The pooled sensitivity and specificity were estimated by using random-effects models. The actual prevalence (i.e., the proportion of confirmed patients among those tested) in eight countries was obtained from web sources, and the predictive values were calculated. Meta-regression was performed to reveal the effect of potential explanatory factors on the diagnostic performance measures.
Results
The pooled sensitivity was 94% (95% CI: 91%, 96%; I2=95%) for chest CT and 89% (95% CI: 81%, 94%; I2=90%) for RT-PCR. The pooled specificity was 37% (95% CI: 26%, 50%; I2=83%) for chest CT. The prevalence of COVID-19 outside China ranged from 1.0% to 22.9%. For chest CT scans, the positive predictive value (PPV) ranged from 1.5% to 30.7%, and the negative predictive value (NPV) ranged from 95.4% to 99.8%. For RT-PCR,the PPV ranged from 47.3% to 96.4%, while the NPV ranged from 96.8% to 99.9%. The sensitivity of CT was affected by the distribution of disease severity, the proportion of patients with comorbidities, and the proportion of asymptomatic patients (all p < 0.05). The sensitivity of RT-PCR was negatively associated with the proportion of elderly patients (p = 0.01).
Conclusion
Outside of China where there is a low-prevalence of COVID-19 (1-22.9%), chest CT screening of patients with suspected disease had low positive predictive value (1.5-30.7%).
Summary
Chest computed tomography scans for the primary screening or diagnosis of coronavirus disease 2019 would not be beneficial in a low-prevalence region due to the substantial rate of false-positives.
Key Results
■ The pooled sensitivity and specificity were 94% (95% CI: 91%, 96%) and 37% (95% CI: 26%, 50%), respectively, for chest CT. The pooled sensitivity of reverse transcriptase-polymerase chain reaction (RT-PCR) was 89% (95% CI: 81%, 94%).
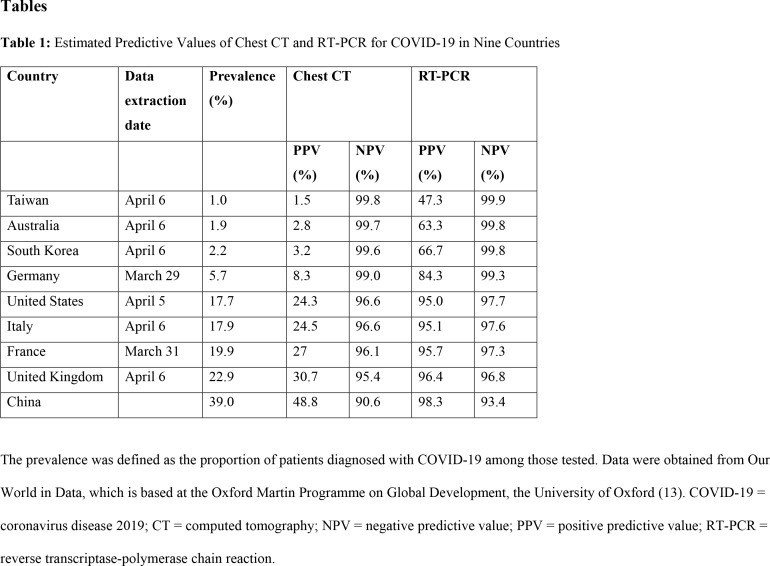
■ In low-prevalence (<10%) countries, the positive predictive value of RT-PCR (range: 47.3%, 84.3%) was more than ten times higher than that of CT scans (range: 1.5%, 8.3%). The negative predictive value of both methods ranged from 99.0% to 99.9%.
Introduction
The outbreak of coronavirus disease 2019 (COVID-19) began in Wuhan, China, in December 2019, and rapidly spread to neighboring Asian and Western countries. On January 30, 2020, the World Health Organization (WHO) declared COVID-19 a public health emergency of international concern (1), and on March 12, the WHO declared COVID-19 to be a pandemic (2). As of April 8, a total of 1,282,931 infected patients were reported globally, with 72,774 deaths, and COVID-19 cases had been reported in 211 countries or areas (2).
Given the shortage of reverse transcriptase-polymerase chain reaction (RT-PCR) testing kits for severe acute respiratory syndrome coronavirus 2 (SARS-CoV-2), the pathogen causing COVID-19, recent studies have suggested that chest computed tomography (CT) scans could be used as a primary screening or diagnostic tool in epidemic areas (3-5). Ai et al. (3) reported that chest CT had a high sensitivity (97%; 95% CI: 95%, 98%) for detecting COVID-19. In addition, a manufacturing defect in the earliest test kits in the United States raised the expectation that chest CT would become a major modality for COVID-19 screening or diagnosis (6).
Nevertheless, the low specificity of chest CT is due to the nonspecific findings of COVID-19 that overlap with those of other viral pneumonias, raising concerns regarding clinical utility of CT for COVID-19 screening (3, 7). If CT has low positive predictive value (PPV), screenees would receive unnecessary radiation exposure. In addition, the large volume of workload for hospital staff and difficulties with disinfection procedures are non-negligible issues related to the widespread use of CT as a diagnostic tool for COVID-19. Recently, the Society of Thoracic Radiology and American Society of Emergency Radiology jointly released a position statement according to which routine CT screening is not recommended for the diagnosis of patients under investigation for COVID-19 (8).
In this context, the diagnostic performance of chest CT scans for COVID-19 should be evaluated and carefully compared with RT-PCR in conjunction with the prevalence of the disease (9). The aim of this meta-analysis was to evaluate diagnostic performance measures, including predictive values, of chest CT and initial RT-PCR across a wide range of disease prevalence rates, simulating low- and high-prevalence regions.
Materials and Methods
This study was deemed exempt by the Seoul National University Hospital institutional review board, and informed consent was not necessary.
Search Strategy and Study Selection
This study followed the Preferred Reporting Items for Systematic Reviews and Meta analyses (PRISMA) reporting guidelines. Given the urgent need for evidence on diagnostic studies under the current conditions of the COVID-19 pandemic, we conducted this study without registration in a prospective registry. We initially searched MEDLINE and Embase from December 1, 2019 to March 16, 2020 for studies on COVID-19 that reported the diagnostic sensitivity and/or specificity of chest CT scans and/or RT-PCR assays. The search was updated as of April 3, 2020. Key words for the literature search included “coronavirus disease,” “novel coronavirus,” “2019-nCoV,” and “SARS-CoV-2.” The search strategy was designed by an experienced investigator (S.H.Y.) and conducted independently by two reviewers (H.K. and S.H.Y.). The search was further supplemented by screening the bibliographies of the retrieved articles and reviewing the COVID-19 materials related to RT-PCR that were provided by the WHO.
Eligibility Criteria
The inclusion criteria were as follows: 1) study populations consisting of at least five patients with COVID-19, 2) studies in which RT-PCR assays served as the reference standard, and 3) studies in which diagnostic performance measures (i.e., sensitivity and/or specificity) of initial RT-PCR and/or CT were extractable. The exclusion criteria were: 1) studies on pregnant women and neonates, 2) case reports or series with fewer than five patients, 3) lack of extractable data for a two-by-two contingency table, 4) studies which reported solely the specificity of RT-PCR, 5) non-accessible full-text versions, 6) a study population completely overlapping with that of other studies, 7) lack of a description for repeated RT-PCR assays as the reference standard for studies on the sensitivity of initial RT-PCR, and 8) studies on RTPCR with per-sample basis analysis, in which the results of initial RT-PCR were not separated.
Data Extraction
Two authors (H.K. and S.H.Y.) independently extracted the following data from each study: (a) patient characteristics (number of patients, mean or median age, the proportion of elderly patients [age > 65 years], men, asymptomatic patients, patients with comorbidities, and patients with severe to critical illness (10); (b) study characteristics (region of the study, disease prevalence [i.e., the proportion of the patients diagnosed with COVID-19 among those tested], and usage of the open reading frame (ORF) 1ab and N genes as targets of the RT-PCR assay (11), as initially recommended by the Chinese Center for Disease Control and Prevention); and (c) the results of each initial diagnostic test (true positive, false positive, true negative, and false negative) with reference to the results of RT-PCR assays. We did not extract the results of diagnostic tests from studies in which particular conditions (i.e., COVID-19 versus viral pneumonia other than COVID-19) were intentionally enriched in the study population for research purposes, as those studies would not adequately reflect real settings.
For the reference standard of chest CT, any positive results and all negative results from initial or repeated RT-PCR assays were regarded as disease positives and disease negatives, respectively. For RT-PCR, all analyzed studies had repeated RT-PCR assays as the reference standard according to the eligibility criteria. That is, any positive results from the repeated RT-PCR assays were regarded as disease positives. We extracted the results of RTPCR from clinical upper respiratory specimens (nasopharyngeal swab, throat swab, or sputum) within 14 days of symptom onset. When the literature provided a particular commercial name of an RT-PCR kit without target genes, we attempted to identify the genes by referring the company’s website and brochure of the kit. Disagreements between the two reviewers were resolved through consensus.
Data Analysis
The diagnostic sensitivity of chest CT and RT-PCR and specificity of chest CT were pooled separately using a random-effects model. The specificity of RT-PCR was not pooled as it should be 100% as the reference standard by definition (i.e., no false-positives). Since only five studies reported both sensitivity and specificity of chest CT and only one study reported the diagnostic performance measures of both chest CT and RT-PCR, a bivariate model and a hierarchical summary receiver operating characteristic curve could not be employed (12). The positive predictive value and negative predictive value (NPV) of each diagnostic test were estimated for a wide range of disease prevalence rates, ranging from 0.1% to 90%. In addition, the actual disease prevalence in eight countries (i.e., Taiwan, Australia, South Korea, Germany, United States, Italy, France, and United Kingdom) was obtained from web sources (13), and the predictive values for each country were calculated and plotted. The specificity of RT-PCR was assumed to be 99% for the calculation of predictive values.
Meta-regression was performed to reveal the effect of potential explanatory factors including the region of the study, the proportion of elderly patients, the distribution of disease severity, the proportion of patients with comorbidities, the proportion of asymptomatic patients, and the usage of ORF genes as RT-PCR targets. Studies without extractable data were excluded from the meta-regression analysis. In addition, sensitivity analysis was conducted for chest CT. The sensitivity of chest CT was pooled for the studies which explicitly specified the reference standard as repeated RT-PCR assays.
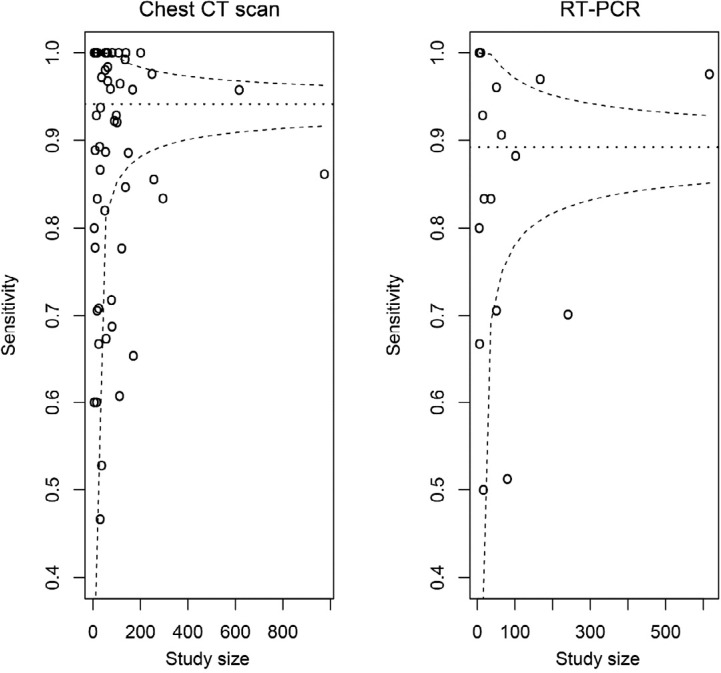
We used the I2 statistic to assess heterogeneity across the studies. The quality of the included publications was assessed using the Quality Assessment of Diagnostic Accuracy Studies (QUADAS)-2 tool. Publication bias was evaluated visually using funnel plots of sample size against sensitivity (14).
All p-values were based on two-sided tests. A p-value < 0.05 was considered to represent statistical significance. Statistical analyses were conducted using SAS® version 9.3 (SAS Institute, Cary, NC, USA) and R software version 3.6.1 (http://www.R-project.org).
Results
Study Selection
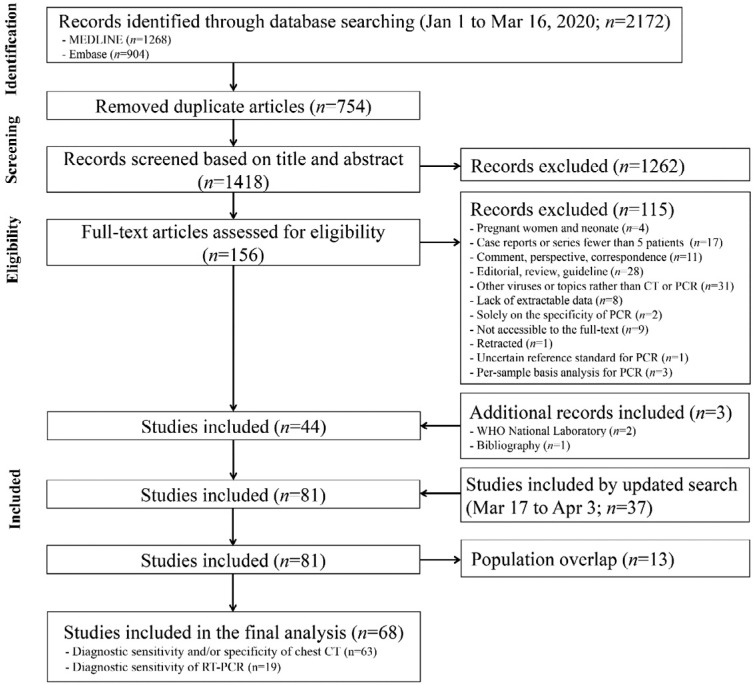
In total, 2172 studies published between January 1 and March 16 were identified by the electronic search strategy, and 1418 studies remained after duplicates were excluded. Through title and abstract review, 1262 publications were excluded. After a full-text review, 115 studies were further excluded for the following reasons: studies on pregnant women and neonates (n = 4), case reports or series with fewer than five patients (n = 17), non-full-text research articles (n = 39), not relevant to the topic of interest (n = 31), lack of extractable data (n = 8), studies solely on the specificity of RT-PCR (n = 2), full-text not accessible (n = 9), retracted article (n = 1), uncertain reference standard for RT-PCR (n = 1), and per-sample basis analysis for RT-PCR (n = 3). Three additional studies were found through the WHO National Laboratory (n = 2) and a bibliographic search (n = 1). Thirty-seven studies published between March 17 and April 3 were added after updated literature search, and 13 studies with a overlapped study population were excluded. Consequently, 68 articles satisfied the inclusion and exclusion criteria. Sixty-three of these studies reported diagnostic performance for chest CT and 19 studies did so for RT-PCR (Fig 1).
Figure 1:
PRISMA flow diagram of the study selection process. CT = computed tomography; PRISMA = Preferred Reporting Items for Systematic Reviews and Metaanalyses; T-PCR = reverse transcriptase-polymerase chain reaction; WHO = World Health Organization.
Study Characteristics
The 63 studies that investigated chest CT comprised 6218 patients (3-5, 15-74) and the 19 studies analyzing RT-PCR comprised 1502 patients (3-5, 16, 22, 30, 31, 44, 53, 55, 60, 66-68, 75-79). All 63 studies investigating CT scans reported the diagnostic sensitivity of CT for COVID-19 (3-5, 15-74), while five of them also reported its specificity (3, 39, 43, 47, 50). Thus, both sensitivity and specificity were analyzed for the same study population in those five studies. Twenty-one studies on the chest CT were performed with repeated RT-PCR assays as the reference standard (3-5, 16, 22, 28, 30, 31, 38, 39, 43, 44, 47, 53, 55, 60, 64, 66-68, 74). Fourteen studies reported the sensitivity of both chest CT scans and RT-PCR (3-5, 16, 22, 30, 31, 44, 53, 55, 60, 66-68).
The study population inclusion period ranged from December 2019 to March 2020. The mean or median age of patients ranged from 3 to 70 years. Twelve studies were from Wuhan, China (3, 23, 25, 26, 29, 36, 49, 51, 61, 71, 75, 77). Correlations were observed between disease severity and the proportion of patients with comorbidities (Spearman’s ρ = 0.53; p = 0.003) and between disease severity and the proportion of elderly patients (Spearman’s ρ = 0.52; p = 0.01). The characteristics of the included studies are outlined in Table E1 (online).
Quality Assessment
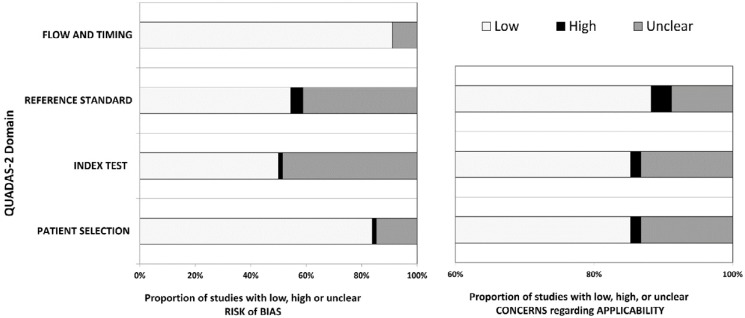
The included studies had a relatively low risk of bias in patient selection and flow and timing (Fig 2). Regarding the index test, 33 of 68 studies (49%) lacked a description of blinding about the results of RT-PCR during the interpretation of CT images, causing an unclear risk of bias in those studies. A paucity of detail in the description of RT-PCR procedures existed in 28 of 68 studies (41%), resulting an unclear risk of bias. Nevertheless, the paucity of details in those descriptions was determined not to raise concerns regarding the applicability of the CT and RT-PCR results in most studies.
Figure 2:
Grouped bar charts for risk of bias and concerns regarding the applicability of the 68 included studies using QUADAS-2. QUADAS-2 = Quality Assessment of Diagnostic Accuracy Studies-2.
Diagnostic Performance of Chest CT Scan and RT-PCR
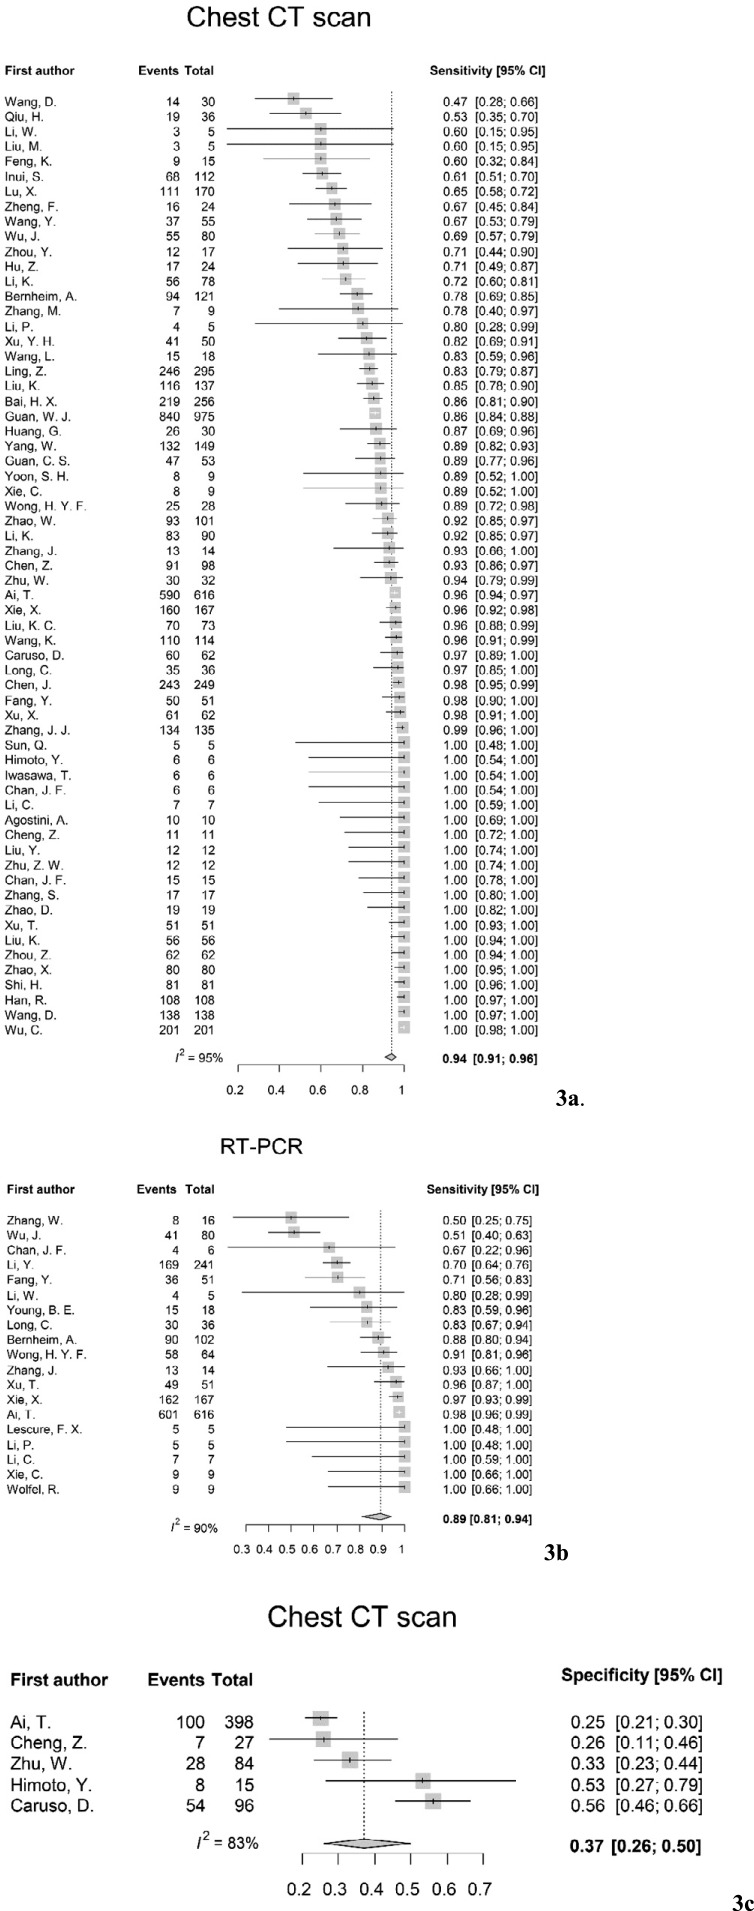
The pooled sensitivity was 94% (95% CI: 91%, 96%; I2 = 95%) for chest CT and 89% (95% CI: 81%, 94%; I2 = 90%) for RT-PCR (Figs 3a and 3b). There was substantial heterogeneity for both chest CT and RT-PCR. The pooled specificity was 37% (95% CI: 26%, 50%; I2 = 83%) for chest CT (Fig 3c).
Figure 3:
Forest plots of pooled sensitivity of (a) chest CT and (b) RT-PCR and pooled specificity of (c) chest CT. Univariate analyses were performed for sensitivity and specificity, respectively. CT = computed tomography; RT-PCR = reverse transcriptase-polymerase chain reaction.
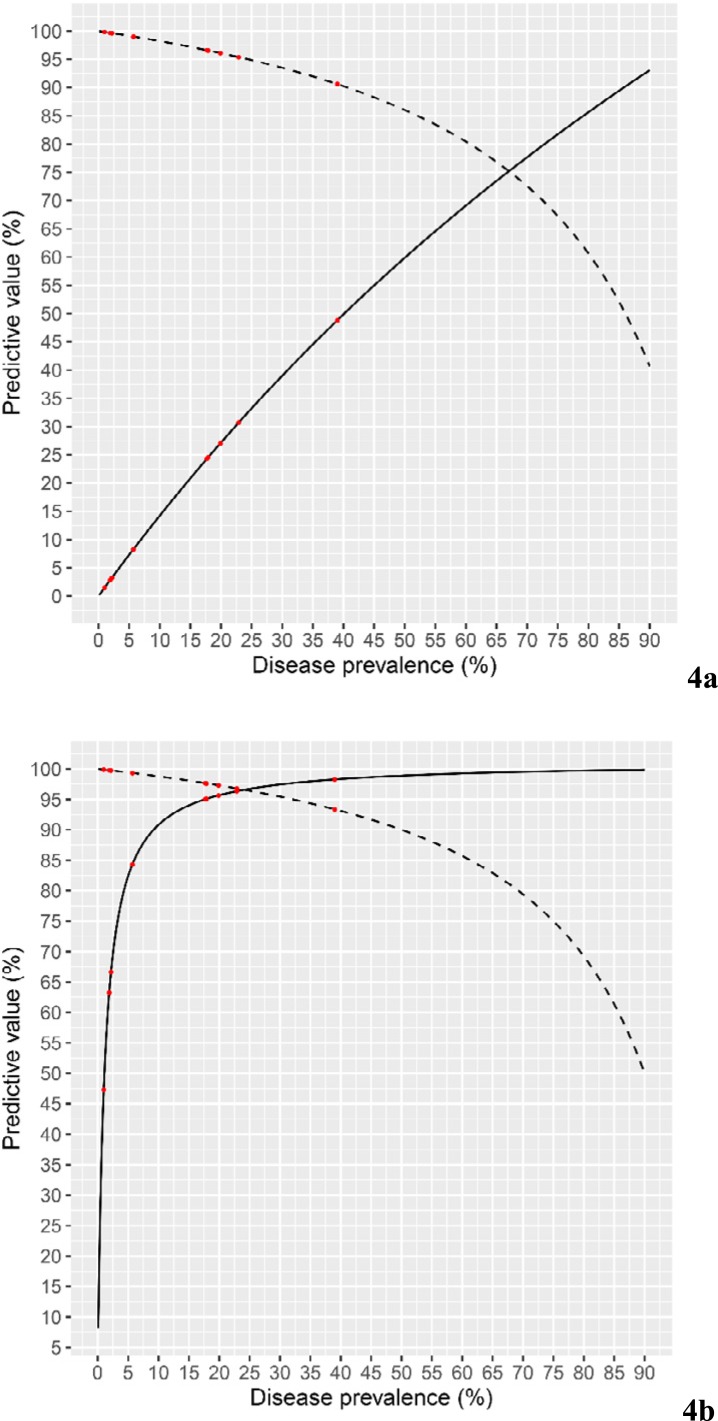
The pooled prevalence of COVID-19 was 38% (95% CI: 26%, 51%; I2 = 90%), which were extracted from the five studies from China (3, 39, 47), Italy (43), and Japan (50). The pooled prevalence in China was 39% (95% CI: 23%, 59%; I2 = 92%), as extracted from the three studies (3, 39, 47). The estimated PPV and NPV of chest CT were 1.5% and 99.8% at a disease prevalence of 1%, 14.2% and 98.2% at a prevalence of 10%, and 48.8% and 90.6% at a prevalence of 39%, respectively (Fig 4a). The estimated PPV and NPV of RT-PCR were 47.3% and 99.9% at a disease prevalence of 1%, 90.8% and 98.8% at a prevalence of 10%, and 98.3% and 93.4% at a prevalence of 39%, respectively (Fig 4b).
Figure 4:
Estimated positive predictive value and negative predictive value of (a) chest CT and (b) RT-PCR. The solid line indicates the positive predictive value, and the dotted line denotes the negative predictive value. The red dots indicate the predictive values for eight different countries and China (the right-most point; prevalence, 39%). CT = computed tomography; RT-PCR = reverse transcriptase-polymerase chain reaction.
The prevalence of COVID-19 outside China ranged from 1.0% to 22.9%. For chest CT scans, the PPV ranged from 1.5% to 30.7%, and the NPV ranged from 95.4% to 99.8%. For RT-PCR, the PPV ranged from 47.3% to 96.4%, while the NPV ranged from 96.8% to 99.9% (Table 1).
Table 1:
Estimated Predictive Values of Chest CT and RT-PCR for COVID-19 in Nine Countries
Meta-regression Analysis
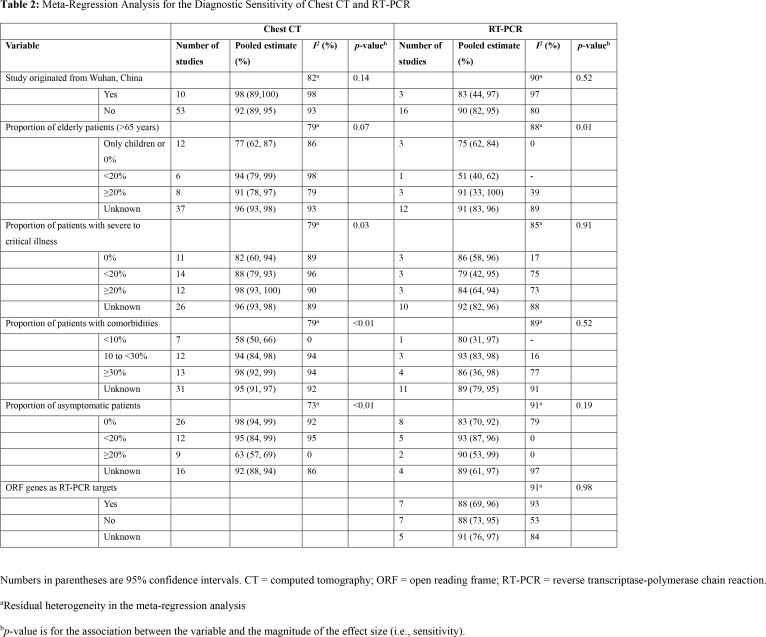
Meta-regression analyses for the sensitivity of chest CT revealed that the distribution of disease severity, the proportion of patients with comorbidities, and the proportion of asymptomatic patients significantly affected heterogeneity (all p < 0.05). The region of study origin (p = 0.14) and the proportion of elderly patients (p = 0.07) were not associated with the sensitivity of chest CT. The sensitivity of RT-PCR was negatively associated with the proportion of elderly patients (p = 0.01). No evidence was found for any associations of the sensitivity of RT-PCR with the proportion of study origin (p = 0.52), the distribution of disease severity (p = 0.91), the proportion of patients with comorbidities (p = 0.52), the proportion of asymptomatic patients (p = 0.19), and whether RT-PCR targeted ORF genes (p = 0.98). Detailed results are provided in Table 2.
Table 2:
Meta-Regression Analysis for the Diagnostic Sensitivity of Chest CT and RT-PCR
Sensitivity Analysis
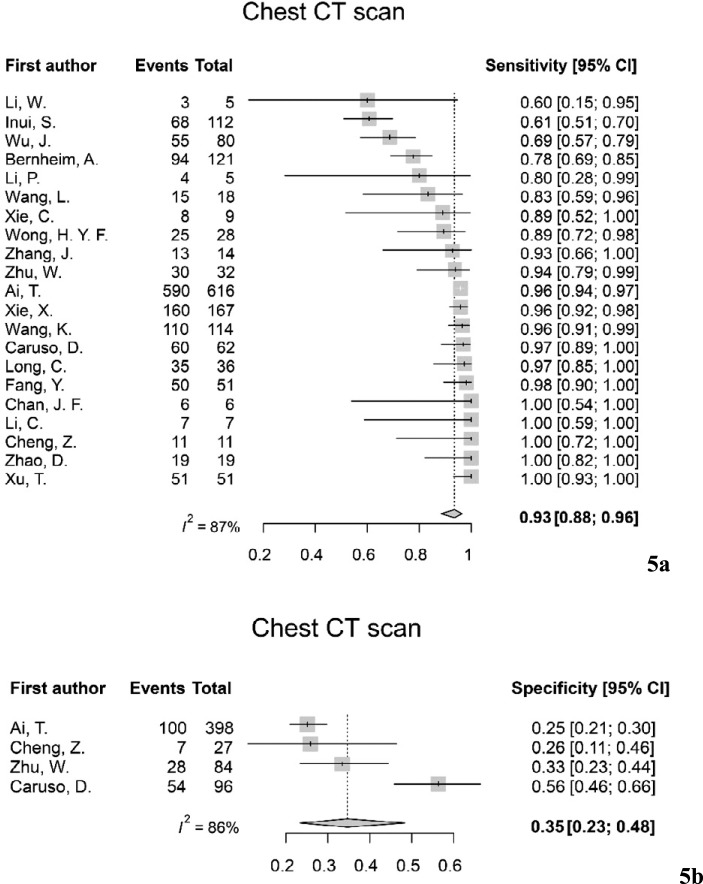
The results of the sensitivity analysis (Fig 5) were similar to those of the primary analysis. The pooled sensitivity of chest CT for the studies with repeated RT-PCR as the reference standard was 95% (95% CI: 88%, 96%; I2 = 87%). The pooled specificity was 35% (95% CI: 23%, 48%; I2 = 86%).
Figure 5:
Sensitivity analysis for the chest CT using studies with repeated RT-PCR assays as the reference standard. Forest plots of (a) pooled sensitivity and (b) pooled specificity. RTPCR = reverse transcriptase-polymerase chain reaction.
Publication Bias
A visual assessment of funnel plots demonstrated that the likelihood of publication bias was low for the studies on chest CT scans and RT-PCR (Fig 6).
Figure 6:
Funnel plots. The likelihood of publication bias was low for the studies on chest CT scans and RT-PCR. CT = computed tomography; RT-PCR = reverse transcriptase-polymerase chain reaction.
Discussion
In this meta-analysis, we demonstrated that the pooled sensitivity was 94% (95% CI: 91%, 96%) for chest computed tomography (CT) and 89% (95% CI: 81%, 94%) for reverse transcriptase-polymerase chain reaction (RT-PCR). The pooled specificity of chest CT was 37% (95% CI: 26%, 50%). Given the low specificity of chest CT, a large gap in the positive predictive value (PPV) between chest CT and RT-PCR in low-prevalence regions was noted. Specifically, in countries with a prevalence less than 10%, the PPV of RT-PCR was more than ten times higher than that of CT scans. Nevertheless, the negative predictive value of both methods ranged from 99.0% to 99.9%. Our results imply that the usage of chest CT scans in low-prevalence regions could induce a large number of false-positive results. False positive results may lead to further diagnostic testing, greater medical costs and workload of medical staff as well as patient anxiety.
Recent studies on the diagnostic performance of chest CT and RT-PCR have mostly been reported from China, and in those studies, the pooled prevalence was 39%. The prevalence in the studies from China was higher than the prevalence in the other eight countries we analyzed in this study. Suggestions from a high-prevalence region should be carefully adjudicated before clinical implementation in relatively low-prevalence regions. Our results coincide with the statements from the American College of Radiology recommending that CT should not be used to screen for or as a first-line test to diagnose COVID-19 and that CT should be used sparingly for hospitalized, symptomatic patients (80). The Society of Thoracic Radiology and American Society of Emergency Radiology also published a similar position statement that CT scans are not recommended as a primary screening tool (8).
In the meta-regression analysis, we found that the diagnostic sensitivity of CT was affected by the distribution of disease severity, comorbidities, and the proportion of asymptomatic patients. This reflects the fact that variations in diagnostic performance measures can be caused by the patient spectrum, referral filter, and reader expectations (81). The patient spectrum, which refers to differences in severity, might have been reflected in the variables we analyzed. It is known that tests in a more severely diseased population may be associated with a higher prevalence or with better diagnostic performance (82). On the contrary, the sensitivity of RT-PCR was lower in studies with a higher proportion of elderly patients. This is plausible because RT-PCR requires a sample to be obtained (nasopharyngeal swab, throat swab, or sputum). Sampling in patients with poor performance status is difficult and prone to sampling error. This is a form of artifactual variability that can affect diagnostic test accuracy.
It should be noted that there was substantial heterogeneity in the included studies. The Higgins I2 statistics for the sensitivity of chest CT and RT-PCR were 95% and 90%, respectively. In the subgroup analyses, there was a considerable level of unexplained heterogeneity, which complicates the interpretation and usefulness of pooled effect estimates. For example, the unexplained heterogeneity in the subgroup analysis for the target genes of RT-PCR was 91%, which suggests that other factors likely affected these results, such as vendor-specific effects (83) and differences in the quality assurance process. The same was true for CT scans. Readers’ experience, internal threshold, and acquisition parameters such as radiation dosage and slice thickness, which affect image quality, are potential factors that were not investigated in our study.
Our study had limitations. First, we included a small number of studies, which were not randomized clinical trials. Most of the studies had a retrospective design. However, we believe that a prospective diagnostic study would not be feasible in this global health emergency. Second, bivariate analysis for the sensitivity and specificity of each diagnostic method could not be performed due to the limited number of available studies. At least 10 studies are generally required to estimate all parameters of a bivariate model (12), but there were only five available studies which reported the sensitivity and specificity of chest CT scan. Therefore, the threshold effect was not investigated, which could give misleading results (84). Third, we could not consider the interval since symptom onset, which can affect the diagnostic performance of CT scans and RT-PCR assays.
In conclusion, chest CT scans for the primary screening or diagnosis of coronavirus disease 2019 would not be beneficial in a low-prevalence region due to the substantial rate of false-positives. A cost-effectiveness analysis and assessment of practicability are warranted for chest CT in high-prevalence regions.
Acknowledgments
Acknowledgment
The authors would like to acknowledge Andrew Dombrowski, PhD (Compecs, Inc) for his assistance in improving the use of English in this manuscript.
H.K. and H.H. contributed equally to this work.
Conflicts of Interest: Activities related to the present article: None. Activities not related to the present article: H.K. received a research grant from Lunit Inc. (Seoul, Korea).
Abbreviations:
- CI
- confidence interval
- COVID-19
- coronavirus disease 2019
- NPV
- negative predictive value
- ORF
- open reading frame
- PPV
- positive predictive value
- PRISMA
- Preferred Reporting Items for Systematic Reviews and Meta-analyses
- QUADAS-2
- Quality Assessment of Diagnostic Accuracy Studies-2
- RT-PCR
- reverse transcriptase-polymerase chain reaction
- SARS-CoV-2
- severe acute respiratory syndrome coronavirus 2
- WHO
- World Health Organization
References
- 1.World Health Organization . Coronavirus disease (COVID-19) outbreak. https://www.who.int/westernpacific/emergencies/covid-19. Accessed March 27, 2020.
- 2.World Health Organization . Coronavirus disease (COVID-19) pandemic. https://www.who.int/emergencies/diseases/novel-coronavirus-2019. Accessed April 8, 2020.
- 3.Ai T, Yang Z, Hou H, et al. Correlation of chest CT and RT-PCR testing in coronavirus disease 2019 (COVID-19) in China: a report of 1014 cases. Radiology 2020. doi: 10.1148/radiol.2020200642 [DOI] [PMC free article] [PubMed] [Google Scholar]
- 4.Fang Y, Zhang H, Xie J, et al. Sensitivity of chest CT for COVID-19: comparison to RTPCR. Radiology 2020. doi: 10.1148/radiol.2020200432 [DOI] [PMC free article] [PubMed] [Google Scholar]
- 5.Xie X, Zhong Z, Zhao W, Zheng C, Wang F, Liu J. Chest CT for typical 2019-nCoV pneumonia: relationship to negative RT-PCR testing. Radiology 2020. doi: 10.1148/radiol.2020200343 [DOI] [PMC free article] [PubMed] [Google Scholar]
- 6.The Wall Street Journal . Manufacturing defect in some early CDC test kits being probed. https://www.wsj.com/articles/manufacturing-defect-in-some-early-cdc-test-kits-being-probed-11583119414. Accessed March 4, 2020.
- 7.Chung M, Bernheim A, Mei X, et al. CT imaging features of 2019 novel coronavirus (2019-nCoV). Radiology 2020;295(1):202-207. [DOI] [PMC free article] [PubMed] [Google Scholar]
- 8.STR/ASER COVID-19 position statement. https://thoracicrad.org/. Accessed March 27, 2020.
- 9.Loong TW. Understanding sensitivity and specificity with the right side of the brain. BMJ 2003;327(7417):716-719. [DOI] [PMC free article] [PubMed] [Google Scholar]
- 10.National Administration of Traditional Chinese Medicine . Notice on the issuance of a programme for the diagnosis and treatment of novel coronavirus (2019-nCoV) infected pneumonia (trial fifth edition) http://bgs.satcm.gov.cn/zhengcewenjian/2020-02-06/12847.html. Accessed March 17, 2020.
- 11.Chinese Center for Disease Control and Prevention . Specific primers and probes for detection 2019 novel coronavirus. http://ivdc.chinacdc.cn/kyjz/202001/t20200121_211337.html. Accessed March 17, 2020.
- 12.Diaz M. Performance measures of the bivariate random effects model for meta-analyses of diagnostic accuracy. Comput Stat Data Anal 2015;83(C):82–90. [Google Scholar]
- 13.Our World in Data Based on the Oxford Martin Programme on Global Development . How many tests for COVID-19 are being performed around the world? https://ourworldindata.org/covid-testing. Accessed April 7, 2020.
- 14.Hunter JP, Saratzis A, Sutton AJ, Boucher RH, Sayers RD, Bown MJ. In meta-analyses of proportion studies, funnel plots were found to be an inaccurate method of assessing publication bias. J Clin Epidemiol 2014;67(8):897-903. [DOI] [PubMed] [Google Scholar]
- 15.Bai HX, Hsieh B, Xiong Z, et al. Performance of radiologists in differentiating COVID-19 from viral pneumonia on chest CT. Radiology 2020. doi: 10.1148/radiol.2020200823 [DOI] [PMC free article] [PubMed] [Google Scholar]
- 16.Bernheim A, Mei X, Huang M, et al. Chest CT findings in coronavirus disease-19 (COVID-19): relationship to duration of infection. Radiology 2020. doi: 10.1148/radiol.2020200463 [DOI] [PMC free article] [PubMed] [Google Scholar]
- 17.Chan JF, Yip CC, To KK, et al. Improved molecular diagnosis of COVID-19 by the novel, highly sensitive and specific COVID-19-RdRp/Hel real-time reverse transcription-polymerase chain reaction assay validated in vitro and with clinical specimens. J Clin Microbiol 2020. doi: 10.1128/JCM.00310-20 [DOI] [PMC free article] [PubMed] [Google Scholar]
- 18.Feng K, Yun YX, Wang XF, et al. Analysis of CT features of 15 children with 2019 novel coronavirus infection. Zhonghua Er Ke Za Zhi 2020;58(0):E007. [DOI] [PubMed] [Google Scholar]
- 19.Guan WJ, Ni ZY, Hu Y, et al. Clinical characteristics of coronavirus disease 2019 in China. N Engl J Med 2020. doi: 10.1056/NEJMoa2002032 [DOI] [PMC free article] [PubMed] [Google Scholar]
- 20.Hu Z, Song C, Xu C, et al. Clinical characteristics of 24 asymptomatic infections with COVID-19 screened among close contacts in Nanjing, China. Sci China Life Sci 2020. doi: 10.1007/s11427-020-1661-4 [DOI] [PMC free article] [PubMed] [Google Scholar]
- 21.Li K, Wu J, Wu F, et al. The clinical and chest CT features associated with severe and critical COVID-19 pneumonia. Invest Radiol 2020. doi: 10.1097/RLI.0000000000000672 [DOI] [PMC free article] [PubMed] [Google Scholar]
- 22.Li W, Cui H, Li K, Fang Y, Li S. Chest computed tomography in children with COVID-19 respiratory infection. Pediatr Radiol 2020. doi: 10.1007/s00247-020-04656-7 [DOI] [PMC free article] [PubMed] [Google Scholar]
- 23.Liu K, Fang YY, Deng Y, et al. Clinical characteristics of novel coronavirus cases in tertiary hospitals in Hubei province. Chin Med J (Engl) 2020. doi: 10.1097/CM9.0000000000000744 [DOI] [PMC free article] [PubMed] [Google Scholar]
- 24.Liu Y, Yang Y, Zhang C, et al. Clinical and biochemical indexes from 2019-nCoV infected patients linked to viral loads and lung injury. Sci China Life Sci 2020;63(3):364-374. [DOI] [PMC free article] [PubMed] [Google Scholar]
- 25.Shi H, Han X, Jiang N, et al. Radiological findings from 81 patients with COVID-19 pneumonia in Wuhan, China: a descriptive study. Lancet Infect Dis 2020;20(4):425-434. [DOI] [PMC free article] [PubMed] [Google Scholar]
- 26.Wang D, Hu B, Hu C, et al. Clinical characteristics of 138 hospitalized patients with 2019 novel coronavirus-infected pneumonia in Wuhan, China. JAMA 2020. doi: 10.1001/jama.2020.1585 [DOI] [PMC free article] [PubMed] [Google Scholar]
- 27.Wang D, Ju XL, Xie F, et al. Clinical analysis of 31 cases of 2019 novel coronavirus infection in children from six provinces (autonomous region) of northern China. Zhonghua Er Ke Za Zhi 2020;58(4):E011. [DOI] [PubMed] [Google Scholar]
- 28.Wang L, Gao YH, Lou LL, Zhang GJ. The clinical dynamics of 18 cases of COVID-19 outside of Wuhan, China. Eur Respir J 2020. doi: 10.1183/13993003.00398-2020 [DOI] [PMC free article] [PubMed] [Google Scholar]
- 29.Wu C, Chen X, Cai Y, et al. Risk factors associated with acute respiratory distress syndrome and death in patients with coronavirus disease 2019 pneumonia in Wuhan, China. JAMA Intern Med 2020. doi: 0.1001/jamainternmed.2020.0994 [DOI] [PMC free article] [PubMed] [Google Scholar]
- 30.Wu J, Liu J, Zhao X, et al. Clinical characteristics of imported cases of COVID-19 in Jiangsu province: a multicenter descriptive study. Clin Infect Dis 2020. doi: 10.1093/cid/ciaa199 [DOI] [PMC free article] [PubMed] [Google Scholar]
- 31.Xie C, Jiang L, Huang G, et al. Comparison of different samples for 2019 novel coronavirus detection by nucleic acid amplification tests. Int J Infect Dis 2020;93:264-267. [DOI] [PMC free article] [PubMed] [Google Scholar]
- 32.Xu XW, Wu XX, Jiang XG, et al. Clinical findings in a group of patients infected with the 2019 novel coronavirus (SARS-Cov-2) outside of Wuhan, China: retrospective case series. BMJ 2020;368:m606. [DOI] [PMC free article] [PubMed] [Google Scholar]
- 33.Xu YH, Dong JH, An WM, et al. Clinical and computed tomographic imaging features of novel coronavirus pneumonia caused by SARS-CoV-2. J Infect 2020;80(4):394-400. [DOI] [PMC free article] [PubMed] [Google Scholar]
- 34.Yang W, Cao Q, Qin L, et al. Clinical characteristics and imaging manifestations of the 2019 novel coronavirus disease (COVID-19): a multi-center study in Wenzhou city, Zhejiang, China. J Infect 2020;80(4):388-393. [DOI] [PMC free article] [PubMed] [Google Scholar]
- 35.Yoon SH, Lee KH, Kim JY, et al. Chest radiographic and CT findings of the 2019 novel coronavirus disease (COVID-19): analysis of nine patients treated in Korea. Korean J Radiol 2020;21(4):494-500. [DOI] [PMC free article] [PubMed] [Google Scholar]
- 36.Zhang JJ, Dong X, Cao YY, et al. Clinical characteristics of 140 patients infected with SARS-CoV-2 in Wuhan, China. Allergy 2020. doi: 10.1111/all.14238 [DOI] [PubMed] [Google Scholar]
- 37.Zhang MQ, Wang XH, Chen YL, et al. Clinical features of 2019 novel coronavirus pneumonia in the early stage from a fever clinic in Beijing. Zhonghua Jie He He Hu Xi Za Zhi 2020;43(3):215-218. [DOI] [PubMed] [Google Scholar]
- 38.Zhao D, Yao F, Wang L, et al. A comparative study on the clinical features of COVID-19 pneumonia to other pneumonias. Clin Infect Dis 2020. doi: 10.1093/cid/ciaa247 [DOI] [PMC free article] [PubMed] [Google Scholar]
- 39.Zhu W, Xie K, Lu H, Xu L, Zhou S, Fang S. Initial clinical features of suspected coronavirus disease 2019 in two emergency departments outside of Hubei, China. J Med Virol 2020. doi: 10.1002/jmv.25763 [DOI] [PMC free article] [PubMed] [Google Scholar]
- 40.Zhu ZW, Tang JJ, Chai XP, et al. Comparison of heart failure and 2019 novel coronavirus pneumonia in chest CT features and clinical characteristics. Zhonghua Xin Xue Guan Bing Za Zhi 2020;48(0):E007. [DOI] [PubMed] [Google Scholar]
- 41.Zhao W, Zhong Z, Xie X, Yu Q, Liu J. Relation between chest CT findings and clinical conditions of coronavirus disease (COVID-19) pneumonia: a multicenter study. AJR Am J Roentgenol 2020. doi: 10.2214/AJR.20.22976 [DOI] [PubMed] [Google Scholar]
- 42.Agostini A, Floridi C, Borgheresi A, et al. Proposal of a low-dose, long-pitch, dual-source chest CT protocol on third-generation dual-source CT using a tin filter for spectral shaping at 100 kVp for coronavirus disease 2019 (COVID-19) patients: a feasibility study. Radiol Med 2020. doi: 10.1007/s11547-020-01179-x [DOI] [PMC free article] [PubMed] [Google Scholar]
- 43.Caruso D, Zerunian M, Polici M, et al. Chest CT features of COVID-19 in Rome, Italy. Radiology 2020. doi: 10.1148/radiol.2020201237 [DOI] [PMC free article] [PubMed] [Google Scholar]
- 44.Chan JF, Yuan S, Kok KH, et al. A familial cluster of pneumonia associated with the 2019 novel coronavirus indicating person-to-person transmission: a study of a family cluster. Lancet 2020;395(10223):514-523. [DOI] [PMC free article] [PubMed] [Google Scholar]
- 45.Chen J, Qi T, Liu L, et al. Clinical progression of patients with COVID-19 in Shanghai, China. J Infect 2020. doi: 10.1016/j.jinf.2020.03.004 [DOI] [PMC free article] [PubMed] [Google Scholar]
- 46.Chen Z, Fan H, Cai J, et al. High-resolution computed tomography manifestations of COVID-19 infections in patients of different ages. Eur J Radiol 2020. doi: 10.1016/j.ejrad.2020.108972 [DOI] [PMC free article] [PubMed] [Google Scholar]
- 47.Cheng Z, Lu Y, Cao Q, et al. Clinical features and chest CT manifestations of coronavirus disease 2019 (COVID-19) in a single-center study in Shanghai, China. AJR Am J Roentgenol 2020. doi: 10.2214/AJR.20.22959 [DOI] [PubMed] [Google Scholar]
- 48.Guan CS, Lv ZB, Yan S, et al. Imaging features of coronavirus disease 2019 (COVID-19): evaluation on thin-section CT. Acad Radiol 2020. doi: 10.1016/j.acra.2020.03.002 [DOI] [PMC free article] [PubMed] [Google Scholar]
- 49.Han R, Huang L, Jiang H, Dong J, Peng H, Zhang D. Early clinical and CT manifestations of coronavirus disease 2019 (COVID-19) pneumonia. AJR Am J Roentgenol 2020. doi: 10.2214/AJR.20.22961 [DOI] [PubMed] [Google Scholar]
- 50.Himoto Y, Sakata A, Kirita M, et al. Diagnostic performance of chest CT to differentiate COVID-19 pneumonia in non-high-epidemic area in Japan. Jpn J Radiol 2020. doi: 10.1007/s11604-020-00958-w [DOI] [PMC free article] [PubMed] [Google Scholar]
- 51.Huang G, Gong T, Wang G, et al. Timely diagnosis and treatment shortens the time to resolution of coronavirus disease (COVID-19) pneumonia and lowers the highest and last CT scores from sequential chest CT. AJR Am J Roentgenol 2020. doi: 10.2214/AJR.20.23078 [DOI] [PubMed] [Google Scholar]
- 52.Iwasawa T, Sato M, Yamaya T, et al. Ultra-high-resolution computed tomography can demonstrate alveolar collapse in novel coronavirus (COVID-19) pneumonia. Jpn J Radiol 2020. doi: 10.1007/s11604-020-00956-y [DOI] [PMC free article] [PubMed] [Google Scholar]
- 53.Li C, Ji F, Wang L, et al. Asymptomatic and human-to-human transmission of SARSCoV-2 in a 2-family cluster, Xuzhou, China. Emerg Infect Dis 2020. doi: 10.3201/eid2607.200718 [DOI] [PMC free article] [PubMed] [Google Scholar]
- 54.Li K, Fang Y, Li W, et al. CT image visual quantitative evaluation and clinical classification of coronavirus disease (COVID-19). Eur Radiol 2020. doi: 10.1007/s00330-020-06817-6 [DOI] [PMC free article] [PubMed] [Google Scholar]
- 55.Li P, Fu JB, Li KF, et al. Transmission of COVID-19 in the terminal stage of incubation period: a familial cluster. Int J Infect Dis 2020. doi: 10.1016/j.ijid.2020.03.027 [DOI] [PMC free article] [PubMed] [Google Scholar]
- 56.Ling Z, Xu X, Gan Q, et al. Asymptomatic SARS-CoV-2 infected patients with persistent negative CT findings. Eur J Radiol 2020. doi: 10.1016/j.ejrad.2020.108956 [DOI] [PMC free article] [PubMed] [Google Scholar]
- 57.Liu K, Chen Y, Lin R, Han K. Clinical features of COVID-19 in elderly patients: a comparison with young and middle-aged patients. J Infect 2020. doi: 10.1016/j.jinf.2020.03.005 [DOI] [PMC free article] [PubMed] [Google Scholar]
- 58.Liu KC, Xu P, Lv WF, et al. CT manifestations of coronavirus disease-2019: a retrospective analysis of 73 cases by disease severity. Eur J Radiol 2020. doi: 10.1016/j.ejrad.2020.108941 [DOI] [PMC free article] [PubMed] [Google Scholar]
- 59.Liu M, Song Z, Xiao K. High-resolution computed tomography manifestations of 5 pediatric patients with 2019 novel coronavirus. J Comput Assist Tomogr 2020. doi: 10.1097/RCT.0000000000001023 [DOI] [PMC free article] [PubMed] [Google Scholar]
- 60.Long C, Xu H, Shen Q, et al. Diagnosis of the coronavirus disease (COVID-19): rRTPCR or CT? Eur J Radiol 2020. doi: 10.1016/j.ejrad.2020.108961 [DOI] [PMC free article] [PubMed] [Google Scholar]
- 61.Lu X, Zhang L, Du H, et al. SARS-CoV-2 infection in children. N Engl J Med 2020. doi: 10.1056/NEJMc2005073 [DOI] [PMC free article] [PubMed] [Google Scholar]
- 62.Qiu H, Wu J, Hong L, Luo Y, Song Q, Chen D. Clinical and epidemiological features of 36 children with coronavirus disease 2019 (COVID-19) in Zhejiang, China: an observational cohort study. Lancet Infect Dis 2020. doi: doi: 10.1016/S1473-3099(20)30198-5 [DOI] [PMC free article] [PubMed] [Google Scholar]
- 63.Sun Q, Xu X, Xie J, Li J, Huang X. Evolution of computed tomography manifestations in five patients who recovered from coronavirus disease 2019 (COVID-19) pneumonia. Korean J Radiol 2020. doi: 10.3348/kjr.2020.0157 [DOI] [PMC free article] [PubMed] [Google Scholar]
- 64.Wang K, Kang S, Tian R, Zhang X, Zhang X, Wang Y. Imaging manifestations and diagnostic value of chest CT of coronavirus disease 2019 (COVID-19) in the Xiaogan area. Clin Radiol 2020. doi: 10.1016/j.crad.2020.03.004 [DOI] [PMC free article] [PubMed] [Google Scholar]
- 65.Wang Y, Liu Y, Liu L, Wang X, Luo N, Ling L. Clinical outcome of 55 asymptomatic cases at the time of hospital admission infected with SARS-Coronavirus-2 in Shenzhen, China. J Infect Dis 2020. doi: 10.1093/infdis/jiaa119 [DOI] [PMC free article] [PubMed] [Google Scholar]
- 66.Wong HYF, Lam HYS, Fong AH, et al. Frequency and distribution of chest radiographic findings in COVID-19 positive patients. Radiology 2020. doi: 10.1148/radiol.2020201160 [DOI] [PMC free article] [PubMed] [Google Scholar]
- 67.Xu T, Chen C, Zhu Z, et al. Clinical features and dynamics of viral load in imported and non-imported patients with COVID-19. Int J Infect Dis 2020. doi: 10.1016/j.ijid.2020.03.022 [DOI] [PMC free article] [PubMed] [Google Scholar]
- 68.Zhang J, Wang S, Xue Y. Fecal specimen diagnosis 2019 novel coronavirus-infected pneumonia. J Med Virol 2020. doi: 10.1002/jmv.25742 [DOI] [PMC free article] [PubMed] [Google Scholar]
- 69.Zhang S, Li H, Huang S, You W, Sun H. High-resolution CT features of 17 cases of corona virus disease 2019 in Sichuan province, China. Eur Respir J 2020. doi: 10.1183/13993003.00334-2020 [DOI] [PMC free article] [PubMed] [Google Scholar]
- 70.Zhao X, Liu B, Yu Y, et al. The characteristics and clinical value of chest CT images of novel coronavirus pneumonia. Clin Radiol 2020. doi: 10.1016/j.crad.2020.03.002 [DOI] [PMC free article] [PubMed] [Google Scholar]
- 71.Zheng F, Liao C, Fan QH, et al. Clinical characteristics of children with coronavirus disease 2019 in Hubei, China. Curr Med Sci 2020. doi: 10.1007/s11596-020-2172-6 [DOI] [PMC free article] [PubMed] [Google Scholar]
- 72.Zhou Y, Zhang Z, Tian J, Xiong S. Risk factors associated with disease progression in a cohort of patients infected with the 2019 novel coronavirus. Ann Palliat Med 2020. doi: 10.21037/apm.2020.03.26 [DOI] [PubMed] [Google Scholar]
- 73.Zhou Z, Guo D, Li C, et al. Coronavirus disease 2019: initial chest CT findings. Eur Radiol 2020. doi: 10.1007/s00330-020-06816-7 [DOI] [PMC free article] [PubMed] [Google Scholar]
- 74.Inui S, Fujikawa A, Jitsu M, et al. Chest CT findings in cases from the cruise ship “Diamond Princess” with coronavirus disease 2019 (COVID-19). Radiology: Cardiothoracic Imaging 2020;2(2):e200110. [DOI] [PMC free article] [PubMed] [Google Scholar]
- 75.Zhang W, Du RH, Li B, et al. Molecular and serological investigation of 2019-nCoV infected patients: implication of multiple shedding routes. Emerg Microbes Infect 2020;9(1):386-389. [DOI] [PMC free article] [PubMed] [Google Scholar]
- 76.Lescure FX, Bouadma L, Nguyen D, et al. Clinical and virological data of the first cases of COVID-19 in Europe: a case series. Lancet Infect Dis 2020. doi: 10.1016/S1473-3099(20)30200-0 [DOI] [PMC free article] [PubMed] [Google Scholar]
- 77.Li Y, Yao L, Li J, et al. Stability issues of RT-PCR testing of SARS-CoV-2 for hospitalized patients clinically diagnosed with COVID-19. J Med Virol 2020. doi: 10.1002/jmv.25786 [DOI] [PMC free article] [PubMed] [Google Scholar]
- 78.Wolfel R, Corman VM, Guggemos W, et al. Virological assessment of hospitalized patients with COVID-2019. Nature 2020. doi: 10.1038/s41586-020-2196-x [DOI] [PubMed] [Google Scholar]
- 79.Young BE, Ong SWX, Kalimuddin S, et al. Epidemiologic features and clinical course of patients infected with SARS-CoV-2 in Singapore. JAMA 2020. doi: 10.1001/jama.2020.3204 [DOI] [PMC free article] [PubMed] [Google Scholar]
- 80.American College of Radiology . ACR recommendations for the use of chest radiography and computed tomography (CT) for suspected COVID-19 infection. https://www.acr.org/Advocacy-and-Economics/ACR-Position-Statements/Recommendations-for-Chest-Radiography-and-CT-for-Suspected-COVID19-Infection. Accessed March 30, 2020.
- 81.Leeflang MM, Rutjes AW, Reitsma JB, Hooft L, Bossuyt PM. Variation of a test's sensitivity and specificity with disease prevalence. CMAJ 2013;185(11):E537-544. [DOI] [PMC free article] [PubMed] [Google Scholar]
- 82.Mulherin SA, Miller WC. Spectrum bias or spectrum effect? Subgroup variation in diagnostic test evaluation. Ann Intern Med 2002;137(7):598-602. [DOI] [PubMed] [Google Scholar]
- 83.Indian Council of Medical Research . Guidelines for use of commercial kits for nasal/throat swab based diagnosis of COVID-19 in India, 2 April, 2020. https://icmr.nic.in/sites/default/files/upload_documents/Validation_of_Commercial_Kits_02042020.pdf. Accessed April 8, 2020.
- 84.Irwig L, Macaskill P, Glasziou P, Fahey M. Meta-analytic methods for diagnostic test accuracy. J Clin Epidemiol 1995;48(1):119-130. [DOI] [PubMed] [Google Scholar]


