

Abstract
Background
Computed tomography (CT) of patients with severe acute respiratory syndrome coronavirus 2 (SARS-CoV-2) disease depicts the extent of lung involvement in COVID-19 pneumonia.
Purpose
The aim of the study was to determine the value of quantification of the well-aerated lung obtained at baseline chest CT for determining prognosis in patients with COVID-19 pneumonia.
Materials and Methods
Patients who underwent chest CT suspected for COVID-19 pneumonia at the emergency department admission between February 17 to March 10, 2020 were retrospectively analyzed. Patients with negative reverse-transcription polymerase chain reaction (RT-PCR) for SARS-CoV-2 in nasal-pharyngeal swabs, negative chest CT, and incomplete clinical data were excluded. CT was analyzed for quantification of well aerated lung visually (%V-WAL) and by open-source software (%S-WAL and absolute volume, VOL-WAL). Clinical parameters included demographics, comorbidities, symptoms and symptom duration, oxygen saturation and laboratory values. Logistic regression was used to evaluate relationship between clinical parameters and CT metrics versus patient outcome (ICU admission/death vs. no ICU admission/ death). The area under the receiver operating characteristic curve (AUC) was calculated to determine model performance.
Results
The study included 236 patients (females 59/123, 25%; median age, 68 years). A %V-WAL<73% (OR, 5.4; 95% CI, 2.7-10.8; P<0.001), %S-WAL<71% (OR, 3.8; 95% CI, 1.9-7.5; P<0.001), and VOL-WAL<2.9 L (OR, 2.6; 95% CI, 1.2-5.8; P<0.01) were predictors of ICU admission/death. In comparison with clinical model containing only clinical parameters (AUC, 0.83), all three quantitative models showed higher diagnostic performance (AUC 0.86 for all models). The models containing %V-WAL<73% and VOL-WAL<2.9L were superior in terms of performance as compared to the models containing only clinical parameters (P=0.04 for both models).
Conclusion
In patients with confirmed COVID-19 pneumonia, visual or software quantification the extent of CT lung abnormality were predictors of ICU admission or death.
Summary
Visual and software-based quantification of well aerated lung parenchyma on admission chest CT were predictors of intensive care unit (ICU) admission or death in patients with COVID-19 pneumonia.
Key Results
■ Patients with COVID-19 pneumonia at baseline chest CT who had ICU admission or who died had 4 or more lobes of the lung affected compared to patients without ICU admission or death (16% versus 6% of patients, p<.04).
■ After adjustment for patient demographics and clinical parameters, visually assessed well aerated lung parenchyma on admission on chest CT less than 73% was associated with ICU admission or death (OR 5.4, p<.001); software methods for lung quantification showed similar results.
Introduction
A new coronavirus (severe acute respiratory syndrome coronavirus 2, SARS-CoV-2) has been considered the pathogen responsible of SARS-CoV-2 disease (COVID-19), which have spread throughout the world since December 2019 [1]. COVID-19 has been defined as pandemic by the World Health Organization on March 11, 2020. Clinical expressions of COVID-19 ranges from flu-like to respiratory failure (DAD), the management of which demands advanced respiratory assistance and artificial ventilation.
Triaging of COVID-19 patients is based on clinical and laboratory parameters, whilst chest imaging might be required for second-level triage in specific cases, namely the chest radiography is offered as first step and supplementary CT in more severe cases or in case of discrepancy between clinical and radiographic characteristics [2, 3]. However, during the first phases of COVID-19 outbreak, most unprepared facilities reported times for swab analysis (> 24 h), which significantly impacted the management of emergency department flood. Some centers tried to manage this issue by switching from radiography to CT in a clinically integrated quick workflow [3]. Li et al. have recently demonstrated that visual quantitative analysis of CT abnormalities reflects clinical categories of COVID-19 [4]. Moreover, lung involvement of COVID-19 pneumonia could be assessed automatically by deep-learning-based quantitative CT [5].
However, the presence of coexisting chronic pulmonary abnormalities (e.g. emphysema or interstitial lung diseases) was not taken into account by prior studies [4]. Of note, CT quantification of well-aerated lung was shown to be helpful either to estimate the alveolar recruitment during ventilation or to predict the patient’s prognosis of patients with acute respiratory distress syndrome (ARDS) [6, 7].
The aim of this study was to describe the relationship between COVID-19 prognosis and the extent of well aerated lung obtained by chest CT with either visual or quantitative measurements.
Materials and Methods
Study population
This retrospective study was approved by the Local Ethics Committee (institutional review board -IRB- approval number 241/2020/OSS/AUSLPC). The informed consent was waived by the IRB due to the retrospective nature of the study. The study included consecutive patients with suspected COVID-19 interstitial pneumonia who underwent chest CT at emergency department admission between February 17 to March 10, 2020. All the patients performed reverse-transcription polymerase chain reaction (RT-PCR) for SARS-CoV-2 in nasal-pharyngeal swabs. However, a rapid (minutes to hours) COVID-19 RT-PCR test result was not available at our center during this interval. Therefore, chest CT was performed based on high clinical suspicion in addition to clinical and laboratory findings consistent with COVID-19 in the setting of high pre-test probability (i.e., high community disease burden) of COVID-19 [3, 8].
In order to select chest CT scans for analysis, our exclusion criteria were: 1) RT-PCR for SARS-CoV-2 that was ultimately determined to be negative; 2) negative chest CT; 3) incomplete clinical data. Figure 1 shows the patients enrollment flowchart.
Figure 1.

Diagram showing the patient selection process. Abbreviations: CT, computed tomography; COVID-19, severe acute respiratory syndrome coronavirus 2 (SARS-CoV-2) disease; RT-PCR, reverse-transcription polymerase chain reaction.
Clinical and laboratory findings of each patient were recorded at admission. CT was performed within 12 hours from the clinical evaluation and laboratory findings.
Patients were categorized in 2 groups: patients were admitted to the ICU or who died (ICU/death) versus those patients who were discharged from the hospital alive without ICU admission. The time between CT and ICU admission or death was also registered.
CT protocol
Non-enhanced chest CT scan were performed in supine position, during inspiratory breath-hold, from the apex to the lung bases, with a 16-slice scanner (Emotion 16; Siemens AG, Forchheim, Germany). Low-dose CT acquisition was executed as follows: tube voltage, 110 KV if body weight ≤80 kg and 130 KV for patients >80 kg; tube current, 40 mAs; pitch, 1; collimation, 0.625 mm. Image data sets were reconstructed with 1-2 mm slice thickness range using both sharp kernels (B70f) with a standard lung window (1500 width; -500 center) and medium-soft kernels (B40f) with a soft-tissue window (300 width; 40 center).
CT images analysis
Visual scoring was performed independently by two Radiologists (DC and FCB) blinded to clinical data, respectively with 5 and 14 years of experience, respectively. The total extent of well aerated lung parenchyma expressed as percentage of total lung volume was estimated to the nearest 5%. Scores derived from three lung zones (the upper zone, above the level of the carina; the lower zone, below the level of the infrapulmonary vein; the middle zone between upper and lower zone) were averaged to produce a global percentage of well aerated lung parenchyma (%V-WAL) [9, 10]. Consensus formulation for the visual scores was obtained as reported in the study by Cottin et al [11]. The 5% most divergent observations for CT parameters and instances of discordance over the categorical CT assessment were resolved by consensus. The mean of the observer values was used for the remaining CT parameters [11]. CT abnormalities pattern for diagnosis of COVID-19 were classified as defined in Table E1 (online): 1) typical; 2) indeterminate; 3) atypical [12]. The number of involved lobes (0-5) was registered. The prevalence in the upper, middle or lower zone as defined above, was recorded. The axial distribution was classified as peripheral (prevalent in the outer third of the lung) or central (predominant in the inner two-third). The distribution pattern was classified as diffuse when a clear predominant cranio-caudal or axial distribution was absent. Furthermore, the presence of mediastinal nodes enlargement (≥10 mm in short axis), pleural effusion, emphysema, and pulmonary fibrosis was assessed. The presence of breathing artifact was also recorded.
The software-based evaluation of the well aerated lung parenchyma was performed on a dedicated workstation using the extension Chest Imaging Platform (Applied Chest Imaging Laboratory; Boston, Massachusetts, USA) of the open-source 3D Slicer software (version 4.10.2, https://www.slicer.org) [13]. A fully automatic lung segmentation and analysis of lung parenchyma histogram was obtained using B40f kernel (Figure 2). In case of unsatisfactory lung segmentation, the user amended the lung contours with a manual tool. The definition of normal lung by software segmentation (%S-WAL) was determined by density references from the literature, namely in the interval between -950 HU and -700 HU [14, 15]. Furthermore, using the overall lung volume provided by software, the absolute volume of the well aerated lung (VOL-WAL) was calculated. The adipose tissue volume was calculated to assess obesity as a comorbidity and as a crude estimate of patient size (height and weight were not available). Adipose tissue volume and was estimated by density interval between -170HU and -40HU on a single slice at level of T7-T8 [16]. The time to accomplish the software-based processing and requirement of manual correction were recorded for each patient.
Figure 2.

The Chest Imaging Platform extension (Applied Chest Imaging Laboratory; Boston, Massachusetts, USA) implemented in 3D Slicer software (version 4.10.2, https://www.slicer.org) performed a fully automatic segmentation of lung parenchyma. The algorithm provides a color map of upper, middle, and lower zones lung segmentation displayed with multiplanar reconstructions (axial, sagittal, and coronal) and in 3D volume rendered reconstruction. In this example a 54 years-old female affected by COVID-19 pneumonia. Abbreviations: 3D, three-dimensional; COVID-19, severe acute respiratory syndrome coronavirus 2 (SARS-CoV-2) disease.
Statistical Analysis
Categorical variables were expressed as counts and percentage, with corresponding 95% confidence interval (95%CI) using Wilson method. Continuous variables are shown as median and 95%CI for the median. The difference between the two groups were assessed by Mann-Whitney U test for continuous variables and Chi-square test or Fisher’s exact test for categorical variables, as appropriate. Intra-class correlation coefficient (ICC) was used to test the inter-rater agreement for the %V-WAL and the concordance between %V-WAL and %S-WAL; the interpretation of ICC was based on the guidelines provided by Koo and Li [17].
The outcome was defined by admission to intensive care unit (ICU) or death. Categories from continuous variables were obtained using as threshold the median value of the overall sample. For the CT metrics were obtained additional categories, using cutoffs derived from quartiles. Univariable and backward stepwise multivariable logistic regression analysis were used to test the association between potential predictors and the outcome. Factors for which P values were less than 0.1 in univariable analysis were used as candidate variables for multivariable approach. Therefore, was obtained a model using only clinical parameters; additional models were calculated by adding categories derived from quartiles of %V-WAL, %S-WAL, and VOL-WAL. The R-squared (R2) of each model was then reported for comparison. Receiver operating characteristic (ROC) curve analysis was performed for each model and the area under the ROC (AUC) was used to assess the performance of the discrimination models based on independent predictors. The ROC curves of the two models were compared by the methodology of DeLong et al. [18]. A P value <0.05 was considered statistically significant. Statistical analysis was performed using MedCalc software (version 14.8.1, MedCalc Software Ltd, Ostend, Belgium).
Results
Patient demographics, clinical, and laboratory findings
Demographics, clinical, and laboratory findings are reported in Table 1. The study included 236 patients (median age, 68 years old; 95%CI, 66-70 years old), 59/236 (25%, 95%CI: 19% to 31%) were females. Cardiovascular diseases were the most frequent comorbidities (127/236, 54%, 47% to 60%) and admission laboratory findings showed elevated median value of the lactate dehydrogenase (LDH, 347 U/L; 95% CI, 325 to 376 U/L) and of the C-reactive protein (CRP, 7.6 mg/dl; 95% CI, 6.4 to 8.6 mg/dl); furthermore the median platelet (PLT) count was 180 x 103/µL (95% CI, 164-191 x 103/µL). The ICU/death group included 108/236 (46%, 95% CI: 40% to 52%) patients. The median time elapsed between CT and occurrence of ICU admission or death was 4 days (95% CI, 3-6 days). Patients who admitted to the ICU or who died were older (median age, 73 years vs 62 years; P<0.001) in comparison those without ICU admission or death. In addition, the ICU/death group had a higher prevalence of cardiovascular diseases (71% vs. 39%, P<0.001), higher median levels of LDH (435 vs. 308 U/L, P<0.001), higher CRP levels (13.3 vs 5.1 mg/dl, P<0.001) and higher platelet count (203 x 103/µL vs 160 x 103/µL; P<0.001), respectively.
Table 1.
Patients demographics, comorbidities, symptoms and laboratory findings at admission.

Computed tomography findings
CT findings are summarized in Table 2. The majority (201/236, 85%, 95% CI: 80% to 89%) of the study subjects displayed a typical COVID-19 pneumonia CT pattern, while an indeterminate CT pattern was observed in 29/236 (12%, 95% CI: 8% to 17%) of the cases. A variable combination of ground-glass opacities (GGO) and consolidations were the main CT pattern (119/236, 50%, 95% CI: 44% to 57%). A lower zone predominance (103/236, 43%, 95% CI: 37% to 50%) and diffuse distribution on axial plane (174/236, 73%, 95% CI: 62% to 78%) were the two most common distribution patterns. Concomitant emphysema was documented in 53/236 (22%, 95% CI: 18% to 28%) patients, while pulmonary fibrosis in 8/236 (3%, 95% CI: 2% to 7%) of the patients. Breathing artifacts were observed in 55/236 (23%, 95% CI 18-29%) CT scans. Patients with ICU/death vs. no ICU/ death had a higher number of lobes involved on CT involvement (16% vs 6% with 4 or more lobes involved, P=0.04) and had a higher prevalence of emphysema (29% vs 16%, P=0.02), respectively.
Table 2.
Computed tomography findings.

The median %V-WAL was 73% (95%CI, 70-77%). Inter-rater agreement was good (ICC, 0.85; 95% CI, 0.77-0.9).
Software analysis revealed median %S-WAL of 71% (95%CI, 68-75%), median VOL-WAL of 2.9 L (95% CI, 2.6-3.1 L). The distribution of visual and software-based CT parameters is showed in Figure 3. The median time required to achieve the software analysis was 270 seconds (95%CI, 240-306 seconds), with a manual correction rate in 143/236 (61%, 54% to 66%) cases.
Figure 3.

Box and Whisker plots show the distribution of the CT parameters. (a) The median percentage of the well-aerated lung assessed visually was 73% (interquartile range, 51-85%). (b) The median percentage of the well-aerated lung assessed by software was 71% (interquartile range, 57-82%). (c) The absolute volume of the well aerated lung median value was 2.9 L (interquartile range, 2-3.9 L). (d) The median value of the adipose tissue area at T7-T8 level was 189 cm2 (interquartile range 149-262 cm2). Abbreviations: CT, computed tomography; V-WAL, well-aerated lung assessed visually; S-WAL, well-aerated lung assessed by software; VOL-WAL, absolute volume of well-aerated lung; T7-T8, seventh and eight dorsal vertebrae.
The agreement between %V-WAL and %S-WAL was good (ICC, 0.76; 95% CI, 0.69-0.81). The WAL was lower in the ICU/death versus no ICU/death group in WOG by either visual assessment (median %V-WAL, 53% vs 80%; P<0.001) or software based-analysis (median %S-WAL, 57% vs 78%, P<0.001; median VOL-WAL, 2.3 L vs 3.4 L, P<0.001).
The median and median adipose tissue area at T7-T8 level was 189 cm2 (95%CI, 177-201 cm2). The median adipose tissue area at T7-T8 level was higher in the ICU/death group vs no ICU/death group (208 cm2 vs 170 cm2, P=0.001).
Logistic regression analysis
Table 3 and Tables E2-E4 summarize univariable and multivariable logistic regression analysis results. In multivariable analysis obtained with only clinical parameters (clinical model), the best predictors of the outcome of ICU/death were cardiovascular comorbidities (OR, 3.7; 95% CI, 1.9-7.3; P<0.001) and age>68 years (OR, 3.4; 95% CI, 1.7-6.6; P<0.001).
Table 3.
Logistic regression analysis for the relationship between baseline clinical and CT parameters to predict ICU admission/death.

For the CT metrics of well-aerated lung, we observed worse outcome with lower values of well aerated lung parenchyma, appearing statistically significant at the median values of WAL for both visual and software-based assessment (Tables E2-E4). Median values were used in subsequent assessments.
When CT visual assessment of well-aerated lung was added to the model with clinical parameters, the %V-WAL<73% (OR, 5.4; 95% CI, 2.7-10.8; P<0.001) was associated with ICU/death (Table 4). Similar findings were confirmed on multivariable analysis results obtained with the software-based estimation of WAL (Figures 4 and 5). For the software analysis, both %S-WAL<71% (OR, 3.8; 95% CI, 1.9-7.5; P<0.001) and VOL-WAL<2.9 L (OR, 2.6; 95% CI, 1.3-5.2; P<0.01) were independent predictors of ICU/ death outcome.
Table 4.
Sensitivity, specificity, positive predictive value, negative predictive value, area under ROC curves and R-squared values derived from logistic regression models for the relationship between baseline clinical and CT parameters to predict ICU admission/death.

Figure 4.

A 65 years old male affected by COVID-19 pneumonia admitted in ICU. (a) Non-enhanced axial chest CT image showed bilateral patchy ground glass opacities (arrows) with random distribution and peripheral band-like consolidation in the right lower lobe (arrowhead), with a visual quantification of the well aerated lung of 35%. (b) The same image, displaying highlighted in green the well aerated lung and COVID-19 pneumonia in yellow; the analysis of the relative density histogram, quantified an overall well aerated volume of 54%, corresponding to an absolute volume of 2.3 L. (c) The 3D pie-chart showed the proportion of COVID-19 pneumonia and well aerated lung parenchyma. Abbreviations: COVID-19, severe acute respiratory syndrome coronavirus 2 (SARS-CoV-2) disease; CT, computed tomography; 3D, three-dimensional.
Figure 5.
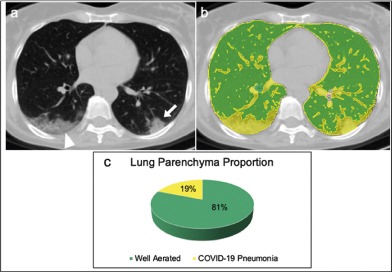
A 54 years old female affected by COVID-19 pneumonia discharged at home from the Emergency Department (a) Non-enhanced axial chest CT image showed peripheral consolidation (arrow) in the left lower lobe and peripheral mixed crazy-paving opacities and consolidation in the right lower lobe (arrowhead), with a visual quantification of the well aerated lung of 85%. (b) The same image, displaying highlighted in green the well aerated lung and COVID-19 pneumonia in yellow; the analysis of the relative density histogram, quantified an overall well aerated volume of 81%, corresponding to an absolute volume of 3.3 L. (c) The 3D pie-chart showed the proportion of COVID-19 pneumonia and well aerated lung parenchyma. Abbreviations: COVID-19, severe acute respiratory syndrome coronavirus 2 (SARS-CoV-2) disease; CT, computed tomography; 3D, three-dimensional.
An adipose tissue area at T7-T8>262 cm2 was a predictor of the outcome in the two models based on CT software based assessment (in %S-WAL<71% model: OR, 3; 95% CI, 1.4-6.5; in VOL-WAL<2.9L model: OR, 2.6, 95% CI, 1.2-5.8; P<0.01).
Diagnostic performance of the models is reported in Figure 6 and Table 4. The AUC for the clinical model was 0.83 (95% CI, 0.777-0.877) with a R2 of 0.31. The models including clinical parameters and additional CT evaluation both visual and software-based showed higher AUC and R2 as compared to the clinical model (e.g., %V-WAL<73%: AUC 0.86, 95% CI 0.81-0.9, R2 0.36) with the same AUC values for both software approaches (AUC 0.86). The models containing %V-WAL<73% or VOL-WAL<2.9L were superior in terms of performance as compared to the models containing only clinical parameters (P=0.04 for both models).
Figure 6.

Diagnostic performance for prediction of ICU admission or death for patients with COVID-19 based on baseline parameters and chest CT at the emergency department admission. Receive operator characteristic (ROC) curves of the models based on clinical parameters (blue line), clinical parameters and percentage of total lung volume as assessed visually (green line), by software histogram analysis (orange line), and as absolute volume (green dotted line). The area under the ROC curve (AUC) for the clinical model was 0.83 (95% CI, 0.78-0.88). The models including clinical parameters and additional CT evaluation of the well aerated lung parenchyma, both visual and software-based showed higher performance as compared to the clinical model (%V-WAL<73%: AUC 0.86, 95% CI 0.81-0.90; %S-WAL<71%: AUC 0.86, 95% CI 0.80-0.90; VOL-WAL: AUC 0.85, 95% CI 0.81-0.90). Abbreviations: CI, confidence interval; %V-WAL, percentage of well-aerated lung assessed visually; %S-WAL, percentage of well-aerated lung assessed by software; VOL-WAL, absolute volume of well-aerated lung.
Discussion
COVID-19 is associated with a variable prognosis. COVID19 pneumonia requires mechanical ventilation in up to 17% of patients and shows a mortality ranging from 11% to 15% [19, 20]. The results of the present study show that the proportion of well-aerated lung assessed by chest CT obtained in the emergency department was associated with better prognosis for patients with COVID-19 pneumonia independent of other clinical parameters. For example, patients with visually assessed well aerated lung parenchyma (WAL) less than 73% had an odds of 5.4 (95% CI 2.7-10.8) greater likelihood of ICU admission or death even after adjustment for clinical and demographic parameters. Similar overall prognostic performance of WAL was observed for both visual scoring and computer analysis of well-aerated lung, supporting the robustness of the results. Although visual assessment of well-aerated lung had good interobserver agreement (ICC 0.85) in a research setting, automated software measurement of WAL could, in theory, offer greater reliability in the clinic [21].
A model for predicting mortality in viral pneumonia (MuLBSTA) included multi-lobar infiltrate at imaging also predicted death in COVID-19 patients [19, 22]. Several methods of disease extent quantification at chest CT have been proposed, including the extent of emphysema, pulmonary fibrosis, and acute respiratory distress syndrome (ARDS) [8, 13, 23-25]. CT score of the burden of lung disease was previously reported as a risk factor for mortality in ARDS [8]. However, there is scarce data on the prognostic value of CT in COVID-19. A visual semi-quantitative quantification of disease extent at CT correlated with clinical severity [26]. However, underlying lung abnormalities (e.g. emphysema or lung fibrosis) were not included prior estimates of lung disease burden.
Well ventilated regions of the lung may be a surrogate of residual respiratory function [6]. Furthermore, the aerated lung in ARDS is substantially reduced in volume and might represent an important parameter for appropriate setting of mechanical ventilation main parameters, such as tidal volume (Vt) and positive end-expiratory pressure (PEEP) [27]. To prevent the ventilation-induced lung injury (VILI), Vt/aerated lung (defined “baby lung”) ratio should be applied rather than Vt/kg ratio because it allows to maintain stress and strain within physiological limits, as reported by Gattinoni et al. [27]. This parameter can be calculated only by software. In ARDS, a ratio less than 40% between well-aerated lung region by CT and predicted total lung capacity were associated with a higher risk of death [6].
Considering the substantial rate of ARDS in COVID-19 patients (17%), we hypothesized the volume of well aerated lung at admission CT may stratify severity of disease. We tested patients at emergency department admission to predict ICU admission or death. Notably, ARDS criteria were not fulfilled at admission CT. Further, our proposed cut-off of 70-75% well aerated lung parenchyma is considerably higher than 40% reported in literature to assess prognosis in ARDS patients [6]. We used density threshold different than what suggested previously for ARDS, namely range form -900HU indicating nearly 90% gas and 10% tissue to -500HU indicating 50% gas and 50% tissue [28]. Again, our -950 to -700 HU range is intended for patients with respiratory function at self-referral and indeed our definition reflects lung approximately completely ventilated as compared to severely compromised aerated lung in ARDS [14].
Our results also showed an association between adipose tissue area and worse outcome. Body mass index (BMI) was not routinely recorded in our emergency department setting. However, obesity has been described as a common comorbidity in patient hospitalized for H1N1 influenza infection [29]. Previous observations suggest COVID-19 will likely have a more severe course in obese patients [30]. For this reason, CT evaluation of adipose tissue could be an objective hallmark of obesity with prognostic significance.
The study has several limitations. First, it is a retrospective analysis from a single center. Second, no spirometric gating in the acquisition of chest CT images was used due to the emergency setting for chest. Best et al. previously suggested that spirometric standardization might not be necessary for routine CT volume assessment [31]. Third, the inter-rater agreement for the software-based quantification was not calculated but is expected to be high for lung fibrosis [32]. Fourth, the body size was not calculated.
In conclusion, both visual and software-based quantification of the well aerated lung on chest CT obtained in the emergency setting were independent predictors of ICU admission or death in patients with COVID-19. Quantitative assessment of the extent of lung involvement by COVID-19 pneumonia may be useful for routine patient management.
Institution from which the work originated
“Guglielmo da Saliceto” Hospital, Via Taverna 49, 29121, Piacenza, Italy (IT).
Abbreviations:
- SARS-CoV-2
- severe acute respiratory syndrome coronavirus 2
- COVID-19
- coronavirus disease 19
- RT-PCR
- reverse-transcription polymerase chain reaction
- WOG
- worse outcome group
- N-WOG
- not-worse outcome group
- %V-WAL
- visual assessment of well aerated lung percentage
- %S-WAL
- software-based assessment of well aerated lung percentage
- VOL-WAL
- open-source software assessment of well aerated lung absolute volume
- AT
- adipose tissue
References
- 1.Li Q, Guan X, Wu P, Wang X, Zhou L, Tong Y, Ren R, Leung KSM, Lau EHY, Wong JY, Xing X, Xiang N, Wu Y, Li C, Chen Q, Li D, Liu T, Zhao J, Liu M, Tu W, Chen C, Jin L, Yang R, Wang Q, Zhou S, Wang R, Liu H, Luo Y, Liu Y, Shao G, Li H, Tao Z, Yang Y, Deng Z, Liu B, Ma Z, Zhang Y, Shi G, Lam TTY, Wu JT, Gao GF, Cowling BJ, Yang B, Leung GM, Feng Z. Early Transmission Dynamics in Wuhan, China, of Novel Coronavirus-Infected Pneumonia. N Engl J Med. 2020 Mar 26;382(13):1199-1207. doi: 10.1056/NEJMoa2001316. [DOI] [PMC free article] [PubMed] [Google Scholar]
- 2.American College of Radiology (ACR) . ACR Recommendations for the use of chest radiography and computed tomography (CT) for suspected COVID-19 Infection. https://www.acr.org/Advocacy-and-Economics/ACR-Position-Statements/Recommendations-for-Chest-Radiography-and-CT-for-Suspected-COVID19-Infection. Published March 11, 2020. Accessed April 1, 2020.
- 3.Sverzellati N, Milanese G, Milone F, Balbi M, Ledda RE, Silva M. Integrated Radiologic Algorithm for COVID-19 Pandemic. J Thorac Imaging. 2020 Apr 7. doi: 10.1097/RTI.0000000000000516. Epub ahead of print. [DOI] [PMC free article] [PubMed] [Google Scholar]
- 4.Li K, Fang Y, Li W, Pan C, Qin P, Zhong Y, Liu X, Huang M, Liao Y, Li S. CT image visual quantitative evaluation and clinical classification of coronavirus disease (COVID-19). Eur Radiol. 2020 Mar 25. doi: 10.1007/s00330-020-06817-6. Epub ahead of print. [DOI] [PMC free article] [PubMed] [Google Scholar]
- 5.Huang L, Han R, Ai T, Yu P, Kang H, Tao Q, Xia L. Serial Quantitative Chest CT Assessment of COVID-19: Deep-Learning Approach. Radiology 2020. doi: 10.1148/ryct.2020200075. Epub ahead of print. [DOI] [PMC free article] [PubMed] [Google Scholar]
- 6.Nishiyama A, Kawata N, Yokota H, Sugiura T, Matsumura Y, Higashide T, Horikoshi T, Oda S, Tatsumi K, Uno T. A predictive factor for patients with acute respiratory distress syndrome: CT lung volumetry of the well-aerated region as an automated method. Eur J Radiol. 2020;122:108748. doi: 10.1016/j.ejrad.2019.108748. [DOI] [PubMed] [Google Scholar]
- 7.Gattinoni L, Caironi P, Cressoni M, Chiumello D, Ranieri VM, Quintel M, Russo S, Patroniti N, Cornejo R, Bugedo G. Lung recruitment in patients with the acute respiratory distress syndrome. N Engl J Med. 2006 Apr 27;354(17):1775-86. doi: 10.1056/NEJMoa052052. [DOI] [PubMed] [Google Scholar]
- 8.Rubin GD, Ryerson CJ, Haramati LB, Sverzellati N, Kanne JP, Raoof S, Schluger NW, Volpi A, Yim JJ, Martin IBK, Anderson DJ, Kong C, Altes T, Bush A, Desai SR, Goldin J, Goo JM, Humbert M, Inoue Y, Kauczor HU, Luo F, Mazzone PJ, Prokop M, Remy-Jardin M, Richeldi L, Schaefer-Prokop CM, Tomiyama N, Wells AU, Leung AN. The Role of Chest Imaging in Patient Management during the COVID-19 Pandemic: A Multinational Consensus Statement from the Fleischner Society. Radiology. 2020 Apr 7:201365. doi: 10.1148/radiol.2020201365. Epub ahead of print. [DOI] [PMC free article] [PubMed] [Google Scholar]
- 9.Ichikado K, Muranaka H, Gushima Y, Kotani T, Nader HM, Fujimoto K, Johkoh T, Iwamoto N, Kawamura K, Nagano J, Fukuda K, Hirata N, Yoshinaga T, Ichiyasu H, Tsumura S, Kohrogi H, Kawaguchi A, Yoshioka M, Sakuma T, Suga M. Fibroproliferative changes on high-resolution CT in the acute respiratory distress syndrome predict mortality and ventilator dependency: a prospective observational cohort study. BMJ Open. 2012 Mar 1;2(2):e000545. doi: 10.1136/bmjopen-2011-000545. [DOI] [PMC free article] [PubMed] [Google Scholar]
- 10.Edey AJ, Devaraj AA, Barker RP, Nicholson AG, Wells AU, Hansell DM. Fibrotic idiopathic interstitial pneumonias: HRCT findings that predict mortality. Eur Radiol. 2011 Aug;21(8):1586-93. doi: 10.1007/s00330-011-2098-2. [DOI] [PubMed] [Google Scholar]
- 11.Cottin V, Hansell DM, Sverzellati N, Weycker D, Antoniou KM, Atwood M, Oster G, Kirchgaessler KU, Collard HR, Wells AU. Effect of Emphysema Extent on Serial Lung Function in Patients with Idiopathic Pulmonary Fibrosis. Am J Respir Crit Care Med. 2017 Nov 1;196(9):1162-1171. doi: 10.1164/rccm.201612-2492OC. [DOI] [PubMed] [Google Scholar]
- 12.Simpson S, Kay FU, Abbara S, Bhalla S, Chung JH, Chung M, Henry TS, Kanne JP, Kligerman S, Ko JP, Litt H. Radiological Society of North America Expert Consensus Statement on Reporting Chest CT Findings Related to COVID-19. Endorsed by the Society of Thoracic Radiology, the American College of Radiology, and RSNA. Radiology. 2020. doi: 10.1148/ryct.2020200152. [DOI] [PMC free article] [PubMed] [Google Scholar]
- 13.Fedorov A, Beichel R, Kalpathy-Cramer J, Finet J, Fillion-Robin JC, Pujol S, Bauer C, Jennings D, Fennessy F, Sonka M, Buatti J, Aylward S, Miller JV, Pieper S, Kikinis R. 3D Slicer as an image computing platform for the Quantitative Imaging Network. Magn Reson Imaging. 2012 Nov;30(9):1323-41. doi: 10.1016/j.mri.2012.05.001. [DOI] [PMC free article] [PubMed] [Google Scholar]
- 14.Chen A, Karwoski RA, Gierada DS, Bartholmai BJ, Koo CW. Quantitative CT Analysis of Diffuse Lung Disease. Radiographics. 2020 Jan-Feb;40(1):28-43. doi: 10.1148/rg.2020190099. [DOI] [PubMed] [Google Scholar]
- 15.Matsuoka S, Yamashiro T, Matsushita S, Kotoku A, Fujikawa A, Yagihashi K, Nakajima Y. Quantitative CT evaluation in patients with combined pulmonary fibrosis and emphysema: correlation with pulmonary function. Acad Radiol. 2015 May;22(5):626-31. doi: 10.1016/j.acra.2015.01.008. [DOI] [PubMed] [Google Scholar]
- 16.Tong Y, Udupa JK, Torigian DA, Odhner D, Wu C, Pednekar G, Palmer S, Rozenshtein A, Shirk MA, Newell JD, Porteous M, Diamond JM, Christie JD, Lederer DJ. Chest Fat Quantification via CT Based on Standardized Anatomy Space in Adult Lung Transplant Candidates. PLoS One. 2017 Jan 3;12(1):e0168932. doi: 10.1371/journal.pone.0168932. [DOI] [PMC free article] [PubMed] [Google Scholar]
- 17.Koo TK, Li MY. A Guideline of Selecting and Reporting Intraclass Correlation Coefficients for Reliability Research. [Erratum in: J Chiropr Med. 2017;16(4):346.] J Chiropr Med. 2016 Jun;15(2):155-63. doi: 10.1016/j.jcm.2016.02.012. [DOI] [PMC free article] [PubMed] [Google Scholar]
- 18.DeLong ER, DeLong DM, Clarke-Pearson DL. Comparing the areas under two or more correlated receiver operating characteristic curves: a nonparametric approach. Biometrics. 1988 Sep;44(3):837-45. [PubMed] [Google Scholar]
- 19.Chen N, Zhou M, Dong X, Qu J, Gong F, Han Y, Qiu Y, Wang J, Liu Y, Wei Y, Xia J, Yu T, Zhang X, Zhang L. Epidemiological and clinical characteristics of 99 cases of 2019 novel coronavirus pneumonia in Wuhan, China: a descriptive study. Lancet. 2020 Feb 15;395(10223):507-513. doi: 10.1016/S0140-6736(20)30211-7. [DOI] [PMC free article] [PubMed] [Google Scholar]
- 20.Huang C, Wang Y, Li X, Ren L, Zhao J, Hu Y, Zhang L, Fan G, Xu J, Gu X, Cheng Z, Yu T, Xia J, Wei Y, Wu W, Xie X, Yin W, Li H, Liu M, Xiao Y, Gao H, Guo L, Xie J, Wang G, Jiang R, Gao Z, Jin Q, Wang J, Cao B. . Clinical features of patients infected with 2019 novel coronavirus in Wuhan, China. [Erratum in: Lancet. 2020;395(10223):496.] Lancet. 2020 Feb 15;395(10223): 497-506. doi: 10.1016/S0140-6736(20)30183-5. [DOI] [PMC free article] [PubMed] [Google Scholar]
- 21.Yoon RG, Seo JB, Kim N, Lee HJ, Lee SM, Lee YK, Song JW, Song JW, Kim DS. Quantitative assessment of change in regional disease patterns on serial HRCT of fibrotic interstitial pneumonia with texture-based automated quantification system. Eur Radiol. 2013 Mar;23(3):692-701. doi: 10.1007/s00330-012-2634-8. [DOI] [PubMed] [Google Scholar]
- 22.Guo L, Wei D, Zhang X, Wu Y, Li Q, Zhou M, Qu J. Clinical Features Predicting Mortality Risk in Patients With Viral Pneumonia: The MuLBSTA Score. Front Microbiol. 2019 Dec 3;10:2752. doi: 10.3389/fmicb.2019.02752. [DOI] [PMC free article] [PubMed] [Google Scholar]
- 23.Sverzellati N, Odone A, Silva M, Polverosi R, Florio C, Cardinale L, Cortese G, Addonisio G, Zompatori M, Dalpiaz G, Piciucchi S, Larici AR; Italian Structured Report on Fibrosing Lung Disease Consort. Structured reporting for fibrosing lung disease: a model shared by radiologist and pulmonologist. Radiol Med. 2018 Apr;123(4):245-253. doi: 10.1007/s11547-017-0835-6. [DOI] [PMC free article] [PubMed] [Google Scholar]
- 24.Mohamed Hoesein FA, de Hoop B, Zanen P, Gietema H, Kruitwagen CL, van Ginneken B, Isgum I, Mol C, van Klaveren RJ, Dijkstra AE, Groen HJ, Boezen HM, Postma DS, Prokop M, Lammers JW. CT-quantified emphysema in male heavy smokers: association with lung function decline. Thorax. 2011 Sep;66(9):782-7. doi: 10.1136/thx.2010.145995. [DOI] [PubMed] [Google Scholar]
- 25.Maldonado F, Moua T, Rajagopalan S, Karwoski RA, Raghunath S, Decker PA, Hartman TE, Bartholmai BJ, Robb RA, Ryu JH. Automated quantification of radiological patterns predicts survival in idiopathic pulmonary fibrosis. Eur Respir J. 2014 Jan;43(1):204-12. doi: 10.1183/09031936.00071812. [DOI] [PubMed] [Google Scholar]
- 26.Yang R, Li X, Liu H, Zhen Y, Zhang X, Xiong Q, Luo Y, Gao C, Zeng W. Chest CT Severity Score: An Imaging Tool for Assessing Severe COVID-19. Radiology 2020. doi:10.1148/ryct.2020200047. [DOI] [PMC free article] [PubMed] [Google Scholar]
- 27.Gattinoni L, Pesenti A. The concept of “baby lung”. Intensive Care Med. 2005 Jun;31(6):776-84. doi: 10.1007/s00134-005-2627-z. [DOI] [PubMed] [Google Scholar]
- 28.Gattinoni L, Pesenti A, Avalli L, Rossi F, Bombino M. Pressure-volume curve of total respiratory system in acute respiratory failure. Computed tomographic scan study. Am Rev Respir Dis. 1987 Sep;136(3):730-6. doi: 10.1164/ajrccm/136.3.730. [DOI] [PubMed] [Google Scholar]
- 29.Venkata C, Sampathkumar P, Afessa B. Hospitalized patients with 2009 H1N1 influenza infection: the Mayo Clinic experience. Mayo Clin Proc. 2010 Sep;85(9):798-805. doi: 10.4065/mcp.2010.0166. [DOI] [PMC free article] [PubMed] [Google Scholar]
- 30.Dietz W, Santos-Burgoa C. Obesity and its Implications for COVID-19 Mortality. Obesity (Silver Spring). 2020 Apr 1. doi: 10.1002/oby.22818. Epub ahead of print. [DOI] [PubMed] [Google Scholar]
- 31.Best AC, Meng J, Lynch AM, Bozic CM, Miller D, Grunwald GK, Lynch DA. Idiopathic pulmonary fibrosis: physiologic tests, quantitative CT indexes, and CT visual scores as predictors of mortality. Radiology. 2008 Mar;246(3):935-40. doi: 10.1148/radiol.2463062200. [DOI] [PubMed] [Google Scholar]
- 32.Wang J, Li F, Li Q. Automated segmentation of lungs with severe interstitial lung disease in CT. Med Phys. 2009 Oct;36(10):4592-9. doi: 10.1118/1.3222872. [DOI] [PMC free article] [PubMed] [Google Scholar]