Abstract
Single-molecule approaches provide a valuable tool in the arsenal of the modern biologist, and new discoveries continue to be made possible through the use of these state-of-the-art technologies. However, it can be inherently difficult to obtain statistically relevant data from experimental approaches specifically designed to probe individual reactions. This problem is compounded with more complex biochemical reactions, heterogeneous systems, and/or reactions requiring the use of long DNA substrates. Here we give an overview of a technology developed in our laboratory, which relies upon simple micro- or nanofabricated structures in combination with “bio-friendly” lipid bilayers, to align thousands of long DNA molecules into defined patterns on the surface of a microfluidic sample chamber. We call these “DNA curtains,” and we have developed several different versions varying in complexity and DNA substrate configuration, which are designed to meet different experimental needs. This novel approach to single-molecule imaging provides a powerful experimental platform that offers the potential for concurrent observation of hundreds or even thousands of protein–DNA interactions in real time.
1. Introduction
Single-molecule techniques have grown into important experimental tools for scientists interested in understanding mechanisms involving biological macromolecules. However, while single-molecule approaches can be powerful, they also suffer limitations. For example, it is often challenging to acquire statistically meaningful data, and this problem is compounded with biological systems that are heterogeneous and/or contain rare or transient reaction intermediates. In addition, single-molecule techniques often require that one or more of the reactants under investigation be anchored to a solid support (Visnapuu et al., 2008a,b). Nonspecific interactions with the solid support can render a biological system experimentally inaccessible. Part of our research efforts have been devoted to minimizing these experimental difficulties by developing new methodologies making it possible to organize thousands of individual DNA molecules into defined patterns on optical surfaces coated with “bio-friendly” lipid bilayers that mimic cell membranes (Fazio et al., 2008; Gorman et al., 2010; Granéli et al., 2006; Visnapuu et al., 2008a,b). We call these methodologies “DNA curtains,” and they enable us to image hundreds or even thousands of individual molecules in real time by fluorescence microscopy. This report provides detailed information on these experimental platforms such that they can be replicated by anyone with experience in general laboratory techniques and optical instrumentation.
2. Total Internal Reflection Fluorescence Microscopy
Total internal reflection fluorescence microscopy (TIRFM) uses spatially selective laser excitation to limit fluorescence background (Axelrod, 1989), and a TIRF microscope is our instrument of choice for the types of wide-field fluorescent imaging studies that are described below.
2.1. General description of TIRFM
For TIRFM, a laser beam is directed through a microscope slide and reflected off the interface between the slide and an aqueous buffer (Axelrod, 1989). This spatially selective illumination geometry makes use of the fact that when light is reflected at an interface between a transparent slide and an aqueous buffer of differing refractive indexes, the incident energy is not abruptly reflected, but rather penetrates a few hundred nanometers into the buffer. The practical consequence of this type of illumination is that it yields a very small excitation volume—typically on the order of a few femtoliters. This minimizes excitation of contaminants and molecules in bulk solution, thereby reducing the background signal by several orders of magnitude relative to conventional wide-field illumination techniques. For additional discussion of more detailed aspects of TIRFM, we refer the reader to several excellent reviews (Axelrod, 1989; Forkey et al., 2000; Ha, 2001).
2.2. Building a simple prism-type TIRFM
We use a Nikon TE2000U microscope with a simple through-prism illumination configuration. The excitation source is provided by a diode-pumped solid-state laser (DPSSL; 488 nm, 200 mW, Sapphire, Coherent, Inc.), which is focused through the face of a fused silica prism onto a microfluidic flowcell to generate an evanescent wave within the sample chamber. Alignment is controlled by a remotely operated motorized mirror (New Focus, Inc.) that guides the beam to the prism. Photons are collected with a microscope objective (100×, 1.4 NA, oil immersion Plan Apo, Nikon or 60×, 1.2 NA, water immersion Plan Apo, Nikon), passed through a notch filter (Semrock) to block scattered laser light, and detected using a back-illuminated electron-multiplying CCD (EMCCD; Cascade II, Photometrics). When used for multicolor operation, the photons are passed through an image-splitter (Roper Bioscience) containing a dichroic mirror that separates the optical paths. The entire TIRFM system is mounted on an optical table (any standard optical table will suffice for most applications) to minimize vibrations and facilitate mounting of optical components.
2.3. Flowcells and injection system
Our TIRFM experiments are performed within microfluidic flowcells that are machined and assembled in-house (Fig. 14.1). Each flowcell is made from a fused silica glass slide (G. Finkenbeiner, Inc.) and the surface of the slide is prepared with micro- or nanofabricated barrier patterns (see below). Prior to assembly, inlet and outlet holes are bored into each slide, using a diamond-coated 1.4 mm drill bit (Shor International) mounted on a precision drill press (Servo Products Company). The slide is submerged under continuously flowing water while being drilled, which cools the bit and removes fused silica dust. The slides are cleaned by sequential submersion in 2% HELLMANEX™, 1 M NaOH (for 30 min each), and rinsed under running MilliQ™ water between each step. This is followed by a rinse in absolute methanol and drying at 120 °C under vacuum for at least 1 h. The sample chamber is prepared from double-sided tape (3M) placed over the slide, which is overlaid with a borosilicate glass coverslip (Fisher Scientific). The flowcell is clamped between two additional slides to evenly distribute pressure and placed in a 120 °C vacuum oven for 2 h. Inlet and outlet ports (Upchurch Scientific) are glued over the drilled holes. The completed assembly is mounted on a remotely operated stage (Ludl Electronic Products Ltd.), a syringe pump (KD Scientific) is connected to control the rate of buffer flow through the chamber, and a six-way injection valve (SCIVEX) controls sample delivery.
Figure 14.1.
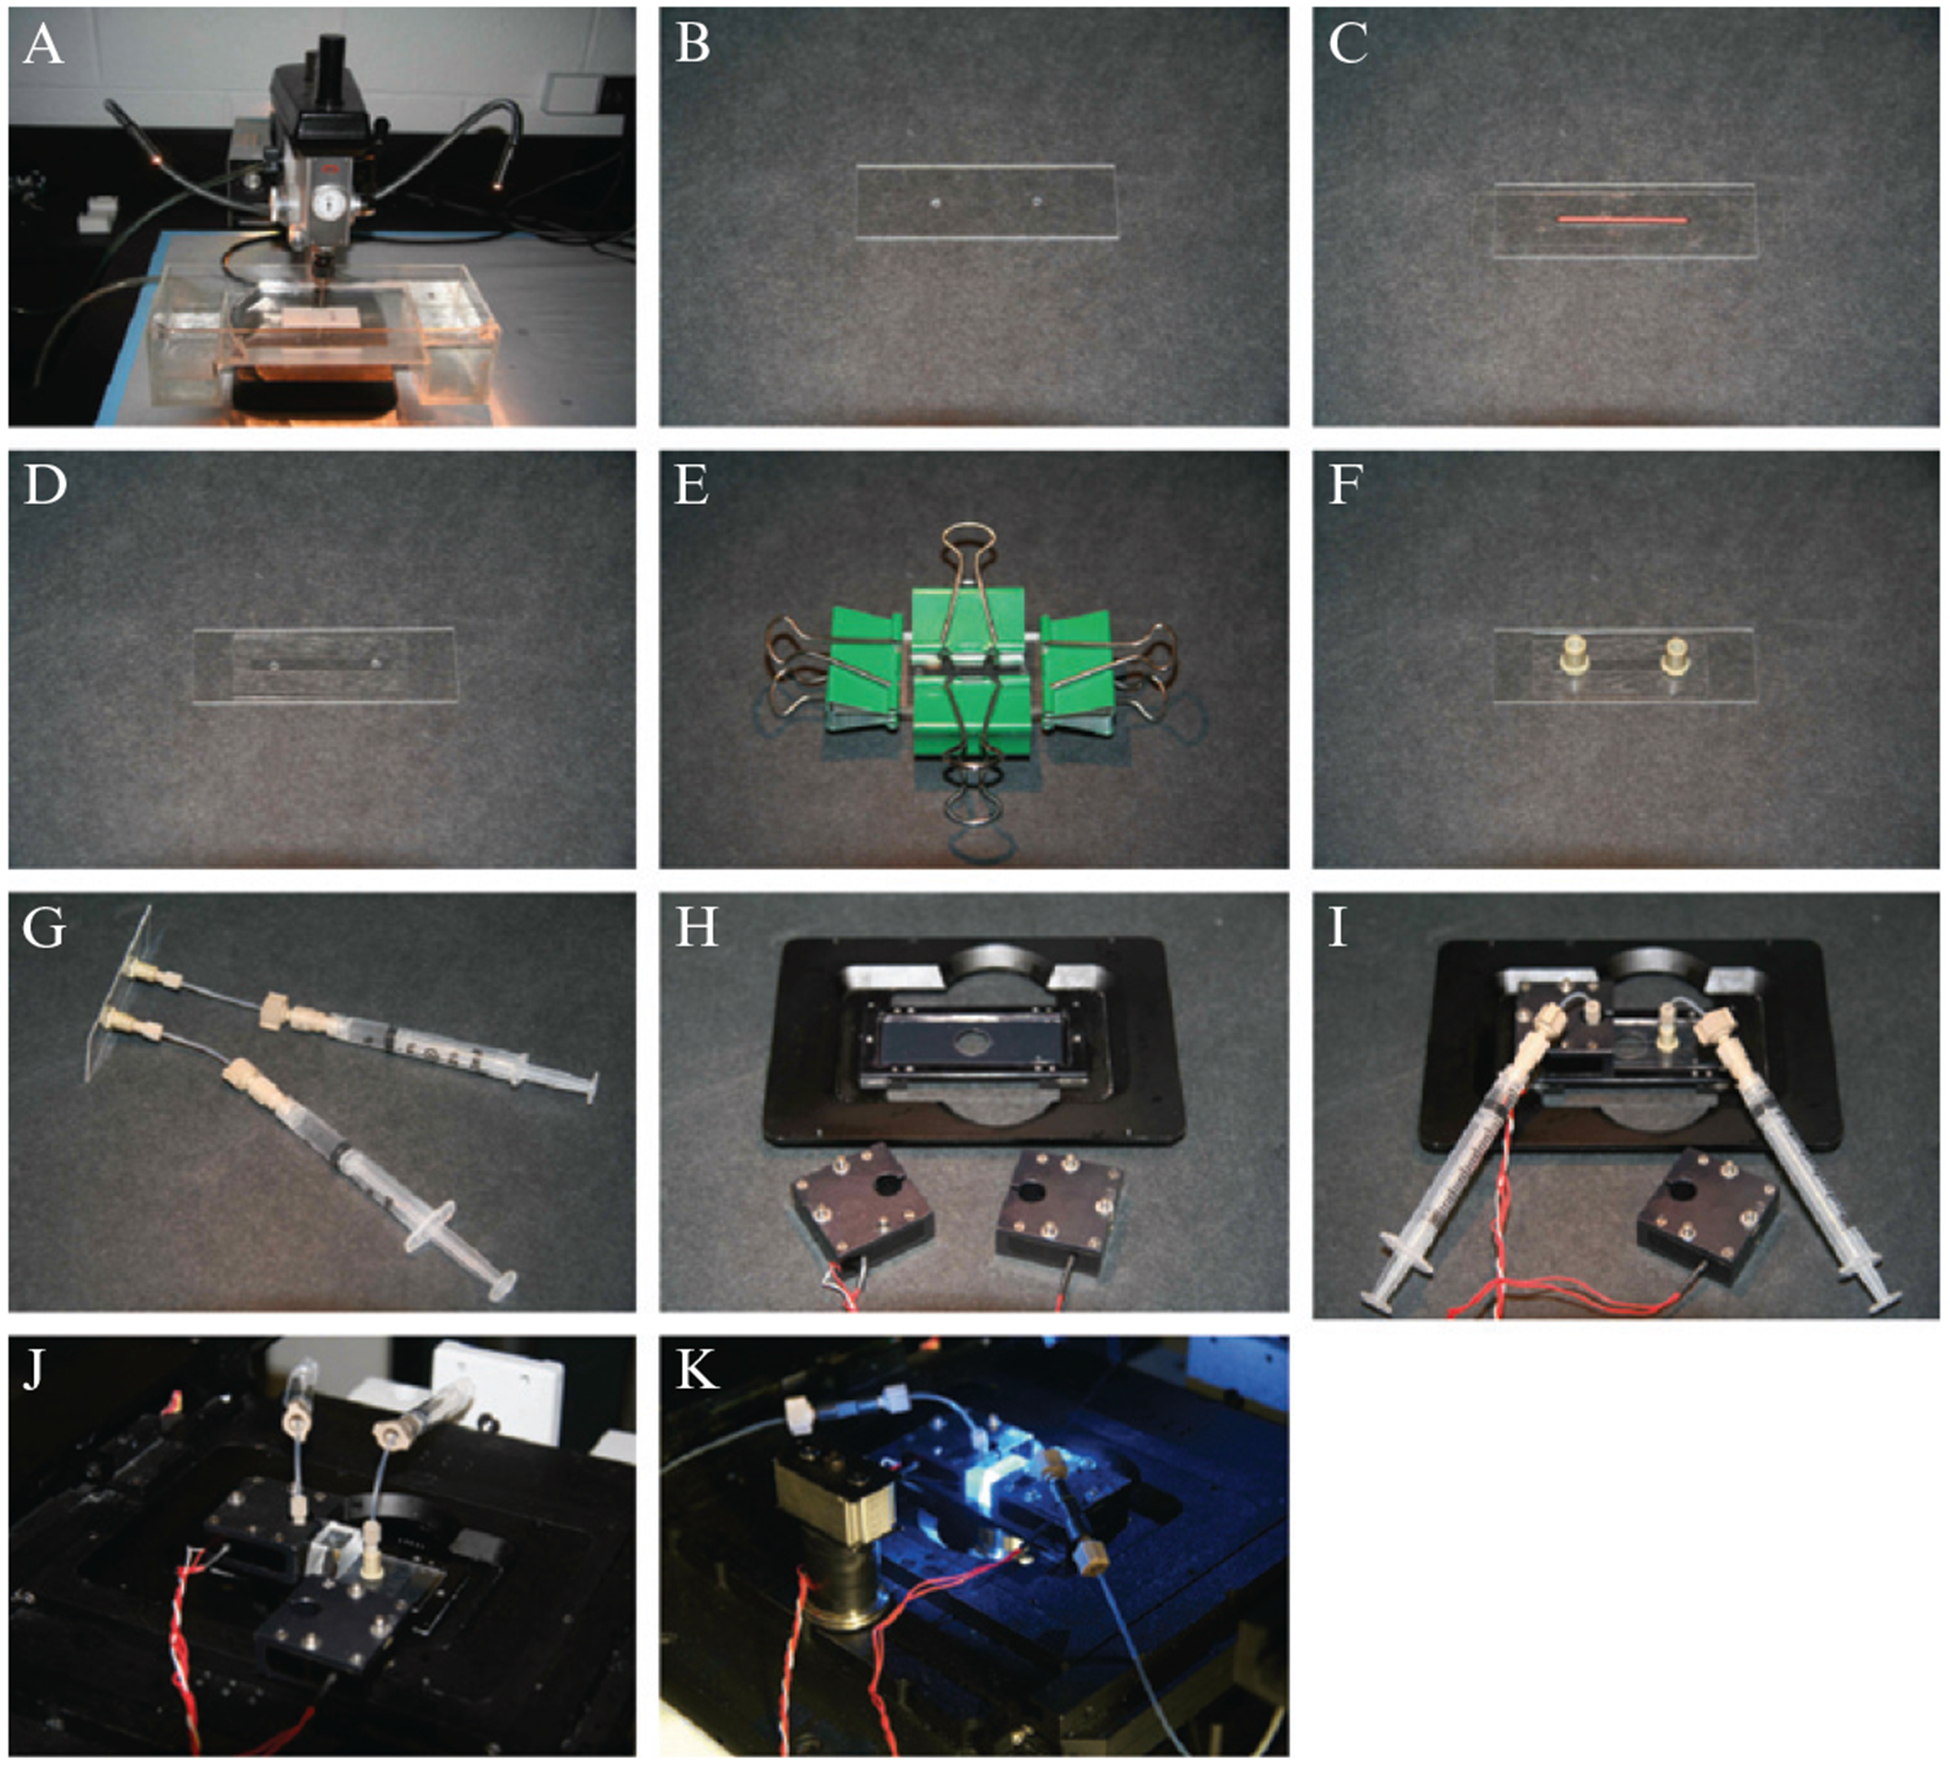
Flowcells: (A) shows the drill used to bore through the fused silica slide glass, and during drilling the slide is immersed in a flowing water bath to remove glass particulates. The slide (B) is then thoroughly cleaned, a narrow strip of paper (red) is used to protect the surface and also serves as a template for the sample chamber, and the surface is covered with double-sided tape (C). A narrow channel is excised around the paper template, and a coverslip is placed over the sample chamber (D). The flowcell is clamped (E) and placed in a vacuum oven to seal the chamber and nanoports are attached (F). Reagents necessary for deposition of the bilayer are injected into the sample chamber using syringes as shown (G). When a flowcell is ready for use, it is positioned on the microscope stage (H) and held in place by heating units as shown in (I), (J) and (K).
3. DNA Curtains
Our studies utilize supported lipid bilayers as a means for passivating the sample chamber surface. The advantages of bilayers over other types of surfaces is that they mimic the cellular environment, can be modified through the incorporation of lipids with alternative head groups, and are easy to deposit on fused silica. Moreover, the use of fluid bilayers, in combination with barriers to lipid diffusion (Cremer and Boxer, 1999; Groves and Boxer, 2002; Groves et al., 1997), have allowed the development of “DNA curtains,” in which hundreds or thousands of DNA molecules can be aligned and imaged (Fazio et al., 2008; Gorman et al., 2010; Granéli et al., 2006; Visnapuu et al., 2008a,b).
3.1. DNA curtains as a method for aligning thousands of DNA molecules
The idea for DNA curtains came from the understanding that DNA molecules anchored to a fluid bilayer would move in the direction of an applied hydrodynamic force. A barrier placed across the path of the moving DNA and oriented perpendicular to the flow force could be used to halt the forward progression of the DNA. This would also cause the DNA molecules to align with one another in the same orientation, which would make it possible to visualize numerous DNA molecules in a single field-of-view.
The general procedure for making DNA curtains is the same regardless of the barrier type (Fazio et al., 2008; Gorman et al., 2010; Granéli et al., 2006; Visnapuu et al., 2008a,b). All lipids are purchased from Avanti Polar Lipids and stored in chloroform at ‒ 20 °C. The chloroform is evaporated prior to liposome preparation using a stream of nitrogen and dried further under vacuum onto the glass wall of a test tube for 2–12 h. Lipids are resuspended in buffer A, which contains 10 mM Tris (pH 8.0) and 100 mM NaCl, at a concentration of 10 mg/ml, and sonicated to form liposomes, which are stored at 4 °C and used within one week of preparation. Liposomes can also be prepared by extrusion through a polycarbonate filter with 100-nm pores (Avanti Polar Lipids, Alabaster, AL); however, we have had more uniform results, using liposomes prepared by sonication. The liposomes are comprised of a mixture of DOPC (1,2-dioleoyl-sn-glycero-phosphocholine), 0.5% (w/v) biotinylated-DPPE (1,2-dipalmitoyl-sn-glycero-3-phosphoethanolamine-N-(cap biotinyl)), and 8% (w/v) mPEG 550-DOPE (1,2-dioleoyl-sn-glycero-3-phosphoethanolamine-N-[methoxy(polyethylene glycol)-550]). The mPEG is necessary only when using quantum dots as fluorescent tags (see below).
For bilayer deposition, liposomes are injected into the sample chamber and incubated for 30 min. Excess liposomes are flushed away with buffer A and incubated for another 30 minutes. The flowcell is then rinsed with buffer B (40 mM Tris–HCl (pH 7.8), 1 mM DTT, 1 mM MgCl2, and 0.2 mg/ml BSA) and incubated for an additional 15 min. Streptavidin (0.02 mg/ml) in buffer A is injected into the sample chamber and incubated for 10 min. Streptavidin binds the biotinylated lipids, providing an attachment point for biotinylated DNA. After rinsing thoroughly with additional buffer B, biotinylated DNA (10 pM) pre-stained with 1–2 nM YOYO1 is injected into the sample chamber, incubated for 10 min, and unbound DNA is removed by flushing with buffer. Our work relies primarily upon the 48.5-kb genome of bacteriophage λ. This DNA is commercially available and contains natural 12-nucleotide overhangs, which can be tagged with complementary oligonucleotides. Application of buffer flow causes the lipid-tethered DNA molecules to align along the diffusion barriers. If the DNA molecules are not evenly aligned along the full length of the barrier edges, then the buffer flow can be paused briefly, allowing the DNA molecules to diffuse away from areas of high density. The flow is then resumed, and the flow on–off cycle is repeated roughly 3–5 times until DNA curtains of even density form at the barriers.
3.2. Manually etched diffusion barriers
Diffusion barriers can be made either by manual etching or by nanofabrication (Fig. 14.2, and described below). Manually etched barriers do not require specialized fabrication instrumentation (we routinely use diamond-tipped drill bits; Granéli et al., 2006). The slide is etched prior to flowcell assembly by lightly dragging the scribe across its surface, and this is done repeatedly to ensure the presence of numerous barriers. Once the etched slide has been cleaned, it can be assembled into a flowcell, as described above. The disadvantages of manually etched barriers are that it is impossible to control barrier width, depth, or location, and the procedure itself can yield barriers of drastically different quality (Fig. 14.3D–I). In practice, the slide is visually scanned after assembly of the DNA curtains to identify areas of sufficient quality for data acquisition.
Figure 14.2.
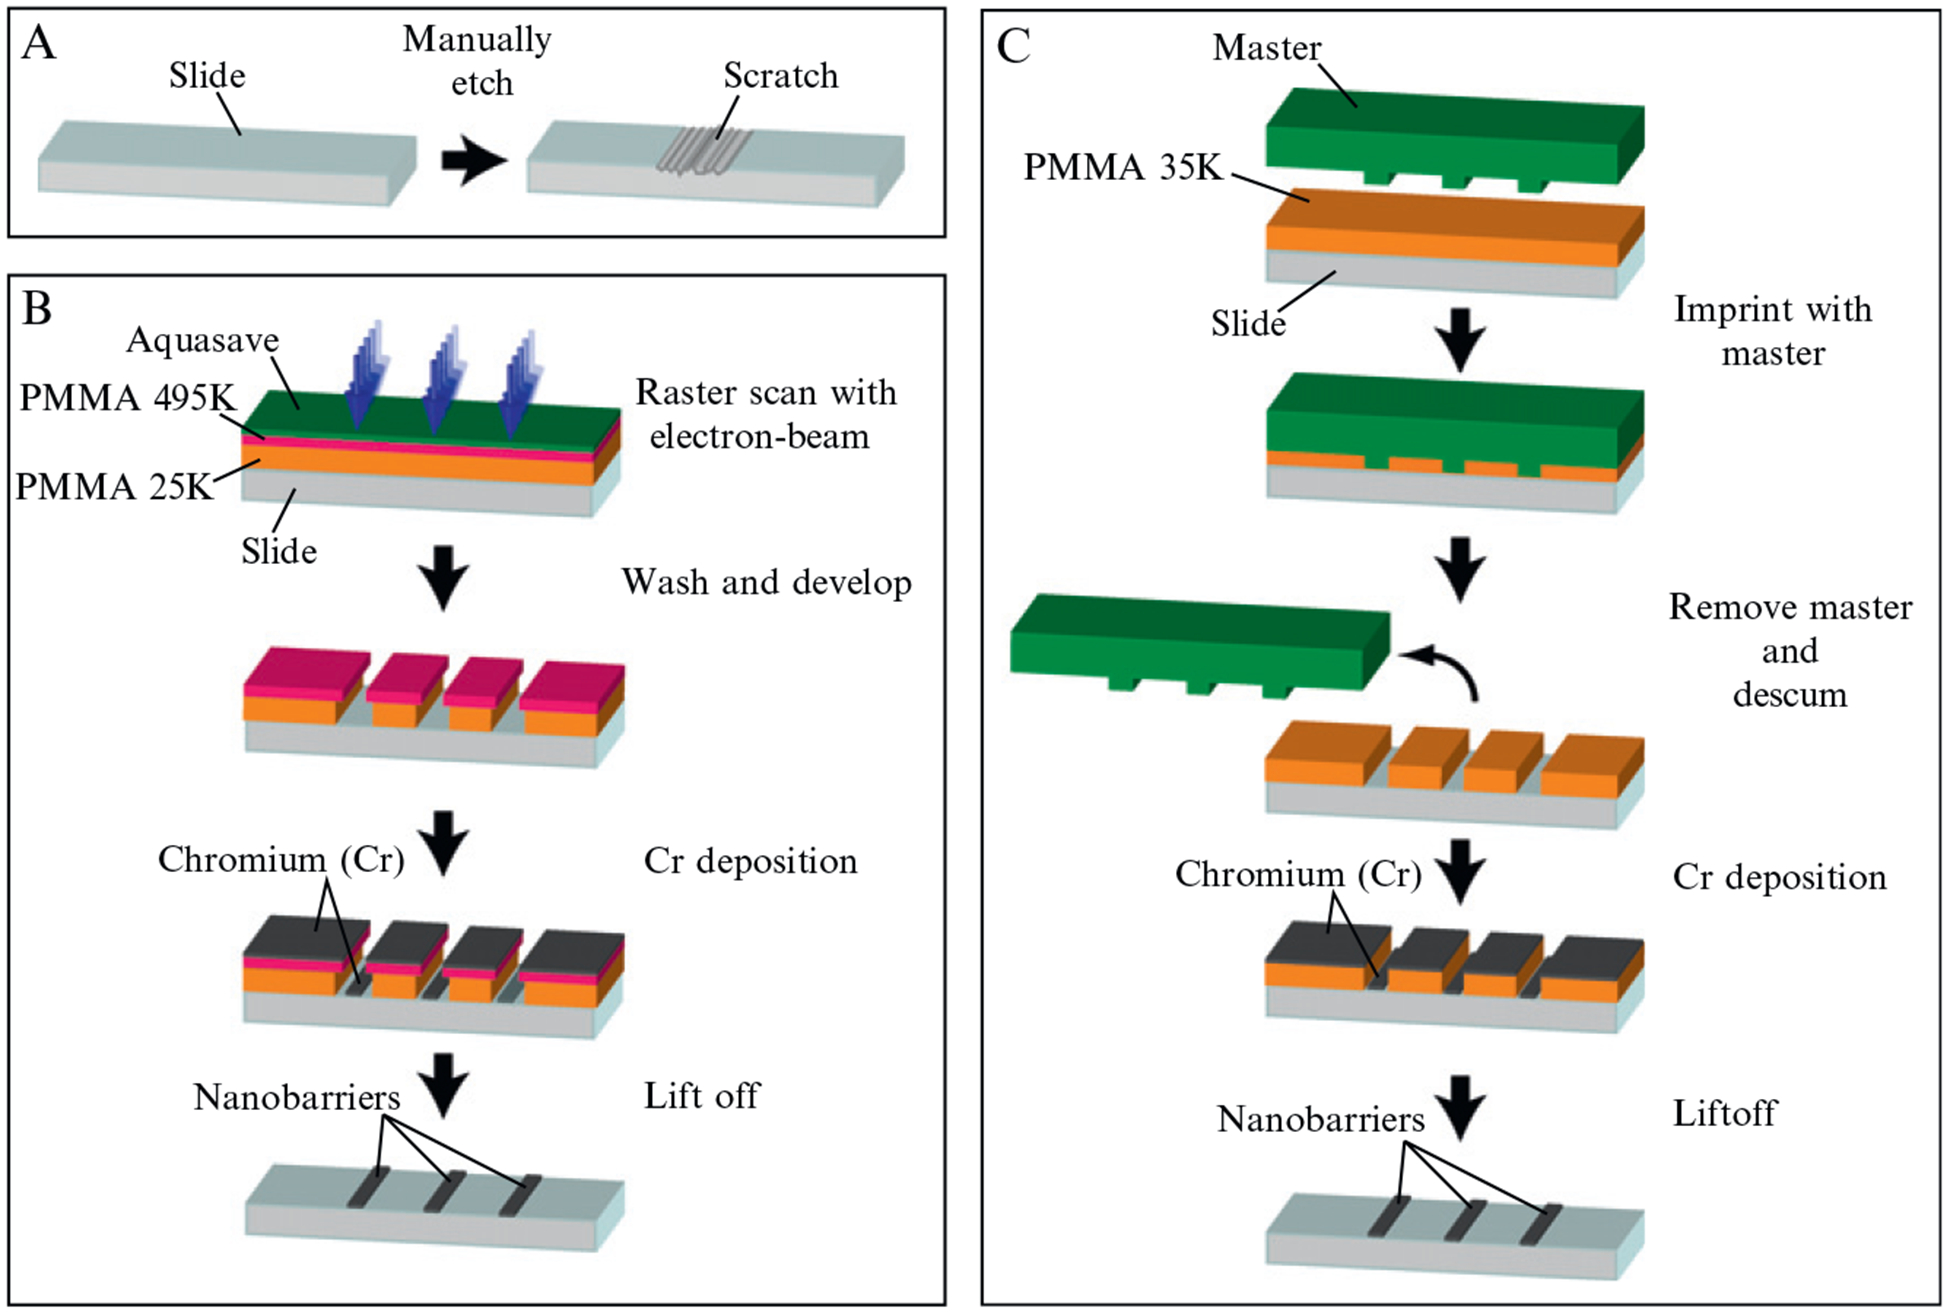
Barriers: (A–C) show simplified diagrams for making barriers by manual etching (A), ebeam lithography (B), or -nanoimprint lithography (C). For manual etching (A), the slide is scratched with a diamond-tipped drill bit. For ebeam lithography (B), the slide is coated with two layers of PMMA, and a layer of Aquasave, and an electron beam is used to etch through these layers. Chromium is deposited on the surface, and the remaining PMMA is removed, leaving behind the nanofabricated barriers. With nanoimprint lithography (C), a master in pressed into the PMMA at high temperature under vacuum. The master is removed, residual PMMA is removed, metal is deposited on the entire surface, and the remaining PMMA is removed, yielding nanofabricated metallic barriers.
Figure 14.3.
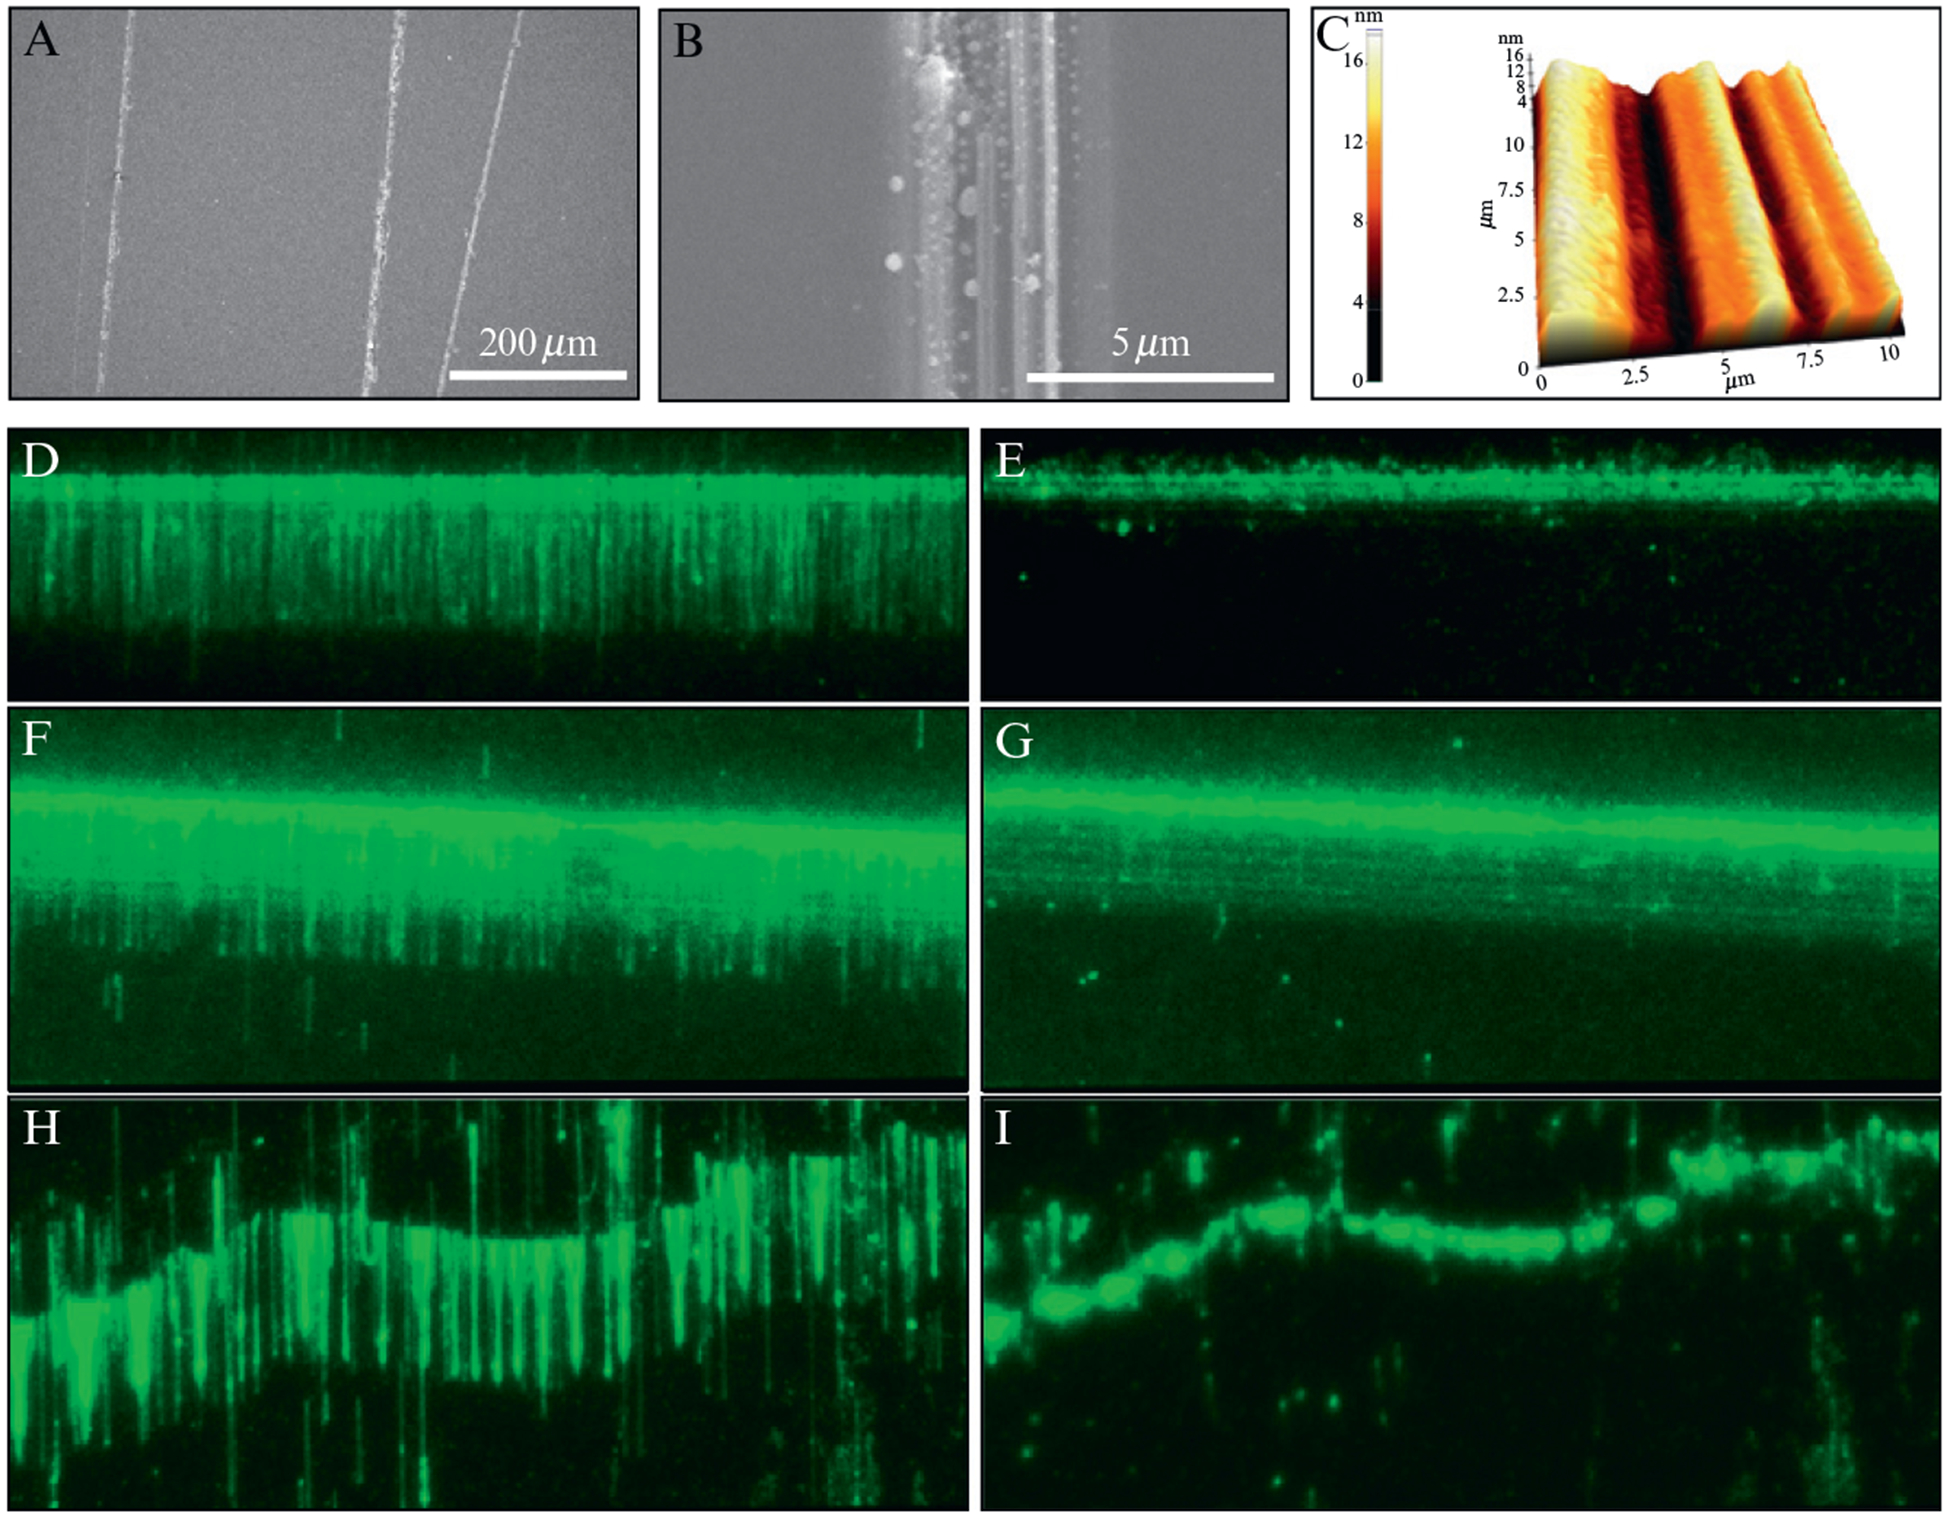
DNA curtains made with manually etched barriers. (A) and (B) show SEM images of typical etched barriers. (C) shows an AFM image of an etched barrier. A good DNA curtain made with YOYO1-stained DNA at a manually etched barrier is shown with and without buffer flow in (D) and (E), respectively. (F) and (G) show a DNA curtain at a barrier that is too wide, with and without buffer flow, respectively. (H) and (I) show curtains at etched barriers that are not straight. In (D) through (I), each field is shown with and without buffer flow; this is a standard control that used to verify that the DNA is only anchored by the biotinylated ends.
3.3. Nanofabricated linear diffusion barriers
Nanofabricated barrier patterns can be made by either electron-beam (ebeam) or nanoimprint lithography, and yield uniform DNA curtains of high quality (Fig. 14.2; Fazio et al., 2008; Gorman et al., 2010; Visnapuu et al., 2008a,b). Both ebeam and nanoimprint lithography offer sub-10-nm pattern precision. However, ebeam lithography is inherently low-throughput because the beam must raster through each pattern individually. With our current setup, it takes 30–45 min to pump down the slide in a vacuum chamber, focus the electron beam, and to raster the beam through an array of preset patterns on a single slide. Development takes approximately 5 min, bringing the total prep time before metal evaporation to 35–50 min. Furthermore, personnel must learn scanning electron microscopy, which typically takes weeks of practice before they are self-sufficient enough to focus and set the beam properly. Ebeam lithography is, however, ideal for prototyping patterns prior to settling on a specific design. Nanoimprint lithography is faster; it takes a total time of approximately 15 min to stamp an array of nanopatterns into resist on a slide and descum any residual resist before metal evaporation. Personnel can learn and practice the entire process in less than a day. Nanoimprint lithography, however, is not without its challenges.The master (designed and patterned by ebeam lithography) must be free of defects. Furthermore, the descum step must be optimized to minimize pattern distortion. Lastly, particle adhesion between the master and polymer resist is always a challenge, even in a cleanroom. Once these obstacles are overcome, nanoimprint lithography offers the potential for large-scale slide manufacture.
3.3.1. Barriers made by ebeam lithography
Slides are cleaned in NanoStrip solution (CyanTek Corp, Fremont, CA) for 20 min, rinsed with acetone and isopropanol, and dried with N2. The slides are then spin-coated with a layer of 3% (w/v) polymethylmethacrylate (PMMA), molecular weight 25,000 Da, in anisole, followed by a layer of 1.5% (w/v) PMMA (495,000 Da), in anisole (MicroChem, Newton, MA), then followed by a final layer of Aquasave conducting polymer (Mitsubishi Rayon). Each layer is spun at 4000 rpm for 45 s using a ramp rate of 300 rpm/s. Barrier patterns are written by ebeam lithography using an FEI Sirion scanning electron microscope equipped with a pattern generator and lithography control system (J. C. Nabity, Inc., Bozeman, MT). The Aquasave is rinsed off with deionized water, and the resist is developed using a 3:1 mixture of isopropanol to methyl isobutyl ketone (MIBK) for 1 min with ultrasonic agitation at 5 °C. The slide is then rinsed in isopropanol and dried with N2. A 15–20-nm layer of gold (Au) atop a 3–5-nm adhesion layer of either chromium (Cr) or titanium (Ti) is deposited using a Semicore electron-beam evaporator. The remaining PMMA layers are removed, in a process called liftoff (Fig. 14.2), by incubating the slide at 80 °C in a 9:1 ratio of methylene chloride to acetone, which exposes the underlying fused silica surface that now harbors the metallic patterns. Alternatively, barriers can be made with a 15–20-nm layer of Cr, and to remove the PMMA, the coated substrate is submerged in a 65-C acetone bath for 30 min, and then gently sonicated. Following liftoff, samples are rinsed with acetone to remove stray metallic flakes and dried with N2. Barrier quality can be assessed with a scanning electron microscope, atomic force microscopy, and/or optical microscopy (Figs. 14.4–14.6).
Figure 14.4.
DNA curtains made with nanofabricated linear barrier patterns. (A) shows an optical image of chromium (Cr) barriers. (B) shows an AFM image of Cr barrier. An SEM image of a typical Cr barrier is shown in (C). (D) and (E) show examples of YOYO1-stained DNA curtains assembled at linear barriers and show the presence and absence of buffer flow, respectively. These barriers were made by ebeam lithography. (F) and (G) show DNA curtains aligned at nanoimprinted barriers. Adapted with permission from Fazio et al. (2008).
Figure 14.6.
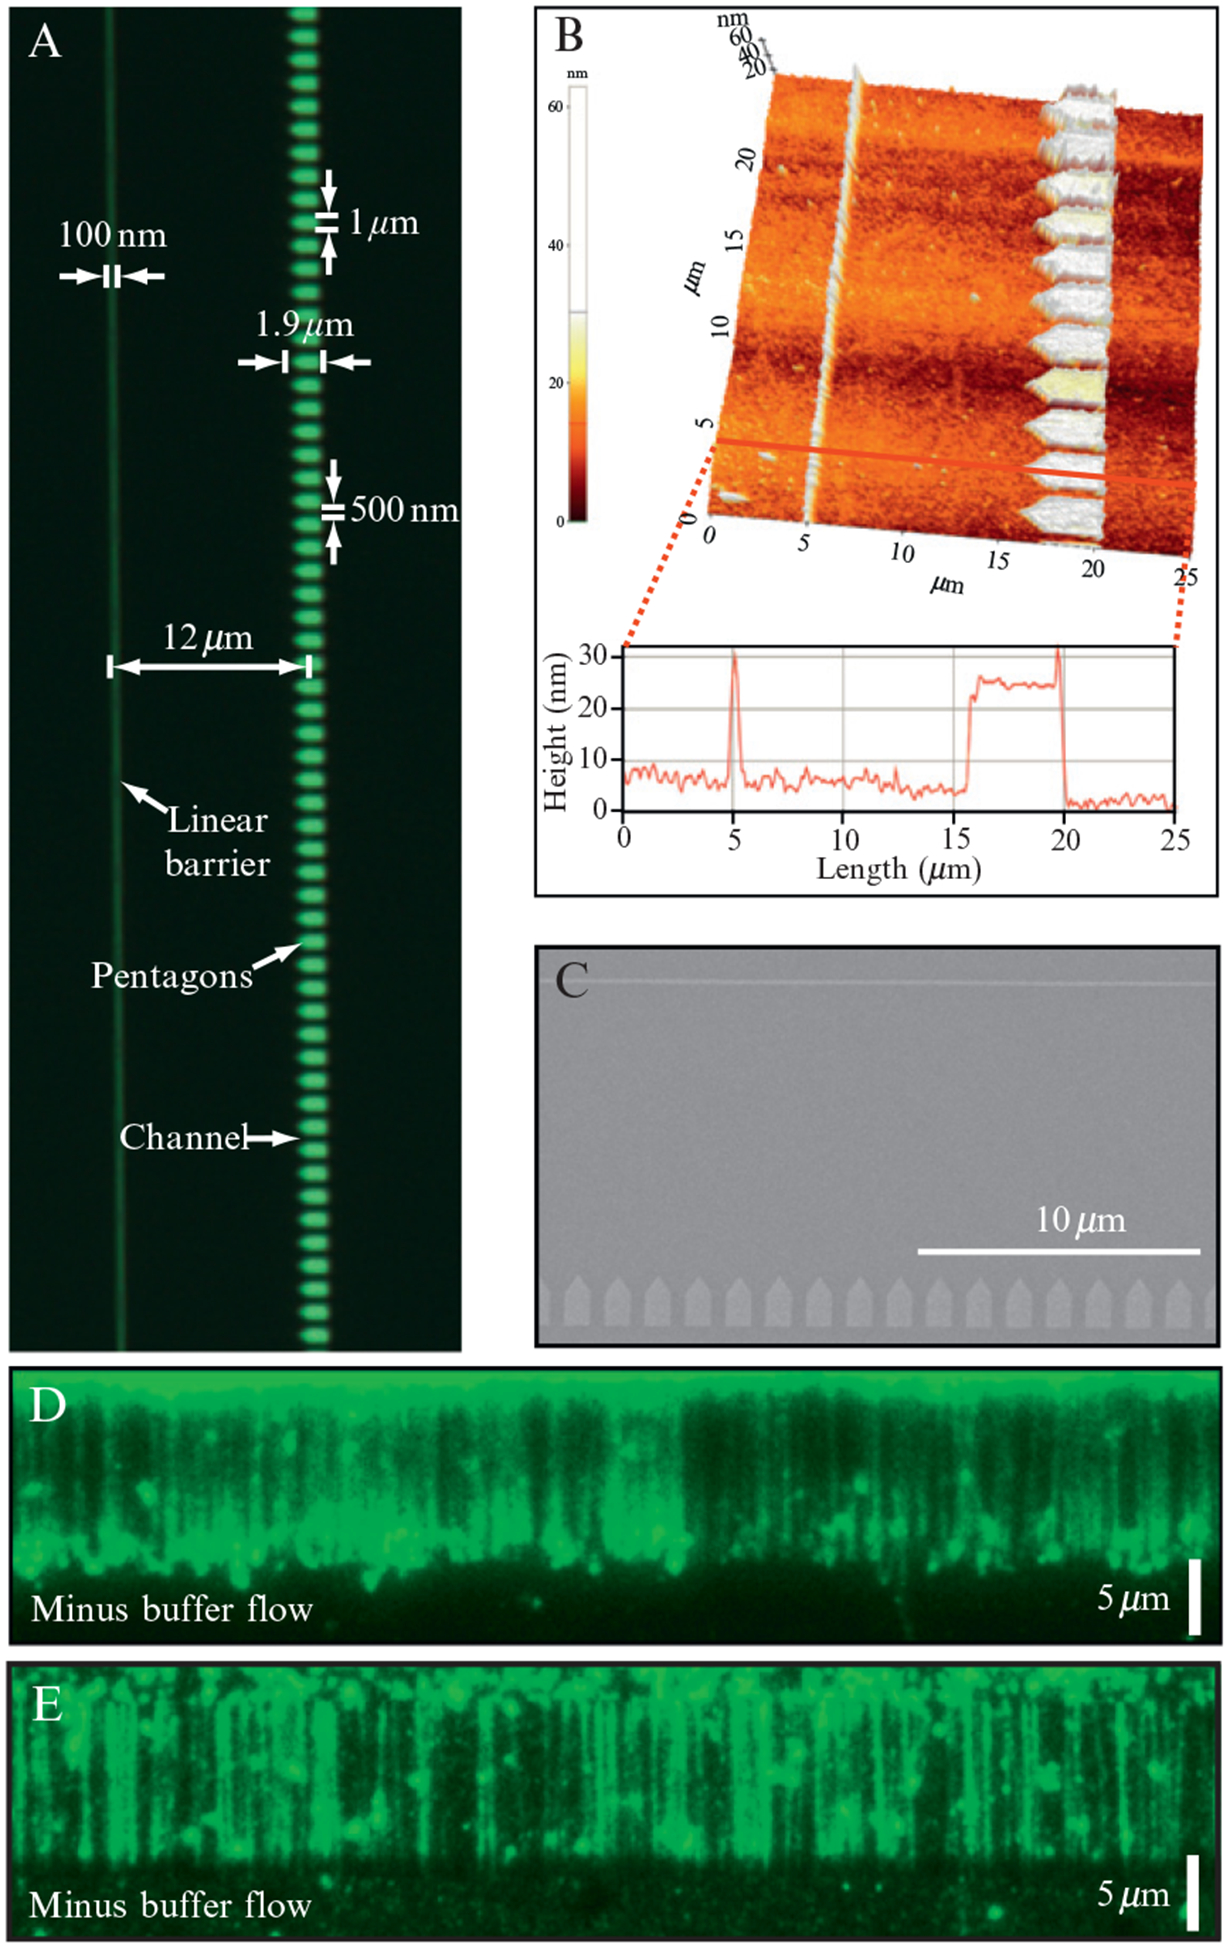
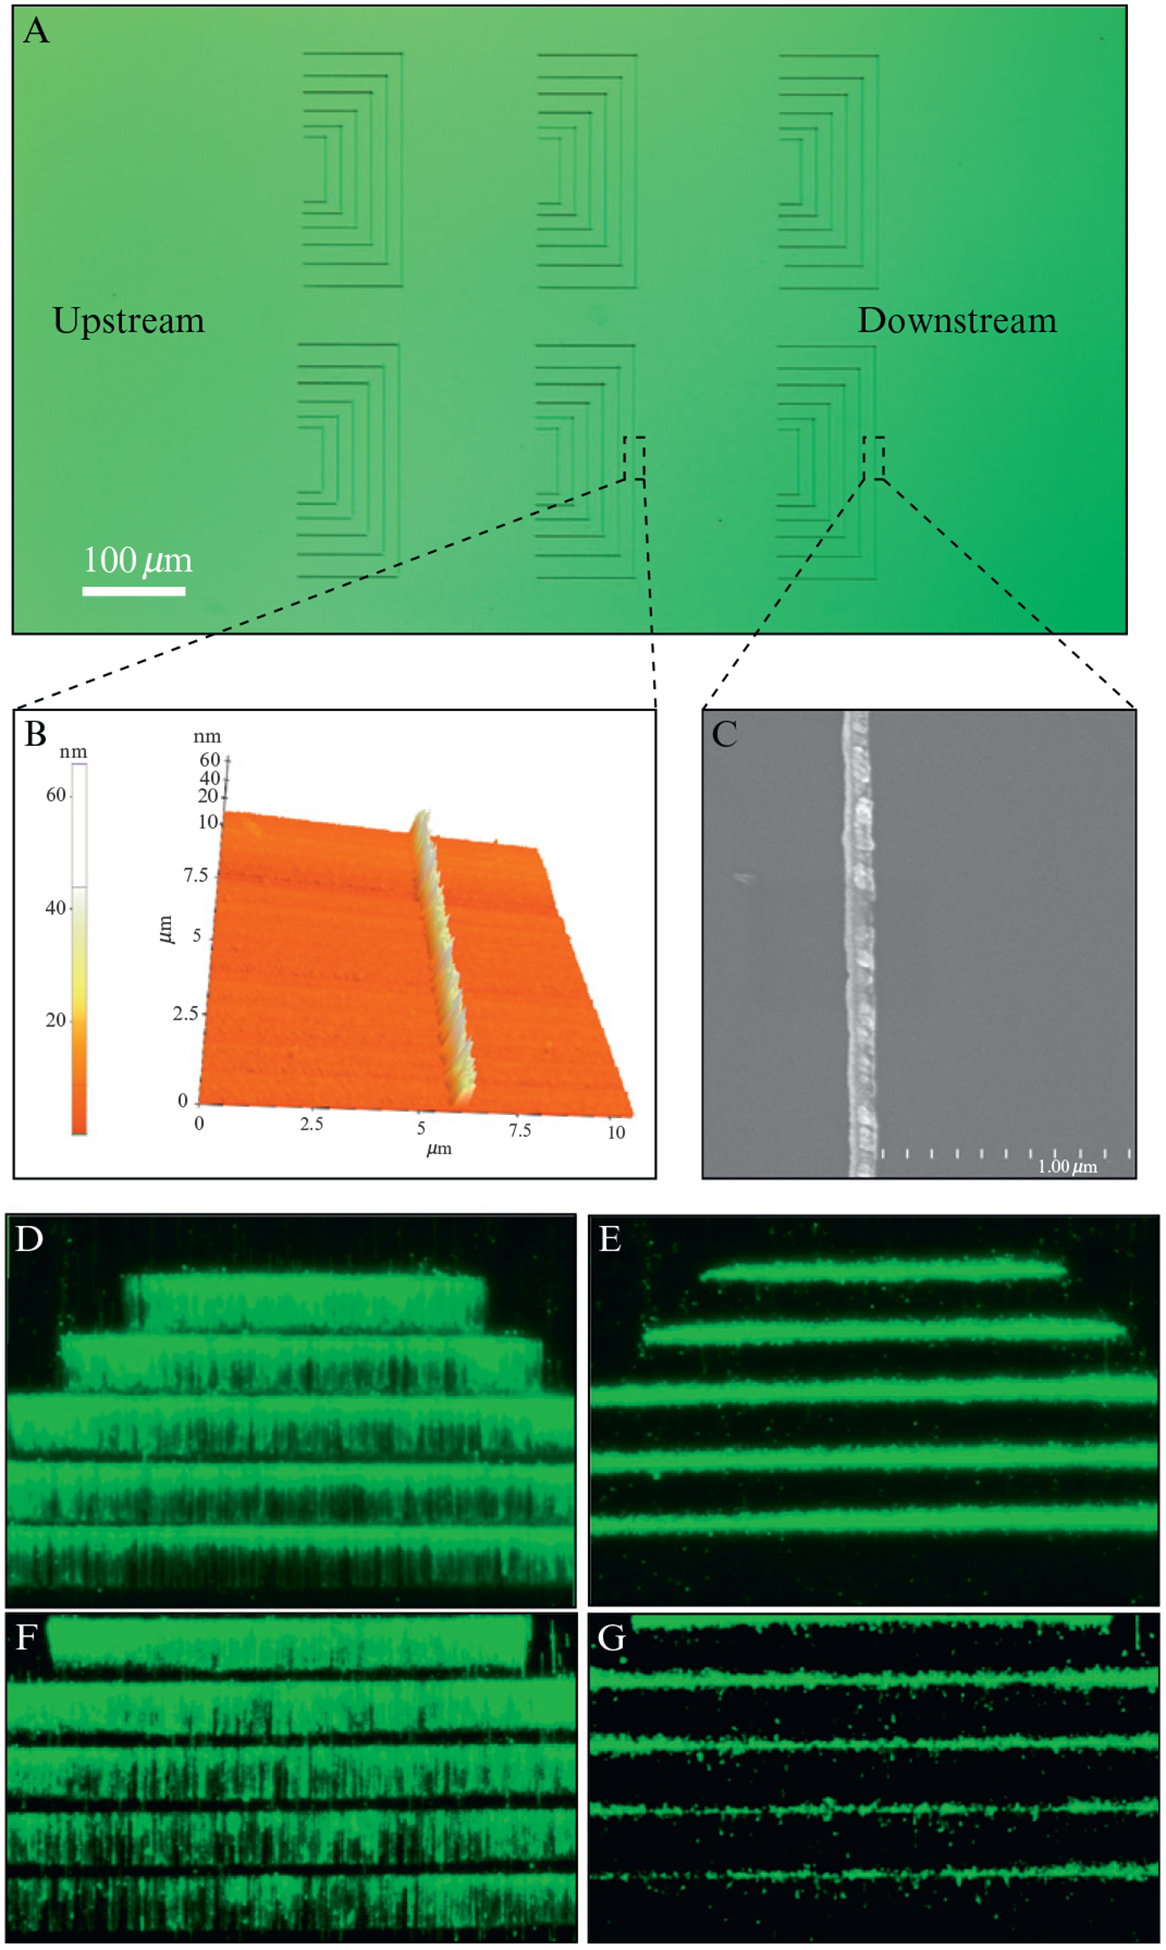
Nanofabricated rack patterns for making “double-tethered” DNA curtains. (A) shows an optical image of a single barrier set and relevant pattern dimensions are indicated. An AFM image of a rack pattern is shown in (B) highlighting the height of the linear barriers and the pentagons as well as the distance between the barrier elements. An SEM image of a rack pattern is shown in (C). Examples of a “double-tethered” DNA curtain stained with YOYO1 are shown in (D) and (E). The “double-tethered” curtain shown in (D) was made by ebeam lithography, and the curtain shown in (E) was made by nanoimprint lithography. Adapted with permission from Gorman et al. (2010).
3.3.2. Barriers made by nanoimprint lithography
Nanoimprint masters (see Fig. 14.2) are fabricated using ebeam lithography, liftoff, and inductively coupled plasma etching. First, a double layer of PMMA (25,000 and 495,000 Da) is spun onto a silicon wafer with a thin coating of silicon dioxide. Patterns are written by an FEI Sirion SEM outfitted with a Nabity Nanopattern Generation System, and then developed in a mixture of isopropanol:methyl isobutyl ketone (3:1) at 5 °C in a bath sonicator. Samples are then rinsed with isopropanol and dried with N2. A Semicore ebeam evaporator is used to vapor deposit 20 nm of Cr onto the masters. Liftoff is performed in acetone at 65 °C. The patterned masters are then plasma-etched to a depth of 100 nm in a mixture of C4F8:O2 (9:1) for 90 s at a power of 300 W using an Oxford ICP etch tool and coated with a fluorinated self-assembled monolayer (Nanonex, Princeton, NJ) to prevent adhesion between the master and PMMA resist.
To make nanoimprinted barriers, PMMA of 35,000 Da (Microresist Technologies, Germany) is spin-coated on a clean fused silica microscope slide and baked on a hotplate for 5 min at 180 °C. Nanoimprinting is performed in two stages: first, a 2-min preimprint phase at a pressure of 120 psi and temperature of 120 °C, followed by a 5-min imprint phase with a pressure of 480 psi and temperature of 190 °C. The second step heats the PMMA above its glass transition temperature and allows it to conform to the mold. After imprinting, any residual PMMA left within the impression made by the mold must be removed by a cleaning step referred to as descum. This descum process is done in an inductively coupled plasma under CHF3:O2 (1:1) and a power of 200 W for 40 s total (two iterations of 20 s). After descum, 15–20 nm of Cr is vapor deposited onto the samples and liftoff is performed in acetone at 65 °C for several hours, followed by bath sonication to remove stray metal flakes. Finally, the nanoimprinted slides are rinsed in acetone and dried with N2.
3.4. More complex barrier patterns
Nanofabrication techniques offer the possibility of making more complex patterns that can be used for organizing the DNA. Below we describe barrier patterns that can control the lateral distribution of individual DNA molecules within the curtains (Visnapuu et al., 2008a,b), and “rack” patterns that can be used to make “double-tethered” substrates in which both ends of the DNA curtain are anchored to the slide surface (Gorman et al., 2010).
3.4.1. Geometric barrier patterns
Linear barriers give no control over the lateral distribution of the DNA molecules within the curtains. The DNA molecules can overlap with one another or they can slip along the barrier edge. However, barriers comprised of a repetitive triangular wave eliminate slippage, and also define the distribution of molecules within the curtain. We refer to these triangular features as nanowells (Fig. 14.5), and the peak-to-peak distance between the nanowells dictates the minimal lateral separation of the DNA molecules that make up the curtain. For example, nanowells that repeat at 500-nm intervals yield DNA molecules separated from one another by no less than 500 nm, provided that sufficiently low DNA concentrations are used.
Figure 14.5.
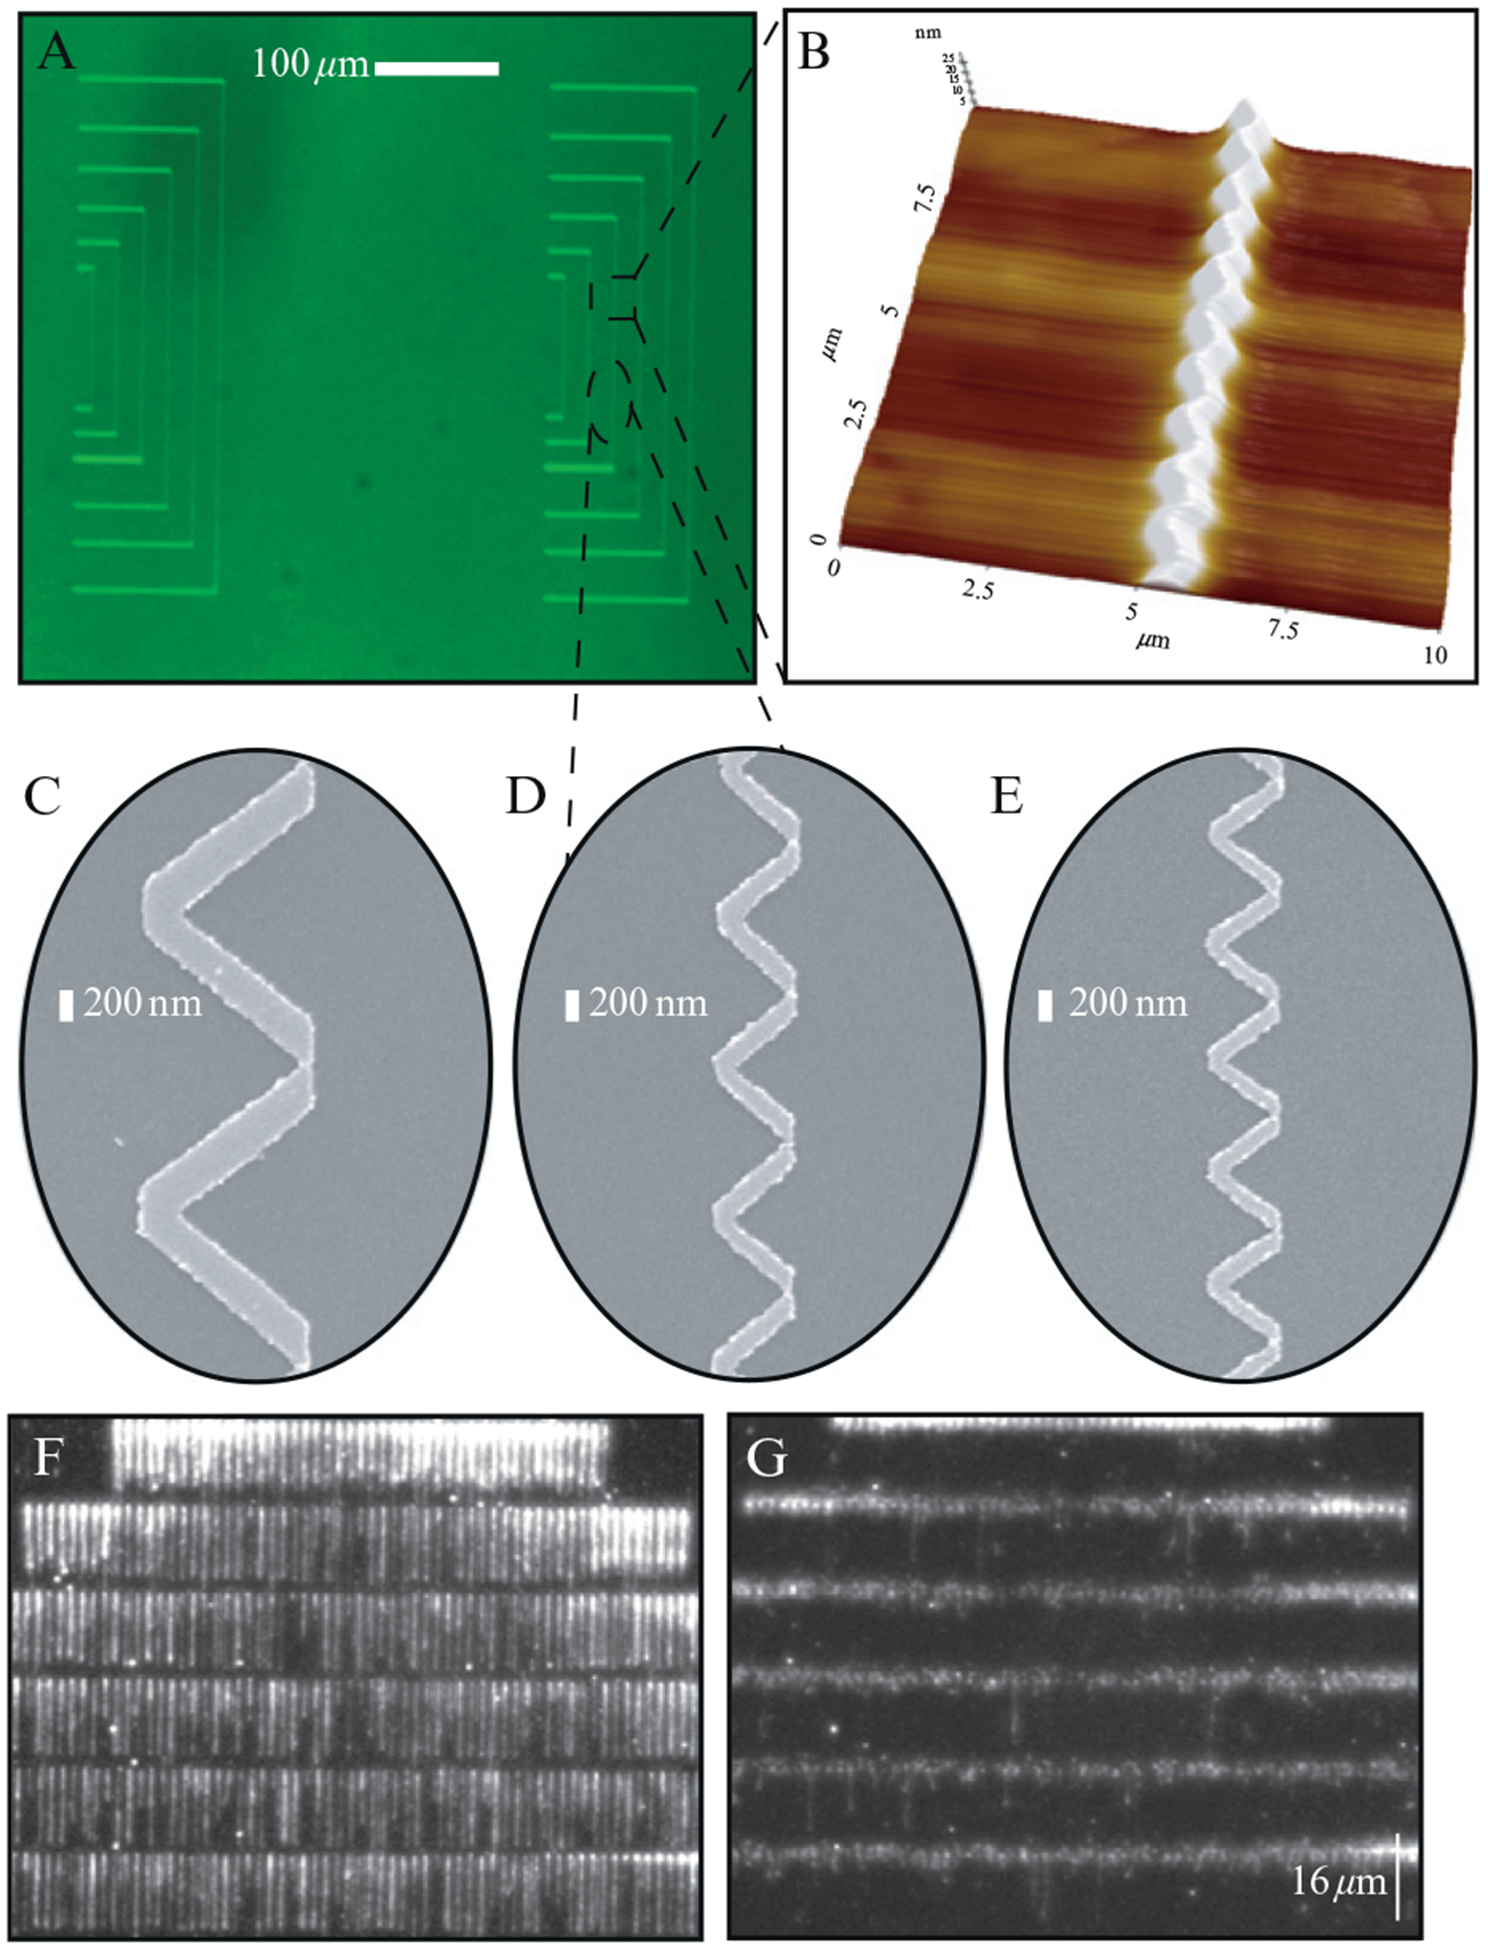
Nanowell barriers: (A) shows an optical image of two barrier patterns with nanowells. (B) shows an AFM image with a representative nanowell pattern that repeats at 1-μm intervals. SEM images of nanowell barriers viewed from above are shown in (C–E). The peak-to-peak distances of these nanowells are 1900, 1000, 750 nm for (C–E), respectively. (F) and (G) show YOYO1-stained DNA curtains assembled at barriers with 1900 nm spacing, in the presence of buffer flow and immediately after pausing flow, respectively. Adapted with permission from Visnapuu et al. (2008a,b).
As with our other barrier patterns, the number of DNA molecules that make up the curtains can be varied by modulating several different parameters, the simplest of which is the amount of DNA injected into the sample chamber. At high concentrations, multiple molecules of DNA can accumulate within each nanowell. To avoid this problem, these experiments can be conducted with a relatively small amount of DNA (determined empirically, and ~100 μl of a 30 pM solution of biotinylated lambda DNA is a good starting point), such that less than one DNA molecule is expected per nanowell. This ensures that some of the nanowells will remain unoccupied, many of the wells will have a single DNA molecule, and some of the wells will have multiple DNA molecules. This can be confirmed by measuring the fluorescence intensity of the DNA in each well. For example, nanowells harboring two molecules are twice as bright as those harboring just one, therefore allowing easy discrimination.
3.4.2. “Rack” patterns for anchoring both DNA ends
The DNA curtains described above use hydrodynamic force to stretch the DNA, and if flow is turned off, the molecules quickly disappear from view as they drift outside of the detection volume defined by the penetration depth of the evanescent field. This “single-tethered” configuration is fine for many applications. However, in certain cases it is advantageous to be able to view the DNA in the absence of buffer flow, such as when measuring one-dimensional diffusion of proteins along the DNA or when reagents are limiting. Therefore, we designed “double-tethered” DNA curtains where both ends of the DNA are linked to the surface (Fig. 14.6). Double-tethered curtains utilize two pattern elements: linear barriers to lipid diffusion and pentagons that serve as solid anchor points for attachment of the second end of the DNA. One end of the DNA is first anchored via a biotin–streptavidin interaction to a supported lipid bilayer coating the surface of the sample chamber. Application of flow pushes the DNA into the linear barrier (Fig. 14.6); the linear barriers halt the movement of the lipid-tethered DNA molecules, causing them to accumulate at the leading edge of the barriers where they then extend parallel to the surface. The pentagons are positioned behind the linear barriers and separated from one another by small channels, which help prevent DNA from accumulating at the leading edge of the pentagons. The distance between the linear barriers and the pentagons is optimized for the length of the DNA to be used for the experiments. The pentagons themselves are coated with antibodies directed against a small hapten, such as digoxigenin (DIG) or fluorescein isothiocyanate (FITC), which is covalently linked to the ends of the DNA opposite the ends bearing the biotin tag. When the hapten-coupled DNA ends encounter the antibody-coated pentagons, they become immobilized, and the DNA molecules remain stretched parallel to the surface even when no buffer is being pushed through the sample chamber (Fig. 14.6).
The DNA rack relies upon the selective, but nonspecific adsorption of antibodies to the large exposed surface of the metallic pentagons. Antibodies can also potentially adsorb to the linear barriers, but the larger surface area of the pentagons ensures that they are coated with more antibodies. As with the biotinylated end, the DIG or FITC tags are covalently attached to synthetic oligonucleotides that are complementary to the 12-nt overhang at the end of the lambda DNA. These oligonucleotides are annealed and ligated to lambda using T4 DNA ligase, and then the free oligonucleotide is removed by gel filtration (Gorman et al., 2007; Prasad et al., 2007).
To assemble the “double-tethered” DNA curtains, the surface of the flowcell is first coated with a lipid bilayer, as described for our other curtain designs, with the exception that BSA must be omitted from all buffers used prior to deposition of the antibody. The omission of BSA is necessary to avoid blocking the exposed metallic surfaces. Once the bilayer is assembled, antibodies (0.025 mg/ml) directed against the small molecule hapten linked to the free end of the DNA are injected into the sample chamber where they are allowed to adhere nonspecifically to the exposed metal barriers. Following a brief incubation, the free antibody is rinsed from the flowcell and replaced with buffer containing 0.2-mg/ml BSA, which serves as a nonspecific-blocking agent to passivate any remaining exposed surfaces. DNA labeled at one end with biotin and at the other end with either DIG or FITC and also stained with the fluorescent intercalating dye YOYO1 is then injected into the sample chamber, incubated briefly without buffer flow, and then buffer flow is applied to push the anchored molecules into the linear barriers. Illumination of YOYO1 causes extensive DNA damage in the presence of molecular oxygen, but this can be suppressed by inclusion on an oxygen-scavenging system comprised of glucose oxidase, catalyse, and glucose (Gorman et al., 2007). Once aligned and stretched at the linear barriers, the hapten-tagged end of the DNA can bind to the antibody-coated pentagons. Flow is then terminated and the anchored DNA molecules are imaged by TIRFM.
3.5. Trouble-shooting
Successful assembly of DNA curtains is reliant upon the integrity of the lipid bilayer, and failure can typically be traced to a problem with the bilayer. If the bilayer is not deposited on the surface, or if it is not mobile, then the DNA curtains cannot be assembled. Prior to attempting to make a DNA curtain, it is absolutely essential to demonstrate the deposition of a bilayer and also to show that the bilayer is fluid. This is a relatively simple task and can be accomplished by spiking the lipid preparation (described above) with a small fraction of rhodamine-tagged lipids (e.g., [1,2-dimyristoyl-sn-glycero-3-phosphoethanolamine-N-(lissamine rhodamine B sulfonyl) (ammonium salt)]; Avanti Polar Lipids). The rhodamine provides a convenient signal that can be used to see whether a bilayer has been deposited on the surface of the flowcell, and it should appear as a uniform bright field image of fluorescence when viewed by TIRFM and it should not wash away when the flow chamber is flushed with buffer lacking lipids. In addition, a region of the surface should be photobleached. If the bilayer is fluid, the fluorescence in this photobleached region will recover over time. This FRAP (fluorescence recovery after photobleaching) control can be used to calculate the diffusion coefficient of the mobile lipids as well as the fraction of lipids that are mobile, and it can directly confirm whether or not the bilayers are of sufficient quality to support assembly of DNA curtains (Granéli et al., 2006).
4. Visualizing Protein–DNA Interactions
The primary motivation for developing DNA curtains is for use in single-molecule imaging of protein–DNA interactions. Below we present an overview of our general strategy for fluorescently labeling proteins with quantum dots, and we provide a very brief description of different examples of protein–DNA interactions that we have begun exploring using our DNA curtain approach. For more specific details regarding these experiments or data analysis, we refer the reader to the original publications (Gorman et al., 2007, 2010; Prasad et al., 2007; Visnapuu and Greene, 2009).
4.1. Quantum dots as a general fluorescent labeling strategy
We use fluorescent semiconducting nanocrystals, also called quantum dots (QDs) or Qdots, as the fluorophore of choice rather than other types of fluorescent dyes. QDs are commercially available, they are relatively small (typically ~10–20 nm in diameter), and they are extremely bright and photostable. A single laser source can be used to excite different colored QDs, eliminating the need for multiple illumination sources during applications requiring multicolor imaging. The primary disadvantage of QDs is that they are not as small as organic fluorophores, and it is critical to assess the effect of the QD for any protein under investigation through the use of standard in vitro ensemble assays. When making measurements of 1D diffusion (see below), the large QDs are expected to slow down the overall motion (i.e., reduce the value of the diffusion coefficient by a few fold) of the proteins under investigation in proportion with the increased radius of the QD–protein complex compared to the unlabeled protein alone, but should have no impact on the actual mechanism of movement (Gorman et al., 2007; Kochaniak et al., 2009).
We utilize a labeling strategy in which recombinant proteins are expressed as fusions with an epitope tag (e.g., HA, FLAG, thioredoxin, etc.) and these tags are used as handles for conjugating the protein of interest to a QD that is covalently coupled to the corresponding antibody. We use amine reactive QDs provided with an antibody conjugation kit from Invitrogen. The amines can be coupled to any antibody using the heterobifunctional crosslinking reagent SMCC (succinimidyl 4-[N-maleimidomethyl]cyclohexane-1-carboxylate). According to the manufacturer, this procedure yields on the order of 1–3 antibodies per QD, although reports in the literature suggest values closer to 0.01–0.1 antibodies per QD (Pathak et al., 2007). The resulting QD antibody conjugates can be purified by gel filtration to remove unreacted antibodies and stored in phosphate-buffered saline (PBS, pH 7.4) at 4 °C for at least a few weeks without a noticeable decline in quality. The antibody-labeled QDs are then mixed with the epitope-tagged recombinant protein of interest. This labeling strategy can be applied to virtually any protein that has an epitope tag and is unaffected by the attachment of the Qdot.
4.2. Visualizing ATP-dependent DNA translocation
Using DNA curtains aligned along manually etched barriers and QD tagged proteins, we have demonstrated that Rdh54 translocates along double-stranded DNA (Fig. 14.7) (Prasad et al., 2007). Rdh54 is an Snf2-family member and is involved in meiotic and mitotic homologous DNA recombination in Saccharomyces cerevisiae. Rdh54 is also capable of remodeling nucleosomes, and this activity may be related to its involvement in DNA recombination. Our studies have demonstrated that the translocation activity of Rdh54 is ATP-dependent, and translocation appears to coincide with the generation of looped DNA structures, which is consistent with the known biochemical properties of the related protein Rad54. The protein traveled at a mean velocity of 80 bp/s, but individual proteins could change direction and/or velocity, or even pause as they moved along the DNA. Similar behaviors have been reported in separate single-molecule studies from Kowalczykowski and colleagues (Amitani et al., 2006; Nimonkar et al., 2007). These findings suggest that this family of proteins may have multiple motor domains within a single multimeric protein complex, and the pauses, velocity, and direction changes may reflect the protein complex engaging different motor domains with the DNA.
Figure 14.7.
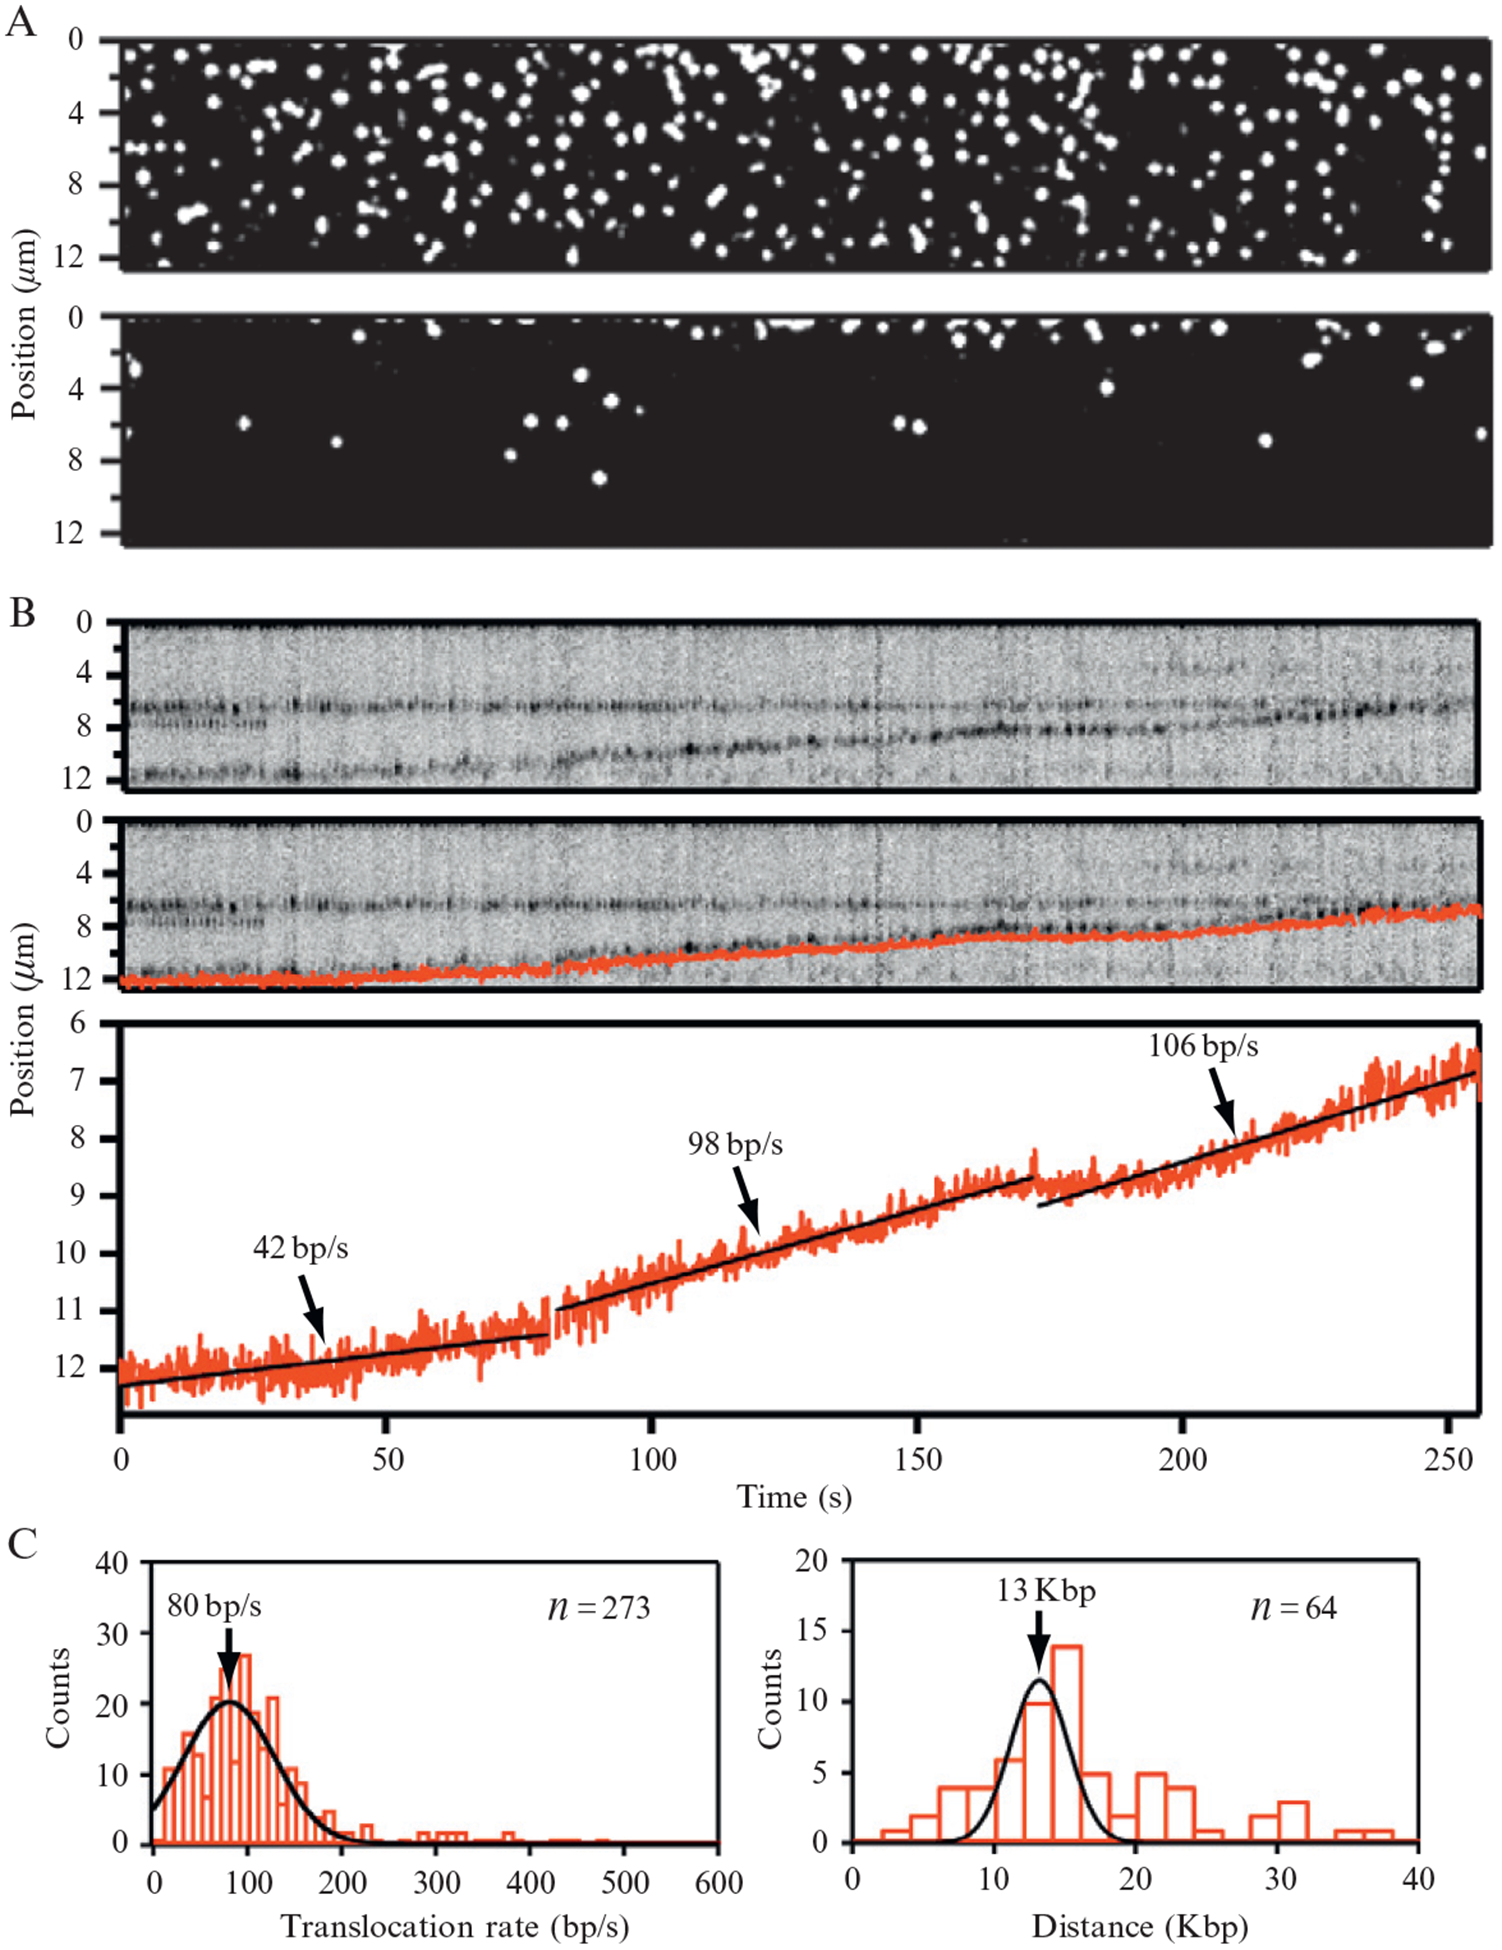
Visualizing ATP-dependent translocation of Rdh54 using DNA curtains aligned at manually etched barriers. The upper panel in (A) shows Rdh54 bound to DNA. The lower panel in (A) shows the same field after transiently pausing buffer flow; (B) shows the kymogram of a single translocating complex of Rdh54 (upper panel), along with superimposed particle-tracking data (middle panel), or shown independently as a graph of the movement (lower panel). This data was collected using an algorithm that located and tracked the centroid position of each fluorescent particle within the DNA curtain. Linear fits to the data are also indicated along with the corresponding translocation rates. Histograms generated from the analysis of translocating Rdh54 complexes showing the distribution of translocation rates and total distance traveled during the 250-s observation windows are shown in (C). Adapted with permission from Prasad et al. (2007).
4.3. Using DNA curtains to image nucleosomes
Eukaryotic DNA is compacted into chromatin, the fundamental unit of which is the nucleosome. Nucleosomes are comprised of a histone octamer wrapped by 147 bp of DNA. We have established a system for looking at QD tagged nucleosomes using DNA curtains (Fig. 14.8) (Visnapuu and Greene, 2009). In our initial study, we used DNA curtains assembled at nanofabricated linear barriers to demonstrate that the recent theoretical models of Widom, Segal, and colleagues (Field et al., 2008; Kaplan et al., 2009) can predict landscapes for nucleosome deposition on both λ-DNA and on a 23-kb PCR fragment derived from the human β-globin locus. We have also confirmed that poly(dA-dT) tracts exclude nucleosomes, and the effects of these exclusionary sequences dominate the intrinsic binding landscape. We have shown that the deposition pattern for the human β-globin locus suggests an organizational mechanism consistent with a small number of strongly positioned nucleosomes near promotor and regulatory regions, and statistical packing of most other nucleosomes throughout the locus. We have also shown that octameric nucleosomes harboring a centromeric specific variant of histone H3 (CenH3) display intrinsic deposition patterns nearly identical to canonical nucleosomes. In contrast, hexameric nucleosomes harboring both CenH3 and Scm3, a centromer-specific nonhistone protein, overcome the exclusionary affects of poly(dA-dT), allowing them to be deposited in regions that disfavor normal nucleosome octamers.
Figure 14.8.
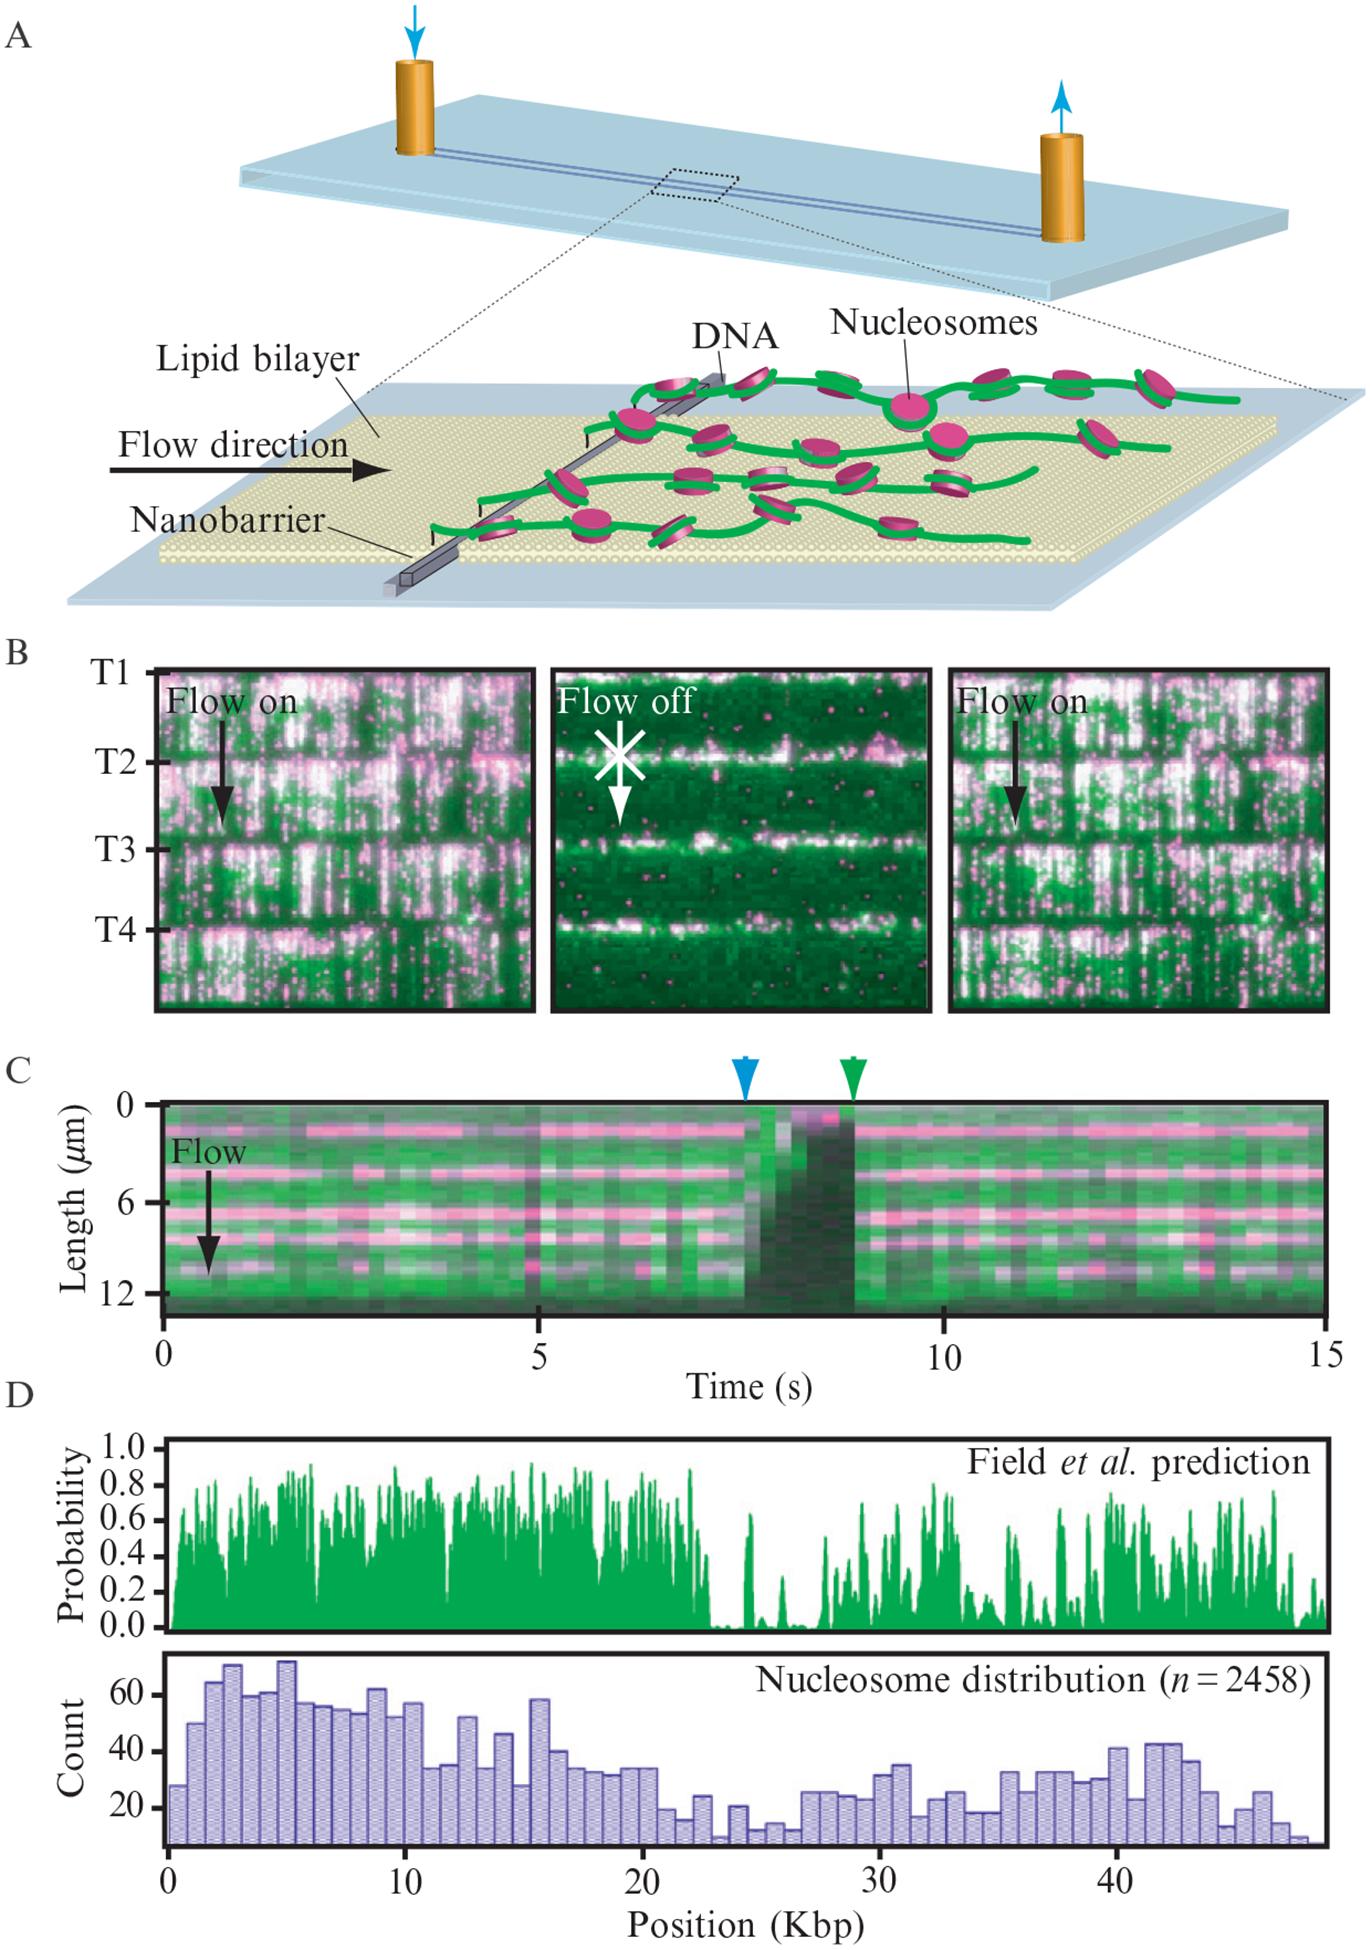
Visualizing fluorescently tagged nucleosomes. (A) depicts the experimental design. YOYO1-stained DNA curtains (green) bound by nucleosomes (magenta) that were tagged with anti-FLAG QDs are shown in (B). The tethered end of each curtain is indicated as T1-T4, and arrows indicate the direction of flow. A kymogram illustrating five nucleosomes on one DNA molecule is shown in (C). The nucleosomes disappear when flow is temporarily interrupted (blue arrowheads) and reappear when flow is resumed (green arrowheads), verifying that they are bound to the DNA and do not interact with the lipid bilayer. The top panel in (D) shows the theoretical distribution of nucleosomes on λ-DNA as predicted by Field et al. (2008). The lower panel shows the observed distribution of nucleosomes obtained from DNA curtain experiments. Adapted with permission from (Visnapuu and Greene, 2009).
4.4. Diffusion of MMR along DNA
Post-replicative mismatch repair (MMR) is necessary to correct errors made during DNA synthesis. In eukaryotes, Msh2-Msh6 is responsible for locating and initiating repair of mispaired bases, and works in concert with Mlh1-Pms1, which coordinates downstream steps in the repair pathway. We have begun dissecting MMR by visualizing proteins as they interact with DNA curtains assembled at etched barriers, as well as isolated molecules of DNA that were not assembled into curtains (Gorman et al., 2007). Using anti-HA QDs, and HA-tagged Msh2-Msh6, we have demonstrated that Msh2-Msh6 can travel along DNA via 1D diffusion, and it is likely that the protein tracks the phosphate backbone as it slides along the DNA. Msh2-Msh6 also reversibly enters a nondiffusive state and we believe that this occurs when the protein stops to interrogate a site. The addition of ATP caused the nondiffusive Msh2-Msh6 to reenter a diffusive state and continue sliding along the DNA (Fig. 14.9). We hypothesize that reentry into a diffusive state mimics what occurs after lesion recognition, and represents the functional consequence of a conformational change that is triggered by ATP binding. We have also initiated new studies of the protein complex Mlh1–Pms1 and Mlh1 alone (Fig. 14.10; Gorman et al., 2010; Gorman et al., in preparation). These experiments are the first to take advantage of these rack patterns and double-tethered DNA curtains, and highlight the unique advantages of these designs.
Figure 14.9.
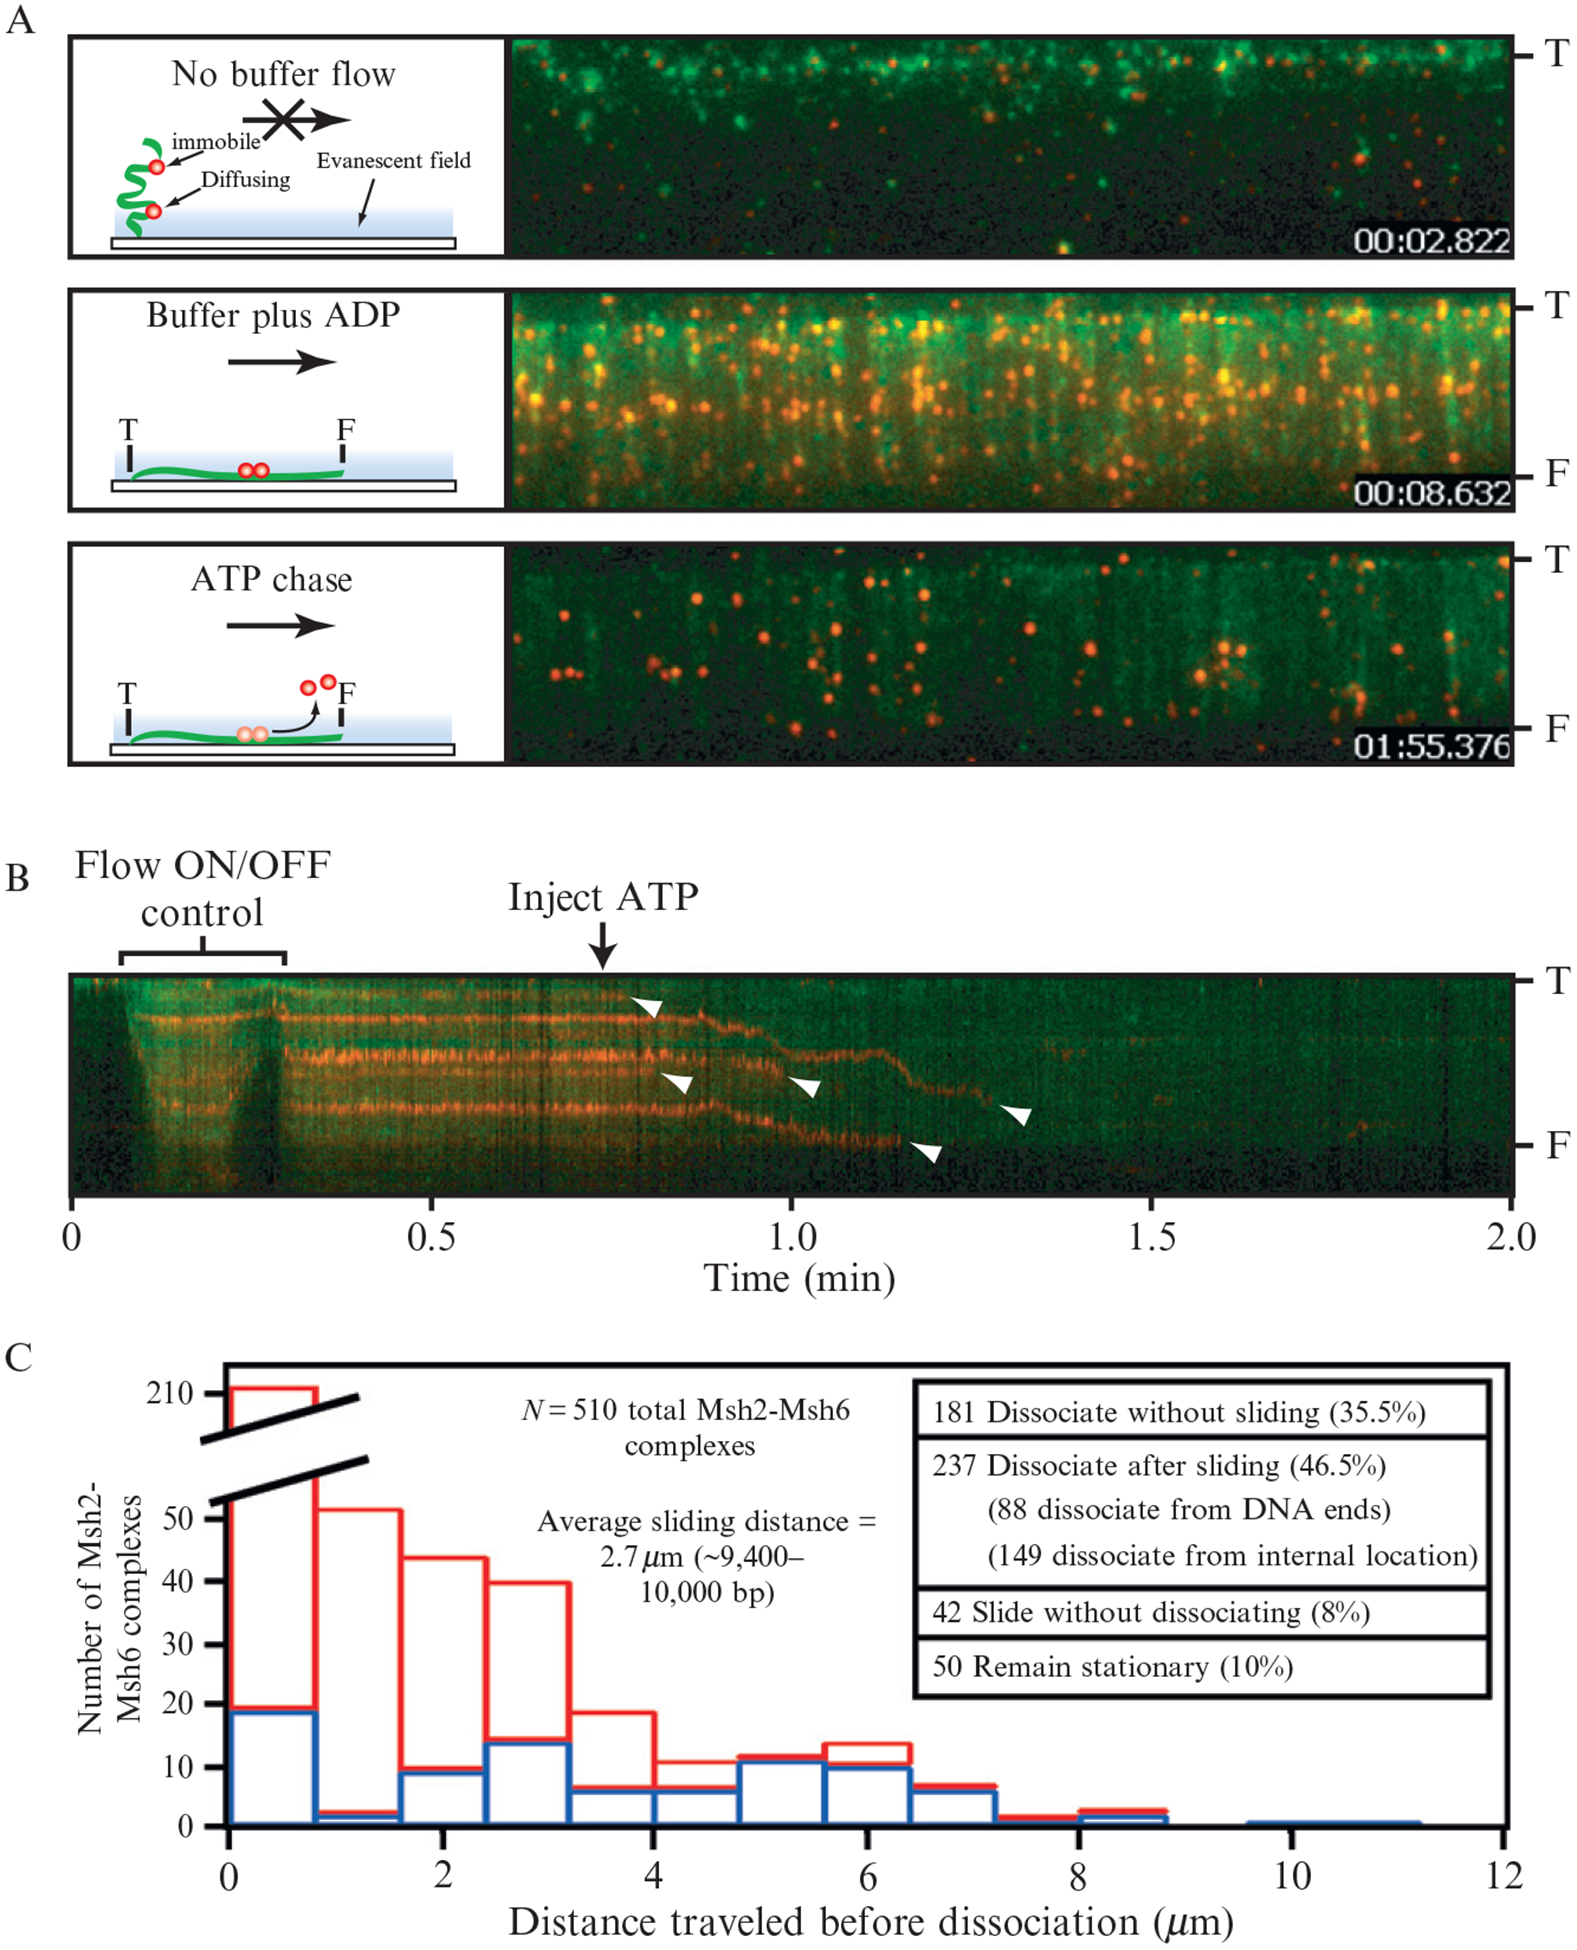
ATP-triggered release of Msh2-Msh6 from DNA aligned at a manually etched barrier. (A) Assay used to probe the effects of ATP on the immobile population of Msh2-Msh6. The proteins are red and the DNA is green. The DNA is tethered to the surface by only one end (“T”) and the free end (“F”) is only observed when flow is applied. Flow is from top to bottom in each panel and the distance between T and F is ~ 13 μm. The upper panel shows the field after transiently pausing buffer flow (Flow ON/OFF control) and the cartoon at the left depicts the behavior of the molecules the absence of flow. The middle panel shows the same field after resuming flow. Each red spot in the image corresponds to at least one Msh2-Msh6 complex, and there are 274 identifiable red spots in this experiment and 124 DNA molecules. The lower panel shows the same DNA molecules after the injection of 2 mM ATP. (B) Kymogram showing one DNA molecule and the bound Msh2-Msh6. Arrowheads highlight the dissociation of Msh2-Msh6. (C) Summary of the behavior of 510 total Msh2-Msh6 complexes after the injection of ATP into the sample chamber. “Distance traveled before dissociation” corresponds to the distance that Msh2-Msh6 moved prior to falling off the DNA. Dissociation events that occurred after sliding from internal positions on the DNA are colored red (N = 149) and those that occurred at the end of the DNA molecules are colored blue (N = 88). Reproduced with permission from Gorman et al. (2007).
Figure 14.10.
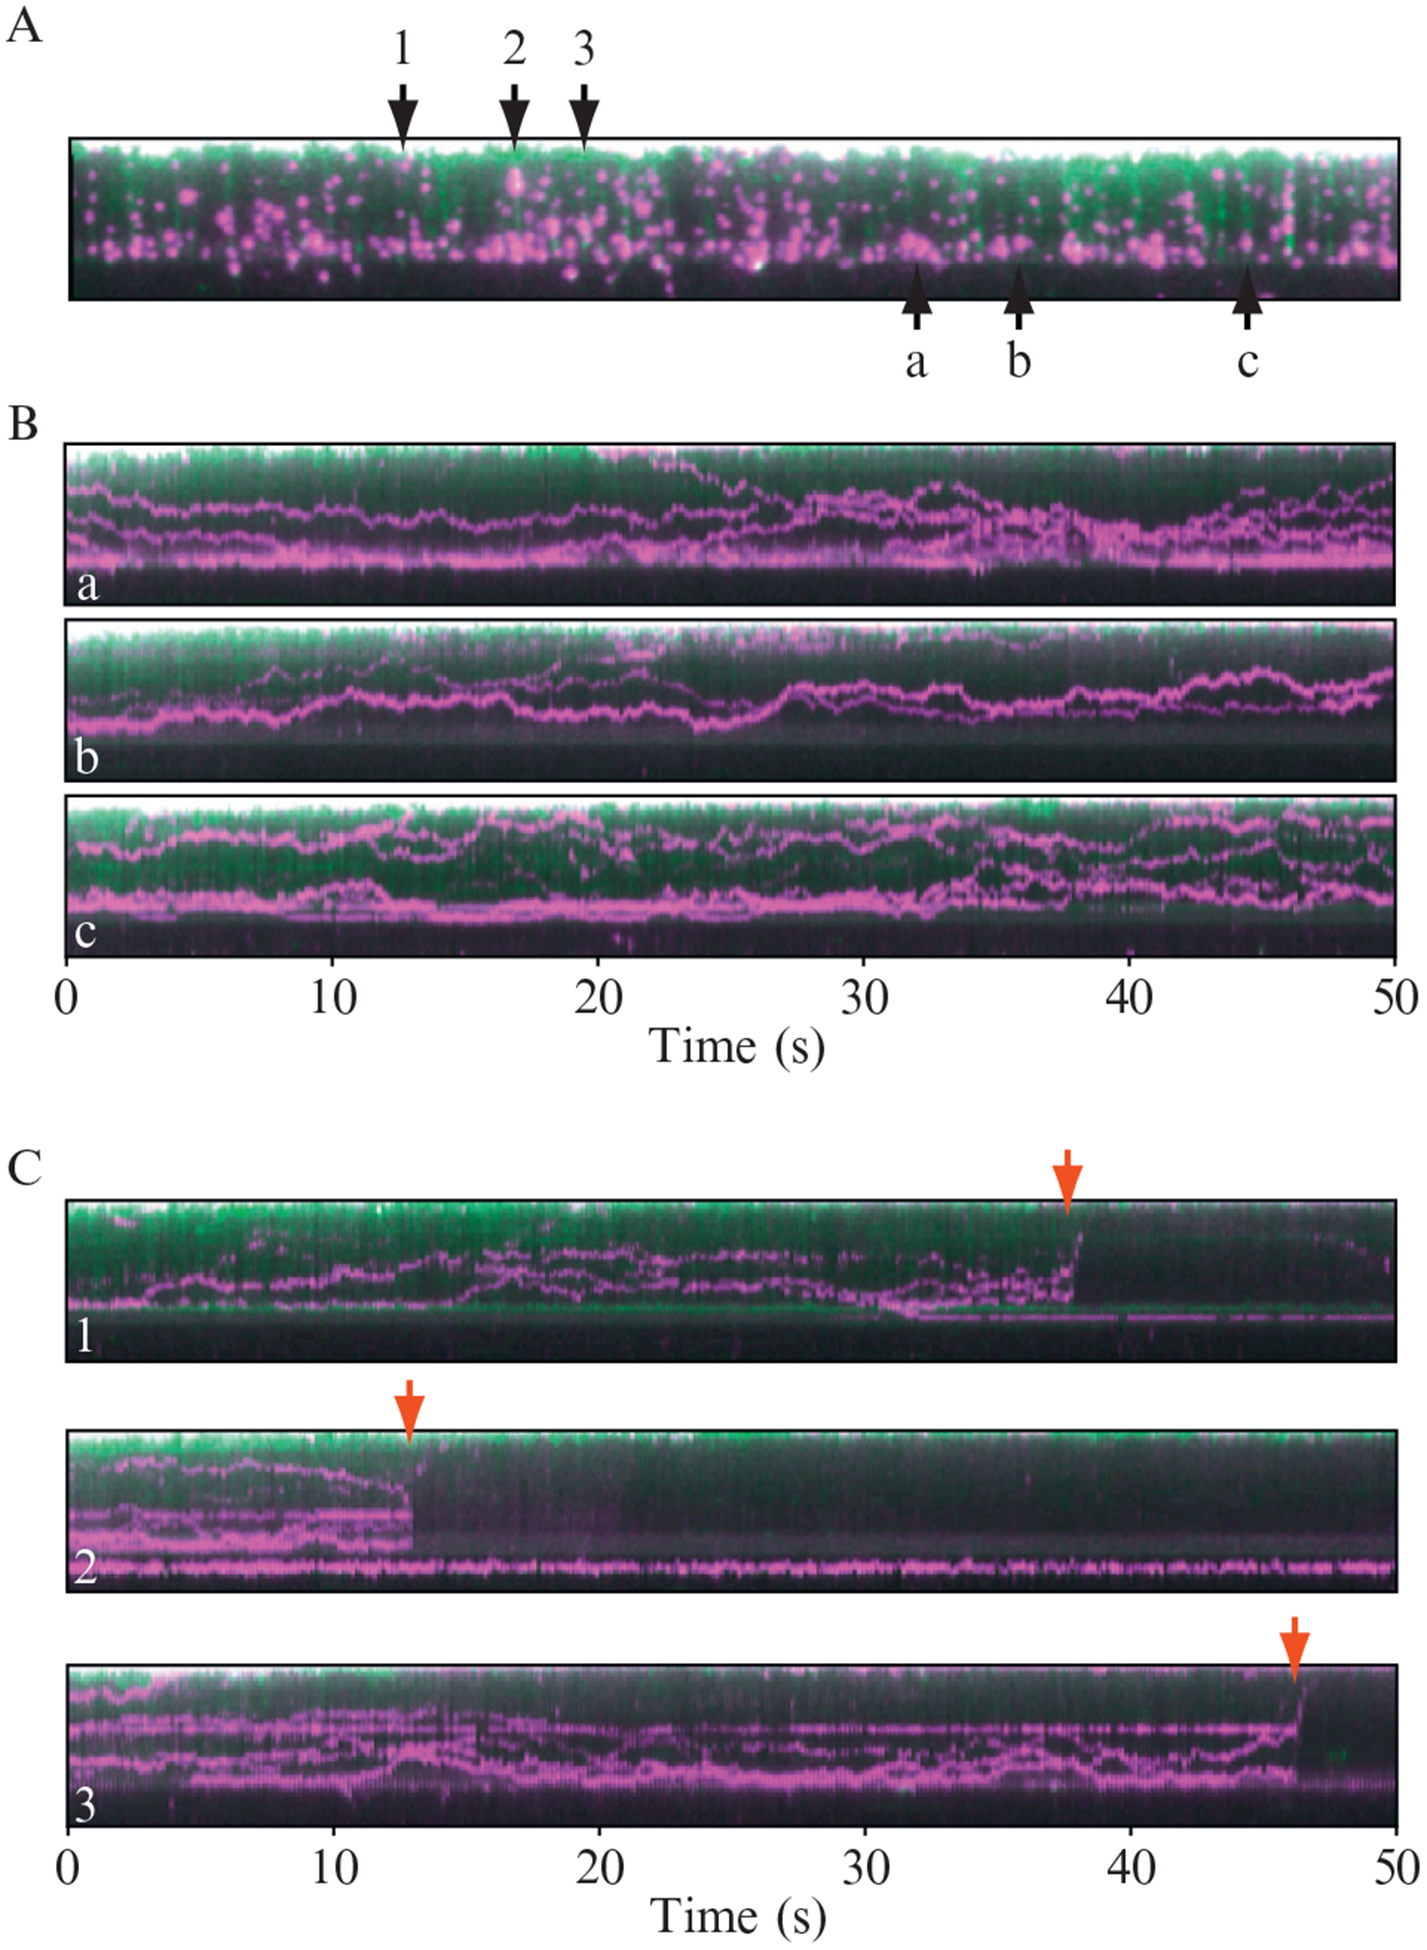
One-dimensional diffusion of Mlh1 on “double-tethered” curtains of DNA. (A) shows an example of a double-tethered DNA curtain bound by QD labeled Mlh1. The DNA is shown in green and the proteins are magenta. This image represents a single 100-ms image taken from a 1-min video (not shown). (B) shows three representative kymograms (designated a, b, and c) made from individual DNA molecules from within (A). (C) shows examples of DNA molecules taken from (A) that broke during the course of DNA collection (numbered 1, 2, and 3), demonstrating that both the DNA and the bound proteins diffuse rapidly away from the surface and out of the evanescent field, this confirming that the QD tagged proteins are not adsorbed to the bilayer. Reproduced with permission from Gorman et al. (2010).
5. Conclusions and Future Directions
DNA curtains are amenable to many different experimental systems. Manually etched barriers can be easily implemented in any laboratory with experience in single-molecule detection. Nanofabricated barriers require access to clean room facilities, but offer greater precision and design flexibility. As illustrated above, we have established experimental systems for studying DNA recombination and molecular motor proteins, nucleosomes, and chromatin, and postreplication MMR. This initial work involved single protein participants that are part of more complex, multicomponent biochemical systems. Moving forward, a great challenge will be to study these proteins in combination with different factors and engineered DNA molecules containing specific binding sites or lesions, with a goal of recapitulating complete biochemical pathways that can be viewed at the single-molecule level.
ACKNOWLEDGMENTS
This research was funded by the Initiatives in Science and Engineering grant (ISE: awarded to E. C. G. and S. W.) program through Columbia University, and by an NIH grant GM074739 and an NSF PECASE Award to E. C. G. T. A. F. was supported in part by an NSF Graduate Research Fellowship. J. G. was supported by an NIH training grant for Cellular and Molecular Foundations of Biomedical Sciences (T32GM00879807). This work was partially supported by the Nanoscale Science and Engineering Initiative of the NSF under Award Number CHE-0641523 and by the New York State Office of Science, Technology, and Academic Research (NYSTAR).
REFERENCES
- Amitani I, Baskin R, and Kowalczykowski S (2006). Visualization of Rad54, a chromatin remodeling protein, translocating on single DNA molecules. Mol. Cell 23, 143–148. [DOI] [PubMed] [Google Scholar]
- Axelrod D (1989). Total internal reflection fluorescence microscopy. Methods Cell Biol 30, 245–270. [DOI] [PubMed] [Google Scholar]
- Cremer PS, and Boxer SG (1999). Formation and spreading of lipid bilayers on planar glass supports. J. Phys. Chem. B 103, 2554–2559. [Google Scholar]
- Fazio T, Visnapuu ML, Wind S, and Greene EC (2008). DNA curtains and nanoscale curtain rods: High-throughput tools for single molecule imaging. Langmuir 24, 10524–10531. [DOI] [PMC free article] [PubMed] [Google Scholar]
- Field Y, Kaplan N, Fondufe-Mittendorf Y, Moore I, Sharon E, Lubling Y, Widom J, and Segal E (2008). Distinct modes of regulation by chromatin encoded through nucleosome positioning signals. PLoS Comput. Biol 4, e1000216. [DOI] [PMC free article] [PubMed] [Google Scholar]
- Forkey JN, Quinlan M, and Goldman Y (2000). Protein structural dynamics by single-molecule fluorescence polarization. Prog. Biophys. Mol. Biol 74, 1–35. [DOI] [PubMed] [Google Scholar]
- Gorman J, Chowdhury A, Surtees JA, Shimada J, Reichman DR, Alani E, and Greene EC (2007). Dynamic basis for one-dimensional DNA scanning by the mismatch repair complex Msh2-Msh6. Mol. Cell 28, 359–370. [DOI] [PMC free article] [PubMed] [Google Scholar]
- Gorman J, Fazio T, Wang F, Wind S, and Greene EC (2010). Nanofabricated racks of aligned and anchored DNA substrates for single molecule imaging. Langmuir 26, 1372–1379. [DOI] [PMC free article] [PubMed] [Google Scholar]
- Gorman J, Plys A, Visnapuu ML, Alani E, and Greene EC, manuscript in preparation.
- Granéli A, Yeykal C, Prasad TK, and Greene EC (2006). Organized arrays of individual DNA molecules tethered to supported lipid bilayers. Langmuir 22, 292–299. [DOI] [PubMed] [Google Scholar]
- Groves JT, and Boxer SG (2002). Micropattern formation in supported lipid membranes. Acc. Chem. Res 35, 149–157. [DOI] [PubMed] [Google Scholar]
- Groves JT, Ulman N, and Boxer SG (1997). Micropatterning fluid lipid bilayers on solid supports. Science 275, 651–653. [DOI] [PubMed] [Google Scholar]
- Ha T (2001). Single-molecule fluorescence resonance energy transfer. Methods 25, 78–86. [DOI] [PubMed] [Google Scholar]
- Kaplan N, Moore I, Fondufe-Mittendorf Y, Gossett A, Tillo D, Field Y,LeProust E, Hughes T, Lieb J, Widom J, and Segal E (2009). The DNA-encoded nucleosome organization of a eukaryotic genome. Nature 458, 362–366. [DOI] [PMC free article] [PubMed] [Google Scholar]
- Kochaniak A, Habuchi S, Loparo J, Chang D, Cimprich K, Walter J, and van Oijen A (2009). Proliferating cell nuclear antigen uses two distinct modes to move along DNA. J. Biol. Chem 284, 17700–17710. [DOI] [PMC free article] [PubMed] [Google Scholar]
- Nimonkar AV, Amitani I, Baskin R, and Kowalczykowski S (2007). Single molecule imaging of Tid1/Rdh54, a Rad54 homolog that translocates on duplex DNA and can disrupt joint molecules. J. Biol. Chem 282, 30776–30784. [DOI] [PubMed] [Google Scholar]
- Pathak S, Davidson MC, and Silva GA (2007). Characterization of the functional binding properties of antibody conjugated quantum dots. Nano Lett 7, 1839–1845. [DOI] [PubMed] [Google Scholar]
- Prasad TK, Robertson RB, Visnapuu ML, Chi P, Sung P, and Greene EC (2007). A DNA-translocating Snf2 molecular motor: Saccharomyces cerevisiae Rdh54 displays processive translocation and extrudes DNA loops. J. Mol. Biol 369, 940–953. [DOI] [PMC free article] [PubMed] [Google Scholar]
- Visnapuu ML, and Greene EC (2009). Single-molecule imaging of DNA curtains reveals intrinsic nucleosome landscapes. Nat. Struct. Mol. Biol 16, 1056–1062. [DOI] [PMC free article] [PubMed] [Google Scholar]
- Visnapuu ML, Duzdevich D, and Greene EC (2008a). The importance of surfaces in single-molecule bioscience. Mol. Biosyst 4, 394–403. [DOI] [PMC free article] [PubMed] [Google Scholar]
- Visnapuu ML, Fazio T, Wind S, and Greene EC (2008b). Parallel arrays of geometric nanowells for assembling curtains of DNA with controlled lateral dispersion. Langmuir 24, 11293–11299. [DOI] [PMC free article] [PubMed] [Google Scholar]


