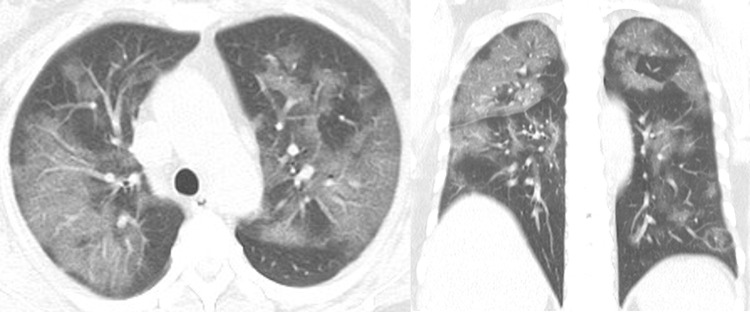
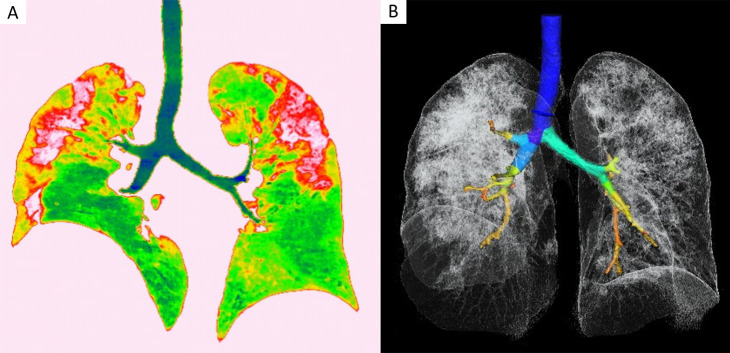
COVID-19 (formerly known as 2019 novel coronavirus [2019-nCoV]) broke out in December 2019, and it spread from Wuhan, Hubei Province, to all over China and many other countries in the world (1–4). A 54-year-old woman with a travel history to Wuhan was admitted to the hospital with a 7-day history of fever (38.5°C [101.3°F]), cough, fatigue, and chest congestion. Laboratory examinations showed normal white blood cell count and lymphocytopenia, increased C-reactive protein level and erythrocyte sedimentation rate, and decreased CD3+, CD4+, CD8+, and CD4/CD8. Unenhanced chest CT revealed patchy peripheral ground-glass opacities with upper lobe predominance (Fig 1). A three-dimensional volume-rendering technique (PULMO 3D software, VB20; Siemens Healthineers, Forchheim, Germany) highlighted the distribution of pulmonary opacities, which was useful to determine the extension of the disease (Fig 2, Movie [supplement]). Her nasopharyngeal swab was positive for COVID-19 with real-time fluorescence polymerase chain reaction test. The patient was diagnosed with severe COVID-19 pneumonia. When treated with oxygen inhalation, moxifloxacin, lopinavir/ritonavir, umifenovir, interferon, and thymosin, her body temperature returned to normal and the symptoms slightly improved. CT reexamination on the 5th day of hospitalization indicated increased lesions and mild absorption on the 9th day.
Figure 1:
CT images in a 54-year-old woman with severe COVID-19 pneumonia. Transverse and coronal images reveal patchy peripheral ground-glass opacities with upper lobe predominance.
Figure 2:
CT images in a 54-year-old woman with severe COVID-19 pneumonia. A, The color coronal image highlights the distribution of lung lesions (red areas) because software is used to automatically segment and render. B, On a three-dimensional volume-rendering image, trachea, bronchus, lung tissues, and lesions are differentiated by CT values and automatically segmented.
Movie.
Three-dimensional volume-rendering movie in a 54-year-old woman with severe COVID-19 pneumonia. The images highlight the distribution of pulmonary lesions, which are useful to determine the extension of the inflammatory burden.
Footnotes
Disclosures of Conflicts of Interest: L.T. disclosed no relevant relationships. X. Zhang disclosed no relevant relationships. Y.W. disclosed no relevant relationships. X. Zeng disclosed no relevant relationships.
References
- 1.World Health Organization . Novel Coronavirus (2019-nCoV) situation reports. https://www.who.int/emergencies/diseases/novel-coronavirus-2019/situation-reports.
- 2.Li Q, Guan X, Wu P, et al. Early Transmission Dynamics in Wuhan, China, of Novel Coronavirus-Infected Pneumonia. N Engl J Med 2020 Jan 29 [Epub ahead of print]. [DOI] [PMC free article] [PubMed] [Google Scholar]
- 3.Zhu N, Zhang D, Wang W, et al. A Novel Coronavirus from Patients with Pneumonia in China, 2019. N Engl J Med 2020;382(8):727–733. [DOI] [PMC free article] [PubMed] [Google Scholar]
- 4.Lei J, Li J, Li X, Qi X. CT Imaging of the 2019 Novel Coronavirus (2019-nCoV) Pneumonia. Radiology 2020 Jan 31:200236 [Epub ahead of print]. [DOI] [PMC free article] [PubMed] [Google Scholar]


