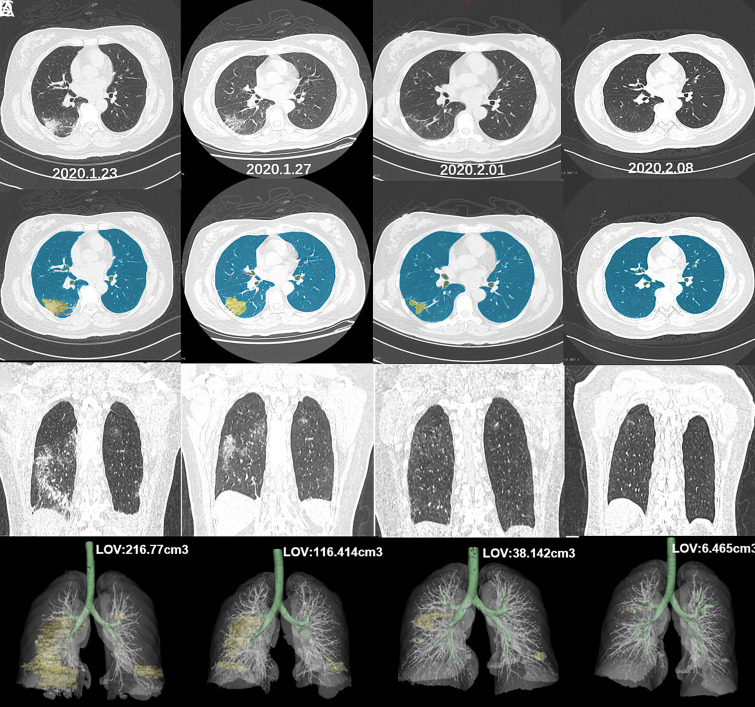
Coronavirus disease 2019, COVID-19, has recently gained global proportions (1–3). This short report illustrates the use of voxel-level deep learning–based CT segmentation of pulmonary opacities (4) for improving quantification of the disease. A separate set of CT images from 10 cases of COVID-19 confirmed by real-time reverse transcriptase polymerase chain reaction test results was selected for training purposes. Expert manual segmentation of the lungs and pulmonary opacities was used as reference. A convolutional neural network based on U-Net architecture (5) was developed to predict the expert segmentation. We used this pipeline to analyze the contrasting evolution of two confirmed cases of COVID-19 from Wuhan, China, that were receiving similar supportive therapy. Figure 1 shows the favorable evolution of a 48-year-old woman imaged at four time points across an interval of 16 days, while Figure 2 shows the case of a 44-year-old man with disease progression over 12 days, especially between the second and third studies. These examples illustrate the potential of deep learning–based quantitative CT for providing objective assessment of pulmonary involvement and therapy response in COVID-19, but further studies are still necessary to determine the performance of such an approach in this scenario.
Figure 1:
Evolution of COVID-19 in a 48-year-old woman across 16 days of treatment. A, Axial unenhanced chest CT images at four time points (dates annotated in each panel) show peripheral ground-glass opacities and consolidation. B, Color overlay of voxel-level segmentation at the same level and time points as in A show pulmonary opacities displayed in yellow and normal lung in blue. C, Coronal reconstructions at the same time points as in A show progressive improvement of the lung opacities. D, Three-dimensional volume-rendered reconstructions at the same time points as in A show pulmonary opacities displayed in yellow, normal lung and vessels in light gray, and tracheobronchial tree in green. The volumetric assessment of the pulmonary opacities derived from the deep learning–based quantitative CT analysis is annotated at different time points on the volume-rendered images. LOV = lung opacification volume.
Figure 2:
Evolution of COVID-19 in a 44-year-old man across 12 days of treatment. A, Axial unenhanced chest CT images at four time points (dates annotated in each panel) show a small nodular opacity in the right upper lobe on the initial CT, progressing to a larger area of ground-glass opacity and consolidation, especially at time points 2 and 3. B, Color overlay of voxel-level segmentation at the same level and time points as in A show pulmonary opacities displayed in yellow and normal lung in blue. C, Coronal reconstructions at the same time points as in A show progression of the lung opacities, especially across first and third time points. D, Three-dimensional volume-rendered reconstructions at the same time points as in A show pulmonary opacities displayed in yellow, normal lung and vessels in light gray, and tracheobronchial tree in green. The volumetric assessment of the pulmonary opacities derived from the deep learning–based quantitative CT analysis is annotated at different time points on the volume-rendered images. LOV = lung opacification volume.
Footnotes
Disclosures of Conflicts of Interest: Y.C. disclosed no relevant relationships. Z.X. disclosed no relevant relationships. J.F. disclosed no relevant relationships. C.J. disclosed no relevant relationships. X.H. disclosed no relevant relationships. H.W. disclosed no relevant relationships. H.S. disclosed no relevant relationships.
References
- 1.Zhu N, Zhang D, Wang W, et al. A Novel Coronavirus from Patients with Pneumonia in China, 2019. N Engl J Med 2020;382(8):727–733. [DOI] [PMC free article] [PubMed] [Google Scholar]
- 2.Huang C, Wang Y, Li X, et al. Clinical features of patients infected with 2019 novel coronavirus in Wuhan, China. Lancet 2020;395(10223):497–506 [Published correction appears in Lancet 2020;395(10223):496.]. [DOI] [PMC free article] [PubMed] [Google Scholar]
- 3.Ng MY, Lee EYP, Yang J, et al. Imaging Profile of the COVID-19 Infection: Radiologic Findings and Literature Review. Radiol Cardiothorac Imaging 2020;2(1):e200034. [DOI] [PMC free article] [PubMed] [Google Scholar]
- 4.Pang T, Guo S, Zhang X, Zhao L. Automatic Lung Segmentation Based on Texture and Deep Features of HRCT Images with Interstitial Lung Disease. BioMed Res Int 2019;2019:2045432. [DOI] [PMC free article] [PubMed] [Google Scholar]
- 5.Ronneberger O, Fischer P, Brox T. U-Net: Convolutional Networks for Biomedical Image Segmentation. [preprint] https://arxiv.org/abs/1505.04597. Posted 2015.


