

Abstract
Purpose
To compare radiologic characteristics of coronavirus disease 2019 (COVID-19) pneumonia at thin-section CT on admission between patients with mild and severe disease.
Materials and Methods
Seventy patients with COVID-19 pneumonia who were admitted to Zhongnan Hospital of Wuhan University between January 20, 2020 and January 27, 2020 were enrolled. On the basis of the World Health Organization guidelines, 50 patients were categorized with the mild form and 20 with the severe form based on clinical conditions. Imaging features, clinical, and laboratory data were reviewed and compared.
Results
Patients with the severe form (median age, 65 years; interquartile range [IQR]: 54.75–75.00 years) were older than those with the mild form of disease (median age, 42.5 years; IQR: 32.75–58.50 years) (P < .001). Patients with the severe form of disease had more lung segments involved (median number of segments: 17.5 vs 7.5, P ≤ .001) and also larger opacities (median number of segments with opacities measuring 3 cm to less than 50% of the lung segment: 5.5 vs 2.0, P = .006; ≥ 50% of lung segment: 7.5 vs 0.0, P < .001). They also had more interlobular septal thickening (75% vs 28%, P < .001), higher prevalence of air bronchograms (70% vs 32%, P = .004), and pleural effusions (40% vs 14%, P = .017).
Conclusion
Ground-glass opacities with or without consolidation in a peripheral and basilar predominant distribution were the most common findings in COVID-19 pneumonia. Patients with the severe form of the disease had more extensive opacification of the lung parenchyma than did patients with mild disease. Interlobular septal thickening, air bronchograms, and pleural effusions were also more prevalent in severe COVID-19.
© RSNA, 2020
Summary
Interlobular septal thickening, air bronchogram, pleural effusion, and pure consolidation were more prevalent in the severe clinical form, while pure ground-glass opacity mainly manifested in patients with the mild form of COVID-19.
Key Points
■ Interlobular septal thickening (75%), air bronchogram (70%), and pleural effusion (40%) were more likely to manifest at CT of patients with COVID-19 with the severe form rather than the mild form (28%, 32%, and 14%, respectively).
■ Pure ground-glass opacity mainly manifested in patients with mild disease (38%), while consolidation tended to appear in patients with severe disease (20%).
Introduction
Since December 2019, an outbreak of coronavirus disease 2019 (COVID-19) caused by severe acute respiratory syndrome coronavirus 2 (SARS-CoV-2) first occurred in Wuhan, China, and then quickly spread to other countries in the world (1,2). Coronavirus can cause various systemic illnesses in animals but mainly respiratory tract infections in humans, such as severe acute respiratory syndrome (SARS) and Middle East respiratory syndrome (MERS) (2). SARS-CoV-2, the cause of COVID-19, is an enveloped RNA virus about 60–140 nm in diameter that genetically belongs to lineage B of genus Betacoronavirus. Its genetic characteristics are significantly different from SARS-CoV and MERS-CoV. It has been shown to share more than 85% identity with a bat SARS-like coronavirus (bat-SL-CoVZC45) (2). According to Guan et al, although 84.3% of the infected patients had nonsevere forms of COVID-19, up to 5.0% of the patients were admitted to intensive care units, 2.3% of them underwent invasive mechanical ventilation, and 1.4% of the patients died (3).
Real-time reverse-transcription polymerase chain reaction (RT-PCR) testing for SARS-CoV-2 is the standard for diagnostic confirmation (4). However, CT imaging could contribute to clinical diagnosis and illness assessment by flagging suspected cases and noninvasively evaluating disease progression (5). Several studies have reported the epidemiologic and clinical information of COVID-19 (1,6–8), including discussion of radiologic features (9–12). Yet, comparative analysis of CT findings between patients in different severity groups is scarce. Thus, the purpose of our current study was to compare radiologic characteristics of COVID-19 pneumonia at thin-section CT between patients with mild and severe disease. We aimed to identify CT imaging features that could indicate clinical severity among patients with COVID-19 pneumonia.
Materials and Methods
Patients
This retrospective study included a total of 70 patients with COVID-19 pneumonia who were admitted to Zhongnan Hospital of Wuhan University from January 20, 2020 to January 27, 2020, and who underwent non–contrast material-enhanced thin-section chest CT scans on hospital admission. The inclusion criteria included: (a) positive RT-PCR testing for SARS-CoV-2 on pharyngeal swabs; (b) a thin-section chest CT scan showing any evidence of pneumonia; and (c) patients admitted for treatment or isolation. On the basis of the World Health Organization interim guidance for clinical management of patients with COVID-19 (13), the patients were divided into two groups depending on disease severity. Group 1 were patients with the mild form, which was defined as (a) maximum respiratory rate < 30 breaths per minute, (b) oxyhemoglobin saturation (SpO2) > 90% in resting state, and (c) without respiratory failure, acute respiratory distress syndrome, or shock. Group 2 were patients with the severe form, which was defined as (a) maximum respiratory rate ≥ 30 breaths per minute, or (b) SpO2 ≤ 90% in resting state, or (c) respiratory failure needing mechanical ventilation, or (d) acute respiratory distress syndrome, or (e) shock (13). This retrospective study was approved by the institutional review board of Zhongnan Hospital of Wuhan University and written informed consent was waived.
CT Imaging
CT scanning (Discovery 64, GE Medical Systems, Milwaukee, Wis and SOMATOM Definition, Siemens Healthcare, Erlangen, Germany) was performed at the end of full inspiration. The acquisition and reconstruction parameters were as follows: 120-kV tube voltage with automatic tube current modulation (100–350 mAs), 1-mm slice thickness without interslice gap, using filtered-back-projection (FBP) reconstruction (SOMATOM Definition) or blended FBP/iterative reconstruction (Discovery 64). Axial images with slice thickness of 1 mm were used for coronal and sagittal reconstructions. Images were displayed on lung windows (window level at −700 HU and window width at 1500 HU).
Review of CT Images
We reviewed the CT scans performed within 1 day from admission in all 70 patients. All axial and reconstructed (coronal/sagittal) CT images were independently reviewed by three radiologists (M.Y., D.X., and L.L.) with 6 to 7 years of clinical experience using a standard clinical picture archiving and communication system workstation. Any disagreement was resolved by discussion and consensus. All radiologists were blinded to clinical status of the patients. CT findings were reviewed according to the following aspects: location, distribution, size, and type (14). Location referred to different lobes and segments involved. Distribution was described as peripheral (outer one-third of the lung), central (inner two-thirds), or both central and peripheral. Opacities were classified into small (diameter < 1 cm), moderately sized (diameter 1 cm to < 3 cm), large (diameter 3 cm to < 50% of the segment), or segmental (volume involving 50% of the segment or more), and the number of segments containing a specific category of opacities per patient were counted and compared between groups.
Definition of CT Findings
Ground-glass opacity (GGO) was defined as hazy increased opacity of the lung, with preservation of bronchial and vascular margins (15). Consolidation was defined as a homogeneous increase in pulmonary parenchymal attenuation that obscured the margins of vessels and airway walls (15). Crazy-paving pattern was defined as GGO with associated interlobular septal thickening (15). Air bronchogram was defined as a pattern of air-filled (low attenuation) bronchi on a background of opaque (high attenuation) airless lung (15). Parenchymal band was defined as linear opacity that usually extends to the visceral pleura (15). Pleuroparenchymal interface irregularities were defined as finely irregular and thickened pleural surfaces (16). Masslike opacity was defined as a rounded, solid, or partly solid opacity of pulmonary lesion greater than 3 cm in diameter (15). In addition, interlobular or intralobular septal thickening, bronchiectasis, mosaic attenuation, coarse reticular pattern, lymph nodes (more than 1 cm in short-axis diameter), and pleural effusion were recorded as well.
Statistical Analysis
Continuous variables were expressed as median (IQR) and compared with the Mann-Whitney U test; categorical variables were expressed as number (%) and compared by χ2 test or Fisher exact test between groups. A P value < .05 (two-sided) was considered statistically significant. All data were analyzed using SPSS (version 23.0, SPSS, Chicago, Ill).
Results
Clinical Characteristics
Seventy patients with confirmed COVID-19 pneumonia were included in this study. None of the enrolled patients were immunocompromised. Demographic and clinical characteristics of both groups are shown in Table 1. Patients in group 2 (median age, 65 years; IQR: 54.75–75.00) were older than those in group 1 (median age, 42.5 years; IQR: 32.75–58.50) (P < .001). All patients (20 of 20) in group 2 had dyspnea, whereas only 10% (five of 50) of group 1 had dyspnea (P < .001), but there was no difference in prevalence of fever. The maximum respiratory rate of group 2 patients (median, 30.5; IQR: 26.25–34.25) was higher than that in group 1 patients (median, 19.0; IQR: 18.0–20.0) (P < .001). The median white blood cell count was within the normal range in both groups, but the median lymphocyte count in group 2 patients was decreased in comparison with the normal reference range (0.62 × 10⁹/L; IQR: 0.46–0.93) and lower than that of group 1 patients (0.94 × 10⁹/L; IQR: 0.68–1.11) (P = .031). The median length of hospital stay was 7 days among group 1 patients and 14 days among group 2 patients (P = .003). One patient with severe form of COVID-19 died of shock 11 days after admission to the hospital.
Table 1:
Clinical and Laboratory Characteristics of Included Patients

Considering the time interval between symptom onset and imaging, group 2 patients underwent chest CT scan later than did group 1 patients. The median of days from illness onset to the CT scan was 4 days in group 1 patients and 7 days in group 2 patients (P = .024).
Number of Segments Affected
There were differences in the number and location of involved segments between groups 1 and 2. The per patient number of segments involved in group 2 patients (median, 17.50; IQR: 15.25–18.00) was higher than that among group 1 patients (median, 7.50; IQR: 3.00–13.50) (P < .001, see Table 2). Affected segments were located predominantly in the lower lobes (389 of 741 segments, 52.5%) among all patients, 231 of 427 (54.1%) segments in group 2 patients, and 158 of 314 (50.3%) in group 1 patients. A per-segment analysis also revealed a higher prevalence of COVID-19 pneumonia involvement in group 2 versus group 1 patients in the majority of segments (Table 2).
Table 2:
Number of Patients with Specific Segments Affected in Two Groups

Distribution of the Lung Opacities
The distribution of the lung opacities varied significantly between patients in groups 1 and 2 (P = .043) (Table 3). Overall, most patients had bilateral involvement (58 of 70, 82.9%). The number of patients with lower lobe involvement (60 of 70, 85.7%) was greater than that with upper lobe involvement (46 of 70, 65.7%) (P = .006) (Table 3). The opacities were distributed mainly in peripheral or both central and peripheral areas in group 1 patients (49 of 50, 98%), while the dominating distribution in patients with severe disease was both central and peripheral (19 of 20, 95%). A purely central distribution was uncommon in all patients (one of 70, 1.4%).
Table 3:
Particular Characteristics at CT Imaging in All 70 Patients

Size of the Lung Opacities
As shown in Table 4, there was a significant difference in lung opacity size across groups. Group 2 patients had a relatively larger number of opacities measuring more than 3 cm (P = .006) or involving more the 50% of the segment volume (P < .001) compared with group 1 patients.
Table 4:
Number of Segments Containing Opacities of Different Sizes between Patients in Two Groups

Type of Opacities
As for the different types of lung opacities, there was no difference between the two groups (P = .286). Most patients showed mixed ground glass and consolidation in both group 1 (27 of 50, 54%) and group 2 (11 of 20, 55%) (Table 3; Figs 1, 2). Consolidation alone was rare, only seen in four patients in both groups (Fig 3). Interlobular septal and intralobular thickening were frequent in all patients (Figs 2, 4). Interlobular septal thickening was seen in 14 (28%) of group 1 patients and 15 (75%) of group 2 patients (P < .001). Intralobular thickening was seen in 34 (68%) of group 1 patients versus 17 (85%) of group 2 patients (P = .148) (Table 3).
Figure 1:

Axial CT images in a 51-year-old man with fever, fatigue, mild dyspnea, and confirmed with COVID-19. A, B, The baseline noncontrast thin-section chest CT on January 20, 2020 shows pure ground-glass opacity (white arrows) in bilateral lobes and mainly peripheral sections. The largest lesion is located in the lower lobe of the left lung. C, D, Fourteen days later, follow-up chest CT was performed. The opacities increased significantly in both lower lobes, with more consolidation (short black arrows) and a little parenchymal band (long black arrow) appearing.
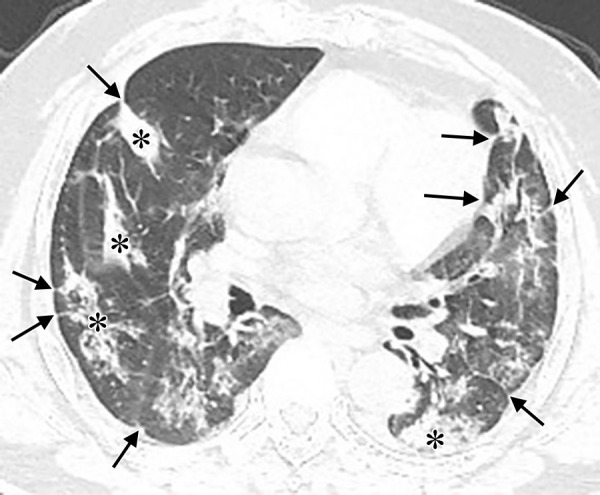
Figure 2:

CT images in a 65-year-old woman with fever, dyspnea, fatigue, and confirmed with COVID-19. A, B, Axial noncontrast thin-section chest CT shows typical COVID-19 imaging characteristics. Bilateral lobes of pure ground-glass opacity (white arrows), ground-glass opacity with consolidation (short black arrow), intralobular interstitial thickening (crazy-paving pattern) (asterisks) and air bronchogram (long black arrows) are identified.
Figure 3:

The noncontrast thin-section CT images in a 39-year-old man with fever and fatigue for 5 days and confirmed with COVID-19. A, Pure ground-glass opacity lesion (white arrow) located in left lower lobe. B, Five days later, another follow-up chest CT scan was performed. The pure ground-glass opacity lesion turned to consolidation (short black arrow) and parenchymal band (long black arrow).
Figure 4:

The noncontrast thin-section chest CT in a 61-year-old woman with fever and dyspnea, confirmed with COVID-19 (A, B: axial CT; C: coronal CT; D: sagittal CT). The imaging shows interlobular septal thickening (black arrow) and crazy paving (asterisks). Opacities located predominately in the peripheral areas of both lungs.
Bronchiectasis and mosaic attenuation were rare, with bronchiectasis seen in four patients and mosaic attenuation in one patient, overall. Other uncommon signs included coarse reticular pattern (eight of 70, 11.4%), masslike opacity (six of 70, 8.6%), lymphadenopathy (13 of 70, 18.6%), and pleural effusion (15 of 70, 21.4%) (Table 3). Overall, common characteristics seen at chest CT of COVID-19 pneumonia included crazy paving (31 of 70, 44.3%) (Figs 2, 4), air bronchograms (30 of 70, 42.9%) (Fig 2), pleuroparenchymal irregularities (31 of 70, 44.3%), and parenchymal bands (31 of 70, 44.3%) (Table 3) (Fig 3). Among these, a higher proportion of air bronchograms was seen in group 2 (14 of 20, 70%) compared with group 1 patients (16 of 50, 32%) (P = .004). There was no significant difference in the prevalence of crazy paving (P = .254), pleuroparenchymal irregularities (P = .648) (Fig 5), or parenchymal band (P = .254) between the two groups.
Figure 5:
The noncontrast thin-section chest CT in a 53-year-old man with fever and confirmed with COVID-19. The CT image shows pleuroparenchymal interface irregularity (black arrows) and consolidation (asterisks).
Discussion
We studied the findings from chest CT at hospital presentation in patients diagnosed with COVID-19 pneumonia, focusing our comparisons between the patients with mild and severe disease. Patients with the severe form of disease were older than those with the mild form of disease, suggesting that SARS-CoV-2 pathogenicity may depend on the underlying immune response, similar to MERS-CoV (17). Fever was the most common clinical symptom, while dyspnea occurred more often in patients with severe disease, consistent with previous findings, and in part attributable to the clinical definition of severe disease (7). We also confirmed that reduced lymphocyte count is a feature that may help in diagnosing COVID-19, especially in patients with the severe form of disease. All patients with severe symptoms were admitted to the intensive care unit, and the length of hospital stay was longer than that of patients with mild disease. Patients with the severe form of the disease underwent chest CT scan later in the course of disease than did those with the mild form of the disease. We suspect that the initial symptoms in some patients with the severe form could have been subtle and nonspecific, resulting in later hospital presentation.
As for characteristics on CT images, COVID-19 pneumonia seems to be more extensive in the severe form of disease, involving a larger number of lung segments. Regarding specific segment involvement, severe form patients were more likely to have opacities involving nine or more segments. Most of the opacities were located in the lower lobes, which is also seen in other viral pneumonias, such as that caused by influenza (18). Individual opacities also tended to involve a larger extension of the lung parenchyma in the severe form of disease.
Most patients had bilateral lung involvement, with both central and peripheral distribution. Unilateral or pure central lung involvement was rare, which is consistent with previous studies (12,19). Wong et al (14) also showed that opacities in SARS were mainly distributed bilaterally and peripherally, while opacities in MERS have been described as predominantly basilar, peribronchovascular, or subpleural (20).
None of the imaging features described here existed alone in COVID-19 pneumonia but appeared together with multiple other characteristics. The common imaging signs included pure GGO, GGO with consolidation, interstitial thickening, crazy paving, air bronchogram, pleuroparenchymal irregularities, and parenchymal band, which was consistent with previous studies (10,12). Such findings may overlap other viral pneumonias; for instance, H1N1 influenza pneumonia also presents GGO in a patchy pattern, with interlobular septal thickening and consolidation (21). But for H7N9 influenza pneumonia, consolidation is reported to be the most common sign (22). Pure consolidation, bronchiectasis, mosaic attenuation, or masslike opacity were rare for COVID-19 pneumonia. Patients with the mild form of disease showed pure GGO more often than patients with severe disease, while the latter was more frequently associated with pure consolidations. Thus, we speculate that pure GGO may be associated with early or mild stage of disease, while pure consolidation could indicate severe clinical form or occur at a more advanced stage, consistent with previous reports (9). The rate of patients with interlobular septal thickening and air bronchogram was higher in patients with severe disease than in patients with mild disease, indicating that interlobular septal thickening and air bronchogram could relate to advanced or late stage of COVID-19 pneumonia or coexistence of superimposed processes, such as pulmonary edema. Neither interlobular septal thickening nor air bronchogram was specific for COVID-19 pneumonia. Pleural effusion was uncommon, manifesting mainly in patients with severe disease, which may indicate parapneumonic effusion or fluid overload. Lymphadenopathy is usually rare in viral pneumonias, occurring predominantly in patients with the severe form of disease in our study.
There were several limitations in this study. First, these observations were restricted only to the patients presenting to the hospital and admitted for treatment and isolation. Therefore, the conclusions from our study only apply to a small segment of patients affected by the disease. Second, while we included patients with laboratory confirmation of COVID-19 (23), a controlled investigation for coinfection and comorbidities was not made in this retrospective study. One could speculate that some of the differences encountered between patients with severe and mild forms of disease could be partially attributed to underlying cardiovascular or renal conditions. For example, interlobular septal thickening, pleural effusions, and lymphadenopathy could be indicative of fluid overload rather than direct pathogenic effect caused by the virus. Future controlled studies may help in differentiating the direct effects from the infection versus those caused by other underlying medical conditions. Last, there was a statistically significant difference in the time from symptom onset to hospital presentation between patients with severe and mild form of disease, which poses a challenge to the interpretation of the results. Understanding whether the imaging differences between groups were truly dictated by severity of disease versus the time course of disease would require a systematic longitudinal assessment of findings at different time points.
In conclusion, pure GGO, GGO with consolidation, interstitial thickening, crazy paving, air bronchograms, pleuroparenchymal irregularities, and parenchymal bands were the main CT imaging features of COVID-19 in our study. Pure consolidation was rare and seemed to occur in patients with severe disease, while pure GGO occurred in patients with mild disease. Interlobular septal thickening, air bronchogram, and pleural effusions were more frequently found in the severe clinical form. Opacities affected both lungs, especially in the lower lobes. Opacities were more frequently peripheral, although both central and peripheral opacities can also occur in conjunction. Lung opacification involved a larger extension of the lung parenchyma in patients with severe disease.
M.Y. and D.X. contributed equally to this work.
Supported by the National Natural Science Foundation of China (grant 81771819).
Disclosures of Conflicts of Interest: M.Y. Activities related to the present article: institution received grant from and study supported by National Natural Science Foundation of China (grant no. 81771819). Activities not related to the present article: disclosed no relevant relationships. Other relationships: disclosed no relevant relationships. D.X. disclosed no relevant relationships. L.L. disclosed no relevant relationships. M.T. disclosed no relevant relationships. R.L. Activities related to the present article: institution received grant from and study supported by National Natural Science Foundation of China (grant no. 81771819). Activities not related to the present article: disclosed no relevant relationships. Other relationships: disclosed no relevant relationships. S.C. disclosed no relevant relationships. Y.C. disclosed no relevant relationships. L.X. Activities related to the present article: institution received grant from and study supported by National Natural Science Foundation of China (grant no. 81771819). Activities not related to the present article: disclosed no relevant relationships. Other relationships: disclosed no relevant relationships. M.L. Activities related to the present article: institution received grant from and study supported by National Natural Science Foundation of China (grant no. 81771819). Activities not related to the present article: disclosed no relevant relationships. Other relationships: disclosed no relevant relationships. X.Z. Activities related to the present article: institution received grant from and study supported by National Natural Science Foundation of China (grant no. 81771819). Activities not related to the present article: disclosed no relevant relationships. Other relationships: disclosed no relevant relationships. S.Y.X. disclosed no relevant relationships. Y.L. Activities related to the present article: author received National Key Research and Development Program of China grant (2018YFE0204502). Activities not related to the present article: disclosed no relevant relationships. Other relationships: disclosed no relevant relationships. H.X. disclosed no relevant relationships.
Abbreviations:
- COVID-19
- coronavirus disease 2019
- GGO
- ground-glass opacity
- IQR
- interquartile range
- MERS
- Middle East respiratory syndrome
- RT-PCR
- reverse-transcription polymerase chain reaction
- SARS
- severe acute respiratory syndrome
- SARS-CoV-2
- severe acute respiratory syndrome coronavirus 2
- SpO2
- oxyhemoglobin saturation
References
- 1.Wang FS, Zhang C. What to do next to control the 2019-nCoV epidemic? Lancet 2020;395(10222):391–393. [DOI] [PMC free article] [PubMed] [Google Scholar]
- 2.Zhu N, Zhang D, Wang W, et al. A novel coronavirus from patients with pneumonia in china, 2019. N Engl J Med 2020;382(8):727–733. [DOI] [PMC free article] [PubMed] [Google Scholar]
- 3.Guan WJ, Ni ZY, Hu Y, et al. Clinical Characteristics of Coronavirus Disease 2019 in China. N Engl J Med 2020 Feb 28 [Epub ahead of print]. [DOI] [PMC free article] [PubMed] [Google Scholar]
- 4.World Health Organization. Global Surveillance for human infection with coronavirus disease (COVID-19). https://www.who.int/publications-detail/global-surveillance-for-human-infection-with-novel-coronavirus-(2019-ncov). Published February 27, 2020. Updated March 20, 2020. Accessed March 25, 2020.
- 5.Tang L, Zhang XY, Wang YQ, et al. Severe COVID-19 Pneumonia: Assessing Inflammation Burden with Volume-rendered Chest CT. Radiol Cardiothorac Imaging 2020;2(2):e200044. [DOI] [PMC free article] [PubMed] [Google Scholar]
- 6.Chen N, Zhou M, Dong X, et al. Epidemiological and clinical characteristics of 99 cases of 2019 novel coronavirus pneumonia in Wuhan, China: a descriptive study. Lancet 2020;395(10223):507–513. [DOI] [PMC free article] [PubMed] [Google Scholar]
- 7.Huang C, Wang Y, Li X, et al. Clinical features of patients infected with 2019 novel coronavirus in Wuhan, China. Lancet 2020;395(10223):497–506 [Published correction appears in Lancet 2020;395(10223):496.]. [DOI] [PMC free article] [PubMed] [Google Scholar]
- 8.Wang D, Hu B, Hu C, et al. Clinical Characteristics of 138 Hospitalized Patients With 2019 Novel Coronavirus-Infected Pneumonia in Wuhan, China. JAMA 2020;323(11):1061–1069. [DOI] [PMC free article] [PubMed] [Google Scholar]
- 9.Song F, Shi N, Shan F, et al. Emerging 2019 Novel Coronavirus (2019-nCoV) Pneumonia. Radiology 2020;295(1):210–217. [DOI] [PMC free article] [PubMed] [Google Scholar]
- 10.Pan Y, Guan H, Zhou S, et al. Initial CT findings and temporal changes in patients with the novel coronavirus pneumonia (2019-nCoV): a study of 63 patients in Wuhan, China. Eur Radiol 2020 Feb 13 [Epub ahead of print]. [DOI] [PMC free article] [PubMed] [Google Scholar]
- 11.Pan F, Ye T, Sun P, et al. Time Course of Lung Changes On Chest CT During Recovery From 2019 Novel Coronavirus (COVID-19) Pneumonia. Radiology 2020 Feb 13:200370 [Epub ahead of print]. [DOI] [PMC free article] [PubMed] [Google Scholar]
- 12.Chung M, Bernheim A, Mei X, et al. CT Imaging Features of 2019 Novel Coronavirus (2019-nCoV). Radiology 2020;295(1):202–207. [DOI] [PMC free article] [PubMed] [Google Scholar]
- 13.et al. Clinical management of severe acute respiratory infection when novel coronavirus (nCoV) infection is suspected: interim guidance. https://www.who.int/publications-detail/clinical-management-of-severe-acute-respiratory-infection-when-novel-coronavirus-(ncov)-infection-is-suspected. Published January 12, 2020. Updated March 13, 2020. Accessed March 25, 2020.
- 14.Wong KT, Antonio GE, Hui DS, et al. Thin-section CT of severe acute respiratory syndrome: evaluation of 73 patients exposed to or with the disease. Radiology 2003;228(2):395–400. [DOI] [PubMed] [Google Scholar]
- 15.Hansell DM, Bankier AA, MacMahon H, McLoud TC, Müller NL, Remy J. Fleischner Society: glossary of terms for thoracic imaging. Radiology 2008;246(3):697–722. [DOI] [PubMed] [Google Scholar]
- 16.Zerhouni EA, Naidich DP, Stitik FP, Khouri NF, Siegelman SS. Computed tomography of the pulmonary parenchyma. Part 2: Interstitial disease. J Thorac Imaging 1985;1(1):54–64. [DOI] [PubMed] [Google Scholar]
- 17.Badawi A, Ryoo SG. Prevalence of comorbidities in the Middle East respiratory syndrome coronavirus (MERS-CoV): a systematic review and meta-analysis. Int J Infect Dis 2016;49:129–133. [DOI] [PMC free article] [PubMed] [Google Scholar]
- 18.Koo HJ, Lim S, Choe J, Choi SH, Sung H, Do KH. Radiographic and CT Features of Viral Pneumonia. RadioGraphics 2018;38(3):719–739. [DOI] [PubMed] [Google Scholar]
- 19.Lei J, Li J, Li X, Qi X. CT Imaging of the 2019 Novel Coronavirus (2019-nCoV) Pneumonia. Radiology 2020;295(1):18. [DOI] [PMC free article] [PubMed] [Google Scholar]
- 20.Ajlan AM, Ahyad RA, Jamjoom LG, Alharthy A, Madani TA. Middle East respiratory syndrome coronavirus (MERS-CoV) infection: chest CT findings. AJR Am J Roentgenol 2014;203(4):782–787. [DOI] [PubMed] [Google Scholar]
- 21.Yuan Y, Tao XF, Shi YX, Liu SY, Chen JQ. Initial HRCT findings of novel influenza A (H1N1) infection. Influenza Other Respir Viruses 2012;6(6):e114–e119. [DOI] [PMC free article] [PubMed] [Google Scholar]
- 22.Wang Q, Zhang Z, Shi Y, Jiang Y. Emerging H7N9 influenza A (novel reassortant avian-origin) pneumonia: radiologic findings. Radiology 2013;268(3):882–889. [DOI] [PubMed] [Google Scholar]
- 23.Xiao SY, Wu Y, Liu H. Evolving status of the 2019 novel coronavirus infection: Proposal of conventional serologic assays for disease diagnosis and infection monitoring. J Med Virol 2020;92(5):464–467. [DOI] [PMC free article] [PubMed] [Google Scholar]