

SUMMARY
We undertook a comprehensive proteogenomic characterization of 95 prospectively collected endometrial carcinomas, comprising 83 endometrioid and 12 serous tumors. This analysis revealed possible new consequences of perturbations to the p53 and Wnt/β-catenin pathways, identified a potential role for circRNAs in the epithelial-mesenchymal transition, and provided new information about proteomic markers of clinical and genomic tumor subgroups, including relationships to known druggable pathways. An extensive genome-wide acetylation survey yielded insights into regulatory mechanisms linking Wnt signaling and histone acetylation. We also characterized aspects of the tumor immune landscape, including immunogenic alterations, neoantigens, common cancer/testis antigens, and the immune microenvironment, all of which can inform immunotherapy decisions. Collectively, our multiomic analyses provide a valuable resource for researchers and clinicians, identify new molecular associations of potential mechanistic significance in the development of endometrial cancers, and suggest novel approaches for identifying potential therapeutic targets.
In Brief
Proteogenomic analyses of prospectively collected endometrial carcinomas provide insights into the role of underlying molecular pathways and the immune landscape that drive disease.
Graphical Abstract
INTRODUCTION
Endometrial carcinoma (EC) is the sixth-most-common cancer in women globally (Bray et al., 2018), with an estimated 61,880 new cases and 12,160 deaths in the United States in 2019 (Siegel et al., 2019). Most women diagnosed with EC have early-stage disease and favorable outcomes; this is particularly true for well-differentiated cancers with endometrioid histology (Amant et al., 2005). However, there is a subset of low-grade, early-stage, well-differentiated endometrioid tumors in which unexpected recurrences and poor outcomes do occur. Clinical outcomes worsen considerably for women with recurrent or advanced disease and for women diagnosed with a clinically aggressive histologic subtype of the disease, such as the serous histotype (Siegel et al., 2018; Walker et al., 2009). EC is one of the few human malignancies for which mortality is increasing (American Cancer Society, 2017), which underscores the urgent need to develop more effective strategies for the diagnosis and treatment of this disease.
The Cancer Genome Atlas (TCGA) recently published a comprehensive genomic study of serous and endometrioid EC and reported four genomic subtypes: POLE, a rare ultramutated subtype with endometrioid histology and good prognosis; microsatellite instability (MSI), a hypermutated endometrioid subtype; copy-number (CNV) low, which consists of most of the rest of the endometrioid cases; and CNV-high, comprised of all serous and the most aggressive endometrioid cancers (Kandoth et al., 2013). To improve our understanding of the functional impact of the genomic alterations characterized by TCGA, we conducted an extensive multi-omic characterization of EC samples and appropriate normal tissues from a prospective cohort of 95 EC patients, under the auspices of the National Cancer Institute’s Clinical Proteomic Tumor Analysis Consortium (CPTAC). Integrated measurements of DNA, RNA, proteins, and post-translational modifications (phosphorylation and acetylation) were used to identify novel regulatory relationships and potential avenues for identifying therapeutic targets.
RESULTS
Overview of the Proteogenomic Landscape
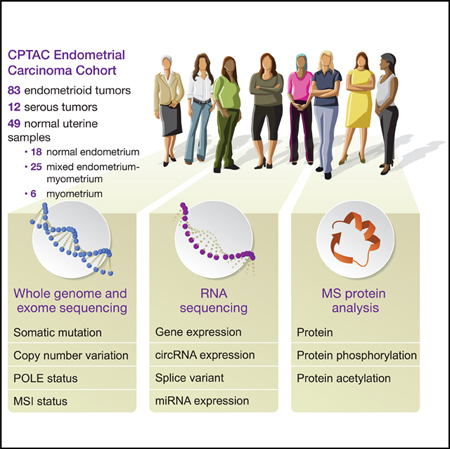
We obtained 95 prospectively collected EC tumors (83 endometrioid and 12 serous) and 49 normal tissue samples for multi-omic characterization. The clinical and pathological characteristics of the tumors are summarized in Table S1. Each sample underwent whole exome, whole genome, and total and miRNA sequencing, along with DNA methylation analyses. In addition, the relative levels of the proteins and post-translational modification (PTM) sites across the tumor and normal tissue samples were quantified (Figure 1; Figure S1A) by using isobaric labeling with a universal reference strategy (Mertins et al., 2016; Zhang et al., 2016a), applying a stringent 1% false discovery rate (FDR) cutoff at the protein level. The methods and results, quantification results, and normalization methods were carefully evaluated to confirm data quality (STAR Methods; Figures S1B–1L). Processed data tables are available in Table S2, the cptac Python package, and LinkedOmics (Vasaikar et al., 2018); raw data are available via the Genomic Data Commons (GDC) and CPTAC Data Portal (STAR Methods).
Figure 1. Proteogenomic Summary of the Cohort.

Samples are ordered by genomic subtype and then by histology. Representative pathways are shown for genes with the greatest variation between subtypes. For each sample, we display mutation load, copy number indices (at both global and arm levels), and mutation status in SMGs.
Tumors were classified into the four genomic subtypes outlined in the TCGA EC landmark study (Kandoth et al., 2013): POLE, MSI, CNV-low (also called endometrioid-like), or CNV-high (also called serous-like) (STAR Methods; Figure 1; Table S3). Note that the endometrioid histological subtype mostly segregates into the POLE, MSI, and CNV-low genomic subtypes, whereas CNV-high consists of all serous tumors and a small number of endometrioid tumors. Our cohort included 7 POLE, 25 MSI, 43 CNV-low, and 20 CNV-high tumors (Figure 1). Protein and PTM levels differing between genomic subtypes (FDR < 0.05, Wilcoxon rank-sum test) are shown in Figure 1 (also see Table S3). Functional analysis of protein levels by subtype indicated a relative downregulation of cell cycle proteins and phosphorylation in the CNV-low subtype, associated with an increase in cell transport and metabolism proteins. Furthermore, phosphorylation on proteins related to DNA double-strand break repair was decreased without a corresponding protein level change (Table S3). Conversely, the CNV-high subtype had increased phosphorylation on proteins involved in ATM signaling. As expected, mismatch repair was generally suppressed in POLE, MSI, and CNV-high subtypes. Serous samples have the highest upregulation of ribosome biogenesis, which has been associated with poor cancer prognosis (Pelletier etal., 2018).
Roughly 61% of all somatic mutations were found in the seven POLE tumors (n = 32,340; 32,188 point mutations and 152 indels), five of which harbored the known recurrent hotspot mutation P286R in the catalytic subunit of DNA polymerase epsilon (POLE). MSI tumors carried 88% of all indels in the cohort (n = 5,061), and a focused analysis on microsatellite indels found higher mutation rates for significantly mutated genes (SMGs) in this subtype than previously reported, including PTEN (92%), ARID1A (76%), and RPL22 (64%) (all FDR = 0, STAR Methods). We additionally identified INPPL1 (56%), KMT2B (56%), and JAK1 (44%) as putative SMGs in the MSI subtype, which were not reported in the TCGA study (Figure S2A) (FDR = 0, 0.001, and 6.4e-07, respectively, STAR Methods). Of note, all of the JAK1 frameshift mutations were in MSI samples and were derived from microsatellite indels (Figure S2B). JAK1 mutations, which are associated with high tumor grade (Figure S2C), could promote immune evasion in MSI samples (see Antigen Processing and Presentation Deficiency). Using a conservative proteo-genomics approach (STAR Methods), we were able to confirm 206 putative somatic coding variants at the protein level, along with 85 novel splice junctions (Table S4). The set of genes frequently altered by copy number variation, including ERBB2, CCNE1, FGFR3, and IGF1R, was similar to that in the TCGA cohort.
In summary, the genomic characteristics of our prospective EC cohort are consistent with those of the prior TCGA study, with the exception of some increases in observed mutations that could be attributable to differences in the DNA sequencing platforms used.
Somatic Drivers Impact the Cancer Proteome and Phosphoproteome
We examined the impact of somatic driver mutations on the proteome and phosphoproteome, both c/s-acting (acting on the gene in which the mutation occurs) and trans-acting (acting on other genes), focusing on 18 SMGs (STAR Methods). Of these 18 SMGs, we identified 7 and 6 genes with c/s and trans effects, respectively (FDR < 0.05, Wilcoxon rank-sum test). We found a total of 143 trans associations (71 at the protein level and 72 phosphosites) spanning 49 interacting proteins. The largest trans associations at both protein and phosphorylation levels involved mutations in ARID1A, TP53, and CTNNB1, likely in connection with their known regulatory roles (STAR Methods, Figure 2A) (Bailey et al., 2018). As expected, in tumors with TP53 mutations, we observed an increase in levels of p53 itself, as well as in other proteins in the p53 pathway (e.g., CDK1 and CHEK1). Through a similar process, we observed reduced levels of phosphorylated ARID1A, MAP3K4, KMT2D, and INPPL1 in cis but increased levels of phosphorylated β-catenin and p53 (Figure 2A).
Figure 2. Effects of Somatic Mutations.

(A) Cis and trans effects of mutations in EC SMGs. Affected proteins and phosphoproteins are grouped by pathway.
(B) Effects of missense and truncation mutations.
(C) Effects of CTNNB1 mutations.
(D) p53 binds DNA as a tetramer. Highlighted in red is a mutation-phosphosite cluster that directly affects the DNA binding domain of p53.
(E) Effects of TP53 mutations.
See also Figure S3.
By assessing truncating and missense mutations separately, we detected distinct effects of the two mutation types on RNA, protein, and phosphoprotein levels of several key genes (Figure 2B). Missense mutations can either promote or stifle gene expression at the protein level, though this was rarely reflected at the RNA level. As observed previously, there was an increase in protein levels of β-catenin and p53 associated with known hotspot mutations (Gao et al., 2017; Suad et al., 2009) and a decrease in PIK3CA and SYNE1. The effect of mutations on protein levels in our cohort tended to correlate well with phospho-protein levels; taken together with the lack of variance in RNA levels, this suggests strong translational and protein-stability-related regulation, especially as these patterns persist even when the hypermutated POLE and MSI tumors are removed from the analysis (Figure S3A). Truncating mutations, meanwhile, led to decreases in ARID1A, INPPL1, JAK1, PTEN, and RBM27 protein levels.
Effects of CTNNB1 Mutations
Exon 3 of CTNNB1, an SMG that codes for the protein β-catenin, is known to have several mutational hotspots at or near phosphorylation sites that, when altered, lead to constitutive β-catenin activation. Altered β-catenin is thought to drive tumorigenesis in multiple cancers (Gao et al., 2017), notably colorectal cancer (Wong and Pignatelli, 2002) and EC (Machin et al., 2002). EC patients with low-stage, low-grade endometrioid tumors, who would normally have a good prognosis, have a much higher chance of recurrence when CTNNB1 is mutated, although the reason for this is unclear (Kurnit et al., 2017; Myers et al., 2014). To understand the underlying mechanism, we analyzed the impact of hotspot CTNNB1 mutations, which were found in 23 tumors in the cohort, on the proteome and phosphoproteome (Figure 2C; Figure S3B). Of these 23 tumors, all but two are CNV-low or MSI, none are higher than grade 2, and only three are stage III; the rest are stage II or lower. We observed increased protein and phosphoprotein levels of known physically interacting complex partners and upstream regulators of β-catenin in tumors with hotspot mutations (Figure 2C; Figures S3C and S3D). β-catenin, APC, and AXIN1 form the β-catenin destruction complex that serves as a major mediator within the Wnt signaling pathway; APC and AXIN1 protein levels were also upregulated in CTNNB1 -mutated tumors (Figure S3E). In fact, tumors with CTNNB1 hotspot mutations had higher Wnt signaling pathway activity (STAR Methods) than did their WT MSI and CNV-low counterparts (Figure S3F) (p = 2.5e-3, Student’s t test). This study marks the first instance of co-identification of CTNNB1 complex partners and upstream regulators via global mass spectrometry-based proteomics.
We used HotSpot3D (Niu et al., 2016) to assess whether 3D proximity of a mutation to a PTM can affect the protein. Indeed, the CTNNB1 exon 3 hotspot region (centered at S33) formed a 3D cluster, consisting of the phosphosites at Y30, S33, and T40, as well as recurrent mutations at D32 and G34 (Figure 2C). This suggests a possible reason why mutated non-phosphosite residues in this region result in the same phenotype as mutations directly in the phosphosite codons.
An alternative upstream mechanism for β-catenin overexpression in EC involves the deactivation of APC, which normally promotes phosphorylation of β-catenin, leading to β-catenin degradation. In the 11 tumors without mutation-phosphosite overlaps in CTNNB1 but with mutations in APC, we observed reduced levels of APC and higher levels of β-catenin, although this increase was much less pronounced than that observed in tumors with CTNNB1 exon 3 mutations. Conversely, when considering CTNNB1 exon 3 mutants on their own, we observed regular protein levels of APC (Figure S3E). By accounting for the proximity of mutations to phosphosites, we found that our results were consistent with the two mutually exclusive mechanisms for increasing β-catenin levels: either somatic mutation in CTNNB1 hotspots or mutational inactivation of APC.
To summarize, we observed co-regulation of CTNNB1 and key interacting proteins, including reciprocal activating mutations of CTNNB1 and inactivating mutations of APC as modulators of β-catenin levels, as well as providing mechanistic insight into the roles of specific CTNNB1 mutations.
Effects of TP53 Mutations
TP53 is the most commonly mutated gene in human cancers (Hainaut and Pfeifer, 2016). TP53 mutations were observed in 23 tumors in our cohort, including all serous carcinomas. Instead of grouping all TP53-mutated tumors together and looking for a single molecular phenotype, we segregated them by mutation type and location. We identified several proteomic and phospho-proteomic signatures that are consistent with the emerging hypothesis of neofunctionalization for hotspot missense mutations (Kim et al., 2015; Lang et al., 2004). Eleven tumors harbored missense mutations in a spatially clustered hotspot in p53’s DNA-binding domain (Suad et al., 2009) (Figure 2D), which led to elevated protein levels (Figure 2E). This cluster included the highly recurrent mutated residues R248 and R273 that interfere with p53’s ability to bind DNA (Mello and Attardi, 2013) and cause cascading dysregulation of downstream proteins including AURKA (Nikulenkov et al., 2012) and XRN2 (p = 7.8e-06, t test), an exoribonuclease that promotes the epithelialmesenchymal transition (EMT) and metastasis (Zhang et al., 2017a). A variety of truncating TP53 mutations were found in seven tumors. Although the observed truncating mutations did not alter p53 protein levels (p = 0.082, t test), they were nevertheless associated with downstream effects, including increased phosphorylation of PLK1-T210, which triggers recovery from the G2 DNA damage checkpoint (Macurek et al., 2008; Paschal et al., 2012) and mitotic entry (Vigneron et al., 2018). Indeed, tumors with truncating TP53 mutations are enriched for mitotic cells; among 14 mitotic marker proteins (Ly et al., 2017), most showed increased levels in tumors with TP53 mutations (Figure S3G). This is likely caused by aberrant p53 function in mutant samples allowing cells to enter mitosis despite having DNA damage that would be detected in TP53 WT tumors. A third subset of p53 interacting proteins, including CDK1, XPO1, and TPX2, was dysregulated whenever TP53 was mutated regardless of the specific type of mutation.
Although TP53 hotspot mutations have been extensively studied, including the likely differential functional consequences between truncating mutations and neofunctionalization hotspot mutations, the actual effects of distinct TP53 mutations on the protein level of trans-interacting proteins in specific cancers have not been well described prior to this study. The mutation-type-specific effects described above appear to be unique to EC; we examined the CPTAC data for ovarian and colon cancer, where TP53 mutations are very common, but observed no change in AURKA, CDK1, XPO1, or STK11 protein levels associated with the type of TP53 mutation (Figure S3H).
Regulation of Histone Acetylation
Characterization of the patient-derived cancer tissue acetylome has been limited. Similar to previous work in cell lines (Choudhary et al., 2009, 2014), we observed an enrichment in EC tumors of acetylated proteins involved with splicing, RNA transport, protein synthesis and degradation, and metabolic pathways (Figure S4A). We observed a large degree of heterogeneity in histone acetylation patterns across tumor samples (Figure S4B) but no strong association with discrete genomic subtypes or clinical features. We found positive associations between BRD3 protein levels and several H2B N-terminal acetylation sites, as well as negative associations between SIRT1, SIRT3, BRD4 protein levels, and H3K27 and K36 acetylation levels (Figure 3A; Figure S4C). This suggests that BRD3 can potentially bind to H2B N-terminal acetyl residues, which could make them less accessible to erasers and prevent their deacetylation. In addition, negative correlations between SIRT1 and SIRT3 and H3 acetylation indicate that these histone deacetylases couldregulate H3K27 and K36 acetylation levels. Overall, we identified 322 sites that are upregulated (n = 216) or downregulated (n = 106) in tumor samples as compared with normal samples (Figure 3B; STAR Methods).
Figure 3. Acetylation.

(A) Associations of the levels of key acetylation enzymes with histone acetylation sites.
(B) Change in acetylation levels between tumor samples and normal endometrium samples. The horizontal line denotes an FDR cutoff of 0.05, and the vertical lines denote a fold change of 0.4. Grey points represent sites whose acetylation change is explained by a change in protein levels.
(C) Association between histone acetylation sites and mutated SMGs. The acetylation change is shown for the most significant site in each histone protein.
(D-F) Acetylation-level changes in specific histone sites in WT and mutated samples for CTNNB1 (D), ARID1A (E), and KRAS (F).
See also Figure S4.
We assessed how histone acetylation is affected by mutations in EC and found upregulation of H2B N-terminal acetylation sites K16, K20, and K24 in samples with CTNNB1 hotspot mutations (Figures 3C and 3D; Figure S4D) and upregulation of H3 sites, including K27 and K36, in both ARID1A- and KRAS-mutated samples (Figures 3E and 3F). Previous reports have underscored the importance of acetylation-driven mechanisms in Wnt signaling (Alok et al., 2017; Levy et al., 2004; Wolf et al., 2002); we observed increases in BRD3 and SIRT1 protein levels in CTNNB1 hotspot mutants that were consistent with the observed effects of CTNNB1 hotspot mutations on H2B acetylation (Figure S4D). Additionally, we observe an upregulation of gene expression in several Wnt pathway genes in samples with high H2B acetylation levels (Figure S4E).
We identified 56 downregulated sites and 16 upregulated sites in the CNV-low subtype as compared with the CNV-high subtype (Figure S4F). One upregulated site, FOXA2-K274, has been found, when deacetylated, to decrease FOXA2 stability (van Gent et al., 2014). FOXA2 itself has been linked to increased cell proliferation and invasion in colon cancer (Wang et al.,2018). Hence, the increased FOXA2 acetylation could indicate improved stability and activity of the protein, which might promote proliferation of CNV-low EC tumors. However, FOXA2 has also been found to inhibit metastasis in lung adenocarcinomas (Li et al., 2015; Tang et al., 2011), so further work is required to define the role of FOXA2 acetylation in EC.
Our observations highlight the heterogeneity of the acetylome in EC and the potential impact of mutations in SMGs on histone acetylation levels, which could have overarching effects on tumor biology via newly identified interactions with the Wnt signaling pathway, BRD proteins, and methylation proteins. The extent to which these relationships are specific to EC or a general effect of CTNNB1 mutations on histone acetylation will require similar comprehensive studies of the acetylome in other cancers. Additionally, we identify tumor-specific upregulation of acetylation levels in translation elongation factors and methyl-transferase proteins, as well as a potential role for FOXA2 in the more aggressive CNV-high subtype.
Multi-omic Analysis Reveals DNA Methylation and Somatic Copy Number Alteration Drivers
DNA methylation (DNAme) analysis revealed elevated genome-wide CpG island DNAme in MSI tumors (Figure S5A), which is consistent with previous reports (Horowitz et al., 2002; Tao and Freudenheim, 2010). Methylation-silenced genes include MLH1, an essential component of the DNA mismatch repair (MMR) machinery (Figure 4A; Figure S5B). We also found that several HOX family members were silenced by DNAme (Figure 4A). HOX genes have been previously connected to double-strand DNA break (DSB) repair (Feltes, 2019). We identified an anticorrelation between HOX protein levels and H2AX protein phosphorylation, a molecular indicator of DSBs. There has been speculation that tumors with MMR defects are also more prone to have DSBs (Nowosielska and Marinus, 2008). Our results suggest that increased methylation of the relevant factors could partially account for the dampening of both of these DNA repair pathways (Figure S5B).
Figure 4. Proteomics Data Reveal SCNA and DNA Methylation Drivers of Tumor Progression.

(A) MLH1 and HOX family genes are directly affected by DNA methylation. Samples are ranked from lowest (left) to highest (right) DNA methylation levels.
(B) Effects of SCNA on mRNA and protein levels. Top: copy number correlation with mRNA (left) and protein (right). Positive and negative correlations are indicated in red and blue, respectively. Bottom: the frequency of correlations. Blue bars represent copy number correlation with mRNA (left) and protein (right), and black bars represent copy number correlation to both mRNA and protein.
(C) 1q amplification is anticorrelated with p53 pathway activity. The samples are ranked based on their inferred p53 pathway activity. The triangles denote recurrent TP53 mutations across multiple cancer types.
(D) Identifying novel p53 inhibitors encoded on 1q. On the top, all quantifiable genes in proteomics, transcriptomics, and copy number alterations are ranked based on the correlation between the protein level and p53 activity. On the bottom, from top to bottom, 1q genes, 1q genes with SCNA cis effects, and 1q histone modifiers with SCNA cis effects are highlighted.
(E) The correlation between SCNAs, mRNA level, and protein levelsfor1q histone modifiers. Samples are ranked from lowest (left) to highest (right) copy number values.
(F) SETDB1 protein levels showed anticorrelation with CDKN1A RNA.
Integrated analysis of somatic copy-number alterations (SCNAs) with transcriptomic and proteomic data revealed that 14% of all SCNAs were associated with cis effects (FDR < 0.01, Spearman’s test). The SCNAs with the strongest trans effects (i.e., demonstrating a broader impact on global gene expression) were centered on chromosomes 1q, 3q, 4q, and 20q (Figure 4B; Table S5) and were identified in the CNV-high tumors (Figure S5C). Proteins whose levels were positively associated with 3q amplification included DNA replication and cell cycle proteins, such as cyclin-dependent kinases and minichromosome maintenance family members (FDR < 0.05, hypergeometric test, Figure S5D). The pathways most impacted by 4q loss included cytoskeleton and cilium assembly (Figure S5E); interestingly, ciliopathy has recently emerged as an indicator of tumor onset (Sanchez and Dynlacht, 2016).
Chromosome 1q amplification was the only SCNA commonly observed in both MSI and microsatellite stable (MSS) tumors. Consistent with previous findings (Horowitz et al., 2002; Tao and Freudenheim, 2010), we confirmed that 1q amplification was anticorrelated with p53 pathway activity (p < 0.01, Pearson’s correlation, Figure 4C; STAR Methods). Because TP53 mutations are rare in MSI tumors, we speculated that 1q amplification could be a major mechanism in repression of p53 pathway activity in these tumors. We confirmed that the mRNA levels of MDM4, a gene located in 1q that codes for a previously reported p53 inhibitor (Depreeuw et al., 2017), were increased along with its copy number (p < 0.01, Spearman’s correlation). However, we did not detect the MDM4 protein, likely due to low abundance. To identify potential p53 pathway inhibitors with protein evidence, we ranked all genes based on the anticorrelation between their protein level and p53 activity and highlighted the ones with SCNA cis effects (Figure 4D). As expected, genes mapping to 1q exhibited stronger negative correlation with p53 pathway activity than did other genes (p = 3.4e-4, STAR Methods). That negative correlation was even stronger for 1q genes with SCNA-protein correlation than for other 1q genes (p = 1.1e-4, GSEA), suggesting a role for SCNA-driven overexpression of 1q genes in repressing p53 pathway activity. The top-ranked genes included many histone modifiers including SETDB1, SDE2, PARP1, and GATAD2B (Figures 4D and 4E). SETDB1, the strongest candidate, showed anticorrelation to p53 pathway target proteins, including the cell cycle repressor CDKN1A and the apoptotic protein TNFRSF10B (Figure 4F; Figure S5F) (Pappas et al., 2017). Our analysis supports the possibility that the SCNA driver genes encoded on chromosome 1q inhibit p53 activity by repressing p53 pathway components or downstream target genes.
Discovery of a Potential Role for circRNAs in EMT Regulation
Circular RNAs (circRNAs) have recently drawn interest for their role in tumor biology (Chen et al., 2019; Dragomir and Calin, 2018; Hansen et al., 2013; Kristensen et al., 2018; Vo et al.,2018. We identified 234 recurrent circRNAs (see Figure S6A for the ten most commonly observed). The circRNAfrom the tumor-suppressor gene FBXW7 can be translated into a protein product that can reduce the half-life of c-Myc (Yang et al., 2018); two other circRNAs, circHIPK3 and circDOCK1, are known to regulate cell growth and serve as cancer biomarkers (Zhang et al., 2017b; Zheng et al., 2016). We observed an overall positive correlation among circRNAs; such correlation was not observed among their host genes (Figure 5A), suggesting coregulation of circRNAs at the global level. To identify possible regulators, we correlated the protein levels of all RNA-binding proteins (RBPs) with circRNA levels (Figure 5B; Table S5). The protein level of QKI, a recently reported circRNA regulator (Conn et al., 2015), was positively correlated with 35 circRNAs, whereas the protein level of ESRP2 was negatively correlated with 20 circRNAs. These RBPs might serve as master regulators of circRNAs. QKI is upregulated during EMT and can promote EMT by regulating hundreds of alternative splicing targets (Conn et al., 2015; Nieto et al., 2016; Pillman et al., 2018). We found a positive correlation between relative QKI protein level and EMT score (Figure 5C; STAR Methods) and with the EMT activators ZEB1 and ZEB2 (Krebs et al., 2017; Zhang et al., 2015) (Figures S6B and S6C). The level of ESRP2, which plays an important role in maintaining epithelial features (Warzecha and Carstens, 2012; Warzecha et al., 2009), was negatively correlated with QKI level, as previously reported (Conn et al., 2015; Ishii et al., 2014; Mizutani et al., 2016) (Figure 5D).
Figure 5. Discovery of circRNAs and Their Potential Roles in EMT Regulation.

(A) Distributions of correlations between pairs of circRNAs and between circRNAs and their host genes.
(B) Numbers of circRNAs correlated to RBPs.
(C) Positive correlation is found between QKI protein level and EMT score.
(D) Negative correlation is found between QKI and ESRP2 protein levels.
(E) Correlation between QKI protein level and miRNA expression/activity.
(F) Schematic of our model shows QKI, circRNAs, and miRNAs forming a positive feedback loop to promote EMT in EC.
Because miRNAs play critical roles in EMT (Zaravinos, 2015), and circRNAs can serve as miRNA sponges to regulate miRNA activity, we predicted miRNA binding sites in the 35 circRNAs that were correlated with QKI level, finding potential binding sites for 36 miRNAs (p < 0.02, Figure S6D; STAR Methods). We further predicted sample-specific activities of these miRNAs based on the level of their known mRNA targets (STAR Methods). We found that the activities of these miRNAs were negatively correlated with QKI expression, although their abundances showed varying relationships with QKI levels (Figure 5E). This suggests that the activity of these miRNAs might be opposed by QKI, possibly through QKI-mediated expression of circRNAs. Interestingly, we found known QKI regulators miR-200c and miR-221 (Cochrane et al., 2009; Mukohyama et al., 2017; Pillman et al., 2018) among the miRNAs with the strongest negative correlations between their activity and QKI levels; this set of miRNAs also included miR-130a, miR-130b, and miR-183, which are predicted QKI regulators (Figures S6E–S6I) (Dweep et al., 2011; Lewis et al., 2005). In summary, the observed positive correlation between QKI and circRNAs, and the negative correlation of QKI with the activity of specific miRNAs, suggests a mechanism promoting the EMT in EC (Figure 5F).
Proteomic Markers of Clinical and Genomic Tumor Subtypes
We compared proteomic and transcriptomic changes between subtypes (Table S6). Protein and mRNA changes were highly correlated for all subtypes (Figures S7A–S7C). When comparing MSI to MSS tumors, we confirmed that MLH1 and EPM2AIP1 were downregulated in MSI samples at both the protein and mRNA levels (Figure 6A), likely due to methylation of their shared promoter (Figure 4A), a common cause of microsatellite instability (Simpkins et al., 1999). However, PMS1 and PMS2, two binding partners of MLH1, were downregulated only at the protein level (Figure 6A; Figure S7D). The stability of these proteins is known to decrease in the absence of MLH1 (Chang et al., 2000). We further identified upregulation of RPL22L1 in MSI tumors at both the mRNA and protein levels. Its paralog gene, RPL22, is mutated in many of the MSI tumors, and RPL22L1 protein levels were highest in these tumors (Figure 6B, p = 0.002, rank-sum test). MSI tumors could upregulate RPL22L1 to compensate for the loss of RPL22; indeed, it has been shown that RPL22 and RPL22L1 share a synthetic lethal relationship (McDonald et al., 2017).
Figure 6. Proteomics-Driven Clinical Utility.

(A) Differential levels of protein (green), phosphorylation sites (maroon), and acetylation sites (yellow) between MSI and MSS tumors.
(B) Comparison of RPL22L1 protein levels between MSI tumors with and without RPL22 indel and MSS tumors.
(C) Differential levels of protein (green), phosphorylation sites (maroon), and acetylation sites (yellow) between serous and endometrioid tumors.
(D-F) Correlation between PLK1 level and the levels of its substrates TP53BP1-S1763 (D) and CHEK2-S163 (E) and G2M checkpoint protein level (F).
(G) Dependence of PLK1 level on DNA damage signaling. * indicates p < 0.05
(H) Proteins with drug interactions that are enriched in DDR-high endometrioid and/or DDR-high serous samples (outlier analysis FDR < 0.05).
(I) Proteins with drug interactions that are enriched in serous or endometrioid CNV-high samples (outlier analysis FDR < 0.05).
When comparing serous to endometrioid tumors, the most striking observation was that TP53BP1-S1763 and CHEK2-S163 were highly phosphorylated in serous tumors (Figure 6C). These sites are among those phosphorylated by PLK1 to inactivate the DNA damage response (DDR) and drive progression through the G2M checkpoint (van Vugt et al., 2010). The levels of phosphorylated TP53BP1-S1763 and CHEK2-S163 were correlated with PLK1 protein levels (Figures 6D and 6E), which correlated in turn with G2M checkpoint score (Figure 6F, R = 0.67, p = 7.9e-14), indicating progression through the G2M checkpoint. These results are consistent with previous studies showing that overexpression of PLK1 is a driver of chromosomal instability (de Cárcer et al., 2018) and that DDR and G2M checkpoint activation are closely linked (Liu et al., 2000; Matsuoka et al., 1998; Sancar et al., 2004; Wang et al., 2015). We generated a DDR score for our samples based on known DDR marker phosphoproteins (Matsuoka et al., 2007) (STAR Methods; Figure S7E). As expected, we found that PLK1 protein level (Figure 6G; and Figure S7F) and G2M protein level (Figure S7H) were higher in samples with a high DDR score, as was phosphorylation on CHEK2-S163 (Figure S7G), even though neither protein was incorporated into the DDR score. DDR-high samples were enriched for serous tumors and therefore the CNV-high subtype, but the DDR-high endometrioid tumors came from the CNV-high, POLE, and MSI genomic subgroups (Figure S7E), indicating that active DNA damage signaling is largely independent of genomic subtype.
In order to nominate new chemotherapeutic targets for DDRhigh tumors, we compared hyperphosphorylation, a proxy for abnormally high activity (Huang et al., 2017; Mertins et al., 2016; Mundt et al., 2018), between DDR-high and DDR-low tumors, and found that several proteins that have known interactions with FDA-approved drugs were hyperphosphorylated in DDR-high samples (Figure 6H). In particular, DNMT1 is a protein that was hyperphosphorylated in both endometrioid and serous DDR-high tumors. This protein has several known inhibitors, including azacitidine and decitabine (Hollenbach et al., 2010), that have demonstrated use in treating several myelodysplastic syndromes and other blood cancers. This finding highlights the potential for personalized therapy beyond traditional PARP inhibitors in tumors with elevated DNA damage.
The subset of endometrioid samples that are CNV-high have a prognosis that is similar to the more aggressive serous histotype (Kandoth et al., 2013). It is useful to determine whether they are also similar to serous tumors at a molecular level and therefore susceptible to the same treatments. It is also critical to determine what molecular underpinnings differentiate these tumors from the more treatable endometrioid tumors in the other three genomic subgroups, both in order to facilitate early diagnosis and to pinpoint possible therapeutic targets. Although no proteins were differentially expressed between CNV-high endometrioid and non-CNV-high samples or between CNV-high serous and non-CNV-high samples, a subset of proteins were differentially hyperphosphorylated; 45 proteins were hyperphosphorylated in both endometrioid and serous CNV-high samples, whereas 479 proteins were hyperphosphorylated exclusively in the serous comparison and 53 exclusively in the endometrioid comparison (Figure S7I). Because patients with CNV-high tumors have a particularly poor prognosis regardless of histology, we focused on identifying promising targets for future studies developing new chemotherapy drugs by finding proteins that are likely to be hyperactivated in CNV-high samples (Blumenberg et al., 2019). Of the proteins found in both comparisons, six have potentially useful known drug interactions; two of these, CDK12 and SMARCA4, are targeted by FDA-approved drugs (Figure 6I). Of the proteins differentially phosphorylated only in endometrioid CNV-high samples, six additional proteins have known drug interactions, including one protein (PML) that is the target of an FDA-approved antineoplastic drug (Figure 6I). As a specific example, CDK12 is known to modulate the susceptibility of ovarian cancer to the PARP inhibitor olaparib (Bajrami et al., 2014); the hyperphosphorylation of CDK12 in EC suggests potential utility as a target for sensitization of EC to PARP inhibitors. In addition, targeting of CDK12 has been shown to enhance responses to immune checkpoint blockade (Omar and Tolba, 2019), suggesting utility as an adjunct to immunotherapy. Finally, kinase activity inferred from phosphoproteomic data identified several kinases activated in CNV-high endometrioid tumors compared to CNV-low tumors, including CDK4, which can be targeted by multiple FDA-approved drugs (Figure S7J; Table S6).
Tumor Antigens as Putative Vaccine Antigens
Tumor antigens, including cancer/testis (CT) antigens and neoantigens derived from somatic mutations, can serve as candidates for vaccine development in cancer immunotherapy (Almeida et al., 2009; Lee et al., 2003). We found protein evidence for putative neoantigens in 49.3% of the samples. The POLE molecular subtype contained the highest number of neoantigens per sample, followed by the MSI subtype (Figure 7A). Eight known CT antigens were observed in >10% of tumors using a cutoff of > 3-fold level increase in tumor samples as compared with normal tissue (Figure 7A). Overall, 59% of tumors contained at least one CT antigen. Unlike neoantigen expression, CT antigen expression was independent of POLE and MSI status. CT antigen IGF2BP3 was highly upregulated in serous tumors as compared with endometrioid; it has been identified as a biomarker of serous histology (Mhawech-Fauceglia et al., 2010; Zheng et al., 2008). We also observed overexpression of ATAD2 or PBK CT antigens, both of which have also been suggested as potential clinical biomarkers for EC (Berg et al., 2017; Krakstad et al., 2015). In addition to serving as cancer biomarkers, CT antigens are inherently immunogenic. For example, peptides derived from IGF2BP3 have been shown to be immunogenic in vitro (Suda et al., 2007) and in vivo in human esophageal cancer (Kono et al., 2009). Overall, 78% of tumors had either evidence of a neoantigen or high expression of a common CT antigen (Figure 7A; Table S7), demonstrating the utility of proteogenomics in identifying potential tumor antigens for vaccine development in cancer immunotherapy.
Figure 7. Immune Landscape of EC.

(A) Putative neoantigens and CT antigens.
(B) Tumor samples are divided into four immune subtypes by TMB and APM efficiency.
(C) Immune profiles of each immune subtype.
(D) Comparison of the JAK/STAT pathway between TMB-H/APM-H and TMB-H/APM-L groups. * indicates p < 0.05; *** indicates p < 0.001.
See also Table S7.
Antigen Processing and Presentation Deficiency
Immune checkpoint inhibition is an increasingly successful cancer immunotherapy. Higher tumor-mutation burden (TMB) has been shown to predict clinical benefit of immune checkpoint inhibition across human cancers (Samstein et al., 2019). However, effective immune targeting of tumor cells also requires that the cellular antigen processing and presentation machinery (APM) effectively displays the tumor antigens that allow T cells to recognize and kill tumor cells (Baxevanis et al., 2019; Eggermont et al., 2014). We found high variation in APM efficiency (estimated based on APM protein levels, see STAR Methods) that was independent of TMB (Figure 7B). We divided the tumors into four groups based on TMB and APM scores (STAR Methods). We then quantified the immune-cell infiltration scores of each tumor with single sample gene-set enrichment analysis based on recently published immune-cell signatures (STAR Methods; Table S7) (Charoentong et al., 2017). Cell-type immune scores (p < 0.05, one-way ANOVA) are shown in Figure 7C. Consistent with the inference above, the TMB-high and APM-low (TMB-H/APM-L) group had a relatively lower immune score for most of the immune cells than the TMB-high and APM-high (TMB-H/APM-H) group, including cytotoxic CD8+ T cells. Interestingly, TMB-low and APM-high (TMB-L/APM-H) had the highest immune score despite its low TMB. However, the high score appears to be dependent on high levels of suppressive immune cells, including myeloid-derived suppressor cells and regulatory T cells (Bianchi et al., 2011; Wang et al., 2017); this group had lower infiltration of activated CD8+ and CD4+ T cells than did TMB-H/APM-H, which is suggestive of an immunosuppressive microenvironment. These results indicate that TMB and APM act independently to shape the tumor immune microenvironment in EC and could independently recruit different populations of immune cells.
Although recent studies have shown TMB to be an independent predictor of response to immunotherapy (Goodman et al., 2017; Samstein et al., 2019), our results showed that high-TMB tumors have diverse APM efficiency and immune microenvironments. Based on the prevalence of microsatellite indel-derived JAK1 mutations in MSI EC samples (Figure 1) and a correlation between the presence of microsatellite indel-derived JAK1 mutations and higher tumor grade in both this and the TCGA cohort (Figure S2C), we focused our analysis on the JAK/STAT pathway, which activates interferon (IFN) pathways to regulate antigen presentation (Aaronson and Horvath, 2002; Schindler et al., 2007). We observed that the TMB-H/APM-L group had lower IFNg and IFNa activity than the TMB-H/APM-H group (Figure 7C). The two POLE samples in the TMB-H/APM-L group had truncation mutations in JAK1 and STAT1, respectively (Figure 7D); we also found enrichment of JAK1 truncation mutations in the TMB-H/APM-L group. Because most of the JAK1 truncation mutations in MSI tumors are derived from microsatellite indels, which are much more common in EC than in the MSI subtype of colon cancer (Kim et al., 2013) (Figure S2B), JAK1 microsatellite indels could represent a major immune evasion mechanism in MSI EC, a theory which has also been considered in other cancer types (Shin et al., 2017; Stelloo et al., 2016). TMB-H/APM-L tumors without JAK1/STAT1 mutations had lower protein levels of antigen peptide transporters including TAP1, TAP2, and TAP2BP, providing an alternative mechanism for repressing antigen presentation and suppressing anti-tumor immune response (Harel et al., 2019). Moreover, HLA protein levels were lower in TMB-H/APM-L tumors than in TMB-H/ APM-H tumors. In summary, these results suggest several possible mechanisms by which EC cells could suppress the APM, leading to immune evasion. Although the FDA has approved MSI as a marker of immunotherapy for solid tumors (Lemery et al., 2017), our results suggest that JAK1/STAT1 mutations and TAP levels, which are markers of APM deficiency, should also be taken into account when selecting EC patients for treatment with immune checkpoint inhibitors.
DISCUSSION
This study provides a comprehensive overview of the molecular systems of EC at the genomic, transcriptomic, and proteomic levels. We confirmed protein-level expression of predicted events previously described at the genomic and transcriptomic level. Beyond that, we clearly demonstrated that distinct EC subtypes can be reliably distinguished by their patterns of protein levels and subsequent post-translational modifications. Although it is currently unclear how the distinct genomic subtypes defined by TCGA can best be leveraged to improve outcomes for women diagnosed with EC, the functional information provided by proteomic measurements, including protein phosphorylation and acetylation, provides a basis for a deeper understanding of EC biology and new approaches to clinical management.
A perennial issue has been the identification of the subset of low-grade, low-stage EC with paradoxically poor outcomes. Constitutive β-catenin activation through CTNNB1 mutations and other mechanisms has previously been associated with less favorable outcomes in low-grade, low-stage endometrioid EC (Liu et al., 2014). In this paper, we identify collaborating mechanisms of pathway activation arising when the known effects of CTNNB1 somatic mutations are coupled with APC mutations. These findings could help refine which tumors will behave in a more aggressive manner than expected and expand the range of biomarkers used for adjuvant therapies.
The consequences of various common TP53 mutations are thought to affect treatment outcomes (Meng et al., 2018); here we describe the effect of gain-of-function TP53 mutations on the Aurora kinase pathway, supporting reported associations between AURKA expression and poor outcomes in EC (Umene et al., 2015) and providing a theoretical basis for the use of AURKA inhibitors in these tumors. On a related note, 1q amplification has been associated with poor outcomes in seemingly favorable endometrioid EC (Depreeuw et al., 2017). These observations could be used to stratify treatment for more aggressive EC tumors.
EMT is an important component of EC progression with prognostic implications (Tanaka et al., 2013). In this study we uncovered evidence for a novel regulatory pathway involving QKI, circRNA, and ESRP2. ESRP2 regulates alternative splicing events associated with epithelial phenotypes of cells (Ishii et al., 2014) and plays a critical role during EMT by regulating isoforms of FGFR2, CD44, CTNND1, and ENAH (Lamouille et al., 2014; Warzecha et al., 2009). Through its known function in isoform regulation, ESRP2 could also directly regulate circRNA levels, and, if so, it could compete with QKI in circRNA-mediated gene regulation. Further work is needed to investigate the interplay of ESRP2 with circRNAs in EMT.
High-grade endometrioid and serous EC are associated with frequent recurrences and poor clinical outcomes even when diagnosed at early stages; unfortunately, consistently effective therapeutic options for these cancers are limited. We have identified multiple gene products that are highly expressed in the CNV-high subset of ECs that includes all serous EC and many of the high-grade ECs profiled. One of these gene products, CDK12, can be targeted to enhance clinical responses to immune checkpoint blockade (Omar and Tolba, 2019), providing an opportunity for improved selection of EC patients for checkpoint blockade immunotherapy. Long-term, these observations posit multiple strategies potentially useful for clinically managing CNV-high and other EC subtypes. It will be important to determine whether the distinguishing features we have observed are associated with distinct rates of tumor recurrence, response to therapy, and clinical outcomes as the demographic data available for this prospective cohort continues to mature.
Although immunotherapy approaches, including checkpoint inhibition and tumor vaccination, have been highly successful as cancer treatments, a significant proportion of patients fail to respond to these therapies. Our results indicate that measuring the capability of the tumor to process and present antigens would provide additional and possibly more effective criteria for the selection of patients for immunotherapy beyond the simple measurement of tumor mutation burden.
Integrating comprehensive quantitative measurements of protein, phosphorylation, and acetylation with genomic and transcriptomic measurements not only has provided novel insights into fundamental biological processes associated with carcinogenesis but also has provided intriguing leads for new therapeutic approaches in EC, including potential criteria for selecting the most appropriate therapies. Although the results presented herein are predominantly observational, they provide the basis for multiple hypotheses of clinical relevance that can and should be further explored by the scientific community.
STAR*METHODS
Detailed methods are provided in the online version of this paper and include the following:
LEAD CONTACT AND MATERIALS AVAILABILITY
Further information and requests for resources should be directed to the Lead Contact, David Fenyo (david@fenyolab.org). This study did not generate new unique reagents.
EXPERIMENTAL MODEL AND SUBJECT DETAILS
Patient Selection
The tumor, normal tissue, and whole blood samples used in this manuscript were prospectively collected between April 2016 and May 2017 for the CPTAC project. There are three types of normals were included in our analysis which are adjacent normal tissue without specific enrichment (adjacent normal), enriched endometrium normal (enriched normal), and adjacent normal without endometrium (myometrium normal). Biospecimens were collected from newly diagnosed patients with endometrial cancer (EC) who were undergoing surgical resection and had received no prior treatment for their disease, including chemotherapy or radiotherapy, and were collected independent of grade or stage. EC cases were graded using the FIGO (International Federation of Gynecology and Obstetrics) system or the American Joint Committee on Cancer TNM staging system, which are functionally identical.
METHOD DETAILS
Sample Collection
The CPTAC Biospecimen Core Resource (BCR) at the Pathology and Biorepository Core of the Van Andel Research Institute in Grand Rapids, Michigan manufactured and distributed biospecimen kits to the Tissue Source Sites (TSS) located in the US, Europe, and Asia. Each kit contained a set of pre-manufactured labels for unique tracking of every specimen respective to TSS location, disease, and sample type, used to track the specimens through the BCR to the CPTAC proteomic and genomic characterization centers.
Tissue specimens averaging 250 mg were snap-frozen by the TSS within a 30 min cold ischemic time (CIT) (CIT average =18 min) and an adjacent segment was formalin-fixed paraffin-embedded (FFPE) and H&E stained by the TSS for quality assessment to meet the CPTAC EC requirements. Routinely, several tissue segments for each case were collected. Tissues were flash frozen in liquid nitrogen (LN2) then transferred to a liquid nitrogen freezer for storage until approval for shipment to the BCR.
Specimens were shipped using a cryoport that maintained an average temperature of under −140°C to the BCR with a time and temperature tracker to monitor the shipment. Receipt of specimens at the BCR included a physical inspection and review of the time and temperature tracker data for specimen integrity, followed by barcode entry into a biospecimen tracking database. Specimens were again placed in storage at LN2 temperatures until further processing. Acceptable EC tumor tissue segments were determined by TSS pathologists based on the percent viable tumor nuclei (> 80%), total cellularity (> 50%), and necrosis (< 20%). Segments received at the BCR were verified by BCR and Leidos Biomedical Research (LBR) pathologists and the percent of total area of tumor in the segment was also documented. Additionally, disease-specific working group pathology experts reviewed the morphology to clarify or standardize specific disease classifications and correlation to the proteomic and genomic data.
Specimens selected for the discovery set were determined on the maximal percent in the pathology criteria and best weight. Specimens were pulled from the biorepository using an LN2 cryocart to maintain specimen integrity and then cryopulverized. The cryopulverized specimen was divided into aliquots for DNA (30mg) and RNA (30mg) isolation and proteomics (50mg) for molecular characterization. Nucleic acids were isolated and stored at −80°C until further processing and distribution; cryopulverized protein material was returned to the LN2 freezer until distribution. Shipment of the cryopulverized segments used cryoports for distribution to the proteomic characterization centers and shipment of the nucleic acids used dry ice shippers for distribution to the genomic characterization centers; a shipment manifest accompanied all distributions for the receipt and integrity inspection of the specimens at the destination. The DNA sequencing was performed at the Broad Institute, Cambridge, MA and RNA sequencing was performed at the University of North Carolina, Chapel Hill, NC. Material for proteomic analyses was sent to the Proteomic Characterization Center (PCC) at Pacific Northwest National Laboratory (PNNL), Richland, Washington.
Sample Processing for Genomic DNA and Total RNA Extraction
Our study sampled a single site of the primary tumor from surgical resections, due to the internal requirement to process a minimum of 125mg of tumor issue and 50mg of adjacent normal tissue. DNA and RNA were extracted from tumor and adjacent normal specimens in a co-isolation protocol using QIAGEN’s QIAsymphony DNA Mini Kit and QIAsymphony RNA Kit. Genomic DNA was also isolated from peripheral blood (3−5mL) to serve as matched normal reference material. The Qubit dsDNA BR Assay Kit was used with the Qubit® 2.0 Fluorometerto determine the concentration of dsDNA in an aqueous solution. Any sample that passed quality control and produced enough DNA yield to go through various genomic assays was sent for genomic characterization. RNA quality was quantified using both the NanoDrop 8000 and quality assessed using Agilent Bioanalyzer. A sample that passed RNA quality control and had a minimum RIN (RNA integrity number) score of 7 was subjected to RNA sequencing. Identity match for germ-line, normal adjacent tissue, and tumor tissue was assayed at the BCR using the Illumina Infinium QC array. This beadchip contains 15,949 markers designed to prioritize sample tracking, quality control, and stratification. The genomic DNA and total RNA extraction were only applied to a subset of adjacent normal tissues without enrichment for endometrium.
Whole Exome Sequencing
Library Construction
Library construction was performed as described in (Fisher et al., 2011), with the following modifications: initial genomic DNA input into shearing was reduced from 3mg to 20–250ng in 50mL of solution. For adaptor ligation, Illumina paired-end adapters were replaced with palindromic forked adapters, purchased from Integrated DNA Technologies, with unique dual-indexed molecular barcode sequences to facilitate downstream pooling. Kapa HyperPrep reagents in 96-reaction kit format were used for end repair/A-tailing, adaptor ligation, and library enrichment PCR. In addition, during the post-enrichment SPRI cleanup, elution volume was reduced to 30mL to maximize library concentration, and a vortexing step was added to maximize the amount of template eluted.
In-solution Hybrid Selection
After library construction, libraries were pooled into groups of up to 96 samples. Hybridization and capture were performed using the relevant components of Illumina’s Nextera Exome Kit and following the manufacturer’s suggested protocol, with the following exceptions.First, all libraries within a library construction plate were pooled prior to hybridization. Second, the Midi plate from Illumina’s Nextera Exome Kit was replaced with a skirted PCR plate to facilitate automation. All hybridization and capture steps were automated on the Agilent Bravo liquid handling system.
Preparation of Libraries for Cluster Amplification and Sequencing
After post-capture enrichment, library pools were quantified using qPCR (automated assay on the Agilent Bravo) using a kit purchased from KAPA Biosystems with probes specific to the ends of the adapters. Based on qPCR quantification, libraries were normalized to 2nM.
Cluster Amplification and Sequencing
Cluster amplification of DNA libraries was performed according to the manufacturer’s protocol (Illumina) using exclusion amplification chemistry and flowcells. Flowcells were sequenced utilizing sequencing-by-synthesis chemistry. The flowcells were then analyzed using RTAv.2.7.3 or later. Each pool of whole exome libraries was sequenced on paired 76 cycle runs with two 8 cycle index reads across the number of lanes needed to meet coverage for all libraries in the pool. Pooled libraries were run on HiSeq4000 paired-end runs to achieve a minimum of 150x on target coverage per each sample library. The raw Illumina sequence data were demultiplexed and converted to fastq files; adaptor and low-quality sequences were trimmed. The raw reads were mapped to the hg38 human reference genome and the validated bams were used for downstream analysis and variant calling.
PCR-Free Whole Genome Sequencing
Preparation of Libraries for Cluster Amplification and Sequencing
An aliquot of genomic DNA (350ng in 50mL) was used as the input into DNA fragmentation (aka shearing). Shearing was performed acoustically using a Covaris focused-ultrasonicator, targeting 385bp fragments. Following fragmentation, additional size selection was performed using a SPRI cleanup. Library preparation was performed using a commercially available kit provided by KAPA Bio-systems (KAPA Hyper Prep without amplification module) and with palindromic forked adapters with unique 8-base index sequences embedded within the adaptor (purchased from IDT). Following sample preparation, libraries were quantified using quantitative PCR (kit purchased from KAPA Biosystems), with probes specific to the ends of the adapters. This assay was automated using Agilent’s Bravo liquid handling platform. Based on qPCR quantification, libraries were normalized to 1.7nM and pooled into 24-plexes.
Cluster Amplification and Sequencing (HiSeq X)
Sample pools were combined with HiSeqX Cluster Amp Reagents EPX1, EPX2, and EPX3 into single wells on a strip tube using the Hamilton Starlet Liquid Handling system. Cluster amplification of the templates was performed according to the manufacturer’s protocol (Illumina) with the Illumina cBot. Flowcells were sequenced to a minimum of 15x on HiSeqX utilizing sequencing-by-synthesis kits to produce 151bp paired-end reads. Output from Illumina software was processed by the Picard data processing pipeline to yield BAM files containing demultiplexed, aggregated, aligned reads. All sample information tracking was performed by automated LIMS messaging.
Illumina Infinium MethylationEPIC BeadChip Array
The MethylationEPIC array uses an 8-sample version of the Illumina Beadchip capturing > 850,000 methylation sites per sample. 250ng of DNA was used for the bisulfite conversation using Infinium MethylationEPIC BeadChip Kit. The EPIC array includes sample plating, bisulfite conversion, and methylation array processing. After scanning, the data was processed through an automated genotype calling pipeline. Data generated consisted of raw idats and a sample sheet.
RNA Sequencing
QA and QC of RNA Analytes
All RNA analytes were assayed for RNA integrity, concentration, and fragment size. Samples for total RNA-seq were quantified on a TapeStation system (Agilent, Inc. Santa Clara, CA). Samples with RINs > 8.0 were considered high quality.
Total RNA-seq Library Construction
Total RNA Libraries were prepared on an Agilent Bravo Automated Liquid Handling System. Quality control was performed at every step, and the libraries were quantified using a TapeStation system.
Total RNA Sequencing
Indexed libraries were prepared and run on HiSeq4000 paired-end 75 base pairs to generate a minimum of 120 million reads per sample library with a target of greater than 90% mapped reads. The raw Illumina sequence data were demultiplexed and converted to fastq files, and adaptor and low-quality sequences were quantified. Samples were then assessed for quality by mapping reads to hg38, estimating the total number of mapped reads, amount of RNA mapping to coding regions, amount of rRNA in sample, number of genes expressed, and relative expression of housekeeping genes. Samples passing this QA/QC were then clustered with other expression data from similar and distinct tumor types to confirm expected expression patterns. Atypical samples were then SNP typed from the RNA data to confirm source analyte. FASTQ files of all reads were then uploaded to the GDC repository.
miRNA-seq Library Construction
miRNA-seq library construction was performed from the RNA samples using the NEXTflex Small RNA-Seq Kit (v3, PerkinElmer, Waltham, MA) and barcoded with individual tags following the manufacturer’s instructions. Libraries were prepared on Sciclone Liquid Handling Workstation. Quality control was performed at every step, and the libraries were quantified using a TapeStation system and an Agilent Bioanalyzer using the Small RNA analysis kit. Pooled libraries were then size selected according to NEXTflex Kit specifications using a Pippin Prep system (Sage Science, Beverly, MA).
miRNA Sequencing
Indexed libraries were loaded on the HiSeq4000 to generate a minimum of 10 million reads per library with a minimum of 90% reads mapped. The raw Illumina sequence data were demultiplexed and converted to FASTQ files for downstream analysis. Resultant data were analyzed using a variant of the small RNA quantification pipeline developed for TCGA (Chu et al., 2016). Samples were assessed for the number of miRNAs called, species diversity, and total abundance. Samples were uploaded to the GDC repository.
MS Sample Processing and Data Collection
Protein Extraction and Lys-C/Trypsin Tandem Digestion
The cryopulverized tumor and normal uterine tissue samples were obtained through the CPTAC Biospecimen Core Resource. Approximately 50 mg of each of the pulverized uterine tumor and normal tissues were homogenized separately in 200 mL of lysis buffer (8 M urea, 75 mM NaCl, 50 mM Tris, pH 8.0, 1 mM EDTA, 2 mg/mL aprotinin, 10 mg/mL leupeptin, 1 mM PMSF, 10 mM NaF, 1:100 v/v Sigma phosphatase inhibitor cocktail 2, 1:100 v/v Sigma phosphatase inhibitor cocktail 3, 20 mM PUGNAc, and 5 mM sodium butyrate). Lysates were precleared by centrifugation at 20,000 g for 10 min at 4°C and protein concentrations were determined by BCA assay (ThermoFisher Scientific) and adjusted to 8 mg/mL with lysis buffer. Proteins were reduced with 5 mM di-thiothreitol for 1 h at 37°C and subsequently alkylated with 10 mM iodoacetamide for 45 min at 25°C in the dark. Samples were diluted 1:3 with 50 mM Tris, pH 8.0 and digested with Lys-C (Wako) at 1:50 enzyme-to-substrate ratio. After 2 h of digestion at 25°C, an aliquot of the same amount of sequencing-grade modified trypsin (Promega, V5117) was added to the samples and further incubated at 25°Cfor 14 h. The digested samples were then acidified with 100% formic acid to 1% of the final concentration of formic acid and centrifuged for 15 min at 1,500 g at 4°C before transferring samples into new tubes leaving resulted pellet behind. Tryptic peptides were desalted on C18 SPE (Waters tC18 SepPak, WAT054925) and dried using Speed-Vac.
TMT-10 Labeling of Peptides
Desalted peptides from each sample were labeled with 10-plex TMT reagents according to the manufacturer’s instructions (ThermoFisher Scientific). Peptides (400 mg) from each of the tumors were dissolved in 400 mL of 50 mM HEPES, pH 8.5 solution, and mixed with 3.2 mg of TMT reagent that was dissolved freshly in 164 mL of anhydrous acetonitrile. Channel 126 was used for labeling the internal reference sample (pooled from all tumor and normal samples) throughout the sample analysis. After 1 h incubation at RT, 32 mL of 5% hydroxylamine was added and incubated for 15 min at RT to quench the reaction. Peptides labeled by different TMT reagents were then mixed, dried using Speed-Vac, reconstituted with 3% acetonitrile, 0.1% formic acid and desalted on tC18 SepPak SPE columns.
Peptide Fractionation by Basic Reversed-Phase Liquid Chromatography (bRPLC)
Approximately 3.5 mg of 10-plex TMT labeled sample was separated on a reversed phase Agilent Zorbax 300 Extend-C18 column (250 mm x 4.6 mm column containing 3.5-mm particles) using the Agilent 1200 HPLC System. Solvent A was 4.5 mM ammonium formate, pH 10,2% acetonitrile and solvent B was 4.5 mM ammonium formate, pH 10, 90% acetonitrile. The flow rate was 1 mL/min and the injection volume was 900 mL. The LC gradient started with a linear increase of solvent B to 16% in 6 min, then linearly increased to 40% B in 60 min, 4 min to 44% B, 5 min to 60% B and another 14 of 60% solvent B. A total of 96 fractions were collected into a 96 well plate throughout the LC gradient. These fractions were concatenated into 24 fractions by combining 4 fractions that are fractions apart (i.e., combining fractions #1, #25, #49, and #73; #2, #26, #50, and #74; and so on). For proteome analysis, 5% of each concatenated fraction was dried down and re-suspended in 2% acetonitrile, 0.1% formic acid to a peptide concentration of 0.1 mg/mL for LC-MS/MS analysis. The rest of the fractions (95%) were further concatenated into 12 fractions (i.e., by combining fractions #1 and #13; #3 and #15; and so on), dried down, and subjected to immobilized metal affinity chromatography (IMAC) for phosphopeptide enrichment.
Phosphopeptide Enrichment Using IMAC
Fe3+-NTA-agarose beads were freshly prepared using the Ni-NTA Superflow agarose beads (QIAGEN, #30410) for phosphopeptide enrichment. For each of the 12 fractions, peptides were reconstituted in 500 mL IMAC binding/wash buffer (80% acetonitrile, 0.1% trifluoroacetic acid) and incubated with 20 mL of the 50% bead suspension for 30 min at RT. After incubation, the beads were sequentially washed with 50 mL of wash buffer (1X), 50 mL of 50% acetonitrile, 0.1% trifluoroacetic acid (1X), 50 mL of wash buffer (1X), and 50 mL of 1% formic acid (1X) on the stage tip packed with 2 discs of Empore C18 material (Empore Octadecyl C18, 47 mm; Supleco, 66883-U). Phosphopeptides were eluted from the beads on C18 using 70 mL of elution buffer (500 mM K2HPO4, pH 7.0). Sixty microliter of 50% acetonitrile, 0.1% formic acid was used for elution of phosphopeptides from the C18 stage tips after two washes with 100 mL of 1% formic acid. Samples were dried using Speed-Vac and later reconstituted with 10 mL of 3% acetonitrile, 0.1% formic acid for LC-MS/MS analysis.
Immunoaffinity Purification of Acetylated Peptides
Tryptic peptides from the flow-through of IMAC were combined into four samples follow concatenation scheme and dried down using Speed-Vac. The dried peptides were reconstituted in 1.4 mL of the immunoaffinity purification (IAP) buffer (50 mM MOPS/NaOH pH 7.2, 10 mM Na2HPO4 and 50 mM NaCl). After dissolving the peptide, the pH of the peptide solution was checked using pH indicator paper. The amount of reconstituted peptides was quantified via BCA assay and concatenated into 4 fractions by combining 3 fractions that were 4 fractions apart (i.e., combining fractions #1, #5 and #9 as a new fraction). The antibody beads from PTMScan® Acetyl-Lysine Motif [Ac-K] Kit (Cell Signaling, #13416) were freshly prepared. Briefly, the antibody beads were centrifuged at 2,000 xg for 30 sand all buffer from the beads were removed; the antibody beads were then washed with 1 mLof IAP buffer for four times and finally resuspend in 40 mL of IAP buffer. For each fraction, half of the antibody in each tube was transferred to the peptide solution and incubated on a rotator overnight at 4°C. After removing the supernatant, the reacted beads were washed with 1mL of PBS buffer five times. For the elution of acetylated peptides, the antibody beads were incubated 2 times each with 50 mL of 0.15% TFA at room temperature for 10 min. The eluted peptides were transferred to the stage tip packed with two discs of Empore C18 material. The C18 stage tips were washed by 1% formic acid and 50% acetonitrile, and 0.1% formic acid was used for elution of peptides from the C18 stage tips. The eluted peptides were dried using Speed-Vac, and reconstituted with 13 mL of 3% acetonitrile, 0.1% formic acid right before the LC-MS/MS analysis.
The acetylated peptides prepared by IP from the IMAC flow-through may very well miss those peptides that are both phosphorylated and acetylated. Splitting the samples for independent IP and IMAC may improve the chance of recovering such peptides, assuming having both PTMson the same peptide does not impact the affinity of either the IP or IMAC process. However, acetylated peptides are estimated to be 10 times lower in abundance than the phosphopeptides, hence much larger input may be needed to recover the dual-modified peptides. Given the extremely low stoichiometry of these dual-modified peptides and the sample size limitations, it was not pursued in this work.
LC-MS/MS Analysis
Fractionated samples prepared for global proteome, phosphoproteome, and acetylome analysis were separated using a nanoACQUITY UPLC system (Waters) by reversed-phase HPLC. The analytical column was manufactured in-house using ReproSil-Pur 120 C18-AQ 1.9 mm stationary phase (Dr. Maisch GmbH) and slurry packed into a 25-cm length of 360 mm o.d. x 75 mm i.d. fused silica picofrit capillary tubing (New Objective). The analytical column was heated to 50°C using an AgileSLEEVE column heater (Analytical Sales and Services). The analytical column was equilibrated to 98% Mobile Phase A (MPA, 0.1% formic acid/ 3% acetonitrile) and 2% Mobile Phase B (MP B, 0.1% formic acid/90% acetonitrile) and maintained at a constant column flow of 200 nL/min. The sample was injected into a 5 mL loop placed in-line with the analytical column which initiated the gradient profile (min:%MP B): 0:2, 1:6, 85:30, 94:60, 95:90, 100:90, 101:50, 110:50. The column was allowed to equilibrate at start conditions for 30 min between analytical runs.
MS analysis was performed using an Orbitrap Fusion Lumos mass spectrometer (ThermoFisher Scientific). The global proteome and phosphoproteome samples were analyzed under identical conditions. Electrospray voltage (1.8 kV) was applied at a carbon composite union (Valco Instruments) coupling a 360 mm o.d. x 20 mm i.d. fused silica extension from the LC gradient pump to the analytical column and the ion transfer tube was set at 250°C. Following a 25-min delay from the time of sample injection, Orbitrap precursor spectra (AGC 4×10⁵) were collected from 350–1800 m/z for 110 min at a resolution of 60K along with data dependent Orbitrap HCD MS/MS spectra (centroid) at a resolution of 50K(AGC 1×10⁵) and max ion time of 105 ms for a total duty cycle of 2 s. Masses selected for MS/MS were isolated (quadrupole) at a width of 0.7 m/z and fragmented using a collision energy of 30%. Peptide mode was selected for monoisotopic precursor scan and charge state screening was enabled to reject unassigned 1+, 7+, 8+, and > 8+ ions with a dynamic exclusion time of 45 s to discriminate against previously analyzed ions between ± 10 ppm. The acetylome samples were analyzed under similar conditions except that the max ion time was 200 ms.
Construction and Utilization of the Comparative Reference Samples
As a quality control measure, two “Comparative Reference” (“CompRef’’) samples were generated as previously described (Li et al., 2013; Tabb et al., 2016) and used to monitor the longitudinal performance of the proteomics workflow throughout the course of this study. Briefly, patient-derived xenograft (PDX) tumors from established basal and luminal breast cancer intrinsic subtypes were raised subcutaneously in 8-week old NOD.Cg-Prkdcscid Il2rgtm1Wjl/SzJ mice (Jackson Laboratories, Bar Harbor, ME) using procedures reviewed and approved by the Institutional Animal Care and Use Committee at Washington University in St. Louis. Xenografts were grown in multiple mice, pooled, and cryopulverized to provide a sufficient amount of uniform material for the duration of the study. Full proteome, phosphoproteome and acetylome process replicates of each of the two CompRef samples were prepared and analyzed as standalone 10-plex TMT experiments alongside every 4 TMT-10 experiments of the study samples, using the same analysis protocol as the patient samples. These interstitially analyzed CompRef samples were evaluated for depth of proteome, phosphoproteome, and acetylome coverage and for consistency in quantitative comparison between the basal and luminal models.
QUANTIFICATION AND STATISTICAL ANALYSIS
Tumor Exclusion Criteria
In the PCA analysis of proteomics (Figures 1D and 1E) and RNA-Seq data, three tumor samples were grouped with normal tissues. We estimated tumor purity using a methylation-based deconvolution method (Onuchic et al., 2016). The three samples were found to have tumor purity < 10% and were excluded from downstream analysis. Six more samples were excluded for other reasons, including four from histologic types where there were too few tumors for meaningful statistical analysis (three carcinosarcoma and one clear cell), one which was not treatment-naive, and one which was a tumor that was analyzed twice (the lower quality replicate was excluded).
Genomic Data Analysis
Copy Number Calling
Copy number variation was detected using BIC-seq2 (Xi et al., 2016), a read depth-based CNV calling algorithm for WGS tumor data. Briefly, BIC-seq2 divides genomic regions into disjoint bins and counts uniquely aligned reads for each bin. It then combines neighboring bins into genomic segments with similar copy numbers iteratively based on Bayesian information criteria (BIC). We used paired-sample CNV calling that takes a pair of samples as inputs and detects genomic regions with different copy numbers between the two samples. We used a bin size of 100bp and a lambda of 3 (smoothing parameter for CNV segmentation). Segments were called as copy gain or loss when their log2 copy ratios were larger than 0.2 or smaller than −0.2, respectively. These cutoffs were obtained by comparing the proportion of amplifications and deletions in the EC TCGA study and adjusting the cutoffs to match the proportions in our cohort. To further summarize the arm-level copy number change, we used a weighted sum approach (Vasaikar et al., 2019), in which the segment-level log2 copy ratios for all the segments located in the given arm were added up with the length of each segment being weighted.
Somatic Variant Calling
We called variants using paired tumor and blood normal from WXS data. Somatic variants were called by Strelka v.2 (Saunders et al., 2012), MUTECT v.2 (Cibulskis et al., 2013), VarScan v.2.3.8 (Koboldt et al., 2012), and Pindel v.0.2.5 (Ye et al., 2009). We kept SNVs called by any 2 callers among MUTECT v.2, VarScan v.2.3.8, and Strelka v.2 and indels called by any 2 callers among MUTECT v.2, VarScan v.2.3.8, Strelka v.2, and Pindel v.0.2.5. For the merged SNVs and indels, we applied a 14Xand 8X coverage cutoff for tumor and normal, separately. We also filtered SNVs and indels by a minimal variant allele frequency (VAF) of 0.05 in tumors and a maximal VAF of 0.02 in normal samples. Finally, we filtered any SNV which was within 10bp of an indel found in the same tumor sample.
We identified a total of 52,630 somatic mutations, of which 5,757 were indels and 46,873 were point mutations. Specifically, there were 4,430 frameshift deletions, 1,035 frameshift insertions, 258 in-frame deletions, 34 in-frame insertions, 41,127 missense mutations, 4,580 nonsense mutations, 63 nonstop mutations, and 1,103 splice site mutations. We use MuSiC v0.4 in order to infer SMGs based on background mutation rate, coverage, gene length, etc. (Dees et al., 2012).
We cataloged PTM-overlapping mutations (mutations located at most two amino acids away from a known PTM site) in all genes; genes with the most overlapping mutations were PTEN, MUC16, CTNNB1, MKI67, and TP53. When restricting to only phosphosites detected in our EC cohort, CTNNB1 had the most PTM-overlapping mutations.
Mutational Signatures
We use SignatureAnalyzer v0421–2017 (Tan and Fevotte, 2013) in order to infer mutational signatures for our cohort. We identified 6 signatures, which were mapped to the 30 mutational signatures from the Stratton study (Alexandrov et al., 2013).
Methylation Analysis
The raw data from Illumina’s EPIC methylation arrays were available as IDAT files from the CPTAC consortium. The methylation analysis was performed using the cross-package workflow “methylationArrayAnalysis.” Briefly, the raw data files (IDAT files) were processed to obtain the methylated (M) and unmethylated (U) signal intensities for each locus. The processing step included an unsupervised normalization step called functional normalization that has been previously implemented for Illumina 450K methylation arrays (Fortin et al., 2014). A detection p value was also calculated for each locus to capture the quality of detection at the locus with respect to negative control background probes included in the array. Loci having common SNPs (MAF > 0.01) (as per dbSNP build 132 through 147 via the UCSC snp132common track through snp147common track) were removed from further analysis. Beta values were calculated as M/(M+U); that is, the fraction methylated for each locus. Beta values of loci whose detection p values were > 0.01 were assigned values of NA in the output file. All loci were annotated with the annotation information from ‘MethylationEPIC_v-1–0_B2.csv’ from the zip archive ‘infinium-methylationepic-v1–0-b2-manifest-file-csv.zip’ from https://www.illumina.com through the IlluminaHumanMethylationEPICanno.ilm10b2.hg19 package on Bioconductor. For downstream integrated analysis, we focused only on the methylation levels (represented as beta values) of the probes located both in the CpG island and the promoter (including 5’UTR) regions. The gene-level methylation was derived by averaging these probe-level methylation values.
Microsatellite Instability Prediction
We used 5 criteria to predict microsatellite instability status: mutation load, mismatch repair (MMR) gene mutation status, MSIsensor (v0.2) score, MSMuTect (version 1.0) score, and MLH1 methylation. K-Means clustering method with 2 cluster centers was applied to mutation load, MSIsensor, MSMuTect, and MLH1 methylation. For each tool, samples in the higher group were assigned as MSI-H. Six MMR genes, MLH1, MLH3, MSH2, MSH3, MSH6, and PSM2, were considered in the analysis. Samples with a mutation in any of these genes were labeled as MSI-H for the MMR gene criterion. A sample was officially called MSI-H if it was predicted to be MSI-H by no fewer than 3 of 5 methods (Table S3).
Copy Number Classification
The copy number subtypes were mainly characterized by CNV deletion events. A sample was defined asCNV-high more than 10% of its genome was deleted, regardless of the number of CNV-independent events. However, a CNV event, defined by the minimal copy number change (in log2 scale), is dependent on the tumor purity. A sample with low purity will have a smaller change than samples with high purity. Here we defined the per-sample threshold as 0.3 times the sample purity. Purity was estimated using ABSOLUTE (Carter et al., 2012).
TCGA Subtype Classification
TCGA identified four subtypes of endometrial cancer: POLE, MSI, CNV-high, and CNV-low. We replicated this subtyping forthesamples in our study.
The MSI subtype consists of all samples called MSI-H, as described in the Microsatellite Instability Prediction section.
To identify the POLE subtype, which has better survival than other subtypes, we looked for samples with mutations in the POLE exonuclease domain (McConechy et al., 2016; Stelloo et al., 2015; Talhouket al., 2017). There were 8 samples carrying exonuclease domain mutations (EDM) in the cohort, including 7 missense mutations and 1 splice site mutation from the sample C3L-01253. However, this sample failed to pass the criteria [CA] signature > 20% and [CG] signature < 3%. Thus, seven samples were classified as POLE.
Samples identified as having high CNV, as described in the Copy Number Classification section, were assigned to the CNV-high subgroup. All remaining samples not classified as MSI, POLE, or CNV-high were classified as CNV-low.
HotSpot3D
We conducted 3D structural clustering using HotSpot3D v1.8.2 with recurrence as the vertex type and a clustering distance of 10/A (Niu etal., 2016).
JAK1 Mutation Determination
Gene level microsatellite instability (MSI) events from MSMuTect and gene mutation calling results were integrated to determine the JAK1 MS insertion/deletion status. There were nine MSI events from eight samples identified by both MSMuTect and mutation calling. Three JAK1 MSI events, which failed to pass filtering steps from MSMuTect but had mutation calling evidence, were also classified as MS insertion/deletion.
RNA Quantification & Analysis
RNA Quantification and Circular RNA Prediction
The Hg38 reference genome and RefSeq annotations were used for the RNaseq data analysis. They were downloaded from the UCSC table browser. First, CIRI (v2.0.6) was used to call circular RNA with default parameters and BWA (version 0.7.17-r1188) was used as the mapping tool. The cutoff of supporting reads for circRNA was set to 10. Then we used a pseudo-linear transcript strategy to quantify gene and circular RNA expression (Li et al., 2017). In brief, for each sample, linear transcripts of circular RNAs were extracted and 75bp (read length) from the 3’ end was copied to the 5’ end. The modified transcripts were called pseudo-linear transcripts. Transcripts of linear genes were also extracted and mixed with pseudo-linear transcripts. RSEM (version 1.3.1) with Bowtie2 (version 2.3.3) as the mapping tool was used to quantify gene and circular RNA expression based on the mixed transcripts. After quantification, the upper quantile method was applied for normalization. The normalized matrix was log2-transformed and separated into gene and circular RNA expression matrices.
miRNA-Seq Data Analysis
Adapters of miRNaseq reads were trimmed using TRIMMOMATIC (version 0.38). The following constraints were used during trimming: 1) HEADCROP and TAILCROP were set to 4bp; 2) Average read quality was set to 30; 3) Average base quality was set to 20 with a sliding window of 10bp; 4) Trimmed reads shorter than 15 nucleotides in length were excluded from further analysis. Remaining reads were then mapped to the human genome hg38 using BWA aln, allowing 0 mismatch and up to 10 mappings. 3 bp extension / shorten were allowed in both upstream and downstream regions of mature miRNA annotation to accommodate inaccurate processing of precursor miRNAs. Multiple aligned reads were equally distributed in counting. Then read counts were converted to RPM (reads per million) values using (raw counts) x 106/(total count), where total count is the number of reads aligned to mature or precursor miRNAs.
miRNA Binding Site Prediction
RNA22 was used to predict miRNA binding sites on circRNAs with default parameters (Miranda et al., 2006). The circRNA circCDR1as, which has 74 confirmed miR-7 binding sites, was used to determine the p value cutoff (Memczak et al., 2013). RNA22 reported 49 potential binding sites of miR-7 on this circRNA. The third quartile of p values, 0.0207, was used as the cutoff for miRNA binding sites prediction. miRNAs with binding sites but without miRNA activity scores (see Inferred Immune, EMT, APM, and miRNA Activity Scores) were excluded from further analysis. After the filtering, there were binding sites for 36 miRNAs from 16 of 35 QKI regulated circRNAs (Figure S4C).
Pathway Activity
The PROGENy R package was applied to the log2 transformed RSEM mRNA matrix to estimate activity of 11 cancer related pathways: EGFR, Hypoxia, JAK/STAT, MAPK, NFkB, PI3K, TGFb, TNFa, Trail, VEGF, p53 (Schubert et al., 2018).
MS Data Interpretation
Quantification of TMT Global Proteomics Data
LC-MS/MS analysis of the TMT10-labeled, bRPLC fractionated samples generated a total of 408 global proteomics data files. The Thermo RAW files were processed with mzRefinery to characterize and correct for any instrument calibration errors, and then with MS-GF+ v9881 (Gibbons etal., 2015; Kim and Pevzner, 2014; Kim etal., 2008) to match against the RefSeq human protein sequence database downloaded on June 29,2018 (hg38; 41,734 proteins), combined with 264 contaminants (e.g., trypsin, keratin). The partially tryptic search used a ± 10 ppm parent ion tolerance, allowed for isotopic error in precursor ion selection, and searched a decoy database composed of the forward and reversed protein sequences. MS-GF+ considered static carbamidomethylation (+57.0215 Da) on Cys residues and TMT modification (+229.1629 Da) on the peptide N terminus and Lys residues, and dynamic oxidation (+15.9949 Da) on Met residues for searching the global proteome data.
Peptide identification stringency was set at a maximum false discovery rate (FDR) of 1% at peptide level using PepQValue < 0.005 and parent ion mass deviation < 7 ppm criteria. A minimum of 6 unique peptides per 1000 amino acids of protein length was required for achieving 1% at the protein level within the full dataset. Inference of parsimonious protein set resulted in the identification of a total of 12,153 protein groups covering 11,099 genes.
The intensities of all ten TMT reporter ions were extracted using MASIC software (Monroe et al., 2008). Next, PSMs passing the confidence thresholds described above were linked to the extracted reporter ion intensities by scan number. The reporter ion intensities from different scans and different bRPLC fractions corresponding to the same gene were grouped. Relative protein abundance was calculated as the ratio of sample abundance to reference abundance using the summed reporter ion intensities from peptides that could be uniquely mapped to a gene. The pooled reference sample was labeled with TMT 126 reagent, allowing comparison of relative protein abundances across different TMT-10 plexes. The relative abundances were log2 transformed and zero-centered for each gene to obtain final relative abundance values.
Small differences in laboratory conditions and sample handling can result in systematic, sample-specific bias in the quantification of protein levels. In order to mitigate these effects, we computed the median, log2 relative protein abundance for each sample and recentered to achieve a common median of 0.
Evaluation of TMT Proteomics Data
Coupled with extensive fractionation and tandem affinity enrichment of the phosphopeptides and acetylated peptides, our 10-plex TMT-based MS/MS workflow provided comprehensive proteomic coverage, confidently identifying a total of 12,153 proteins (11,099 genes), 73,212 phosphosites, and 10,862 lysine acetylation sites across all tumors and an average of 10,088 proteins (9,765 genes), 29,710 phosphosites, and 3,821 lysine acetylation sites per tumor (Table S2). Stable longitudinal performance and low technical noise of the integrated proteomics platform were demonstrated by repeated interspersed analyses of QC samples (Figures S1B and S1C). Principal component analysis clearly separated the tumors and normal endometrium tissue based on the TMT global proteome, phosphoproteome, or acetylome data and no batch effect was observed in the TMT plexes (Figures S1D–S1F) (Wen et al., 2017). Steady-state mRNA and protein abundance showed a strong positive correlation (median 0.48) (Figure S1G). This average correlation was higher than the previous reported CPTAC colorectal (r = 0.23), breast (r = 0.39), and ovarian (r = 0.45) mRNA-protein correlations. Around 78% of all mRNA-protein pairs across the 95 samples showed significant correlation (adj p value < 0.01).
Eight normalization methods were tested for global proteomics matrix: 1) median normalization followed by batch correct; 2) median normalization; 3) Median polish followed by batch correction; 4) median polish; 5) subtracted mean for each batch; 6) median normalization; 7) filtering missing by batch followed by median normalization and batch correct; 8) filtering missing by batch followed by median normalization. The 50% missing values cutoff for the whole cohort was used for methods 1–6 and the same cutoff for each TMT batch was used for methods 7–8. The correlation in abundance between proteins from the same protein complex was used as a criterion to evaluate these methods and the performances are shown in Figure S1H. Methods 4 and 8 have the same performance and outperform other methods by the same criterion. However, method 4 has better classification between serous and endometrioid. In sum, method 4 has the best performance for proteomics data.
Similarly, six normalization methods were applied to the phosphoproteomics matrix: 1) median normalization with factor from proteomics data followed by batch correction; 2) median normalization with factor from proteomics data; 3) median normalization followed by batch correction; 4) median normalization; 5) median polish followed by batch correction; 6) median polish. The 50% missing values cutoff for the whole cohort was used for the analysis. The correlation between sites (substrates) from the same kinase was used as the criterion to evaluate these methods and performances are shown in Figure S1I. Method 6 outperforms other methods by the criterion.
Quality Control via Machine Learning
We also selected three clinically distinct phenotypes with at least 10 samples per group and compared the utility of multi-omics data to identify the phenotype of individual tumors using machine learning. Global proteomics data performed as well as most other transcriptomic and genomic data to distinguish between the histological serous and endometrioid subtypes (Figure S1J). Similarly in identification of samples with MSI, proteomics, RNA, and methylation data demonstrated comparable ability (Figure S1K). While these phenotypes are visually or genomically distinct, low-grade FIGO stage 1B and 1A samples can be hard to differentiate, although pre-surgical classification determines the necessity of lymphadenectomy (Zhu et al., 2017). Proteomics data performed significantly better (median AUROC of 0.73) than any other data type in predicting whether a sample was stage 1B or stage 1A (Figure S1L).
Creation of a Patient-Specific Protein Sequence Database
The proteogenomic database tool pyQUILTS (Ruggles et al., 2016), available at http://quilts.fenyolab.org, was used to incorporate the germline and somatic single nucleotide variants (SNVs), RNA-seq predicted junctions and fusion genes into a searchable protein database. The human RefSeq protein database (downloaded 2018/06/29) was used as a reference for the hg38 proteome and genome.
Protein-Peptide Identification and Quantification with Patient-Specific Sequence Database
Protein sequences output from pyQUILTS were digested in-silico to generate all unique tryptic peptides with up to one missed cleavage allowing for N-terminal methionine cleavage. Isoleucine residues were then replaced with leucines to avoid I/L variants. The CPTAC3 reference proteome (along with the human proteome downloaded from UniProt on 2016/07/29) were similarly processed to remove any possible reference peptides from the list of candidates, resulting in 5,295,726 unique peptide sequences.
Candidate peptides were submitted to the Pepcentric search engine (http://pepcentric.arsci.com:8080/) for peptide-centric searching against the whole proteome EC dataset. For each peptide, the PSM with the lowest expectation value was selected as a representative and expectation values were converted to p values using a permutation test with twenty million randomly-permuted decoy peptides. TMT channel intensities were extracted from each spectra and intensities were summed across all PSMs associated with a particular candidate peptide sequence for quantitation at the sample level.
A very stringent thresholding was performed to minimize the chance of false positive peptide identification. First, all peptides with a q-value > 0.05 were removed, as were any peptides which had a lower expectation value than the best peptide in the closed (exact match) or open (allowing for one modification) UniProt search. Next, all matches with a TMT intensity below 20,000 or lower than 80% of the max TMT value for that peptide were removed, as these were more likely to be overflow from other channels. After that, all peptides with genomic or peptide evidence in more than a third of the dataset were removed, the rationale being that these would not have been rare variants and were therefore likely false positives that should have been classified as a reference peptide. Finally, all peptides that lacked genomic evidence in any of the samples in which the peptide was found were removed. Although this thresholding method is likely to remove many true positives, the objective was to be as certain as possible about the peptides that remained.
Quantification of Phosphopeptides
Phosphopeptide identification for the 204 phosphoproteomics data files were performed as in the global proteome data analysis described above (e.g., peptide level FDR < 1%), with an additional dynamic phosphorylation (+79.9663 Da) on Ser, Thr, orTyr residues. The phosphoproteome data were further processed by the Ascore algorithm (Beausoleil et al., 2006) for phosphorylation site localization, and the top-scoring sequences were reported. For phosphoproteomic datasets, the TMT-10 quantitative data were not summarized by protein, but left at the phosphopeptide level. All peptides (phosphopeptides and global peptides) were labeled with TMT-10 reagent simultaneously. Separation into phospho- and non-phosphopeptides using IMAC was performed after the labeling. Thus, all the biases upstream of labeling are assumed to be identical between global and phosphoproteomics datasets. Therefore, to account for sample-specific biases in the phosphoproteome analysis, we applied the correction factors derived from median-centering the global proteomic dataset.
Quantification and Analysis of Acetylated Peptides
Acetylated peptide identification for the 68 acetylome data files were performed as in the global proteome data analysis described above, with additional dynamic acetylation (+42.0105 Da) and carbamylation (+43.0058 Da) on Lys residues. The acetylation site localization, protein inference, and quantification of the acetylome data were performed in identical fashion as in the phosphoproteome data.
Theoretically, the IMAC-enriched phosphopeptide sample (or, less likely, the acetylpeptide sample enriched by IP from the IMAC flow-through) could still contain the dual-modified peptides. However, it is currently difficult to use the protein sequence database searching algorithms to identify such peptides, because a rather large number of “dynamic” modifications need to be considered during the database search (dynamic phosphorylation on Ser, Thr, or Tyr residues, dynamic acetylation and carbamylation on Lys residues, dynamic oxidation on Met residues, and dynamic deamidation at the N-terminal), leading to unreliable estimation of the FDR. As a result, this was not pursued in this study.
Histone acetylation values from one functional site but encoded for different histone genes paralogs were averaged. For example, reported peptides HIST1H2BH_K12 and HIST1H2BD_K12 were averaged to obtain the acetylation value for the H2B_K12 site. To test the association between HATs/HDACs protein and acetylation levels of histone sites, we fitted Lasso regression model with HATs/HDACs and histone protein expression as independent variables and a histone acetylation site as a dependent variable. Lasso regression has been chosen because it takes expression of all enzymes into account simultaneously and is insensitive to highly correlated dependent variables. We performed 300 bootstraps with 80% training data and 20% testing data, and reported averaged coefficients returned by the model across 300 iterations. Differentially acetylated sites between tumor and enriched normal endometrium samples were found using Wilcoxon rank sum test with at least 6 samples in both groups. The p values were FDR-corrected using the Benjamini-Hochberg procedure. Upregulated sites were defined as ones with FDR-corrected p value < 0.05 and median difference > = 0.4, while the corresponding protein change was either not significant (FDR > 0.05), or median difference < 0.5.
Other Proteogenomic Analyses
Phenotype Prediction
We used XGBoost (v0.81) (Chen and Guestrin, 2016) to develop models for predicting clinical phenotypes using seven types (mutation, copy number alteration, methylation, mRNA abundance, miRNA abundance, protein abundance, and phosphoprotein abundance) of omics data. For each data type, we first split the data into training and test (80%/20%) sets. We then tuned the model’s hyperparameters to improve its generalization performance using the training set. For XGBoost, there are two important parameters: the maximum number of nodes allowed from the root to the farthest leaf of a tree, max_depth and the number of trees in the forest, n_estimators. We used grid search with cross validation to find the best parameters, using the area under the receiver operating characteristic (AUROC) as the evaluation metric. A grid of 4 different n_estimators values (10, 20, 50, 100) and 5 different max_depth values (2, 4, 6, 8,10) was created and each combination was evaluated using 3-fold cross validation within the training data. Finally, we fit a new model on the whole training set with the parameters that yielded the best cross validation performance. For each data type, we repeated the entire procedure 10 times to capture the performance variation.
Mutation Impact on the Proteome and Phosphoproteome
We aggregated a set of interacting proteins (e.g., kinase/phosphatase-substrate or complex partners) from Omnipath (downloaded on 03/29/18) (Turei et al., 2016), DEPOD (03/29/18) (Duan et al., 2015), CORUM (downloaded 06/29/18) (Ruepp et al., 2008), Signor2 (10/29/18) (Perfetto et al., 2016), and Reactome (11/01/18) (Fabregat et al., 2018). We focus our analyses on 18 EC SMGs previously reported in the literature (ARID1A, CTCF, CTNNB1, FBXW7, FLNA, GENE, HUWE1, INPPL1, JAK1, KMT2B, KMT2D, KRAS, MAP3K4, PIK3CA, PIK3R1, PTEN, RPL22, and TP53) (Bailey et al., 2018; Kandoth et al., 2013).
For each interacting protein pair, we split samples with and without mutations in partner A and compare expression levels (both protein and phosphosites) both in cis (partner A) and in trans (partner B), calculating a median difference in expression and testing for significance with the Wilcoxon rank sum tests, with the Benjamini-Hochberg multiple test correction. We further refine the list of trans interactions by filtering proteins that are not part of oncogenic processes identified in TCGA (Sanchez-Vega et al., 2018).
Fusion Calls
We use three callers to call consensus fusion/chimeric events in our samples (STAR-Fusion, INTEGRATE, and ericscript). Calls by each tool using tumor and normal RNA-Seq data are then merged into a single file and extensive filtering is done. As STAR-Fusion has higher sensitivity, calls made by this tool with higher supporting evidence (defined by fusion fragments per million total reads, or FFPM > 0.1) is required, or a given fusion must be reported by at least 2 callers. We then remove fusions present in our panel of blacklisted or normal fusions, which include uncharacterized genes, immunoglobin genes, mitochondrial genes, and others, as well as fusions from the same gene or paralog genes (https://www.genenames.org/cgi-bin/statistics) and fusions reported in TCGA normal samples (Gao et al., 2018), GTEx tissues (reported in STAR-Fusion output), and non-cancer cell studies (Babiceanu et al., 2016). Finally, we remove normal fusions from the tumor fusions to curate the final set.
PTMcosmos
We gathered 438,983 human PTM sites from PTMcosmos (https://ptmcosmos.wustl.edu/). PTM sites from PTMcosmos were retrieved from UniProt Knowledge Base (UniProtKB) version 2019.01, PhosphoSitePlus (snapshot on the date 2018–02-14), and CPTAC phosphorylation and acetylation mass spectrometry data. A PTM site from UniProtKB was included if it was reported in at least one publication or by sequence similarity. A PTM site from PhosphoSitePlus was included if it was reported in at least one publication or validated internally by Cell Signaling Technology. A PTM site from CPTAC experiments was included if it was detected in at least one of the samples.
We used genome-wide point mutations (n = 46,031) and PTMs from the PTMcosmos database (n = 363,670), in order to account for both detected and undetected PTM sites in our cohort. We obtained 5,120 (11% of point mutations) PTM-overlapping mutations: 1,083 directly within the PTM site and 4,037 within two residues of the PTM site.
Inferred Immune, EMT, APM, Wnt Pathway, and miRNA Activity Scores
All scores were inferred by single sample gene set enrichment analysis (ssGSEA) method from the GSVA R package (Barbie et al., 2009; Hanzelmann et al., 2013). The EMT gene signature set is from (Mak et al., 2016), immune signatures are from (Charoentong et al., 2017), and the KEGG antigen processing and presentation pathway gene set is used as the APM signature. The KEGG Wnt Signaling Pathway gene set was used to analyze the Wnt pathway signatures for our CTNNB1 -mutated and WT tumors. mRNA expression was used to infer EMT and immune scores and protein abundance was used to infer the APM score. Targets of miRNAs were downloaded from the miRNA targets database miRTarBase and only the miRNA/target pairs with strong experimental evidence were retained (Chou et al., 2018). miRNA target sets with fewer than 10 genes were removed. The -log2 transformed ssGSEA score was used as the miRNA activity score.
TMB and APM Subtyping
The value of log2 transformed variants per million bp was used as TMB for the analysis. The k-means algorithm with two centers was applied to TMB and APM Z-score independently. The initial cluster centers were set as the mean values of the top 5 and bottom 5 samples. The classification results reported by the k-means algorithm were directly used for tumor subtyping.
Differential Proteomic Analysis
TMT-based global proteomic, phosphoproteomic, and acetylation data were used to perform pairwise differential analysis between groups of samples. AWilcoxon rank-sum test was performed to determine differential abundance of proteins and PTMs. At least four samples in both groups were required to have non-missing values and the p value was adjusted using the Benjamini-Hochberg method. For phosphorylation markers in each genomic subtype, the adjusted p value for the protein change was required to be > = 0.05. Over-representation analysis of Wikipathways genesets was performed with the proteins containing the phosphorylation markers. Pathways were considered significant with FDR < 0.05.
Kinase Activity Analysis
Phosphoproteomic data for unique thirteenmer sequence motifs (±6 amino acids from the phosphorylated site) were combined by median for each sample. Differential abundance was performed as above and thirteenmers were ranked by the signed log p value. Pre-ranked GSEA was performed using WebGestaltR (Liaoet al., 2019) with substrates collected from PhosphoSitePlus, Swiss-Prot, and HPRD. A minimum of 10 substrates per kinase was required. Kinases were considered significantly differentially active with an FDR < 0.05.
Phosphoproteome Outlier Analysis
We performed outlier analysis using the BlackSheep package (Blumenberg et al., 2019). Briefly, we calculated the median and interquartile range (IQR) values for each phosphopeptide using TMT-based global phosphoproteomic data. Outliers were defined for each phosphopeptide as any value higher or lower than the median plus or minus 1.5x IQR, respectively. Phosphopeptide data was then aggregated into genes by summing outlier and non-outlier values per sample. Outlier counts were used to determine enriched genes in a group of samples. First, genes without an outlier value in at least 30% of samples in the group of interest were filtered out. Additionally, genes with a lower average fraction of outlier sites in the group of interest than in the rest of the samples were also filtered out. Then the group of interest was compared to the rest of the samples using a Fisher’s exact test on the sum of outlier and non-outlier values per group. Resulting p values were corrected for multiple comparisons using the Benjamini-Hochberg correction. Druggability was determined for each gene using the drug-gene interaction database (DGIdb) (Cotto et al., 2018).
DNA Damage Response Score
Phosphoproteome outlier analysis was used to construct a DNA damage response (DDR) score. To isolate well-established phosphorylation substrates during DNA damage, we focused on genes listed in Table S3 from (Matsuoka et al., 2007). These proteins had SQ/TQ sites that were found to be phosphorylated by ATM, ATR or DNAPKin response to DNA damage, and had also been identified in previous literature as phosphorylation substrates. To calculate the DDR score, we standardized the fraction of phosphosites per gene across samples, and averaged values of this subset of genes per sample. We defined DDR-high samples as all samples with a DDR score more than 1.5 IQR above the median DDR score.
Cancer/Testis Antigens
We downloaded cancer/testis antigens from CTdatabase (http://www.cta.lncc.br) (Almeida et al., 2009). The database consists of 269 cancer-testis antigens with carefully curated and annotated literature-derived information. The CT antigens present in the proteomics dataset were selected and z-scores were calculated for each sample compared to the abundance distribution in all normal samples. Tumor samples with a z-score greater than 3 were considered to have high expression of that CT antigen. Only CT antigens with high abundance in at least 10% of the tumors samples were retained.
Variant Peptide Identification and Neoantigen Prediction
We used NeoFlow (https://github.com/bzhanglab/neoflow) for neoantigen prediction. Specifically, Optitype (Szolek et al., 2014) was used to find human leukocyte antigens (HLA) in the WXS data. Then we used netMHCpan (Jurtz et al., 2017) to predict HLA peptide binding affinity for somatic mutation-derived variant peptides with a length between 8–11 amino acids. The cutoff of IC50 binding affinity was set to 150 nM. HLA peptides with binding affinity higher than 150 nM were removed. Variant identification was also performed at both mRNA and protein levels using RNA-Seq data and MS/MS data, respectively. To identify variant peptides, we used a customized protein sequence database approach (Wang et al., 2012). We derived customized protein sequence databases from matched WXS data and then performed database searching using the customized databases for individual TMT experiments. We built a customized database for each TMT experiment based on somatic variants from WXS data. We used Customprodbj (https://github.com/bzhanglab/customprodbj) for customized database construction. MS-GF+ was used for variant peptide identification for all global proteome, phosphorylation and acetylation data. Results from MS-GF+ were filtered with 1% FDR at PSM level. Remaining variant peptides were further filtered using PepQuery (http://www.pepquery.org) (Wen et al., 2019) with the p value cutoff < 0.01. The spectra of variant peptides were annotated using PDV (http://www.zhang-lab.org/) (Li et al., 2019) and the annotated spectra are shown in Table S7.
mRNA and Protein and Protein and Phosphoprotein Correlation
To compare mRNA expression and protein abundance across samples we focused on the 9575 genes with RNA-Seq based RSEM measurement and proteomics data. The analyses were carried out on normalized data where RSEM count data was upper-quartile normalized, while proteomics data was quantile normalized. Correlation was performed by Spearman’s correlation method. Both correlation coefficient and p value were computed. Furthermore, p values were adjusted by the Benjamini-Hochberg procedure. The same procedure of mRNA-protein correlation was applied to protein-phospho cis pairs. Sorted Spearman’s correlation coefficients were further used for ssGSEA analysis with default settings.
SCNA Cis and Trans Effect Identification
The correlations between copy number (gene level), RNA expression, and protein expression were performed using Spearman’s rank correlation for 9377 genes with quantified data from all three platforms. We defined the SCNA cis effect as the significant association (FDR < 0.01, Spearman’s rank test) between a given copy number and the gene expression at both protein and RNA levels from the same genome loci, and the SCNA trans effect as the significant association (FDR <0.01, Spearman’s rank test) between a given locus and global gene expression (Zhang et al., 2014).
Anti-p53 Pathway Driver Gene Prioritization
The p53 pathway activity was inferred from known p53 transcription targets (MSigDB INGA_TP53_TARGETS, (Inga et al., 2002)) using ssGSEA (Barbie etal., 2009) implemented in the R package GSVA(Hanzelmann et al., 2013). In order to prioritize the genes whose protein expression is associated with p53 pathway activity, we used the following linear regression:
Where the /(TP53 mutation) denotes the indicator function (1 if TP53 is mutated or 0 if TP53 is wild type), and ProExprs denotes the protein expression of the given gene. The association between protein expression and p53 activity was ranked based on the statistical significance of p2. Furthermore, to summarize whether a given gene set (e.g., all qualified genes in 1q) was significantly associated with p53 activity, the ranking metric derived above for all the genes and the gene set was tested using the GSEA method implemented in the R package fgsea (Sergushichev, 2016).
DATA AND CODE AVAILABILITY
Processed data tables are available in Table S2. Data used for the manuscript are also available through a Python package called ‘cptac’ (https://pypi.org/project/cptac/, install via pip) to allow programmatic access and LinkedOmics (http://www.linkedomics.org/) (Vasaikar et al., 2018) to allow association and pathway analysis. Raw genomic data is available from the Genomic Data Commons (https://gdc.cancer.gov/) or upon request from dbGaP (https://www.ncbi.nlm.nih.gov/gap/, phs001287) and proteomic data is available via the CPTAC Data Portal (https://cptac-data-portal.georgetown.edu/cptacPublic/).
Supplementary Material
KEY RESOURCES TABLE
Highlights.
Proteogenomics provides new insights into oncogenic signaling in endometrial carcinoma
Global acetylome and phosphoproteome surveys identify new regulatory mechanisms
QKI, circRNAs, and miRNAs form a potential feedback loop to promote EMT
Antigen presentation defects may render MSI tumors resistant to checkpoint blockade
ACKNOWLEDGMENTS
This work was supported by the National Cancer Institute (NCI) Clinical Proteomic Tumor Analysis Consortium (CPTAC) grants U24CA210955, U24CA210954, U24CA210972, U24CA210979, U24CA210986, and U01CA214125; by grant RR160027 from the Cancer Prevention & Research Institutes of Texas (CPRIT); and by funding from the McNair Medical Institute at The Robert and Janice McNair Foundation. B.Z. and M.E. are Cancer Prevention & Research Institutes of Texas Scholars in Cancer Research and McNair Medical Institute Scholars. The Pacific Northwest National Laboratory (PNNL) proteomics work described herein was performed in the Environmental Molecular Sciences Laboratory, a US Department of Energy (DOE) National Scientific User Facility located at PNNL in Richland, WA. PNNL is a multi-program national laboratory operated by the Battelle Memorial Institute for the DOE under contract DE-AC05-76RL01830.
Footnotes
SUPPLEMENTAL INFORMATION
Supplemental Information can be found online at https://doi.org/10.1016/j.cell.2020.01.026.
DECLARATION OF INTERESTS
The authors declare no competing interests.
REFERENCES
- Aaronson DS, and Horvath CM (2002). A road map for those who don’t know JAK-STAT. Science 296, 1653–1655. [DOI] [PubMed] [Google Scholar]
- Alexandrov LB, Nik-Zainal S, Wedge DC, Aparicio SAJR, Behjati S,Biankin AV, Bignell GR, Bolli N, Borg A, B0rresen-Dale A-L, et al. ; Australian Pancreatic Cancer Genome Initiative; ICGC Breast Cancer Consortium; ICGC MMML-Seq Consortium; ICGC PedBrain (2013). Signatures of mutational processes in human cancer. Nature 500, 415–421. [DOI] [PMC free article] [PubMed] [Google Scholar]
- Almeida LG, Sakabe NJ, deOliveira AR, Silva MCC, Mundstein AS, Cohen T, Chen Y-T, Chua R, Gurung S, Gnjatic S, et al. (2009). CTdatabase: a knowledge-base of high-throughput and curated data on cancer-testis antigens. Nucleic Acids Res. 37, D816–D819. [DOI] [PMC free article] [PubMed] [Google Scholar]
- Alok A, Lei Z, Jagannathan NS, Kaur S, Harmston N, Rozen SG, Tucker-Kellogg L, and Virshup DM (2017). Wnt proteins synergize to activate β-catenin signaling. J. Cell Sci. 730, 1532–1544. [DOI] [PubMed] [Google Scholar]
- Amant F, Moerman P, Neven P, Timmerman D, Van Limbergen E, and Vergote I (2005). Endometrial cancer. Lancet 366, 491–505. [DOI] [PubMed] [Google Scholar]
- American Cancer Society (2017). Cancer Facts & Figures 2018 (American Cancer Society). [Google Scholar]
- Babiceanu M, Qin F, Xie Z, Jia Y, Lopez K, Janus N, Facemire L, Kumar S, Pang Y, Qi Y, et al. (2016). Recurrent chimeric fusion RNAs in noncancer tissues and cells. Nucleic Acids Res. 44, 2859–2872. [DOI] [PMC free article] [PubMed] [Google Scholar]
- Bailey MH, Tokheim C, Porta-Pardo E, Sengupta S, Bertrand D, Weer-asinghe A, Colaprico A,Wendl MC, Kim J, Reardon B, et al. ; MC3 Working Group; Cancer Genome Atlas Research Network (2018). Comprehensive Characterization of Cancer Driver Genes and Mutations. Cell 773, 371–385.e18. [DOI] [PMC free article] [PubMed] [Google Scholar]
- Bajrami I, Frankum JR, Konde A, Miller RE, Rehman FL, Brough R, Campbell J, Sims D, Rafiq R, Hooper S, et al. (2014). Genome-wide profiling ofgenetic synthetic lethality identifies CDK12 as a novel determinant of PARP1/2 inhibitor sensitivity. Cancer Res. 74, 287–297. [DOI] [PMC free article] [PubMed] [Google Scholar]
- Barbie DA, Tamayo P, Boehm JS, Kim SY, Moody SE, Dunn IF, Schinzel AC, Sandy P, Meylan E, Scholl C, et al. (2009). Systematic RNA interference reveals that oncogenic KRAS-driven cancers require TBK1. Nature 462, 108–112. [DOI] [PMC free article] [PubMed] [Google Scholar]
- Baxevanis CN, Fortis SP, and Perez SA (2019). Prostate cancer: any room left for immunotherapies? Immunotherapy 77, 69–74. [DOI] [PubMed] [Google Scholar]
- Beausoleil SA, Villen J, Gerber SA, Rush J, and Gygi SP (2006). A probability-based approach forhigh-throughput protein phosphorylation analysis and site localization. Nat. Biotechnol. 24, 1285–1292. [DOI] [PubMed] [Google Scholar]
- Benelli M, Pescucci C, Marseglia G, Severgnini M, Torricelli F, and Magi A (2012). Discovering chimeric transcripts in paired-end RNA-seq data by using EricScript. Bioinformatics 28, 3232–3239. [DOI] [PubMed] [Google Scholar]
- Berg A, Gulati A, Ytre-Hauge S, Fasmer KE, Mauland KK, Hoivik EA, Husby JA, Tangen IL, Trovik J, Halle MK, et al. (2017). Preoperative imaging markers and PDZ-binding kinasetissue expression predict low-risk disease in endometrial hyperplasias and low grade cancers. Oncotarget 8, 68530–68541. [DOI] [PMC free article] [PubMed] [Google Scholar]
- Bianchi G, Borgonovo G, Pistoia V, and Raffaghello L (2011). Immuno-suppressive cells and tumour microenvironment: focus on mesenchymal stem cells and myeloid derived suppressor cells. Histol. Histopathol. 26, 941–951. [DOI] [PubMed] [Google Scholar]
- Blumenberg L, Kawaler E, Cornwell M, Smith S, Ruggles K, and Fenyo D (2019). BlackSheep: A Bioconductor and Bioconda package for differential extreme value analysis. bioRxiv. 10.1101/825067. [DOI] [PMC free article] [PubMed] [Google Scholar]
- Bolger AM, Lohse M, and Usadel B (2014). Trimmomatic: a flexible trimmer for Illumina sequence data. Bioinformatics 30, 2114–2120. [DOI] [PMC free article] [PubMed] [Google Scholar]
- Bray F, Ferlay J, Soerjomataram I, Siegel RL, Torre LA, and Jemal A (2018). Global cancer statistics 2018: GLOBOCAN estimates of incidence and mortality worldwide for 36 cancers in 185 countries. CA Cancer J. Clin. 68, 394–424. [DOI] [PubMed] [Google Scholar]
- Carter SL, Cibulskis K, Helman E, McKenna A, Shen H, Zack T, Laird PW, Onofrio RC, Winckler W, Weir BA, et al. (2012). Absolute quantification of somatic DNA alterations in human cancer. Nat. Biotechnol. 30, 413–421. [DOI] [PMC free article] [PubMed] [Google Scholar]
- Chang DK, Ricciardiello L, Goel A, Chang CL, and Boland CR (2000). Steady-state regulation of the human DNA mismatch repair system. J. Biol. Chem. 275, 18424–18431. [DOI] [PubMed] [Google Scholar]
- Charoentong P, Finotello F, Angelova M, Mayer C, Efremova M, Rieder E, Hackl H, and Trajanoski Z (2017). Pan-cancerImmunogenomicAnalyses Reveal Genotype-Immunophenotype Relationships and Predictors of Response to Checkpoint Blockade. Cell Rep. 78, 248–262. [DOI] [PubMed] [Google Scholar]
- Chen T, and Guestrin C (2016). XGBoost: A Scalable Tree Boosting System In Proceedings ofthe 22nd ACM SIGKDD International Conferenceon Knowledge Discovery and Data Mining, pp. 785–794. [Google Scholar]
- Chen YT, Scanlan MJ, Sahin U, Tiireci O, Gure AO, Tsang S, Williamson B, Stockert E, Pfreundschuh M, and Old LJ (1997). Atesticular antigen aberrantly expressed in human cancers detected by autologous antibody screening. Proc. Natl. Acad. Sci. USA 94, 1914–1918. [DOI] [PMC free article] [PubMed] [Google Scholar]
- Chen S, Huang V, Xu X, Livingstone J, Soares F, Jeon J, Zeng Y, Hua JT, Petricca J, Guo H, et al. (2019). Widespread and Functional RNACircularization in Localized Prostate Cancer. Cell 176, 831–843.e22. [DOI] [PubMed] [Google Scholar]
- Chou C-H, Shrestha S, Yang C-D, Chang N-W, Lin Y-L, Liao K-W, Huang W-C, Sun T-H, Tu S-J, Lee W-H, et al. (2018). miRTarBase update 2018: a resource for experimentally validated microRNA-target interactions. Nucleic Acids Res. 46 (D1), D296–D302. [DOI] [PMC free article] [PubMed] [Google Scholar]
- Choudhary C, Kumar C, Gnad F, Nielsen ML, Rehman M, Walther TC, Olsen JV, and Mann M (2009). Lysine acetylation targets protein complexes and co-regulates major cellular functions. Science 325, 834–840. [DOI] [PubMed] [Google Scholar]
- Choudhary C, Weinert BT, Nishida Y, Verdin E, and Mann M (2014). The growing landscape of lysine acetylation links metabolism and cell signalling. Nat. Rev. Mol. Cell Biol. 15, 536–550. [DOI] [PubMed] [Google Scholar]
- Chu A, Robertson G, Brooks D, Mungall AJ, Birol I, Coope R, Ma Y, Jones S, and Marra MA (2016). Large-scale profiling of microRNAs forThe Cancer Genome Atlas. Nucleic Acids Res. 44, e3. [DOI] [PMC free article] [PubMed] [Google Scholar]
- Cibulskis K, Lawrence MS, Carter SL, Sivachenko A, Jaffe D, Sougnez A, Gabriel S, Meyerson M, Lander ES, and Getz G (2013). Sensitive detection of somatic point mutations in impure and heterogeneous cancer samples. Nat. Biotechnol. 31, 213–219. [DOI] [PMC free article] [PubMed] [Google Scholar]
- Cochrane DR, Spoelstra NS, Howe EN, Nordeen SK, and Richer JK (2009). MicroRNA-200c mitigates invasiveness and restores sensitivity to microtubule-targeting chemotherapeutic agents. Mol. Cancer Ther. 8, 1055–1066. [DOI] [PMC free article] [PubMed] [Google Scholar]
- Conn SJ, Pillman KA, Toubia J, Conn VM, Salmanidis M, Phillips CA, Roslan S, Schreiber AW, Gregory PA, and Goodall GJ (2015). The RNA binding proteinquaking regulatesformation ofcircRNAs. Cell 160,1125–1134. [DOI] [PubMed] [Google Scholar]
- Cotto KC, Wagner AH, Feng Y-Y, Kiwala S, Coffman AC, Spies G, Wollam A, Spies NC, Griffith OL, and Griffith M (2018). DGIdb 3.0: a redesign and expansion of the drug-gene interaction database. Nucleic Acids Res. 46 (D1), D1068–D1073. [DOI] [PMC free article] [PubMed] [Google Scholar]
- de Carcer G, Venkateswaran SV, Salgueiro L, El Bakkali A, Somogyi K, Rowald K, Montanes P, Sanclemente M, Escobar B, de Martino A, et al. (2018). Plk1 overexpression induces chromosomal instability and suppresses tumor development. Nat. Commun. 9, 3012. [DOI] [PMC free article] [PubMed] [Google Scholar]
- Dees ND, Zhang Q, Kandoth C, Wendl MC, Schierding W, Koboldt AC, Mooney TB, Callaway MB, Dooling D, Mardis ER, et al. (2012). MuSiC: identifying mutational significance in cancer genomes. Genome Res. 22, 1589–1598. [DOI] [PMC free article] [PubMed] [Google Scholar]
- Depreeuw J, Stelloo E, Osse EM, Creutzberg CL, Nout RA, Moisse M, Garcia-Dios DA, Dewaele M, Willekens K, Marine J-C, et al. (2017). Amplification of 1q32.1 Refines the Molecular Classification of Endometrial Carcinoma. Clin. Cancer Res. 23, 7232–7241. [DOI] [PubMed] [Google Scholar]
- Dragomir M, and Calin GA (2018). Circular RNAs in Cancer - Lessons Learned From microRNAs. Front. Oncol. 8, 179. [DOI] [PMC free article] [PubMed] [Google Scholar]
- Duan G, Li X, and Kohn M (2015). The human DEPhOsphorylation database DEPOD: a 2015 update. Nucleic Acids Res. 43, D531–D535. [DOI] [PMC free article] [PubMed] [Google Scholar]
- Dweep H, Sticht C, Pandey P, and Gretz N (2011). miRWalk-database: prediction of possible miRNA binding sites by “walking” the genes ofthree genomes. J. Biomed. Inform. 44, 839–847. [DOI] [PubMed] [Google Scholar]
- Edwards NJ, Oberti M, Thangudu RR, Cai S, McGarvey PB, Jacob S, Madhavan S, and Ketchum KA (2015). The CPTAC Data Portal: A Resource for Cancer Proteomics Research. J. Proteome Res. 14, 2707–2713. [DOI] [PubMed] [Google Scholar]
- Eggermont LJ, Paulis LE, Tel J, and Figdor CG (2014). Towards efficient cancer immunotherapy: advances in developing artificial antigen-presenting cells. Trends Biotechnol. 32, 456–465. [DOI] [PMC free article] [PubMed] [Google Scholar]
- Fabregat A, Jupe S, Matthews L, Sidiropoulos K, Gillespie M, Garapati P, Haw R, Jassal B, Korninger F, May B, et al. (2018). The Reactome Pathway Knowledgebase. Nucleic Acids Res. 46 (D1), D649–D655. [DOI] [PMC free article] [PubMed] [Google Scholar]
- Feltes BC (2019). Architects meets Repairers: The interplay between homeo-box genes and DNA repair. DNA Repair (Amst.) 73, 34–48. [DOI] [PubMed] [Google Scholar]
- Fisher S, Barry A, Abreu J, Minie B, Nolan J, Delorey TM, Young G, Fennell TJ, Allen A, Ambrogio L, et al. (2011). A scalable, fully automated process for construction of sequence-ready human exome targeted capture libraries. Genome Biol. 12, R1. [DOI] [PMC free article] [PubMed] [Google Scholar]
- Fortin J-P, Labbe A, Lemire M, Zanke BW, Hudson TJ, Fertig EJ, Greenwood CM, and Hansen KD (2014). Functional normalization of 450k methylation array data improves replication in large cancer studies. Genome Biol. 15, 503. [DOI] [PMC free article] [PubMed] [Google Scholar]
- Gao Y, Wang J, and Zhao F (2015). CIRI: an efficient and unbiased algorithm for de novo circular RNA identification. Genome Biol. 16, 4. [DOI] [PMC free article] [PubMed] [Google Scholar]
- Gao C, Wang Y, Broaddus R, Sun L,Xue F, and Zhang W (2017). Exon 3 mutations of CTNNB1 drive tumorigenesis: a review. Oncotarget 9, 5492–5508. [DOI] [PMC free article] [PubMed] [Google Scholar]
- Gao Q, Liang W-W, Foltz SM, Mutharasu G, Jayasinghe RG, Cao S, Liao W-W, Reynolds SM, Wyczalkowski MA, Yao L, et al. ; Fusion Analysis Working Group; Cancer Genome Atlas Research Network (2018). Driver Fusions and Their Implications in the Development and Treatment of Human Cancers. Cell Rep. 23, 227–238.e3. [DOI] [PMC free article] [PubMed] [Google Scholar]
- Gibbons BC, Chambers MC, Monroe ME, Tabb DL, and Payne SH(2015). Correcting systematic bias and instrument measurement drift with mzRefinery. Bioinformatics 31, 3838–3840. [DOI] [PMC free article] [PubMed] [Google Scholar]
- Goodman AM, Kato S, Bazhenova L, Patel SP, Frampton GM, Miller V, Stephens PJ, Daniels GA, and Kurzrock R (2017). Tumor Mutational Burden as an Independent Predictor of Response to Immunotherapy in Diverse Cancers. Mol. Cancer Ther. 16, 2598–2608. [DOI] [PMC free article] [PubMed] [Google Scholar]
- Grossman RL, Heath AP, Ferretti V, Varmus HE, Lowy DR, Kibbe WA, and Staudt LM (2016). Toward a Shared Vision for Cancer Genomic Data. N. Engl. J. Med. 375, 1109–1112. [DOI] [PMC free article] [PubMed] [Google Scholar]
- Haas BJ, Dobin A, Stransky N, Li B, Yang X, Tickle T, Bankapur A, Ganote C, Doak TG, Pochet N, et al. (2017). STAR-Fusion: Fast and Accurate Fusion Transcript Detection from RNA-Seq. bioRxiv. 10.1101/120295. [DOI] [Google Scholar]
- Hainaut P, and Pfeifer GP (2016). Somatic TP53 Mutations in the Era of Genome Sequencing. Cold Spring Harb. Perspect. Med. 6, 6. [DOI] [PMC free article] [PubMed] [Google Scholar]
- Hansen TB, Kjems J, and Damgaard CK (2013). Circular RNA and miR-7 in cancer. Cancer Res. 73, 5609–5612. [DOI] [PubMed] [Google Scholar]
- Hanzelmann S, Castelo R, and Guinney J (2013). GSVA: gene set variation analysis for microarray and RNA-seq data. BMC Bioinformatics 14, 7. [DOI] [PMC free article] [PubMed] [Google Scholar]
- Harel M, Ortenberg R, Varanasi SK, Mangalhara KC, Mardamshina M, Markovits E, Baruch EN, Tripple V, Arama-Chayoth M, Greenberg E, et al. (2019). Proteomics of Melanoma Response to Immunotherapy Reveals Mitochondrial Dependence. Cell 179, 236–250.e18. [DOI] [PMC free article] [PubMed] [Google Scholar]
- Hollenbach PW, Nguyen AN, Brady H, Williams M, Ning Y, Richard N, Krushel L, Aukerman SL, Heise C, and MacBeth KJ (2010). A comparison ofazacitidineand decitabine activities in acute myeloid leukemia cell lines. PLoS ONE 5, e9001. [DOI] [PMC free article] [PubMed] [Google Scholar]
- Horowitz N, Pinto K, Mutch DG, Herzog TJ, Rader JS, Gibb R, Bocker-Edmonston T, and Goodfellow PJ (2002). Microsatellite instability, MLH1 promoter methylation, and loss of mismatch repair in endometrial cancer and concomitant atypical hyperplasia. Gynecol. Oncol. 86, 62–68. [DOI] [PubMed] [Google Scholar]
- Hsu S-D, Lin F-M, Wu W-Y, Liang C, Huang W-C, Chan W-L, Tsai W-T, Chen G-Z, Lee C-J, Chiu C-M, et al. (2011). miRTarBase: a database curates experimentally validated microRNA-target interactions. Nucleic Acids Res. 39, D163–D169. [DOI] [PMC free article] [PubMed] [Google Scholar]
- Huang K-L, Li S, Mertins P, Cao S, Gunawardena HP, Ruggles KV, Mani DR, Clauser KR, Tanioka M, Usary J, et al. (2017). Proteogenomic integration reveals therapeutic targets in breast cancer xenografts. Nat. Commun. 8, 14864. [DOI] [PMC free article] [PubMed] [Google Scholar]
- Inga A, Storici F, Darden TA, and Resnick MA (2002). Differential transactivation by the p53 transcription factor is highly dependent on p53 level and promoter target sequence. Mol. Cell. Biol. 22, 8612–8625. [DOI] [PMC free article] [PubMed] [Google Scholar]
- Ishii H, Saitoh M, Sakamoto K, Kondo T, Katoh R, Tanaka S, Motizuki M, Masuyama K, and Miyazawa K (2014). Epithelial splicing regulatory proteins 1 (ESRPI)and 2 (ESRP2)suppresscancercell motilityviadifferent mechanisms. J. Biol. Chem. 289, 27386–27399. [DOI] [PMC free article] [PubMed] [Google Scholar]
- Jurtz V, Paul S, Andreatta M, Marcatili P, Peters B, and Nielsen M (2017). NetMHCpan-4.0: Improved Peptide-MHC Class I Interaction Predictions Integrating Eluted Ligand and Peptide Binding Affinity Data. J. Immunol. 199, 3360–3368. [DOI] [PMC free article] [PubMed] [Google Scholar]
- Kandoth C, Schultz N, Cherniack AD, Akbani R, Liu Y, Shen H, Robertson AG, Pashtan I, Shen R, Benz CC, et al. ; Cancer Genome Atlas Research Network (2013). Integrated genomic characterization of endometrial carcinoma. Nature 497, 67–73. [DOI] [PMC free article] [PubMed] [Google Scholar]
- Kim S, and Pevzner PA (2014). MS-GF+ makes progress towards a universal database search tool for proteomics. Nat. Commun. 5, 5277. [DOI] [PMC free article] [PubMed] [Google Scholar]
- Kim S, Gupta N, and Pevzner PA (2008). Spectral probabilities and generating functions of tandem mass spectra: a strike against decoy databases. J. Proteome Res. 7, 3354–3363. [DOI] [PMC free article] [PubMed] [Google Scholar]
- Kim T-M, Laird PW, and Park PJ (2013). The landscape of microsatellite instability in colorectal and endometrial cancer genomes. Cell 155, 858–868. [DOI] [PMC free article] [PubMed] [Google Scholar]
- Kim MP, Zhang Y, and Lozano G (2015). Mutant p53: Multiple Mechanisms Define Biologic Activity in Cancer. Front. Oncol. 5, 249. [DOI] [PMC free article] [PubMed] [Google Scholar]
- Koboldt DC, Zhang Q, Larson DE, Shen D, McLellan MD, Lin L, Miller CA, Mardis ER, Ding L, and Wilson RK (2012). VarScan 2: somatic mutation and copy number alteration discovery in cancer by exome sequencing. Genome Res. 22, 568–576. [DOI] [PMC free article] [PubMed] [Google Scholar]
- Kono K, Mizukami Y, Daigo Y, Takano A, Masuda K, Yoshida K, Tsunoda T, Kawaguchi Y, Nakamura Y, and Fujii H (2009). Vaccination with multiple peptides derived from novel cancer-testis antigens can induce specific T-cell responses and clinical responses in advanced esophageal cancer. Cancer Sci. 100, 1502–1509. [DOI] [PMC free article] [PubMed] [Google Scholar]
- Krakstad C, Tangen IL, Hoivik EA, Halle MK, Berg A, Werner HM, R$der, M.B., Kusonmano, K., Zou, J.X., 0yan, A.M., et al. (2015). ATAD2 over-expression links to enrichment of B-MYB-translational signatures and development of aggressive endometrial carcinoma. Oncotarget 6, 28440–28452. [DOI] [PMC free article] [PubMed] [Google Scholar]
- Krebs AM, Mitschke J, Lasierra Losada M, Schmalhofer O, Boerries M, Busch H, Boettcher M, Mougiakakos D, Reichardt W, Bronsert P, et al. (2017). The EMT-activator Zeb1 is a key factor for cell plasticity and promotes metastasis in pancreatic cancer. Nat. Cell Biol. 19, 518–529. [DOI] [PubMed] [Google Scholar]
- Kristensen LS, Hansen TB, Ven0 MT, and Kjems J (2018). Circular RNAs in cancer: opportunities and challenges in the field. Oncogene 37, 555–565. [DOI] [PMC free article] [PubMed] [Google Scholar]
- Kurnit KC, Kim GN, Fellman BM, Urbauer DL, Mills GB, Zhang W, and Broaddus RR (2017). CTNNB1 (beta-catenin) mutation identifies low grade, early stage endometrial cancer patients at increased riskofrecurrence. Mod. Pathol. 30, 1032–1041. [DOI] [PMC free article] [PubMed] [Google Scholar]
- Lamouille S, Xu J, and Derynck R (2014). Molecular mechanisms of epithelial-mesenchymal transition. Nat. Rev. Mol. Cell Biol. 15, 178–196. [DOI] [PMC free article] [PubMed] [Google Scholar]
- Lang GA, Iwakuma T, Suh Y-A, Liu G, Rao VA, Parant JM, Valentin-Vega YA, Terzian T, Caldwell LC, Strong LC, et al. (2004). Gain offunction of a p53 hot spot mutation in a mouse model of Li-Fraumeni syndrome. Cell 119, 861–872. [DOI] [PubMed] [Google Scholar]
- Langmead B, and Salzberg SL (2012). Fast gapped-read alignment with Bowtie 2. Nat. Methods 9, 357–359. [DOI] [PMC free article] [PubMed] [Google Scholar]
- Lee S-Y, Obata Y, Yoshida M, Stockert E, Williamson B, Jungbluth AA, Chen Y-T, Old LJ, and Scanlan MJ (2003). Immunomic analysis of human sarcoma. Proc. Natl. Acad. Sci. USA 100, 2651–2656. [DOI] [PMC free article] [PubMed] [Google Scholar]
- Lemery S, Keegan P, and Pazdur R (2017). First FDAApproval Agnostic of Cancer Site - When a Biomarker Defines the Indication. N. Engl. J. Med. 377, 1409–1412. [DOI] [PubMed] [Google Scholar]
- Levy L, Wei Y, Labalette C, Wu Y, Renard C-A, Buendia MA, and Neuveut C (2004). Acetylation of beta-catenin by p300 regulates beta-catenin-Tcf4 interaction. Mol. Cell. Biol. 24, 3404–3414. [DOI] [PMC free article] [PubMed] [Google Scholar]
- Lewis BP, Burge CB, and Bartel DP (2005). Conserved seed pairing, often flanked by adenosines, indicates that thousands of human genes are microRNA targets. Cell 120, 15–20. [DOI] [PubMed] [Google Scholar]
- Li B, and Dewey CN (2011). RSEM: accurate transcript quantification from RNA-Seq data with or without a reference genome. BMC Bioinformatics 12, 323. [DOI] [PMC free article] [PubMed] [Google Scholar]
- Li H, and Durbin R (2010). Fast and accurate long-read alignment with Burrows-Wheeler transform. Bioinformatics 26, 589–595. [DOI] [PMC free article] [PubMed] [Google Scholar]
- Li S, Shen D, Shao J, Crowder R, Liu W, Prat A, He X, Liu S, Hoog J, Lu C, et al. (2013). Endocrine-therapy-resistant ESR1 variants revealed by genomic characterization of breast-cancer-derived xenografts. Cell Rep. 4, 1116–1130. [DOI] [PMC free article] [PubMed] [Google Scholar]
- Li CM-C, Gocheva V, Oudin MJ, Bhutkar A, Wang SY, Date SR, Ng SR, Whittaker CA, Bronson RT, Snyder EL, et al. (2015). Foxa2 and Cdx2 cooperate with Nkx2–1 to inhibit lung adenocarcinoma metastasis. Genes Dev. 29, 1850–1862. [DOI] [PMC free article] [PubMed] [Google Scholar]
- Li M, Xie X, Zhou J, Sheng M, Yin X, Ko E-A, Zhou T, and Gu W (2017). Quantifying circular RNA expression from RNA-seq data using model-based framework. Bioinformatics 33, 2131–2139. [DOI] [PubMed] [Google Scholar]
- Li K, Vaudel M, Zhang B, Ren Y, and Wen B (2019). PDV: an integrative proteomics data viewer. Bioinformatics 35, 1249–1251. [DOI] [PMC free article] [PubMed] [Google Scholar]
- Liao Y, Wang J, Jaehnig EJ, Shi Z, and Zhang B (2019). WebGestalt 2019: gene set analysis toolkit with revamped UIs and APIs. Nucleic Acids Res. 47 (W1), W199–W205. [DOI] [PMC free article] [PubMed] [Google Scholar]
- Liu Q, Guntuku S, Cui XS, Matsuoka S, Cortez D, Tamai K, Luo G, Carattini-Rivera S, DeMayo F, Bradley A, et al. (2000). Chk1 is an essential kinasethat is regulated byAtrand required fortheG(2)/M DNAdamage checkpoint. Genes Dev. 14, 1448–1459. [PMC free article] [PubMed] [Google Scholar]
- Liu Y, Patel L, Mills GB, Lu KH, Sood AK, Ding L, Kucherlapati R, Mardis ER, Levine DA, Shmulevich I, et al. (2014). Clinical significance of CTNNB1 mutation and Wnt pathway activation in endometrioid endometrial carcinoma. J. Natl. Cancer Inst. 106, 106. [DOI] [PMC free article] [PubMed] [Google Scholar]
- Ly T, Whigham A, Clarke R, Brenes-Murillo AJ, Estes B, Madhessian L, Lundberg E, Wadsworth P, and Lamond AI (2017). Proteomic analysis of cell cycle progression in asynchronous cultures, including mitotic subphases, using PRIMMUS. eLife 6, 6. [DOI] [PMC free article] [PubMed] [Google Scholar]
- Machin P, Catasus L, Pons C, Munoz J, Matias-Guiu X, and Prat J (2002). CTNNB1 mutations and β-catenin expression in endometrial carcinomas. Hum. Pathol. 33, 206–212. [DOI] [PubMed] [Google Scholar]
- Macurek L, Lindqvist A, Lim D, Lampson MA, Klompmaker R, Freire R, Clouin C, Taylor SS, Yaffe MB, and Medema RH (2008). Polo-like kinase-1 is activated by aurora A to promote checkpoint recovery. Nature 455, 119–123. [DOI] [PubMed] [Google Scholar]
- Mak MP, Tong P, Diao L, Cardnell RJ, Gibbons DL, William WN, Skoulidis F, Parra ER, Rodriguez-Canales J, Wistuba II, et al. (2016). A Patient-Derived, Pan-Cancer EMT Signature Identifies Global MolecularAlterations and Immune Target Enrichment Following Epithelial-to-Mesenchymal Transition. Clin. Cancer Res. 22, 609–620. [DOI] [PMC free article] [PubMed] [Google Scholar]
- Maruvka YE, Mouw KW, Karlic R, Parasuraman P, Kamburov A, Polak P, Haradhvala NJ, Hess JM, Rheinbay E, Brody Y, et al. (2017). Analysis of somatic microsatellite indels identifies driver events in human tumors. Nat. Biotechnol. 35, 951–959. [DOI] [PMC free article] [PubMed] [Google Scholar]
- Matsuoka S, Huang M, and Elledge SJ (1998). Linkage ofATM to cell cycle regulation by the Chk2 protein kinase. Science 282, 1893–1897. [DOI] [PubMed] [Google Scholar]
- Matsuoka S, Ballif BA, Smogorzewska A, McDonald ER 3rd, Hurov KE, Luo J, Bakalarski CE, Zhao Z, Solimini N, Lerenthal Y, et al. (2007). ATM and ATR substrate analysis reveals extensive protein networks responsive to DNA damage. Science 316, 1160–1166. [DOI] [PubMed] [Google Scholar]
- McConechy MK, Talhouk A, Leung S, Chiu D, Yang W, Senz J, Reha-Krantz LJ, Lee C-H, Huntsman DG, Gilks CB, and McAlpine JN(2015). Endometrial Carcinomas with POLE Exonuclease Domain Mutations Have a Favorable Prognosis. Clin. Cancer Res. 22, 2865–2873. [DOI] [PubMed] [Google Scholar]
- McDonald ER 3rd, de Weck A, Schlabach MR, Billy E, Mavrakis KJ, Hoffman GR, Belur D, Castelletti D, Frias E, Gampa K, et al. (2017). Project DRIVE: A Compendium of Cancer Dependencies and Synthetic Lethal Relationships Uncovered by Large-Scale, Deep RNAi Screening. Cell 170, 577–592.e10. [DOI] [PubMed] [Google Scholar]
- Mello SS, and Attardi LD (2013). Not all p53 gain-of-function mutants are created equal. Cell Death Differ. 20, 855–857. [DOI] [PMC free article] [PubMed] [Google Scholar]
- Memczak S, Jens M, Elefsinioti A, Torti F, Krueger J, Rybak A, Maier L, Mackowiak SD, Gregersen LH, Munschauer M, et al. (2013). Circular RNAs are a large class of animal RNAs with regulatory potency. Nature 495, 333–338. [DOI] [PubMed] [Google Scholar]
- Meng X, Yang S, Li Y, Li Y, Devor EJ, Bi J, Wang X, Umesalma S, Quelle DE, Thiel WH, et al. (2018). Combination of Proteasome and Histone Deacetylase Inhibitors Overcomes the Impact of Gain-of-Function p53 Mutations. Dis. Markers 2018, 3810108. [DOI] [PMC free article] [PubMed] [Google Scholar]
- Mertins P, Mani DR, Ruggles KV, Gillette MA, Clauser KR, Wang P, Wang X, Qiao JW, Cao S, Petralia F, et al. ; NCI CPTAC (2016). Proteogenomics connects somatic mutations to signalling in breast cancer. Nature 534, 55–62. [DOI] [PMC free article] [PubMed] [Google Scholar]
- Mhawech-Fauceglia P, Herrmann FR, Rai H, Tchabo N, Lele S, Izevbaye I, Odunsi K, and Cheney RT (2010). IMP3 distinguishes uterine serous carcinoma from endometrial endometrioid adenocarcinoma. Am. J. Clin. Pathol. 133, 899–908. [DOI] [PubMed] [Google Scholar]
- Miranda KC, Huynh T, Tay Y, Ang Y-S, Tam W-L, Thomson AM, Lim A, and Rigoutsos I (2006). A pattern-based method for the identification of MicroRNA binding sites and their corresponding heteroduplexes. Cell 126, 1203–1217. [DOI] [PubMed] [Google Scholar]
- Mizutani A, Koinuma D, Seimiya H, and Miyazono K (2016). The Arkadia-ESRP2 axis suppresses tumor progression: analyses in clear-cell renal cell carcinoma. Oncogene 35, 3514–3523. [DOI] [PMC free article] [PubMed] [Google Scholar]
- Monroe ME, Shaw JL, Daly DS, Adkins JN, and Smith RD (2008). MASIC: a software program for fast quantitation and flexible visualization of chromatographic profiles from detected LC-MS(/MS) features. Comput. Biol. Chem. 32,215–217. [DOI] [PMC free article] [PubMed] [Google Scholar]
- Mukohyama J, Shimono Y, Minami H, Kakeji Y, and Suzuki A (2017). Roles of microRNAs and RNA-Binding Proteins in the Regulation of Colorectal Cancer Stem Cells. Cancers (Basel) 9, 9. [DOI] [PMC free article] [PubMed] [Google Scholar]
- Mundt F, Rajput S, Li S, Ruggles KV, Mooradian AD, Mertins P, Gillette MA, Krug K, Guo Z, Hoog J, et al. (2018). Mass Spectrometry-Based Proteomics Reveals Potential Roles of NEK9 and MAP2K4 in Resistance to PI3K Inhibition in Triple-Negative Breast Cancers. Cancer Res. 78,2732–2746. [DOI] [PMC free article] [PubMed] [Google Scholar]
- Myers A, Barry WT, Hirsch MS, Matulonis U, and Lee L (2014). ß-Catenin mutations in recurrent FIGO IA grade I endometrioid endometrial cancers. Gynecol. Oncol. 134, 426–427. [DOI] [PubMed] [Google Scholar]
- Nieto MA, Huang RY-J, Jackson RA, and Thiery JP (2016). EMT: 2016. Cell 166,21–45. [DOI] [PubMed] [Google Scholar]
- Nikulenkov F, Spinnler C, Li H, Tonelli C, Shi Y, Turunen M, Kivioja T, Ignatiev I, Kel A, Taipale J, and Selivanova G (2012). Insights into p53 transcriptional function via genome-wide chromatin occupancy and gene expression analysis. Cell Death Differ. 19, 1992–2002. [DOI] [PMC free article] [PubMed] [Google Scholar]
- Niu B, Ye K, Zhang Q, Lu C, Xie M, McLellan MD, Wendl MC, and Ding L (2014). MSIsensor: microsatellite instability detection using paired tumor-normal sequence data. Bioinformatics 30, 1015–1016. [DOI] [PMC free article] [PubMed] [Google Scholar]
- Niu B, Scott AD, Sengupta S, Bailey MH, Batra P, Ning J, Wyczalkowski MA, Liang W-W, Zhang Q, McLellan MD, et al. (2016). Protein-structure-guided discovery of functional mutations across 19 cancer types. Nat. Genet. 48, 827–837. [DOI] [PMC free article] [PubMed] [Google Scholar]
- Nowosielska A, and Marinus MG (2008). DNA mismatch repair-induced double-strand breaks. DNA Repair (Amst.) 7, 48–56. [DOI] [PMC free article] [PubMed] [Google Scholar]
- O’Leary NA, Wright MW, Brister JR, Ciufo S, Haddad D, McVeigh R, Rajput B, Robbertse B, Smith-White B, Ako-Adjei D, et al. (2016). Reference sequence (RefSeq) database at NCBI: current status, taxonomic expansion, and functional annotation. Nucleic Acids Res. 44 (D1), D733–D745. [DOI] [PMC free article] [PubMed] [Google Scholar]
- Omar HA, and Tolba MF (2019). Tackling molecular targets beyond PD-1/ PD-L1: Novel approaches to boost patients’ response to cancer immunotherapy. Crit. Rev. Oncol. Hematol. 135, 21–29. [DOI] [PubMed] [Google Scholar]
- Onuchic V, Hartmaier RJ, Boone DN, Samuels ML, Patel RY, White WM, Garovic VD, Oesterreich S, Roth ME, Lee AV, and Milosavljevic A (2016). Epigenomic Deconvolution of Breast Tumors Reveals Metabolic Coupling between Constituent Cell Types. Cell Rep. 17, 2075–2086. [DOI] [PMC free article] [PubMed] [Google Scholar]
- Pappas K, Xu J, Zairis S, Resnick-Silverman L, Abate F, Steinbach N, Ozturk S, Saal LH, Su T, Cheung P, et al. (2017). p53 Maintains Baseline Expression of Multiple Tumor Suppressor Genes. Mol. Cancer Res. 15, 1051–1062. [DOI] [PMC free article] [PubMed] [Google Scholar]
- Paschal CR, Maciejowski J, and Jallepalli PV (2012). A stringent requirement for Plk1 T210 phosphorylation during K-fiber assembly and chromosome congression. Chromosoma 121, 565–572. [DOI] [PMC free article] [PubMed] [Google Scholar]
- Pelletier J, Thomas G, and Volarevic S (2018). Ribosome biogenesis in cancer: new players and therapeutic avenues. Nat. Rev. Cancer 18, 51–63. [DOI] [PubMed] [Google Scholar]
- Perfetto L, Briganti L, Calderone A, Cerquone Perpetuini A, Iannuccelli M, Langone F, Licata L, Marinkovic M, Mattioni A, Pavlidou T, et al. (2016). SIGNOR: a database of causal relationships between biological entities. Nucleic Acids Res. 44 (D1), D548–D554. [DOI] [PMC free article] [PubMed] [Google Scholar]
- Pillman KA, Phillips CA, Roslan S, Toubia J, Dredge BK, Bert AG, Lumb R, Neumann DP, Li X, Conn SJ, et al. (2018). miR-200/375 control epithelial plasticity-associated alternative splicing by repressing the RNA-binding protein Quaking. EMBO J. 37, 37. [DOI] [PMC free article] [PubMed] [Google Scholar]
- Ruepp A, Brauner B, Dunger-Kaltenbach I, Frishman G, Montrone C, Stransky M, Waegele B, Schmidt T, Doudieu ON, Stumpflen V, and Mewes HW (2008). CORUM: the comprehensive resource of mammalian protein complexes. Nucleic Acids Res. 36, D646–D650. [DOI] [PMC free article] [PubMed] [Google Scholar]
- Ruggles KV, Tang Z, Wang X, Grover H, Askenazi M, Teubl J, Cao S, McLellan MD, Clauser KR, Tabb DL, et al. (2016). An Analysis of the Sensitivity of Proteogenomic Mapping of Somatic Mutations and Novel Splicing Events in Cancer. Mol. Cell. Proteomics 15, 1060–1071. [DOI] [PMC free article] [PubMed] [Google Scholar]
- Samstein RM, Lee C-H, Shoushtari AN, Hellmann MD, Shen R, Janjigian YY, Barron DA, Zehir A, Jordan EJ, Omuro A, et al. (2019). Tumor mutational load predicts survival after immunotherapy across multiple cancer types. Nat. Genet. 51, 202–206. [DOI] [PMC free article] [PubMed] [Google Scholar]
- Sancar A, Lindsey-Boltz LA, Unsal-Kacmaz K, and Linn S (2004). Molecular mechanisms of mammalian DNA repair and the DNA damage check-points. Annu. Rev. Biochem. 73, 39–85. [DOI] [PubMed] [Google Scholar]
- Sanchez I, and Dynlacht BD (2016). Cilium assembly and disassembly. Nat. Cell Biol. 18,711–717. [DOI] [PMC free article] [PubMed] [Google Scholar]
- Sanchez-Vega F, Mina M, Armenia J, Chatila WK, Luna A, La KC, Dimitriadoy S, Liu DL, Kantheti HS, Saghafinia S, et al. ; Cancer Genome Atlas Research Network (2018). Oncogenic Signaling Pathways in The Cancer Genome Atlas. Cell 173, 321–337.e10. [DOI] [PMC free article] [PubMed] [Google Scholar]
- Saunders CT, Wong WSW, Swamy S, Becq J, Murray LJ, and Cheetham RK (2012). Strelka: accurate somatic small-variant calling from sequenced tumor-normal sample pairs. Bioinformatics 28, 1811–1817. [DOI] [PubMed] [Google Scholar]
- Schindler C, Levy DE, and Decker T (2007). JAK-STAT signaling: from interferons to cytokines. J. Biol. Chem. 282, 20059–20063. [DOI] [PubMed] [Google Scholar]
- Schubert M, Klinger B, Klunemann M, Sieber A, Uhlitz F, Sauer S, Garnett MJ, Bluthgen N, and Saez-Rodriguez J (2018). Perturbation-response genes reveal signaling footprints in cancer gene expression. Nat. Commun. 9, 20. [DOI] [PMC free article] [PubMed] [Google Scholar]
- Sergushichev AA (2016). An algorithm for fast preranked gene set enrichment analysis using cumulative statistic calculation. bioRxiv. 10.1101/060012. [DOI] [Google Scholar]
- Shin DS, Zaretsky JM, Escuin-Ordinas H, Garcia-Diaz A, Hu-Lieskovan S, Kalbasi A, Grasso CS, Hugo W, Sandoval S, Torrejon DY, et al. (2016). Primary Resistance to PD-1 Blockade Mediated by JAK1/2 Mutations. Cancer Discov. 7, 188–201. [DOI] [PMC free article] [PubMed] [Google Scholar]
- Siegel RL, Miller KD, and Jemal A (2018). Cancer statistics, 2018. CA Cancer J. Clin. 68, 7–30. [DOI] [PubMed] [Google Scholar]
- Siegel RL, Miller KD, and Jemal A (2019). Cancer statistics, 2019. CA Cancer J. Clin. 69, 7–34. [DOI] [PubMed] [Google Scholar]
- Simpkins SB, Bocker T, Swisher EM, Mutch DG, Gersell DJ, Kovatich AJ, Palazzo JP, Fishel R, and Goodfellow PJ (1999). MLH1 promoter methylation and gene silencing isthe primary cause of microsatellite instability in sporadic endometrial cancers. Hum. Mol. Genet. 8, 661–666. [DOI] [PubMed] [Google Scholar]
- Stelloo E, Bosse T, Nout RA, MacKay HJ, Church DN, Nijman HW, Leary A, Edmondson RJ, Powell ME, Crosbie EJ, et al. (2015). Refining prognosis and identifying targetable pathways for high-risk endometrial cancer; a TransPORTEC initiative. Mod. Pathol. 28, 836–844. [DOI] [PubMed] [Google Scholar]
- Stelloo E, Versluis MA, Nijman HW, de Bruyn M, Plat A, Osse EM, van Dijk RH, Nout RA, Creutzberg CL, de Bock GH, et al. (2016). Microsatellite instability derived JAK1 frameshift mutations are associated with tumor immune evasion in endometrioid endometrial cancer. Oncotarget 7, 39885–39893. [DOI] [PMC free article] [PubMed] [Google Scholar]
- Suad O, Rozenberg H, Brosh R, Diskin-Posner Y, Kessler N, Shimon LJW, Frolow F, Liran A, Rotter V, and Shakked Z (2009). Structural basis of restoring sequence-specific DNA binding and transactivation to mutant p53 by suppressor mutations. J. Mol. Biol. 385, 249–265. [DOI] [PubMed] [Google Scholar]
- Suda T, Tsunoda T, Daigo Y, Nakamura Y, and Tahara H (2007). Identification of human leukocyte antigen-A24-restricted epitope peptides derived from gene products upregulated in lung and esophageal cancers as novel targets for immunotherapy. Cancer Sci. 98, 1803–1808. [DOI] [PMC free article] [PubMed] [Google Scholar]
- Szolek A, Schubert B, Mohr C, Sturm M, Feldhahn M, and Kohlbacher O (2014). OptiType: precision HLA typing from next-generation sequencing data. Bioinformatics 30, 3310–3316. [DOI] [PMC free article] [PubMed] [Google Scholar]
- Tabb DL, Wang X, Carr SA, Clauser KR, Mertins P, Chambers MC, Holman JD, Wang J, Zhang B, Zimmerman LJ, et al. (2016). Reproducibility of Differential Proteomic Technologies in CPTAC Fractionated Xenografts. J. Proteome Res. 15, 691–706. [DOI] [PMC free article] [PubMed] [Google Scholar]
- Talhouk A, McConechy MK, Leung S, Yang W, Lum A, Senz J, Boyd N, Pike J, Anglesio M, Kwon JS, et al. (2017). Confirmation of ProMisE: A simple, genomics-based clinical classifierforendometrial cancer. Cancer 123, 802–813. [DOI] [PubMed] [Google Scholar]
- Tan VYF, and Fevotte C (2013). Automatic relevance determination in nonnegative matrix factorization with the p-divergence. IEEE Trans. Pattern Anal. Mach. Intell. 35, 1592–1605. [DOI] [PubMed] [Google Scholar]
- Tanaka Y, Terai Y, Kawaguchi H, Fujiwara S, Yoo S, Tsunetoh S, Takai M, Kanemura M, Tanabe A, and Ohmichi M (2013). Prognostic impact of EMT (epithelial-mesenchymal-transition)-related protein expression in endometrial cancer. Cancer Biol. Ther. 14, 13–19. [DOI] [PMC free article] [PubMed] [Google Scholar]
- Tang Y, Shu G, Yuan X, Jing N, and Song J (2011). FOXA2 functions as a suppressor of tumor metastasis by inhibition of epithelial-to-mesenchymal transition in human lung cancers. Cell Res. 21, 316–326. [DOI] [PMC free article] [PubMed] [Google Scholar]
- Tao MH, and Freudenheim JL (2010). DNA methylation in endometrial cancer. Epigenetics 5, 491–498. [DOI] [PMC free article] [PubMed] [Google Scholar]
- Tryka KA, Hao L, Sturcke A, Jin Y, Wang ZY, Ziyabari L, Lee M, Popova N, Sharopova N, Kimura M, and Feolo M (2014). NCBI’s Database of Genotypes and Phenotypes: dbGaP. Nucleic Acids Res. 42, D975–D979. [DOI] [PMC free article] [PubMed] [Google Scholar]
- Turei D, Korcsmaros T, and Saez-Rodriguez J (2016). OmniPath: guidelines and gateway for literature-curated signaling pathway resources. Nat. Methods 13, 966–967. [DOI] [PubMed] [Google Scholar]
- Umene K, Yanokura M, Banno K, Irie H, Adachi M, Iida M, Nakamura K, Nogami Y, Masuda K, Kobayashi Y, et al. (2015). Aurora kinaseAhas a significant role as a therapeutic target and clinical biomarker in endometrial cancer. Int. J. Oncol. 46, 1498–1506. [DOI] [PMC free article] [PubMed] [Google Scholar]
- Consortium UniProt (2019). UniProt: a worldwide hub of protein knowledge. Nucleic Acids Res. 47 (D1), D506–D515. [DOI] [PMC free article] [PubMed] [Google Scholar]
- van Gent R, Di Sanza C, van den Broek NJF, Fleskens V, Veenstra A, Stout GJ, and Brenkman AB (2014). SIRT1 mediates FOXA2 breakdown by deacetylation in a nutrient-dependent manner. PLoS ONE 9, e98438. [DOI] [PMC free article] [PubMed] [Google Scholar]
- van Vugt MATM, Gardino AK, Linding R, Ostheimer GJ, Reinhardt HC, Ong S-E, Tan CS, Miao H, Keezer SM, Li J, et al. (2010). A mitotic phosphorylation feedback network connects Cdk1, Plk1, 53BP1, and Chk2 to inactivate the G(2)/M DNA damage checkpoint. PLoS Biol. 8, e1000287. [DOI] [PMC free article] [PubMed] [Google Scholar]
- Vasaikar SV, Straub P, Wang J, and Zhang B (2018). LinkedOmics: analyzing multi-omics data within and across 32 cancer types. Nucleic Acids Res. 46 (D1), D956–D963. [DOI] [PMC free article] [PubMed] [Google Scholar]
- Vasaikar S, Huang C, Wang X, Petyuk VA, Savage SR, Wen B, Dou Y, Zhang Y, Shi Z, Arshad OA, et al. ; Clinical Proteomic Tumor Analysis Consortium (2019). Proteogenomic Analysis of Human Colon Cancer Reveals New Therapeutic Opportunities. Cell 177, 1035–1049.e19. [DOI] [PMC free article] [PubMed] [Google Scholar]
- Vigneron S, Sundermann L, Labbe J-C, Pintard L, Radulescu O, Castro A, and Lorca T (2018). Cyclin A-cdk1-Dependent Phosphorylation of Bora Is the Triggering Factor Promoting Mitotic Entry. Dev. Cell 45, 637–650.e7. [DOI] [PubMed] [Google Scholar]
- Vo JN, Cieslik M, Zhang Y, Shukla S,Xiao L, Zhang Y, Wu Y-M, Dhanasekaran SM, Engelke CG, Cao X, et al. (2019). The Landscape of Circular RNA in Cancer. Cell 176, 869–881.e13. [DOI] [PMC free article] [PubMed] [Google Scholar]
- Walker JL, Piedmonte MR, Spirtos NM, Eisenkop SM, Schlaerth JB, Mannel RS, Spiegel G, Barakat R, Pearl ML, and Sharma SK (2009). Laparoscopy compared with laparotomy for comprehensive surgical staging of uterine cancer: Gynecologic Oncology Group Study LAP2. J. Clin. Oncol. 27, 5331–5336. [DOI] [PMC free article] [PubMed] [Google Scholar]
- Wang X, Slebos RJC, Wang D, Halvey PJ, Tabb DL, Liebler DC, and Zhang B (2012). Protein identification using customized protein sequencedatabases derived from RNA-Seq data. J. Proteome Res. 11, 1009–1017. [DOI] [PMC free article] [PubMed] [Google Scholar]
- Wang H, Zhang X, Teng L, and Legerski RJ (2015). DNA damage check-point recovery and cancer development. Exp. Cell Res. 334, 350–358. [DOI] [PubMed] [Google Scholar]
- Wang H, Franco F, and Ho P-C (2017). Metabolic Regulation of Tregs in Cancer: Opportunities for Immunotherapy. Trends Cancer 3, 583–592. [DOI] [PubMed] [Google Scholar]
- Wang B, Liu G, Ding L, Zhao J, and Lu Y (2018). FOXA2 promotes the proliferation, migration and invasion, and epithelial mesenchymal transition in colon cancer. Exp. Ther. Med. 16, 133–140. [DOI] [PMC free article] [PubMed] [Google Scholar]
- Warzecha CC, and Carstens RP (2012). Complex changes in alternative pre-mRNA splicing play a central role in the epithelial-to-mesenchymal transition (EMT). Semin. Cancer Biol. 22, 417–27. [DOI] [PMC free article] [PubMed] [Google Scholar]
- Warzecha CC, Sato TK, Nabet B, Hogenesch JB, and Carstens RP (2009). ESRP1 and ESRP2 are epithelial cell-type-specific regulators of FGFR2 splicing. Mol. Cell 33, 591–601. [DOI] [PMC free article] [PubMed] [Google Scholar]
- Wen B, Mei Z, Zeng C, and Liu S (2017). metaX: a flexible and comprehensive software for processing metabolomics data. BMC Bioinformatics 18, 183. [DOI] [PMC free article] [PubMed] [Google Scholar]
- Wen B, Wang X, and Zhang B (2019). PepQuery enables fast, accurate, and convenient proteomic validation of novel genomic alterations. Genome Res. 29, 485–493. [DOI] [PMC free article] [PubMed] [Google Scholar]
- Wolf D, Rodova M, Miska EA, Calvet JP, and Kouzarides T (2002). Acetylation of beta-catenin by CREB-binding protein (CBP). J. Biol. Chem. 277, 25562–25567. [DOI] [PubMed] [Google Scholar]
- Wong NACS, and Pignatelli M (2002). Beta-catenin-a linchpin in colorectal carcinogenesis? Am. J. Pathol. 160, 389–01. [DOI] [PMC free article] [PubMed] [Google Scholar]
- Xi R, Lee S, Xia Y, Kim T-M, and Park PJ (2016). Copy numberanalysis of whole-genome data using BIC-seq2 and its application to detection of cancer susceptibility variants. Nucleic Acids Res. 44, 6274–6286. [DOI] [PMC free article] [PubMed] [Google Scholar]
- Yang Y, Gao X, Zhang M, Yan S, Sun C, Xiao F, Huang N, Yang X, Zhao K, Zhou H, et al. (2018). Novel Role of FBXW7 Circular RNA in Repressing Glioma Tumorigenesis. J. Natl. Cancer Inst. 110, 110. [DOI] [PMC free article] [PubMed] [Google Scholar]
- Ye K, Schulz MH, Long Q, Apweiler R, and Ning Z (2009). Pindel: a pattern growth approach todetect break points of large deletionsand medium sized insertions from paired-end short reads. Bioinformatics 25, 2865–2871. [DOI] [PMC free article] [PubMed] [Google Scholar]
- Zaravinos A (2015). The Regulatory Role of MicroRNAs in EMT and Cancer. J. Oncol. 2015, 865816. [DOI] [PMC free article] [PubMed] [Google Scholar]
- Zhang B, Wang J, Wang X, Zhu J, Liu Q, Shi Z, Chambers MC, Zimmerman LJ, Shaddox KF, Kim S, et al. ; NCI CPTAC (2014). Proteogenomic characterization of human colon and rectal cancer. Nature 513, 382–387. [DOI] [PMC free article] [PubMed] [Google Scholar]
- Zhang P, Sun Y, and Ma L (2015). ZEB1: at the crossroads of epithelial-mesenchymal transition, metastasis and therapy resistance. Cell Cycle 14, 481–487. [DOI] [PMC free article] [PubMed] [Google Scholar]
- Zhang H, Liu T, Zhang Z, Payne SH, Zhang B, McDermott JE, Zhou J-Y, Petyuk VA, Chen L, Ray D, et al. ; CPTAC Investigators (2016a). Integrated Proteogenomic Characterization of Human High-Grade Serous Ovarian Cancer. Cell 166, 755–765. [DOI] [PMC free article] [PubMed] [Google Scholar]
- Zhang J, White NM, Schmidt HK, Fulton RS, Tomlinson C, Warren WC, Wilson RK, and Maher CA (2016b). INTEGRATE: genefusion discovery using whole genome and transcriptome data. Genome Res. 26, 108–118. [DOI] [PMC free article] [PubMed] [Google Scholar]
- Zhang H, Lu Y, Chen E, Li X, Lv B, Vikis HG, and Liu P (2017a). XRN2 promotes EMT and metastasis through regulating maturation of miR-10a. Oncogene 36, 3925–3933. [DOI] [PubMed] [Google Scholar]
- Zhang X-L, Xu L-L, and Wang F (2017b). Hsa_circ_0020397 regulates colorectal cancer cell viability, apoptosis and invasion by promoting the expression of the miR-138 targets TERT and PD-L1. Cell Biol. Int. 41, 1056–1064. [DOI] [PubMed] [Google Scholar]
- Zheng W, Yi X, Fadare O, Liang SX, Martel M, Schwartz PE, and Jiang Z (2008). The oncofetal protein IMP3: a novel biomarkerforendometrial serous carcinoma. Am. J. Surg. Pathol. 32, 304–315. [DOI] [PubMed] [Google Scholar]
- Zheng Q, Bao C, Guo W, Li S, Chen J, Chen B, Luo Y, Lyu D, Li Y, Shi G, et al. (2016). Circular RNA profiling reveals an abundant circHIPK3 that regulates cell growth by sponging multiple miRNAs. Nat. Commun. 7, 11215. [DOI] [PMC free article] [PubMed] [Google Scholar]
- Zhu M, Jia N, Huang F, Liu X, Zhao Y, Tao X, Jiang W, Li Q, and Feng W (2017). Whether intermediate-risk stage 1A, grade 1/2, endometrioid endometrial cancer patients with lesions larger than 2 cm warrant lymph node dissection? BMC Cancer 17, 696. [DOI] [PMC free article] [PubMed] [Google Scholar]
Associated Data
This section collects any data citations, data availability statements, or supplementary materials included in this article.
Supplementary Materials
Data Availability Statement
Processed data tables are available in Table S2. Data used for the manuscript are also available through a Python package called ‘cptac’ (https://pypi.org/project/cptac/, install via pip) to allow programmatic access and LinkedOmics (http://www.linkedomics.org/) (Vasaikar et al., 2018) to allow association and pathway analysis. Raw genomic data is available from the Genomic Data Commons (https://gdc.cancer.gov/) or upon request from dbGaP (https://www.ncbi.nlm.nih.gov/gap/, phs001287) and proteomic data is available via the CPTAC Data Portal (https://cptac-data-portal.georgetown.edu/cptacPublic/).