Abstract
Several studies have focused on the antimicrobial effects of cerium oxide nanoparticles (CeO2-NP) but few have focused on their effects on bacteria under initial biofilm formation conditions. Streptococcus mutans is a prolific biofilm former contributing to dental caries in the presence of fermentable carbohydrates and is a recognized target for therapeutic intervention. CeO2-NP derived solely from Ce(IV) salt hydrolysis were found to reduce adherent bacteria by approximately 40% while commercial dispersions of “bare” CeO2-NP (e.g., 3 nm, 10–20 nm, 30 nm diameter) and Ce(NO3)3•6H2O were either inactive or observed to slightly increase biofilm formation under similar in vitro conditions. Planktonic growth and dispersal assays support a non-bactericidal mode of biofilm inhibition active in the initial phases of S. mutans biofilm production. Human cell proliferation assays suggest only minor effects of hydrolyzed Ce(IV) salts on cellular metabolism at concentrations up to 1 mM Ce, with less observed toxicity compared to equimolar concentrations of AgNO3. The results presented herein have implications in clinical dentistry.
Keywords: Ce(IV), biofilm, inhibition, dental, Streptococcus mutans
1. INTRODUCTION
The composition of clinically relevant biofilms varies significantly depending on the tissue, host and local environment. The oral cavity is home to a diverse array of microorganisms (i.e., oral microbiome) with varying capacities to form biofilms [1]. Streptococcal mutans is among the robust tooth-adhering biofilm formers in the presence of fermentable carbohydrates (e.g., sucrose). This strong capacity for biofilm production by S. mutans is associated with both tooth decay and bacterial endocarditis [2]. As such, S. mutans has long been the target of antimicrobial therapy to limit tooth decay and associated comorbidities [3]. Inorganic tooth-applied agents (e.g., AgNO3, silver diamine fluoride) are effective at arresting tooth decay, yet they are non-selective bactericidal agents whose repeated administration has raised concerns of emerging bacterial resistance [4, 5] and deleterious effects on the oral microbiota. Although agents with selective toxicity for highly cariogenic species are welcomed, none are currently available for clinical use. As such, tooth-applied biofilm inhibitors with non-lethal mechanisms of action have defined the search in preventive dentistry with the aim of limiting the effects on the entirety of the oral microbiome.
The use of nanoparticles in preventive and restorative dentistry has received considerable interest in recent years [6, 7]. Cerium oxide nanoparticles (CeO2-NP) are an attractive option for oral application due to their diverse range of sizes and morphologies attributed to variations in synthetic methodology [8]. This morphological diversity may be harnessed into differential medicinal activity [8]. Although the antimicrobial activity of CeO2-NP has been the subject of several studies and a recent review [9], their effects on established biofilm communities have only been reported recently [10–13]. Fewer studies have focused on the interaction of sublethal concentrations of CeO2-NP with bacteria under the initial biofilm forming conditions. Masadeh et al. [14] recently concluded that CeO2-NP (25–50 nm) were inactive as biofilm inhibitors and they also reduced the activity of known antimicrobial agents against a panel of selected bacteria. Xu et al. reported that CeO2-NP (50 nm) accelerated in vitro biofilm formation in P. aeruginosa [15]. It was postulated that bacterial exposure to “bare” CeO2-NP of this size increased cell surface hydrophobicity, aggregation and the production of reactive oxygen species (ROS) potentiating quorum sensing pathways and enhancing biofilm production [15, 16]. The goal of the present study was to expand upon the literature regarding CeO2-NP as biofilm inhibitors. CeO2-NP prepared from Ce(IV) salt hydrolysis [17–20] were screened against “bare” CeO2-NP of variable size and Ce(NO3)3•6H2O for their ability to perturb initial in vitro biofilm formation of the clinically relevant pathogen, S. mutans. The aggregation and dispersion properties of similarly sized CeO2-NP obtained from different synthetic methodology were also investigated offering insight into the variable biological activity observed.
2. RESULTS AND DISCUSSION
2.10. In vitro Adherent Bacteria Assays
The initial screen for S. mutans biofilm inhibition was carried out utilizing 125 μM Ce-containing agents of varying properties on a polystyrene (PS) plate (See Figure 1). All Ce-containing solutions were prepared as 5 mM (Ce ion) stock solutions (aged <30 min) at room temperature (rt) for consistency and diluted to 125 μM in brain heart infusion (BHI) media containing cells (and 1% sucrose) grown to log phase. It should be noted that no statistical difference in inhibitory activity was found when hydrolyzed Ce(IV) salts were allowed to age 20 h (at rt) prior to the static biofilm inhibition assays. Commercial dispersions of “bare” CeO2-NP: 3 nm solution diameter (Strem, 20% dispersion, pH 3.5 ± 0.75), 10–20 nm solution diameter (Alfa Aesar, 20% dispersion, pH 1.5), 30 nm (Alfa Aesar, 15% dispersion) and Ce(NO3)3•6H2O were either inactive or slightly increased biofilm growth of S. mutans at 20 h under the above conditions. In contrast, both hydrolyzed CAN (ceric ammonium nitrate) and CAS (ceric ammonium sulfate) displayed a significant reduction in adherent cells (approximately 40%) of S. mutans (See Figure 1). Further, dilution of a 1N solution of H2[Ce(NO3)6] similar to reported methods known to produce CeO2-NP [17] was found to limit biofilm growth of S. mutans comparable to CAN and CAS (data not shown). No inhibition was observed with either 1 mM NH4NO3 (AN) or (NH4)2SO4 (AS), the byproducts of ceric ammonium salt hydrolysis. The addition of 4 equivalents of AS to stock solutions containing any of the commercially prepared CeO2-NP (3 nm, 10–20 nm, 30 nm) did not result in increased biofilm inhibition. Further, balancing both the nitrate content and acidity of a CeO2-NP (3nm, Strem) dispersion (with 4M HNO3) to an equivalent amount present in H2[Ce(NO3)6] did not result in a statistically significant increase in biofilm inhibition at 125 μM (Ce).
Figure 1.
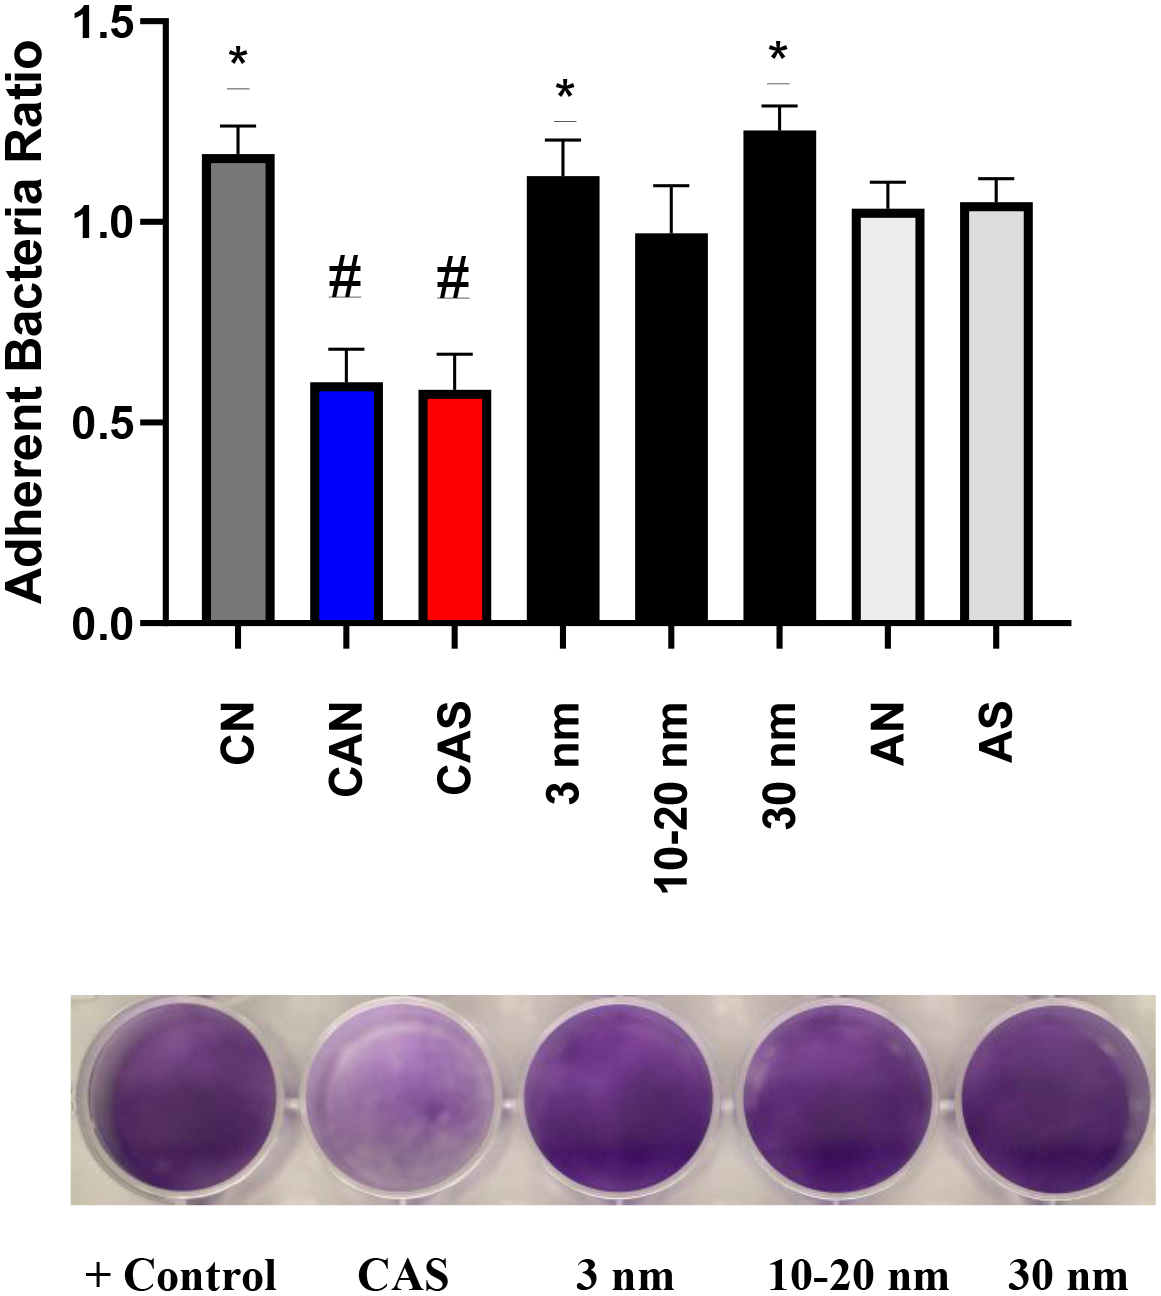
The ratio of adherent bacteria (compared to positive control) from the treatment of S. mutans UA159 with Ce-containing agents (125 μM Ce) [CN = Ce(NO3)3•6H2O] and ammonium salts (AN, AS) (1 mM) BHI, 1% sucrose, 37°C, 5% CO2 for 20 h. *p<0.05, #p<0.0001, student t test.
2.11. Fluorescence Microscopy of Adherent Biofilm
Light microscopy with fluorescent labeling further supported disruption of S. mutans biofilm formation by hydrolyzed Ce(IV) salts. SYPRO™ Ruby Biofilm Matrix Stain (Invitrogen) was used to stain the adherent biofilm post-wash according manufacturers protocol. Reduction in adherent biofilm was observed in the treated wells (250 μM CAS) as compared to the positive control in Figure 2.
Figure 2.
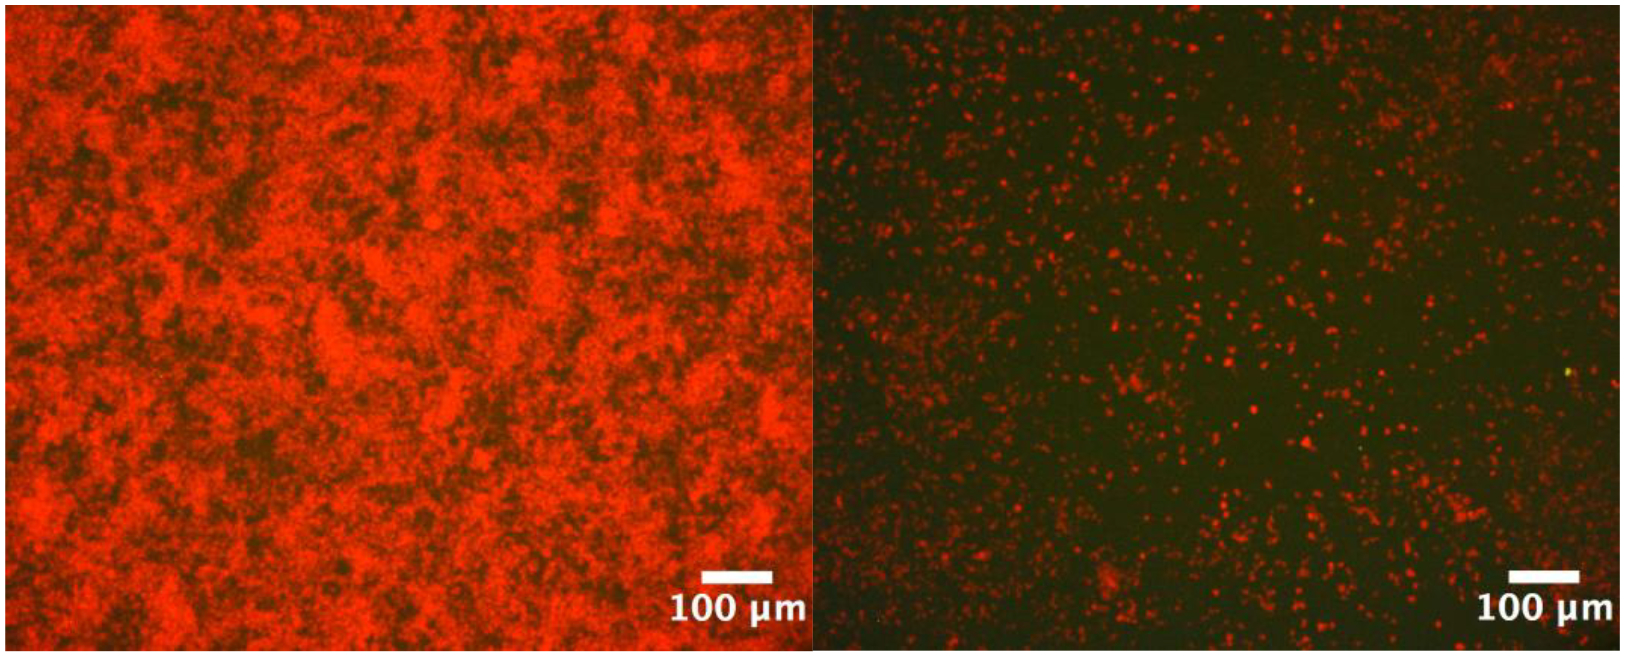
Microscopic images (10 x) of adherent S. mutans UA159 grown for 20 h at 37 °C, 5% CO2 in BHI. The untreated wells (left) displayed significantly more biofilm growth than 250 μM CAS treated wells (right).
2.12. Planktonic Cellular Growth Curve Analysis
The planktonic growth of S. mutans in BHI (37°C, 5% CO2) was measured in 30 min intervals in the presence of 500 μM CAN and CAS over 10 h (See Figure 3). Figure 3 shows that 500 μM CAS had a minimal effect on the planktonic growth of S. mutans, while CAN had a lagging effect on the planktonic growth rate that becomes comparable with the positive control over several h. The concentration of CAN and CAS in this assay was 500 μM, approximately four-fold the concentration utilized in the initial screening assay in the same growth media (BHI). Thus, the significant reduction in adherent bacteria observed in the initial screening assay (Figure 1) is attributed to non-bactericidal mechanism(s).
Figure 3.
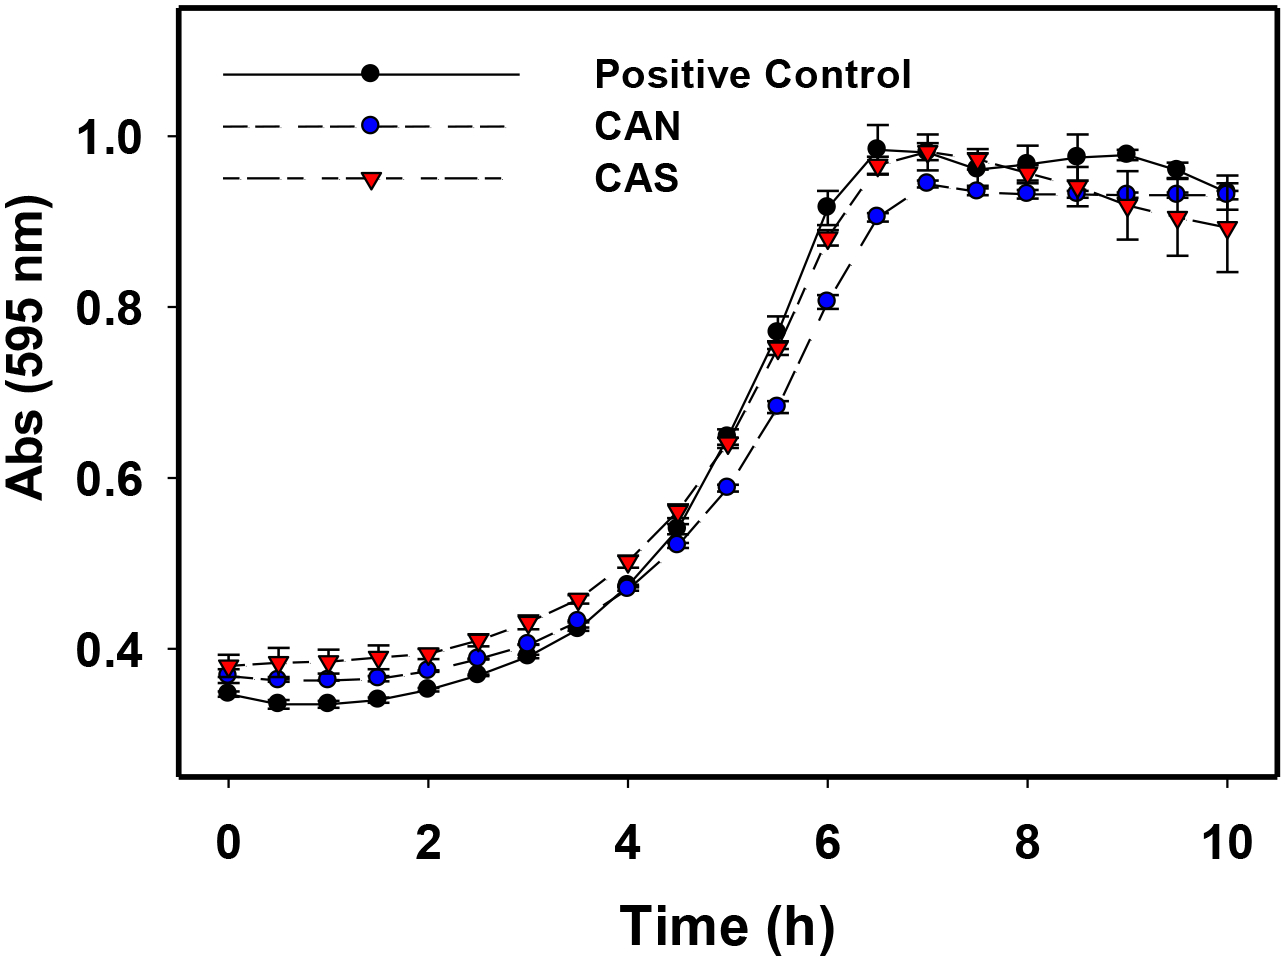
Planktonic growth curves of S. mutans UA159 with 500 μM CAN and CAS treated cells in BHI at 37°C and 5% CO2 for 10 h. Measurements were run in triplicate. Error bars represent standard deviation of the triplicate measurements.
2.13. Dose Dependence Adherent Bacteria Reduction (IC50 determination)
A dose response curve was developed quantifying the effects of varying concentrations (0 – 1 mM) of CAN on the adherent cells of S. mutans grown under similar conditions utilized in the initial screening assay (37 °C, 5% CO2, 1% sucrose) (See Supplemental Data, Figure S1). The IC50 value for reduction in adherent bacteria is 137 μM (± 24 μM) CAN. This demonstrates that the reduction in adherent cells under the initial phase of biofilm growth is directly proportional to the concentration of CAN present.
2.14. Bacterial Cell Viability Assay
The above results prompted further studies on the effects of higher concentrations of hydrolyzed Ce(IV) salts (1 mM) on the planktonic growth of two different and related bacteria that reside in the human oral cavity. S. mutans and S. sobrinus 6175 were exposed to 1 mM CAN, CAS or AgNO3 in BHI growth media and allowed to grow 20 h (See Table I) under similar conditions (no sucrose added) of the initial screening assay. Visible turbidity (++) was noticeable in all wells containing either 1 mM CAN or CAS after 20 h. In contrast, wells containing 1 mM AgNO3 showed no visible signs (--) of growth. The results demonstrate that both CAN and CAS do not inhibit S. mutans or S. sobrinus growth at 1 mM (Ce) in BHI, nearly eight times the concentration utilized in the initial screening assay.
Table 1.
Planktonic Cell Viability Assay with 1 mM Metal Ion
| BHI, 37 °C, 5% CO2, 20 h | OD600 | CAN | CAS | AgNO3 |
|---|---|---|---|---|
| S. mutans | 0.010 | ++ | ++ | −− |
| S. sobrinus | 0.010 | ++ | ++ | −− |
2.15. Biofilm Dispersal Assay
Biofilm dispersal assays [21] were carried out to investigate if hydrolyzed Ce(IV) salts can disrupt the immature biofilm matrix produced by S. mutans. The use of 500 μM CAS as a dispersal agent resulted in a non-statistically significant reduction of adherent bacteria compared to the positive control. The dispersal assay was carried out with a CAS concentration four times that utilized in the initial screening assay described above. Non-targeted chemical disruption of the biomolecular components of the biofilm matrix by CAS as a mechanism of adherent cell reduction is unlikely, as a significant dispersal rate would have been achieved in this experiment. Instead, it is likely the hydrolyzed Ce(IV) salts target specific cellular events or biomolecules critical to the initial phases of biofilm formation.
2.16. Sucrose Metabolism Assay (Acid Production)
CeO2-NP exhibit enzymatic activity based upon their surface oxidation state(s) and size when present in the media of interest [22]. Sucrose is a both a building block for the synthesis of extracellular polysaccharides and an energy source for S. mutans. A sucrose metabolism assay was carried out to test if the hydrolyzed Ce(IV) salts irreversibly modify sucrose in complex growth media so as to prevent its metabolism. Phenol Red Broth Base media was chosen both to limit media acidification due to the metabolism of other manufacturer added carbohydrates [23] as well as to mimic the properties of the BHI. At both 5 and 20 h incubation, a similar media acidification was observed (See Supplemental Data, Table S1) among the positive control and the Ce(IV) treated media. It is unlikely that the hydrolyzed Ce(IV) salts are irreversibly modifying sucrose to limit its metabolism in growth media.
2.17. Human Cell Proliferation Assays
A human cell proliferation assay (24 h) was carried out testing the effects of hydrolyzed Ce(IV) salts and AgNO3 (0 −1 mM) on the metabolic activity of oral derived human cells, TIGK and HGF. AgNO3 was used as the standard of clinical comparison, as it is utilized as a tooth-applied caries arresting agent. Similar metal ion concentrations of both CAN and CAS had less overall effect on the metabolic activity of TIGKs and HGFs as compared to AgNO3. As shown in Figure 4, treatment of both human cell populations with equimolar doses of AgNO3 was consistent with statistically more cytotoxicity as compared to equivalent doses of hydrolyzed Ce(IV) salts CAN and CAS. It should be noted that intraoral application of Ag-containing agents are often applied at significantly higher concentrations than shown below.
Figure 4.
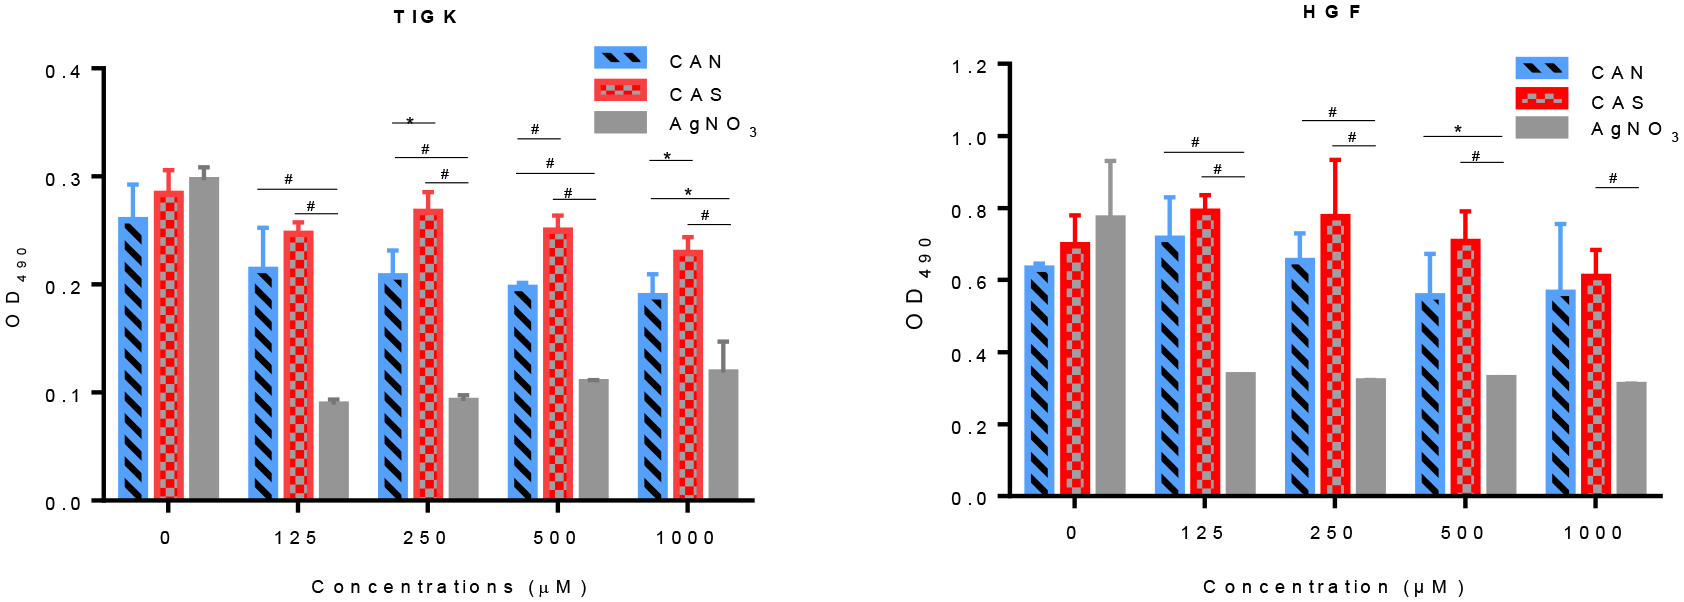
MTS cell proliferation assays utilizing (left) TIGK and (right) HGF in the presence of hydrolyzed CAN (red), CAS (blue) and AgNO3 (gray) for 24 h at 37°C, 5% CO2. *p<0.05, #p<0.01, t test.
2.18. Dynamic Light Scattering (DLS) Studies
The hydrolysis of CAN or [Ce(NO3)6]2- yields an acidic solution with six equivalents of NO3− per one equivalent of Ce (See Equation I). Raising the pH of CeO2-NP obtained from Ce(IV) hydrolysis to remove adsorbed NO3− leads to aggregation and precipitation [17, 19]. A 5 mM solution of [Ce(NO3)6]2- (or CAN) produces 30 mM NO3− upon hydrolysis, which must be accounted for in the DLS analysis. The commercially available CeO2-NP screened for biological activity have zero (or limited) NO3− present in the dispersion. Thus, the commercially supplied CeO2-NP dispersions were diluted to a concentration of 5 mM Ce and 30 mM KNO3 to provide a consistent NO3− containing media for all species tested (See Supplemental Data, Figures S2 A–E) with little change to the existing pH found upon simple dilution.
| Equation I |
Both CAN and [Ce(NO3)6]2- (with 30 mM NO3−) had average peak hydrodynamic diameters of approximately 9–10 nm (See Supplemental Data, Figures S2 A–B). CeO2-NP’s prepared from Ce(IV) hydrolysis (e.g. [Ce(NO3)6]2-) had a narrowed intensity distribution compared to commercially available CeO2-NP of similar size (3 nm, Strem) in 30 mM KNO3 (See Figure 5). Figure 6 illustrates the effect of a more strongly coordinating media (+ 40 mM KCl) on the hydrodynamic diameter and distribution of [(Ce(NO3)6]2- vs CeO2-NP (3 nm, Strem) in acidic media (See Figure 6). At pH 7.4 (50 mM KH2HPO4) CeO2-NP prepared from the hydrolysis of [(Ce(NO3)6]2- aggregate to form a monodispersed distribution (Figure 7) with limited stability over several h. Under the same pH conditions, CeO2-NP (3nm, Strem) fails to from an interpretable dispersion. It should be noted the average pH of the BHI (growth media) utilized in the cell based experiments is approximately 7.4.
Figure 5.
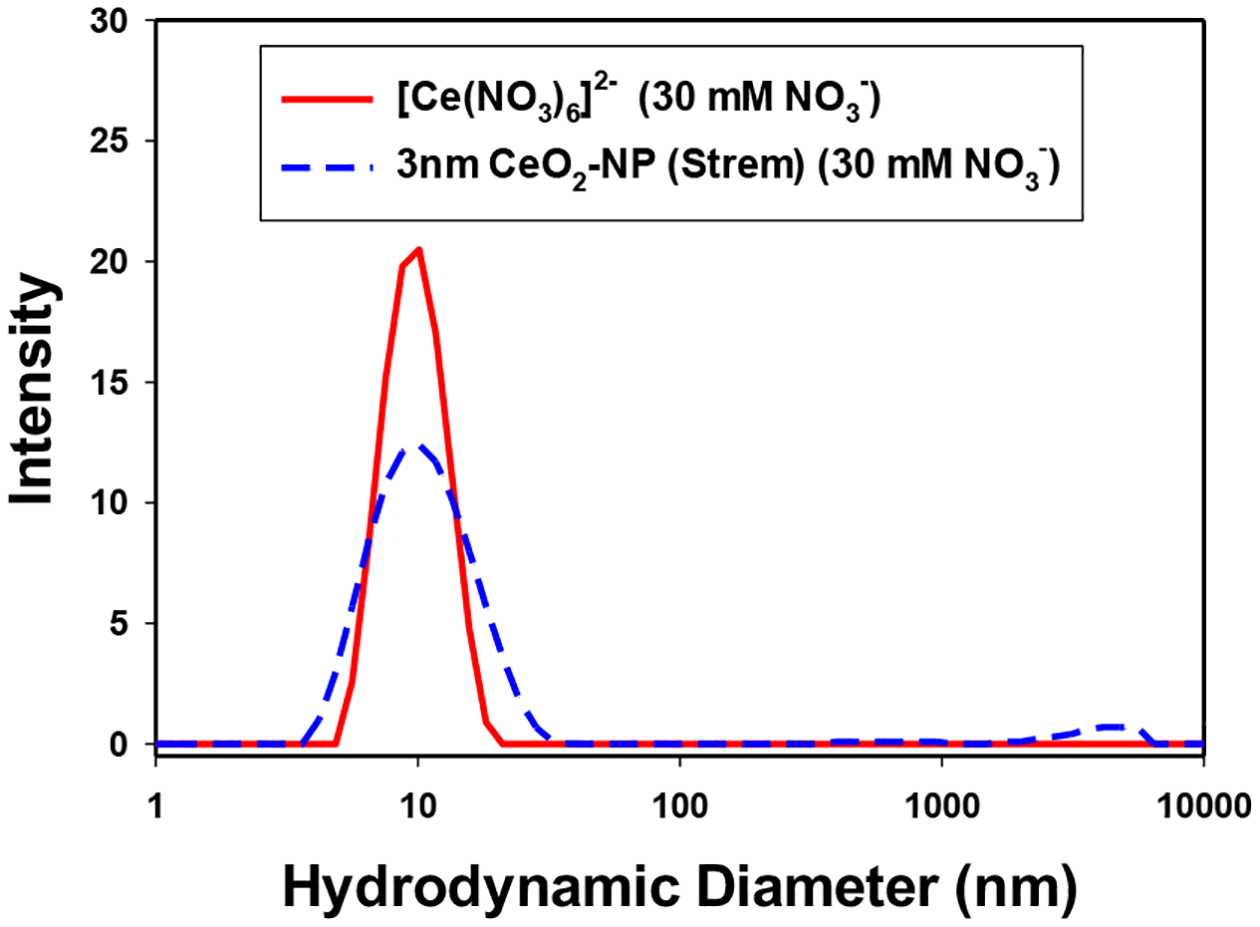
Distribution of hydrolyzed [Ce(NO3)6]2- (pH 1.8) and CeO2-NP (3 nm, Strem) (pH 4.5) in 30 mM NO3−.
Figure 6.
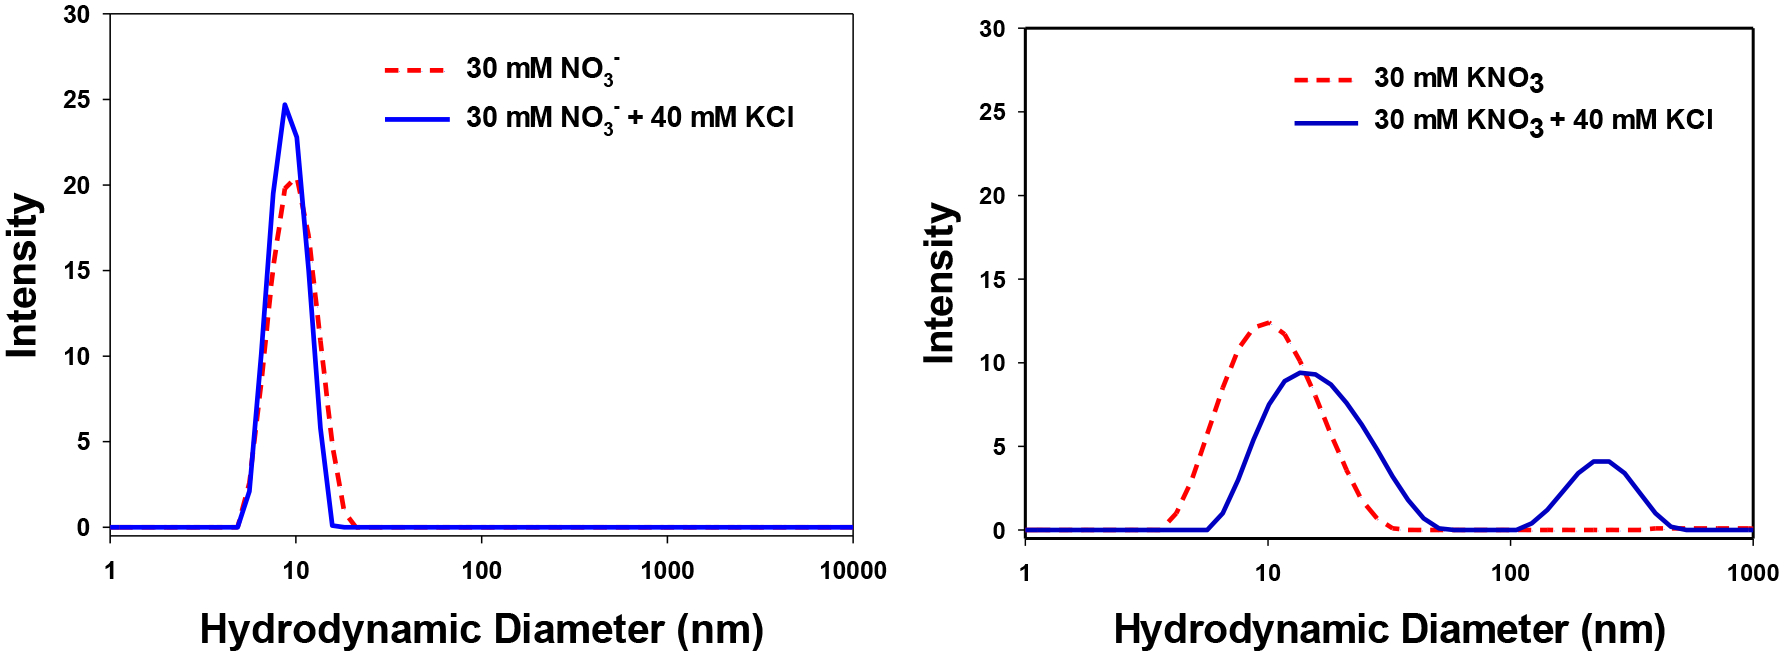
Distribution of (left) 5 mM [Ce(NO3)6]2- (pH 1.8) and (right) 5 mM CeO2-NP (3 nm, Strem) (pH 4.5) in 30 mM NO3− and with 40 mM KCl.
Figure 7.
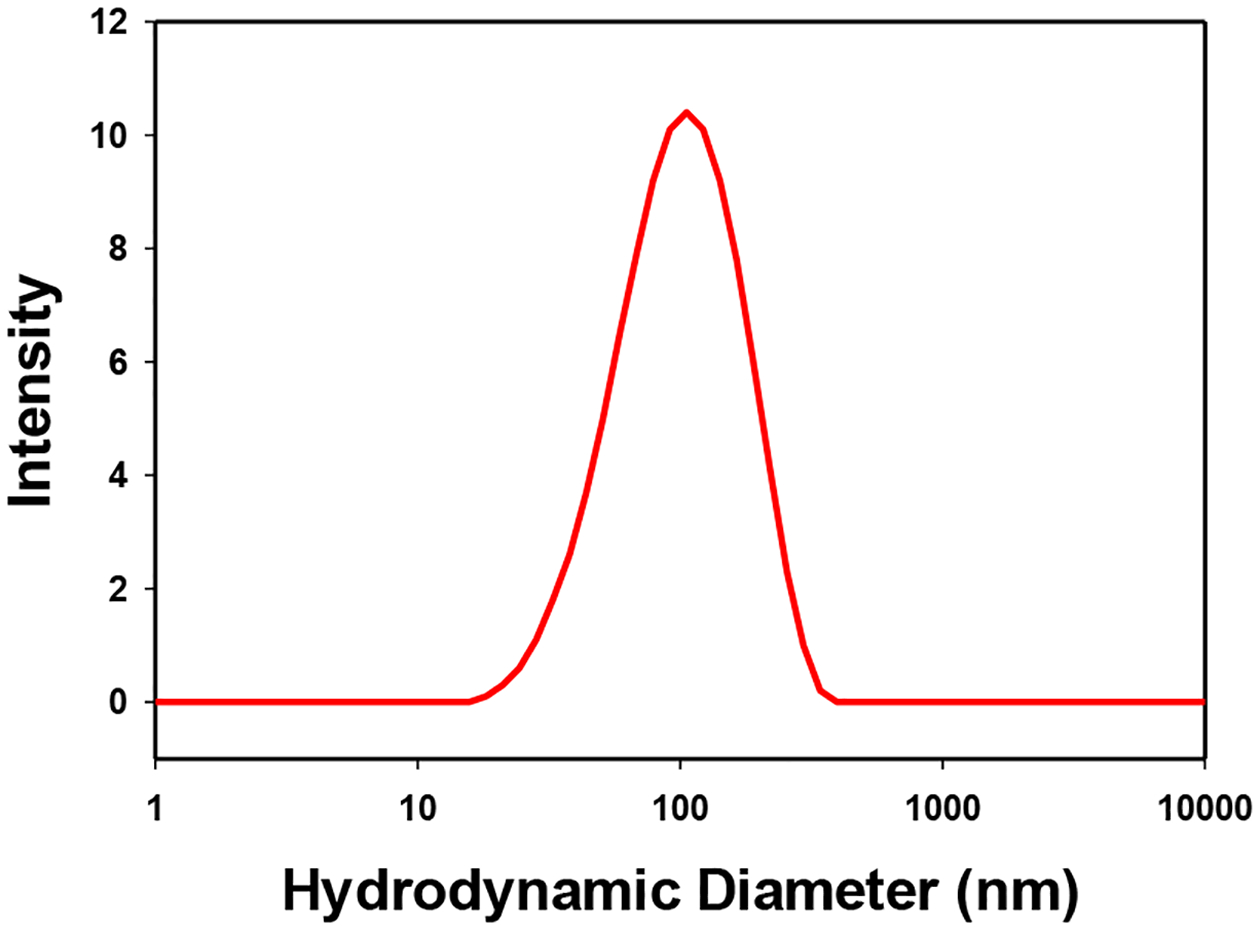
Distribution of hydrolyzed [Ce(NO3)6]2- (500 μM Ce) in 50 mM KH2PO4 (pH 7.4)
2.19. Scanning Transmission Electron Microscopy (STEM) and Electron Energy-Loss Spectroscopy (EELS)
CeO2-NP prepared by [Ce(NO3)6]2- hydrolysis and “bare” CeO2-NP (3 nm, Strem) were encapsulated in graphene liquid cells [24] for STEM high-angle annular dark-field (HAADF) imaging and EELS analysis. The low-magnification HAADF images of hydrolyzed [Ce(NO3)6]2- and CeO2-NP (3nm, Strem) are shown in Figures 8a–b, respectively. We find that compared with CeO2-NP (3nm, Strem), CeO2-NP prepared by [Ce(NO3)6]2- hydrolysis tend to aggregate more, even after the samples are diluted significantly during the sample preparation process. Atomic-resolution HAADF images of the aggregated CeO2-NP are shown as insert in Figure 8a–b. The lattice fringes of the CeO2 nanoparticles can be clearly seen, indicating that the CeO2-NP are fully crystalline. We do not observe any amorphous surface layer in either sample tested. Detailed analysis of many HAADF images reveal that the particle size in both samples is 3.5 nm on average, with a very narrow particle size distribution. To confirm the oxidation state of aqueous dispersed CeO2-NP, we performed EELS on CeO2-NP encapsulated within the graphene liquid cells. Specifically, we have used the Ce M-edges to determine the Ce valence state. The Ce M-edge splits into two prominent peaks, the M5 and the M4 edges due to spin-orbit coupling of the initial states. Previous reports of Ce valence state analysis using EELS have found that the Ce M5/M4 ratio closely tracks with the Ce oxidation state, where the M4 peak shows a higher intensity than the M5 peak for Ce(IV), while the M4 peak is lower in intensity than the M5 peak in Ce(III) [24, 25]. The Ce M-edge spectra for both samples are shown in Figure 1c) and d) showing a higher intensity of the M4 peak, corresponding to a Ce(IV) (i.e. fully stoichiometric CeO2). We need to point out that for CeO2-NP not dispersed in solution, but rather exposed to the vacuum of the transmission electron microscopy (TEM) column, we find that the valence state is reduced to Ce(III), as expected for particles with an average size of 3.5 nm [25]
Figure 8.
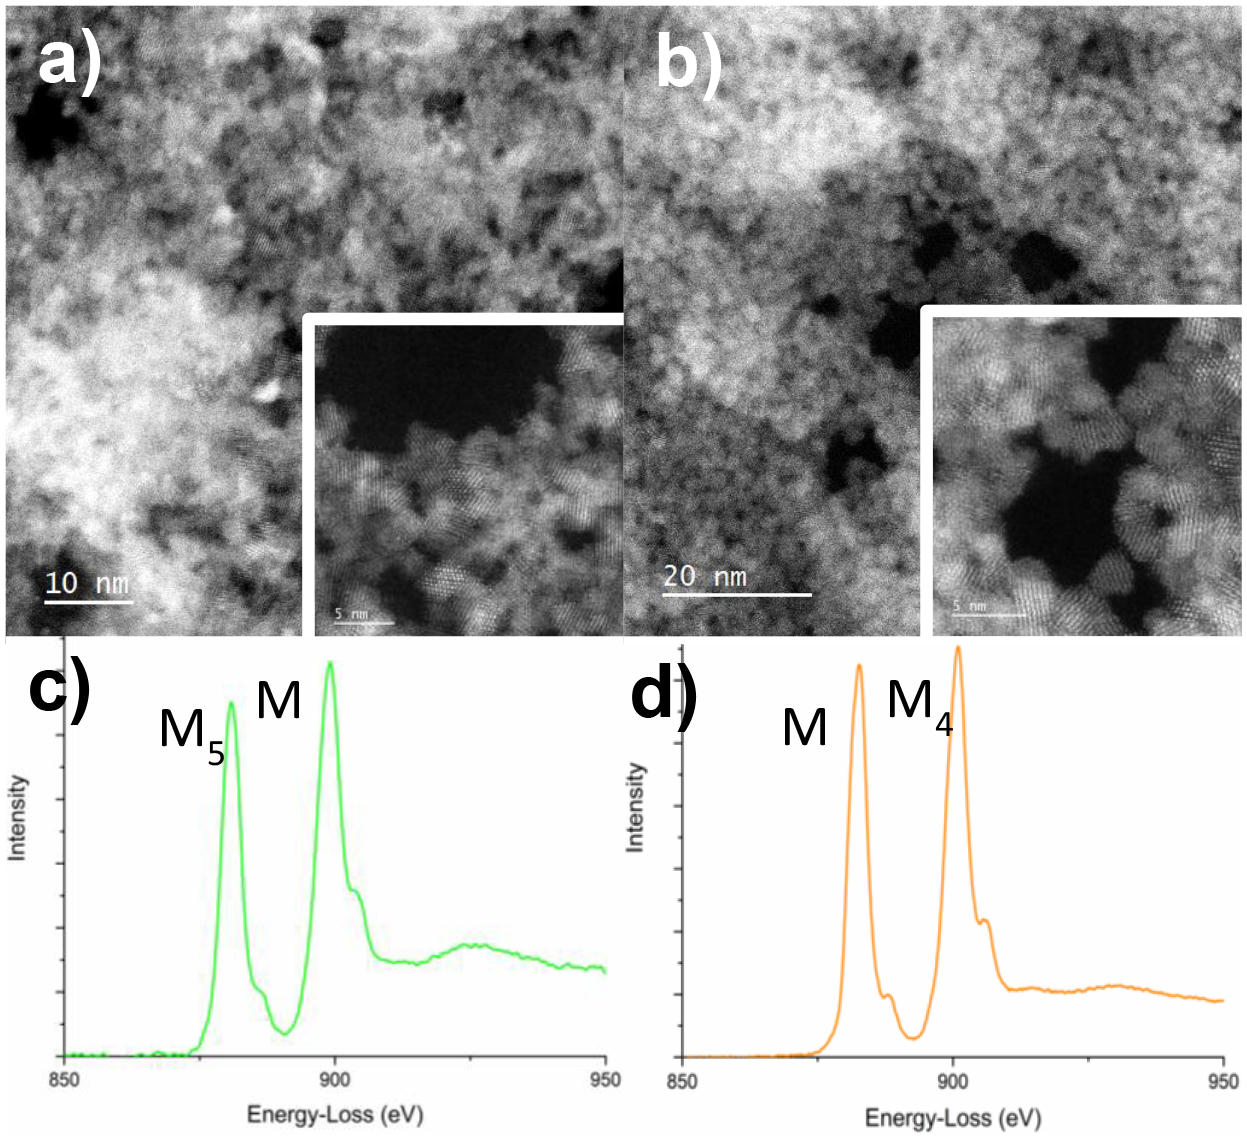
Low-magnification high-angle annular dark field (HAADF) of (a) hydrolyzed [Ce(NO3)6]2- and (b) CeO2-NP (3nm, Strem) in graphene liquid cells. Inserts show high-resolution images of the nano-particles revealing lattice fringes. Electron energy-loss spectroscopy (EELS) of the Ce M-edges for (c) hydrolyzed [Ce(NO3)6]2- and (d) CeO2-NP (3nm, Strem) in graphene liquid cells, showing the M4/M5 ratio expected for a Ce(IV) valence state.
2.20. CeO2-NP Surface Properties and Biological Activity
The most suitable comparison between CeO2-NP utilized in this study is between hydrolyzed [Ce(NO3)6]2- and CeO2-NP (3nm, Strem) due to the equivalent size (avg 3.5 nm), predominately Ce(IV) oxidation state and absence of ammonium ions. Hydrolyzed [Ce(NO3)6]2- are more stable at both higher ionic strength and as an aggregate at pH (7.4) compared to CeO2-NP (3 nm, Strem). This underscores the idea that differential surface reactivity and aggregation properties exists between the two species of CeO2-NP. This is likely brought about by the different synthetic methodology, specifically, the use of a high valent Lewis acid salt as a starting material with no further manipulation yielding strongly acidic media, excess absorbable anions and a high surface area. [17]. It is likely the enhanced in vitro biofilm inhibiting capacity observed with hydrolyzed Ce(IV) salts reflects their differential surface reactivity and/or stability towards the biomolecular components of the growth media. This includes the potential for variable release and/or reduction of Ce(IV) ions on the CeO2-NP surface [10]. It has been previously observed that the protein (or biomolecular) corona on the surface of metal oxide NPs has a significant influence on the resultant biological activity [26, 27]. In the present study, it was found that rigorous mixing of hydrolyzed Ce(IV) salts in the growth media prior to initiation of adherent bacteria assays reduced their inhibitory activity - supporting a significant role of both surface reactivity and the protein corona on the observed biological activity. This study sets forth that the mechanism of biofilm inhibition by hydrolyzed Ce(IV) salts is non-bactericidal at the concentrations tested and likely targets the initial phases critical to biofilm formation. Further, the mechanism of inhibition does not support irreversible reactivity of CeO2-NP with sucrose or non-targeted chemical disruption of the macromolecular components of the extracellular matrix as the predominate mode of biofilm inhibition. Current studies are underway to investigate not only the chemical reactivity with biological media components but also a relevant biological mechanism of activity.
3. CONCLUSIONS
CeO2-NP of variable size and synthetic methodology were screened for the in vitro reduction of adherent S. mutans biofilm formation in complex growth media. While commercially available “bare” CeO2-NP were ineffective at reducing adherent cells at the concentrations tested, hydrolyzed Ce(IV) salts prepared in strongly acidic media were active as in vitro biofilm inhibitors (IC50 = 137 μM). The inhibition likely takes place in the initial phases of biofilm formation and under a non-bactericidal mechanism. Differences in biofilm inhibition between hydrolyzed Ce(IV) salts and commercially prepared CeO2-NP of similar size (3.5 nm), distribution and oxidation state [Ce(IV)] are not attributed directly to the storage solution acidity, exogenous ions (e.g., NH4, NO3−, etc.) or cytotoxicity. Further mechanistic studies are underway focusing on both the chemical and biological aspects of biofilm inhibition of S. mutans and related species.
4. MATERIALS AND METHODS
All chemical reagents were purchased commercially and utilized without further purification. Ultrapure Milli-Q® water was used to prepare all samples for Dynamic Light Scattering (DLS), TEM data collection and UV-Vis Spectroscopy. Ceric ammonium nitrate hexahydrate (99.9%) (CAN) was purchased from Sigma-Aldrich, ceric ammonium sulfate dihydrate (98%) (CAS) was purchased from Acros and Ce(NO3)3•6H2O (99.5%) was purchased from Alfa Aesar. Ceric nitrate (1.0 N aqueous solution) was purchased from GFS Chemicals (Columbus, Ohio). Commercially available “bare” cerium oxide nanoparticles (CeO2-NP) were purchased and stored as the following colloidal dispersions: (1) Strem Chemicals (Newbury MA), 3nm diameter (DLS) CeO2-NP, stored as an acidic dispersion at pH 3.5 ± 0.75, (2) Alfa Aesar (Ward Hill, MA) 10–20 nm diameter (DLS) CeO2-NP (20%), stored as an acidic dispersion at pH 1.5 with 0.2 mol NO3 per mole, and (3) Alfa Aesar, 30 nm diameter (APS) CeO2-NP (15%). AgNO3 and NH4NO3 were purchased from Ward’s Science and KNO3, KCl and (NH4)2SO4 were purchased from Fisher Scientific. Disposable BrandTech PMMA cuvettes (Cole-Parmer, Vernon Hills, IL) were used for Dynamic Light Scattering (DLS) measurements. Bacterial cultures were prepared from frozen glycerol stocks of each species of Streptococcus mutans (UA159) Streptococcus sobrinus (6175) in either sterilized Brain Heart Infusion (BHI) growth media (Criterion) or Phenol Red Broth Base (Sigma-Aldrich). All pH measurements were carried out on a Mettler Toledo FE20 benchtop pH meter following acidic and neutral pH calibration.
4.10. Hydrolysis/Dilution of Ce(IV) Salts
CeO2-NP from Ceric Ammonium Nitrate. Following a similar preparation reported by Pettinger et. al. [19], ceric ammonium nitrate hexahydrate (Aldrich, 13.7 mgs) (CAN) was dissolved in 5.0 mL of deionized water at room temperature (rt) with gentle mixing for 20 s to afford a 5 mM (Ce) stock solution. The faint-orange colored solution faded within min to yield a clear dispersion. The UV-Vis absorption spectrum of CAN (NanoDrop™ 2000/2000c, Thermo Fisher) in H2O (150 μM Ce) was in agreement with the literature, with a well-defined shoulder peak at 290 nm that intensifies significantly upon standing in solution over several h and an intense peak at approximately 230 nm is attributed to the absorption of NO3− [19]. (See Supplemental Data, Figure S3)
CeO2-NP from Ceric Ammonium Sulfate. A 5 mM (Ce) stock solution of ceric ammonium sulfate dihydrate (CAS) was prepared by dissolving CAS (15.8 mgs) in 5.0 mLs of deionized (DI) water at rt with gentle mixing for 20 s to produce an acidic dispersion of CeO2-NP. The yellow tinted color faded within s to produce a clear dispersion. The UV-Vis absorption spectrum of CAS in H2O (150 μM Ce) lacked a well-defined peak at 290 nm (and 230 nm) previously observed with CAN. Instead, a broadened peak with an absorption maximum at 275 nm was observed. (See Supplemental Data, Figure S3).
CeO2-NP from Ceric Nitrate. A 5 mM (Ce) stock solution of ceric nitrate (H2[Ce(NO3)6]) was prepared by diluting a 1.0 N solution of H2[Ce(NO3)6] (25μL) to 5.0 mL with 4.975 mL of DI water at rt with gentle mixing to produce an acidic dispersion of CeO2-NP [17]. The deep yellow color faded over several min to produce a clear, acidic dispersion of CeO2-NP.
4.11. Dynamic light scattering (DLS)
All size vs intensity data was collected at the UIC Nanotechnology Core Facility (NCF) utilizing a Malvern Zetasizer ZSP. The hydrodynamic diameter of each Ce-containing sample was collected as a function of intensity weighted distribution in a 30 mM NO3− buffer prepared in Milli-Q® water (18.2 MΩ). CAN and H2[Ce(NO3)6] were dissolved in Milli-Q® water to yield solutions containing 5 mM Ce and 30 mM NO3−. Commercially “bare” dispersions of CeO2-NP were diluted with 30 mM KNO3 solutions. This step was carried out to provide a consistent level of NO3− in each Ce-containing sample for DLS analysis. Both CAN and H2[Ce(NO3)6] yield six moles of NO3− present per each mole of Ce(IV) present, while commercially available, “bare” CeO2-NP (Strem, Alfa Aesar) have zero (or small amounts) NO3− present. Following standing at rt for 30–40 min, each Ce-containing sample was then vortexed for 2 min before being transferred into a polymethylmethacrylate (PMMA) disposable cuvette for an initial analysis (Supplemental Data, Figures S2A–E). Additionally, a solution of KCl was added to stock solutions of H2[Ce(NO3)6] and CeO2-NP (3 nm, Strem) in 30 mM NO3− to afford a higher ionic strength buffer with stronger coordinating ligands (40 mM KCl) (Figure 6). All size measurements were carried out with a minimum of 12 replicates and reported as an average intensity weighted distribution utilizing a 633 nm laser and a backscattering angle of 173°.
4.12. High Resolution Transmission Electron Microscopy (HR-TEM), STEM and EELS
HR-TEM images were recorded by a JEOL JEM-3010 microscope (operating at 300 kV) equipped with a Gatan Orius CCD camera for imaging and a Thermal-Noran XEDS detector. Solutions of CAN and CAS (5 mM) were dissolved in Ultrapure Milli-Q water, vortexed gently and allowed to stand approximately 20 h at rt prior to recording images. Dispersions were then further diluted 5-fold and to a concentration of approximately 1 mM Ce and pipetted (3–5 μL) onto a 400 Cu square mesh holey carbon TEM grid (21, 22). Excess water from the grid was wicked away and then dried in a vacuum desiccator for a minimum of 30 min prior to HR-TEM image collection (See Supplemental Data, Figures S4–S5). The atomic resolution Z-contrast images and EELS maps were collected using the JEOL ARM200CF aberration corrected STEM with a cold-field emission gun operated at an acceleration voltage of 80 kV. The HAADF images were acquired using an annular dark-field detector with a collection angle ranging from 90 to 175 mrad. The probe convergence semi-angle was set to 29 mrad, which yields a probe size of 1 Å at 80 kV and a probe current of 62 pA. EELS characterization was conducted using the post-column Gatan Continuum GIF spectrometers. Samples were encapsulated in graphene liquid cells with aqueous media as previously reported [28–31]. H2[Ce(NO3)6] and CeO2-NP (3 nm, Strem) samples were diluted to 5 mM (Ce) in Ultrapure Milli-Q water and stored at cold temperature prior to encapsulation.
4.13. In vitro Adherent Bacteria Assay
An overnight culture of S. mutans UA159 was diluted and grown to mid exponential growth phase (OD600= 0.5–0.6) in Brain Heart Infusion (BHI) growth media. The cells were diluted 40-fold into a BHI/1% sucrose solution and transferred to a 96-well, tissue cultured, polystyrene (PS) microtiter plate. The wells of the microtiter plate were inoculated with freshly diluted BHI containing S. mutans and 1% sucrose and each appropriate stock solution to afford either 125 μM Ce containing agents or 1 mM NH4NO3/(NH4)2SO4 to a total volume of 200 μL in each well. All stock solutions were prepared (hydrolyzed or diluted) within 30 min of addition to each microtiter plate. The wells were mixed gently with a microchannel pipette following addition of each agent. Both experimental and control wells were set up with six replicates. The microtiter plate was then placed in an incubator under the following conditions: 37°C, 5% CO2 for 20 h in the absence of light. Following the 20 h incubation time, the plates were gently submerged in a water bath 3–4 times to remove excess non-adherent cells and cellular debris. Each well was then stained with 200 μL of 0.1% crystal violet (CV) stain for approximately 30 min at 37°C. The microtiter plate was then gently re-submerged (washed) in a deionized water bath, to remove excess dye and dry for a minimum of 24 h. The dyed contents of each well were re-dissolved in 33% acetic acid with repeated mixing and diluted with DI water. The absorbance of each well at 570 nm (ABS570) was then recorded with a Victor3v plate reader, and the average absorbance of the six replicates were recorded. The ratio of the adherent bacteria present in the test wells vs. the positive control was determined by Equation II and plotted in Figure 1 as the mean ± SD. Note negative control absorbances at 570 nm were subtracted from each positive control and test well value.
| Equation II |
4.14. Fluorescence Microscopy of Adherent Biofilm
Lab-Tek® Chamber slide (8-well Permacol® Slide) was inoculated with S. mutans (BHI, 1% sucrose) in a manner similar as described above. The wells were run in duplicate, incorporating positive and negative controls, as well as 125μM and 250 μM CAS treated wells at a volume of 400μL. After 20 h of incubation at 37°C, 5% CO2, the chamber slide was rinsed gently with sterilized, deionized water to remove nonadherent cellular debris. Each well was then stained with 400 μL FilmTracer ™ SYPRO® Ruby Biofilm matrix stain according to the manufacturer’s protocol. The chamber slide was then rinsed gently, and the chamber components were removed to allow visualization of the microscopic slide. 30 μL of sterilized water was added to each well and then a coverslip was placed. The slide was then viewed under a Nikon Eclipse E600 microscope at 10x magnification utilizing a TRITC emission filter.
4.15. Dose Dependence Reduction in Adherent Bacteria (IC50 determination)
The same protocol for the culturing S. mutans UA159, dilutions and inoculation of a 96-well microtiter PS plate was followed as described above. A 5 mM stock solution of CAN was freshly prepared within 30 min of addition to the PS plate. The final volume of each well (test and controls) was 200 μL. Both test wells and controls were run with six replicates. The loaded microtiter plate was placed in an incubator at 37 °C, 5% CO2 for 20 h in the absence of light. The same workup described above for removing non-adherent cells/debris, staining with 0.1% CV, quantification of retained CV stain on the Victor3v plate (ABS570) was followed. The adherent bacteria reduction was determined by Equation III and plotted in Figure S1 as the mean ± SD. The positive control was taken as the zero value for adherent bacteria reduction. Note negative control absorbances at 570 nm were subtracted from each positive control and test well value.
| Equation III |
4.16. Bacterial Cell Viability Assay
A similar protocol for overnight culturing of S. mutans UA159 was also employed for S. sobrinus 6175. Each culture was separately grown to mid log phase and diluted 40-fold similarly to above. S. mutans and S. sobrinus and were then exposed to 1 mM CAN, CAS or AgNO3 from pre-dissolved 5 mM (metal ion) solutions and diluted accordingly into a 24 well PS plate. The plate was allowed to stand for 20 h at 37°C, 5% CO2. Well turbidity was judged visually and designated with a positive sign (++).
4.17. Sucrose Metabolism Assay
A similar protocol for overnight culturing of S. mutans UA159 in BHI, and growing to mid log phase was followed as described earlier. A 4 mL culture was centrifuged down to a pellet at 4000 G (10 min). To the pellet was added 4 mL of PBS solution, vortexed for 30 s, and re-centrifuged for 10 min (4000G). The wash cycle was repeated 3x to rid the sample additional carbohydrates from BHI. Following the washing steps, the cell pellet was re-suspended in PBS to a final OD600 of 0.4. To a 45 mL of sterilized Phenol Red media was added the above PBS stock culture of S mutans (40 fold dilution). Each autoclaved borosilicate glass tube (13 × 100 mm) was loaded with 2.85 mL of Phenol Red media (with or without 1% sucrose), 0.150 mL CAN, 0.150 mL CAS or 0.150 mL of DI water for the positive control to total a 5.0 mL solutions in each tube. The media was allowed to grow for 20 h at 37°C and 5% CO2. Media acidity measurements were taken at 5 and 20 h. At each measurement, 1 mL of media broth was removed, diluted with 1 mL of DI water and the pH was recorded with a Mettler Toledo FE20 benchtop pH meter. The average pH of the triplicate measurement are reported in Table S1 (See Supplemental Data).
4.18. Biofilm Dispersal Assay
The same protocol for the culturing S. mutans UA159, dilution(s) and inoculation of a 96-well microtiter PS plate was followed as described above. The positive control and test wells were prepared with a final volume of 200 μL (BHI + cells) and the negative control was prepared with only 200 μL BHI. The loaded microtiter plate was placed in an incubator at 37 °C, 5% CO2 for 6 h in the absence of light. After 6 h, the planktonic cells were removed, the adherent biofilm rinsed (0.9% NaCl) and replaced with fresh 200μL BHI (controls) or BHI/500 μM CAS (test wells). The same workup described above was used for removing non-adherent cells/debris, staining with 0.1% CV, quantification of retained CV on the Victor3v plate reader (ABS570) and calculation of adherent bacteria reduction (Equation III). Note negative control absorbances at 570 nm were subtracted from each positive control and test well value.
4.19. Bacterial Cell Growth Curve
A similar protocol for the culturing of S. mutans UA159, dilutions and inoculation of a 96-well microtiter PS plate was followed as described above. Test agents included 500 μM CAN and CAS and all test wells, positive and negative controls were run in triplicate. The OD600 of each well was recorded every 30 min for 10 h on a Victor3v plate reader. The average OD600 for each of the three triplicate runs (with standard deviation) was reported.
4.20. Human Cell Proliferation Assays
3000 human telomerase immortalized gingival keratinocytes (TIGK, ATCC, Manassas, VA)/well were seeded in a 96-well plate in a culture medium (DermaLife K Medium Complete Kit, Lifeline Cell Technology) without the use of antibiotics. Two hours later, 10 mM stock solutions of CAN, CAS and AgNO3 filtered through a 0.450 μM filter were used to deliver concentrations ranging from 125–1000 μM in the wells containing the cells were incubated for further 24 hours. Cells were cultured in an incubator at 37°C in 5% CO2 environment. Cells without the addition of any metal ions was used as the baseline control. Each treatment condition had three replicates. A cell proliferation assay was performed using CellTiter 96® Aqueous Non-Radioactive Cell Proliferation Assay kit (Promega, Madison, WI) per manufacturer’s instructions. OD490 was read using a spectrophotometer (SPECTRAmax Plus, Molecular Devices, San Jose, CA). A similar human cell proliferation assay utilizing the same metal containing solutions was carried out with primary human gingival fibroblasts (HGF, ATCC, Manassas, VA) cultured in a DMEM (ThermoFisher, Scientific, Catalog No. 11965) with 10% FBS.
5. Data Analysis
DLS, planktonic growth and dose dependent adherent bacteria reduction curves (IC50) were plotted on SigmaPlot (Systat Software Inc, San Jose, CA). All data utilizing bacteria were expressed as the mean ± SD. The curve generated from the dose dependent adherent bacteria reduction assay was fit to the Hill equation (3-parameter) to arrive at the reported IC50 value. Adherent bacteria and human cell proliferation data are expressed as means ± SD and plotted on GraphPad (GraphPad Software Inc., San Diego, CA). The student t test (two way) analysis of all test substances were performed using GraphPad Prism software where p values < 0.05 were considered statistically significant.
Supplementary Material
7. Acknowledgements
We would like to thank the Electron Microscopy Service and the Nanotechnology Core Facility (Research Resources Center, UIC) for use of instrumentation required to complete this study. We also would like to thank Dr. Michael Johnson (UIC), Dr. Michael Federle (UIC) and Dr. Jeffrey Banas (University of Iowa) for comments regarding the preparation of this manuscript. We would like to thank Dr. Joanne Burdette (UIC) for allowing use of the Nikon Light Microscope in her laboratory and Dr. Luisa A. DiPietro (UIC) for allowing use of her laboratory for human cell toxicity studies. Also, we would like to thank Dr. Fengyuan Shi (UIC) for her assistance in collecting and interpreting HR-TEM images presented in this manuscript and Dr. Jordi Cabana for helpful discussion regarding the physical characterization of CeO2-NP. Finally, we would also like to thank Dr. Michael Federle for providing frozen glycerol stocks of S. mutans UA159 and S. sobrinus 6175. This work was supported by NIH/NIDCR Grants T32 DE018381 and 1K08DE028009-01A1 as well as the UIC Chancellor’s Research Initiative Fund. The acquisition of the UIC JEOL JEM-ARM200CF was supported by the NSF MRI-R2 grant (No. DMR-0959470), and the acquisition of the Gatan Continuum spectrometer was supported by a grant from the National Science Foundation MRI Program (No. DMR-1626065).
6. Table of Abbreviations
- BHI
brain heart infusion
- TIFK
human telomerase immortalized gingival keratinocytes
- CAN
ceric ammonium nitrate
- HGF
primary human gingival fibroblasts
- CAS
ceric ammonium sulfate
- PS
polystyrene
- CeO2-NP
cerium oxide nanoparticles
References
- [1].Dewhirst FE, Chen T, Izard J, Paster BJ, Tanner AC, Yu WH, Lakshmanan A, Wade WG, J Bacteriol, vol. 192, 2010, pp. 5002–5017. [DOI] [PMC free article] [PubMed] [Google Scholar]
- [2].Klein MI, Hwang G, Santos PH, Campanella OH, Koo H, Front Cell Infect Microbiol, vol. 5, 2015, pp. 10. [DOI] [PMC free article] [PubMed] [Google Scholar]
- [3].Lemos JA, Palmer SR, Zeng L, Wen ZT, Kajfasz JK, Freires IA, Abranches J, Brady LJ, Microbiol Spectr, vol. 7, 2019. [DOI] [PMC free article] [PubMed] [Google Scholar]
- [4].Davis IJ, Richards H, Mullany P, Oral Microbiol Immunol, vol. 20, 2005, pp. 191–194. [DOI] [PubMed] [Google Scholar]
- [5].Mijnendonckx K, Leys N, Mahillon J, Silver S, Van Houdt R, Biometals, vol. 26, 2013, pp. 609–621. [DOI] [PubMed] [Google Scholar]
- [6].Allaker RP, Memarzadeh K, Int J Antimicrob Agents, vol. 43, 2014, pp. 95–104. [DOI] [PubMed] [Google Scholar]
- [7].Hannig M, Hannig C, Nat Nanotechnol, vol. 5, 2010, pp. 565–569. [DOI] [PubMed] [Google Scholar]
- [8].Thakur N, Manna P, Das J, J Nanobiotechnology, vol. 17, 2019, pp. 84. [DOI] [PMC free article] [PubMed] [Google Scholar]
- [9].Farias IAP, Dos Santos CCL, Sampaio FC, Biomed Res Int, vol. 2018, 2018, pp. 1923606. [DOI] [PMC free article] [PubMed] [Google Scholar]
- [10].Xu Y, Wang C, Hou J, Wang P, Miao L, You G, Bioresour Technol, vol. 265, 2018, pp. 102–109. [DOI] [PubMed] [Google Scholar]
- [11].Xu Y, Wang C, Hou J, Wang P, Miao L, You G, Lv B, Yang Y, Zhang F, Bioresour Technol, vol. 245, 2017, pp. 573–580. [DOI] [PubMed] [Google Scholar]
- [12].Lawrence JR, Paule A, Swerhone GDW, Roy J, Grigoryan AA, Dynes JJ, Chekabab SM, Korber DR, Environ Pollut, 2019, pp. 113515. [DOI] [PubMed] [Google Scholar]
- [13].Garcia A, Delgado L, Tora JA, Casals E, Gonzalez E, Puntes V, Font X, Carrera J, Sanchez A, J Hazard Mater, vol. 199–200, 2012, pp. 64–72. [DOI] [PubMed] [Google Scholar]
- [14].Masadeh MM, Karasneh GA, Al-Akhras MA, Albiss BA, Aljarah KM, Al-Azzam SI, Alzoubi KH, Cytotechnology, vol. 67, 2015, pp. 427–435. [DOI] [PMC free article] [PubMed] [Google Scholar]
- [15].Xu Y, Wang C, Hou J, Wang P, You G, Miao L, Environ Sci Pollut Res Int, vol. 25, 2018, pp. 34765–34776. [DOI] [PubMed] [Google Scholar]
- [16].Xu Y, Wang C, Hou J, Wang P, You G, Miao L, Environ Sci Pollut Res Int, vol. 26, 2019, pp. 9293–9304. [DOI] [PubMed] [Google Scholar]
- [17].Nabavi M, Spalla O, Cabane B, J Colloid Interf Sci, vol. 160, 1993, pp. 459–471. [Google Scholar]
- [18].Xu JX, Li GS, Li LP, Mater Res Bull, vol. 43, 2008, pp. 990–995. [Google Scholar]
- [19].Pettinger NW, Williams RE, Chen J, Kohler B, Phys Chem Chem Phys, vol. 19, 2017, pp. 3523–3531. [DOI] [PubMed] [Google Scholar]
- [20].Ikeda-Ohno A, Hennig C, Weiss S, Yaita T, Bernhard G, Chemistry, vol. 19, 2013, pp. 7348–7360. [DOI] [PubMed] [Google Scholar]
- [21].Garcia SS, Blackledge MS, Michalek S, Su L, Ptacek T, Eipers P, Morrow C, Lefkowitz EJ, Melander C, Wu H, J Dent Res, vol. 96, 2017, pp. 807–814. [DOI] [PMC free article] [PubMed] [Google Scholar]
- [22].Walkey C, Das S, Seal S, Erlichman J, Heckman K, Ghibelli L, Traversa E, McGinnis JF, Self WT, Environ Sci Nano, vol. 2, 2015, pp. 33–53. [DOI] [PMC free article] [PubMed] [Google Scholar]
- [23].Matsumoto M, Minami T, Sasaki H, Sobue S, Hamada S, Ooshima T, Caries Res, vol. 33, 1999, pp. 441–445. [DOI] [PubMed] [Google Scholar]
- [24].Xu FF, Bando Y, J Appl Phys, vol. 89, 2001, pp. 5469–5472. [Google Scholar]
- [25].Wu LJ, Wiesmann HJ, Moodenbaugh AR, Klie RF, Zhu YM, Welch DO, Suenaga M, Phys Rev B, vol. 69, 2004. [Google Scholar]
- [26].Shannahan J, Nanotechnol Rev, vol. 6, 2017, pp. 345–353. [DOI] [PMC free article] [PubMed] [Google Scholar]
- [27].Docter D, Westmeier D, Markiewicz M, Stolte S, Knauer SK, Stauber RH, Chem Soc Rev, vol. 44, 2015, pp. 6094–6121. [DOI] [PubMed] [Google Scholar]
- [28].Jokisaari JR, Wang C, Qiao Q, Hu X, Reed DA, Bleher R, Luan X, Klie RF, Diekwisch TGH, ACS Nano, vol. 13, 2019, pp. 3151–3161. [DOI] [PMC free article] [PubMed] [Google Scholar]
- [29].Wang C, Shokuhfar T, Klie RF, Adv Mater, vol. 28, 2016, pp. 7716–7722. [DOI] [PubMed] [Google Scholar]
- [30].Wang C, Qiao Q, Shokuhfar T, Klie RF, Adv Mater, vol. 26, 2014, pp. 3410–3414. [DOI] [PubMed] [Google Scholar]
- [31].Ribeiro AR, Mukherjee A, Hu X, Shafien S, Ghodsi R, He K, Gemini-Piperni S, Wang C, Klie RF, Shokuhfar T, Shahbazian-Yassar R, Borojevic R, Rocha LA, Granjeiro JM, Nanoscale, vol. 9, 2017, pp. 10684–10693. [DOI] [PubMed] [Google Scholar]
Associated Data
This section collects any data citations, data availability statements, or supplementary materials included in this article.


