Abstract
The average color in a scene is a potentially important cue to the illuminant and thus for color constancy, but it remains unknown how well and in what ways observers can estimate the mean chromaticity. We examined this by measuring the variability in “achromatic” settings for stimuli composed of different distributions of colors with varying contrast ranges along the luminance, SvsLM and LvsM cardinal axes. Observers adjusted the mean chromaticity of the palette to set the average to gray. Variability in the settings increased as chromatic contrast or (to a lesser extent) luminance contrast increased. Signals along the cardinal axes are relatively independent in many detection and discrimination tasks, but showed strong interference in the white estimates. This “cross-masking” and the effects of chromatic variance in general may occur because observers cannot explicitly perceive or represent the mean of a set of qualitatively different hues (e.g. that red and green hues average to gray), and thus may infer the mean only indirectly (e.g. from the relative saturation of different hues).
OCIS codes: (330.0330) Vision, color and visual optics; (010.1690) Color; (330.1720) Color vision
1. Introduction
The stimulus that appears gray or achromatic is fundamental to color vision, for it is the norm relative to which all other colors are encoded [by the direction (hue) or distance (saturation) from gray]. Many studies have examined achromatic settings and how they depend on factors such as visual eccentricity [1, 2], the observer’s age [3, 4], the state of adaptation [5], or the measurement procedures [6]. In general, chromatic sensitivity is highest around the white point relative to other colors, consistent with the predictions for contrast masking in which white corresponds to zero contrast [7–9]. Achromatic settings have also played a central role in color constancy, as a measure of how the perceived colors of objects depend on the spectral characteristics of the illuminant (e.g. [10]). White settings tend to be more variable along bluish-yellowish directions compared to reddish-greenish axes [3, 6, 11]. This blue-yellow bias has been attributed to weaker sensitivity or greater tolerance for variations in natural daylight spectra, which vary along a blue-yellow axis [12–16].
Most studies of achromatic settings examine how or how well observers can judge the appearance of a single surface. However, natural scenes often include a wide gamut of colors, and can have a strong bias in the average chromaticity [17–21]. It is thus important to understand the extent to which an observer can estimate the average color of such scenes [22]. For example, this would be important for discounting the illuminant to achieve color constancy, assuming a gray world or neutral set of reflectances [23, 24]. The ability to extract the mean of a set of elements has been repeatedly demonstrated in the context of “ensemble coding” or “summary statistics.” Ensemble coding is motivated by the observation that the visual system is often insensitive to the individual details comprising a scene, yet highly sensitive to the global statistics of these details such as their mean and variance (see [25] for a review). This finding has been demonstrated for a wide variety of visual attributes including size [26], orientation [27] and motion [28]. It has also been found for high level features such as facial expressions [29] and direction of gaze [30]. The ability to extract the mean of an ensemble has also been extended to audition, for example to represent the average of a set of tones [31, 32]. The ubiquitous nature of averaging in sensory processing suggests it confers fundamental advantages in perception, and in particular supports efficient representations of image properties [25, 33].
A number of studies have examined ensemble coding in color vision (e.g. [34–38]). These have generally shown robust averaging for nearby colors, and weaker sensitivity as the color variance increases, but have not revealed how this averaging is related to basic mechanisms of color coding. Here we systematically probed how averaging and white percepts depend on different cardinal directions in color space [39], and the interactions between these directions. Specifically, our goal was to assess the relative independence of the cardinal chromatic axes in a color averaging task, and explore if the sensitivity of white settings for stimuli having different chromatic contrasts was separable based on these cardinal directions.
2. Methods
2.1. Participants
Participants included author SS and 12 students at the University of Nevada, Reno who were unaware of the specific aims of the study, with different observers participating in different subsets of the experiments. All observers had normal color vision as assessed by the Cambridge Colour Test [40] and had normal or corrected-to-normal visual acuity. The studies followed protocols consistent with the Declaration of Helsinki and were approved by University of Nevada, Reno’s Institutional Review Board, and participation was with informed consent.
2.2. Stimuli
Stimuli were displayed on calibrated NEC color monitor controlled by a Cambridge Research Systems ViSaGe graphics card. The gun luminances were linearized through calibration tables measured with a PhotoResearch PR 655 spectroradiometer. The test stimulus was composed of a 15x15 square array of color patches. Each uniform patch subtended 0.5 deg at the 110 cm viewing distance, and the array was shown centered in the 800 pixels by 600 pixels background of the monitor.
The test array and background (except where noted otherwise) had the same average luminance (30 cd/m2) and an achromatic chromaticity (CIE 1931 x,y: 0.31, 0.316) equivalent to the chromaticity of Illuminant C. Luminance in the display was defined photometrically and not calibrated for individual observers. The colors of the individual array elements were specified by their LvsM, SvsLM, and luminance contrast relative to the mean, with contrasts scaled according to a version of the Macleod-Boynton [41] (MacLeod & Boynton, 1979) color space (see Figure 1). The scaling was chosen to roughly equate sensitivity for the cardinal axes based on previous studies [42]:
where rmb and bmb are the chromaticity coordinates of the stimuli in the MacLeod-Boynton diagram, and the constants 0.6568, 0.01825 are the MacLeod-Boynton coordinates of the background. Lum is the luminance of the element, with the contrasts scaled to range from −100 to 100. For a given contrast level (e.g. 30), the contrasts of the 225 elements were chosen to uniformly and equally sample 225 values along the contrast range (e.g. from −30 to 30), with the spatial locations of the contrast levels randomized. The color of each patch displayed the combination of the randomly assigned contrasts for the three cardinal axes. Different conditions varied in 1) the contrast range of the elements; 2) the chromatic axis used to define the array; or 3) the type of background. The specific conditions are noted for each set of results below.
Figure 1.
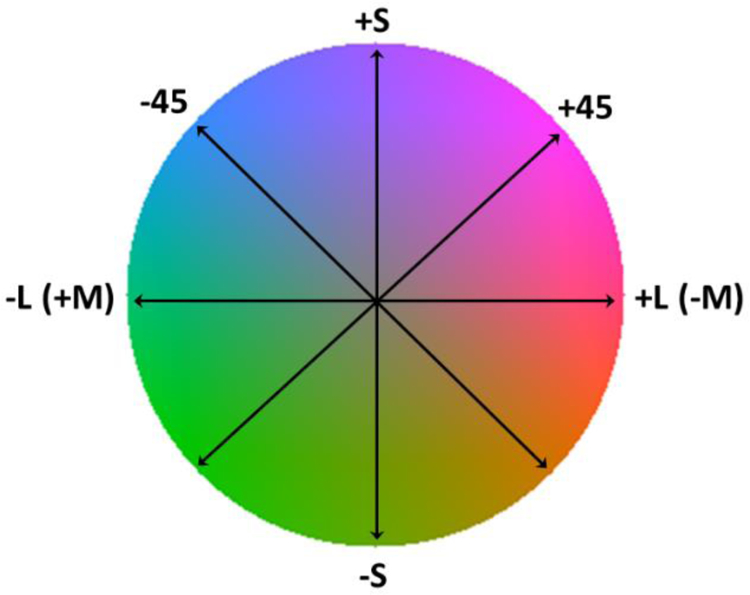
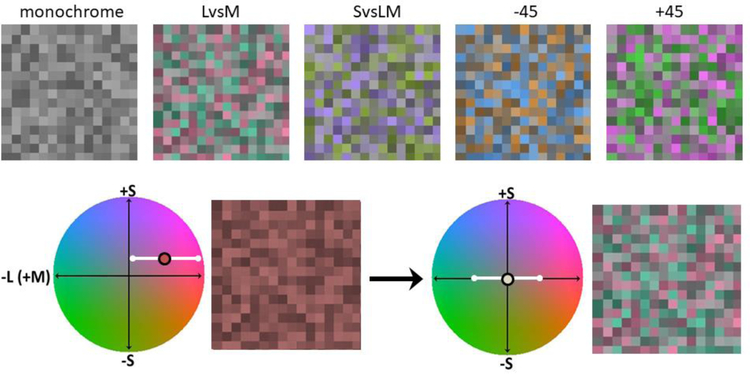
Axes for chromatic contrast variations in the stimuli. The LvsM and SvsLM axes are the cardinal directions of color space, and correspond to angles of 0–180 and 90–270 degrees. The −45 and +45 axes correspond to hue angles intermediate to the cardinal axes (based on the scaling used for the space).
2.3. Procedure
Observers viewed the display binocularly in an otherwise dark room and fixation was not controlled. During an experimental session they first adapted to the gray background for 15 sec, and then were shown the test palette for 500 msec alternated with 1500 msec of the background. The mean of the array was initially set to a random level, with the fixed range of chromaticities varied relative to the mean. For example, if the specified contrast was 30 and the randomly selected mean was 10, then the elements ranged in contrast from −20 to 40. Observers were instructed to adjust the mean chromaticity of the array until the palette appeared unbiased (i.e. with a mean equal to gray), using two pairs of buttons on a handheld keypad. The two pairs separately varied the mean value of the array along two orthogonal axes LvsM and SvsLM; or −45 and +45). For example, the bottom panel of Figure 2 shows an array before or after adjusting palette with a fixed contrast along the LvsM axis and a mean bias in both the LvsM and SvsLM coordinates. The task required adjusting the mean along both axes so that the colors appeared centered on the achromatic point. The mean luminance and luminace contrast remained fixed throughout and could not be adjusted. The stimulus repeated until a setting was selected by a button press, at which point the mean (LvsM and SvsLM, or −45 and +45) values were recorded and the program advanced to the next stimulus. During a session participants were shown different color palettes (corresponding to different chromatic axes and to different chromatic and luminance contrasts), each shown 10 times in random order. Two separate sessions were completed for each condition resulting in a total of 20 settings per stimulus for each observer. The standard deviation of these 20 settings was used as a measure of the sensitivity to a color bias in the arrays, and were calculated separately for each adjustment axis (e.g. for the settings along the LvsM or SvsLM axis). The results reported are based on the standard deviations averaged across the observers for each condition. All comparisons are between conditions that were assessed during the same sessions and within the same observers, and are based on repeated-measures ANOVAs comparing the magnitude of the errors across conditions.
Figure 2.
Top: Examples of unbiased stimulus palettes with a fixed luminance contrast and no chromatic contrast (monochrome), or a fixed range of chromatic contrast along the LvsM, SvsLM, −45, or +45 deg axis. In the experiment each array was chromatically biased by adding a random uniform mean chromaticity to the palette, and observers adjusted this mean along the stimulus axis and the orthogonal axis until the palette appeared unbiased. Bottom: example in which the stimulus had a fixed range of chromatic variation along the horizontal LvsM axis (white bar) but with an added random mean shift along both the LvsM and SvsLM axis (reddish purple circle). The mean was adjusted along both the LvsM nd SvsLM axes so that the mean appeared achromatic (gray circle).
3. Results
The general aim of our study was to assess sensitivity to the “white balance” of color arrays and how this depends on the range of color and luminance in the arrays. In all cases we assessed this by asking observers to adjust the mean chromaticity of the palettes so that the mean was achromatic, and used the variance in the repeated estimates as a measure of sensitivity. The stimuli varied in luminance contrast, chromatic contrast, and the axis of the chromatic contrast. In further experiments we also examined the effects of the backgrounds on which the arrays were presented. In the following sections we consider the effects of each of these factors.
3.1. Effects of luminance contrast
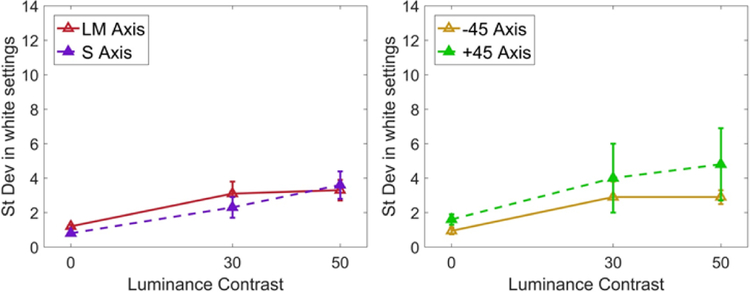
In the first case we examined the achromatic settings in palettes that had uniform (zero contrast) chromaticity, but differed in the level of luminance contrast. The luminance contrast was fixed at 0, 30, or 50, and observers adjusted the chromaticity of the palettes until they appeared gray. Figure 3 shows plots of the resulting achromatic settings, again for palettes that had a range of luminance levels but were a uniform color (i.e zero chromatic variance). In this and subsequent plots, the symbols show the mean standard deviation of the settings (averaged across the 20 trials and 8 observers (left), 4 observers (right)) as function of the array contrast, and the different lines correspond to the settings along the two chromatic axes. The left panel shows settings when observers adjusted the LvsM and SvsLM levels, while the right panel was for a case (discussed further below) where the adjustment was instead along the −45 and +45 deg axes intermediate to the cardinal axes. In each panel the leftmost points correspond to a uniform square. For this condition observers simply had to adjust the square until it was indistinguishable from the background, and the variance in the settings is near the nominal thresholds for discriminating a color change along either axis. It should thus be noted that in this case observers were not necessarily judging whether the square appeared achromatic since they may have simply been matching the background. However, a discriminable difference from a gray background at equiluminance does typically appear chromatic at the detection threshold [43, 44].
Figure 3.
Effect of luminance contrast on white settings. The standard deviation of white settings along the cardinal (left) or intermediate (right) chromatic axes is plotted as a function of the luminance contrast of the stimulus arrays. Points plot the mean and standard error of the values across observers. Points plot the mean and standard error of the settings across the observers.
Surprisingly, variance in the achromatic settings was increased when luminance contrast was added to the array. That is, even though the arrays remained chromatically uniform, judging the color was more difficult when the elements randomly varied in luminance. These effects were observed both for the mean settings as well as the settings for individual observers. Thus the increased variance is not simply because observers started to reliably differ in their chosen achromatic points, but because each observer was less reliable in their settings. A 2-way ANOVA (luminance contrast (0 vs 30 vs 50) vs response axis (LM vs S)) revealed a main effect of luminance contrast, but no main effect of response axis or a significant interaction between the groups. Posthoc comparisons showed that the difference in SD of white settings was between 0 vs 50 contrast levels (p = 0.013). A similar trend is apparent in the blue-yellow settings, though in this case the effect of luminance contrast did not reach significance.
3.2. Effects of chromatic contrast: cardinal axes
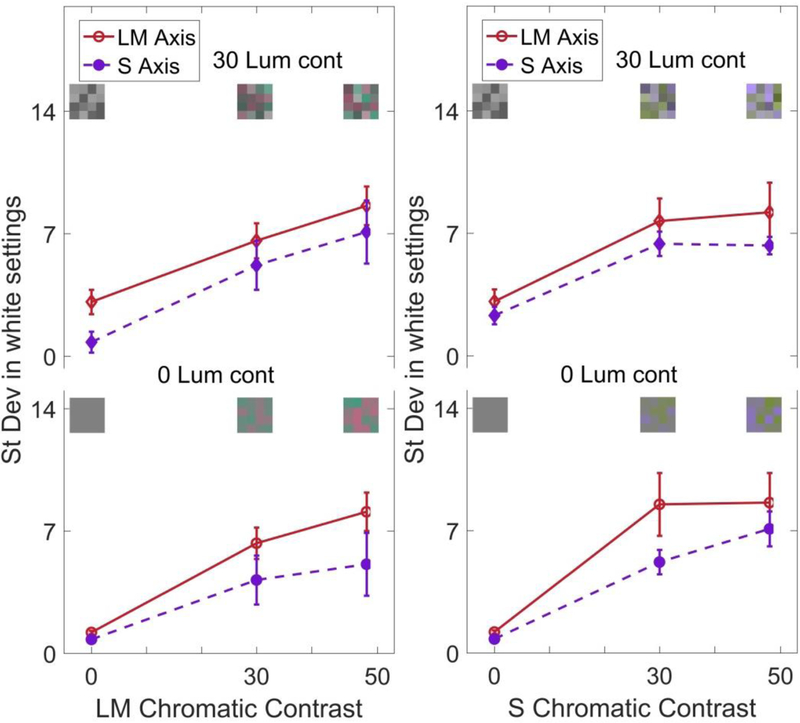
The next set of conditions varied the chromatic contrast along the LvsM or SvsLM axes, with contrast along one axis fixed at 0, 30, or 50 and the other fixed at 0. Because of the effects of luminance variations noted above, the settings were also made for either 0 or 30 luminance contrast, for a total of 10 unique conditions. Examples of the palettes and the settings are shown in Figure 4. The leftmost points replicate the previous results for luminance contrast, with larger standard deviations in the settings when luminance contrast was added to the uniform chromatic array. For both axes, the variance in the settings also increased with increasing chromatic contrast. Importantly, this effect was similar whether the stimulus variance was along or orthogonal to the axis of the judgment. That is, the uncertainty in the LvsM achromatic setting was increased in a similar way whether the stimulus contrast was increased along the LvsM axis or the SvsLM axis. Finally, the results suggest potential differences in the magnitude of the effect along each axis. However, this difference could reflect a difference in how contrasts along the two axes were scaled.
Figure 4.
Standard deviation of the achromatic settings for stimuli with chromatic contrast along the LvsM axis (left) or SvsLM axis (right), and with a luminance contrast of 30 (top) or 0 (bottom). Points plot the mean and standard error across observers for the settings along the LvsM axis (solid lines) or SvsLM axis (dashed lines).
These effects were formally assessed with a 3-way RMANOVA (axis of variance by contrast level by response axis; separately for each luminance contrast), which showed significant main effects for all factors (variance axis, F(1,7) = 7.379, p = 0.005; contrast level, F(2,14) = 25.076, p <0.001; response axis, F(1,7) = 15.95, p = 0.005). There was also a significant interaction between the response axis and contrast level (F(2,14) = 6.329, p = 0.011). A posthoc analysis of pairwise comparison between the contrast levels showed that the difference in settings was significant between the 0 vs 30 (p = 0.004), and 0 vs 50 contrast levels (p = 0.003). We also conducted separate 3-way RMANOVAs for the LvsM and SvsLM arrays (luminance contrast by chromatic contrast by response axis). For LvsM, there was a main effect only for chromatic contrast (F(2,14) = 21.281, p < 0.001). Posthoc pairwise comparisons between the contrast levels showed that the differences between all the chromatic contrast levels were significant (0 vs 30, p = 0.008; 0 vs 50, p = 0.006; 30 vs 50, p = 0.034). Similarly, for the SvsLM arrays showed a main effect of chromatic contrast (F (2,14) = 27.18, p<0.001) with significant differences between the 0 vs 30 (0.002) and 0 vs 50 (p = 0.002) contrast levels.
3.3. Effects of chromatic contrast: intermediate chromatic axes
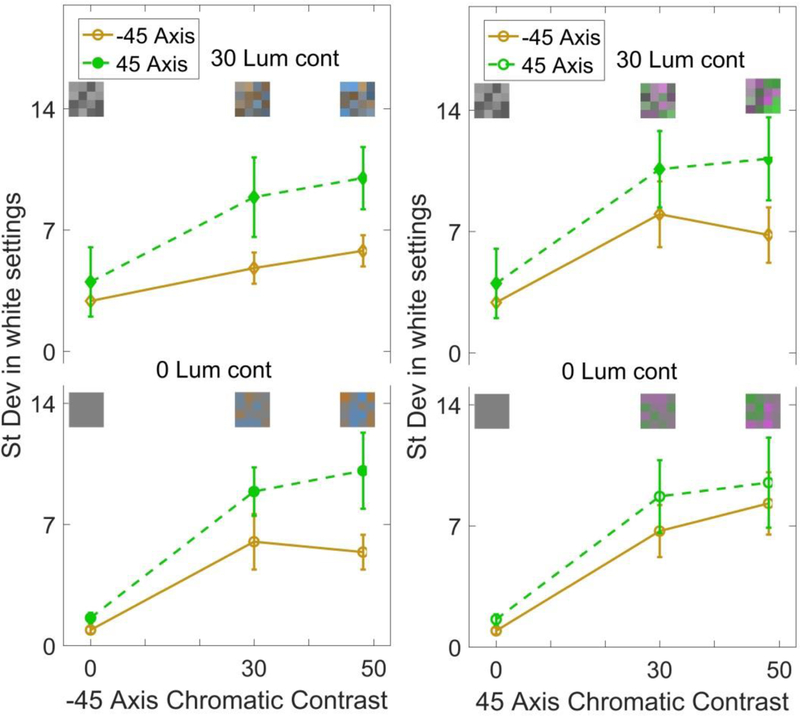
As noted, a number of previous studies have shown that color discrimination and achromatic settings tend to be less reliable along the “blue-yellow” dimension of color [11, 45]. Again, this effect has been attributed to the greater variance in natural lighting along the blue-yellow axis, which might reduce sensitivity to blue-yellow variations. We assessed whether a similar bias would occur for achromatic settings in the variegated color distributions. For this we repeated the same measurements, but for stimuli that were rotated 45 deg in the chromatic plane. One of these axes corresponded to a bluish to yellowish/orange hue variation (thus this axis was close to but did not isolate a pure blue-yellow variation). The second, +45 deg axis corresponded to hues that varied from reddish-purple to green. Examples of the palettes are shown in Figure 5. Unlike the preceding conditions, note that any differences in these stimuli cannot result from differences in how the LvsM and SvsLM axes are scaled, for both axes include the same LvsM and SvsLM contrasts, combined in opposite phase.
Figure 5.
Standard deviation of the achromatic settings for stimuli with chromatic contrast along the −45 deg axis (left) or +45 deg axis (right), and with a luminance contrast of 30 (top) or 0 (bottom). Points plot the mean and standard error across observers for the settings along the −45 deg axis (solid lines) or +45 deg axis (dashed lines).
Here again, variability in the settings increased with increasing chromatic contrast (Figure 5). Surprisingly, for our conditions the achromatic settings were if anything more reliable along the −45 deg (bluish-yellowish) axis when the arrays were monochromatic. Moreover, when the stimulus varied along the −45 deg, settings also tended to be less noisy for this axis. However, the converse was not observed for stimulus variations along the +45 reddish-greenish axis. Thus in general, our results did not reveal a weaker sensitivity to the −45 deg axis, but again confirmed that achromatic settings became less reliable as the stimulus variance increases. A 3-way RMANOVA (stimulus axis by contrast level by response axis; for each luminance contrast) showed that there was a main effect of the response axis (F(1,3) = 17.617, p = 0.025), and main effect of the contrast level (F(2,6) = 19.088, p = 0.003), but no effect of the stimulus color axis and no interaction between the factors. Separate analyses of the −45 and +45 stimuli (comparing luminance level by chromatic contrast by response axis) showed a significant main effect for chromatic contrast (F (2,6) = 14.36, p = 0.005) with the difference between 0 vs 50 being significant (p = 0.038), and no main effect of luminance contrast. For the +45 stimulus dimension the main effects did not reach significance.
3.4. Effects of the background
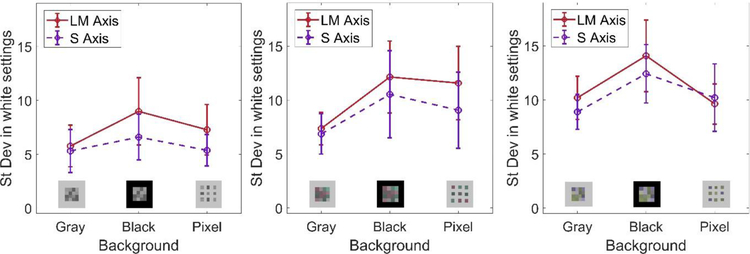
In the final conditions we assessed the effect of the background surrounding the arrays. As noted, in the preceding conditions the background was maintained at the gray average of the arrays, and thus provided a potential reference for setting the mean chromaticity of the array. To remove this cue, we repeated the settings for the cardinal axis contrasts, but on a black background. This increased the variability in the settings, although not significantly. (Figure 6).
Figure 6.
Effect of the background on the settings. Each panel plots the standard deviation in the achromatic settings for a given stimulus array shown on a gray background, black background, or a gray background interleaved with the array elements. The three panels are for stimulus arrays that luminance contrast but no chromatic contrast (left), luminance contrast and LvM chromatic contrast (middle), or luminance contrast and SvsLM contrast (right). Points plot the mean and standard error across the observers for the adjustments along the LvsM (solid lines) and SvsLM (dashed lines) axes.
As a second manipulation we introduced a gap between each element of the array. The gap subtended 0.5 deg by setting alternate elements in the array to gray. An example of the array is shown in Figure 7. If the background served as a reference, then the added gap might provide a stronger local cue to the average chromaticity of the array. Alternatively, the gap might decrease sensitivity because it removed the potential cue for a mean bias in the color to reflect a uniform illuminant or transparent overlay. Instead, however, this condition did not alter the variability in the white settings. These effects were confirmed using a 3 way ANOVA (axis of stimulus variation by background type by response axis), which showed no main effects of the stimulus (F (2,10) = 2.18, p = .164), or background (F (2,10) = 2.17, p = 0.165), or response axis (F (1,5) = 1.8, p = 0.238).
Figure 7.
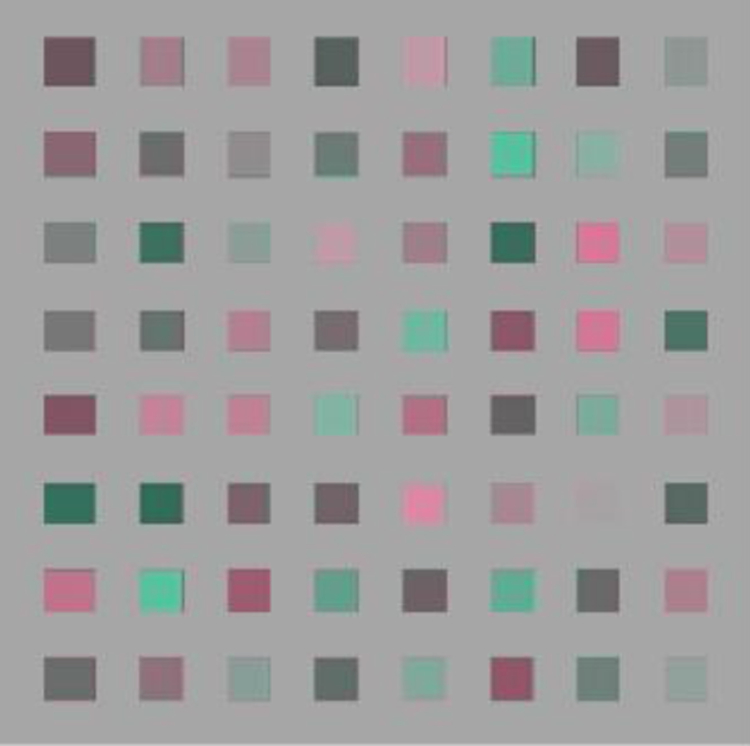
Example of the stimulus array with gaps between the elements by setting alternate elements to gray.
4. Discussion
To summarize, achromatic settings in our stimuli were strongly affected by the variance of the color distribution, becoming more variable as the contrast of the distribution increased. Surprisingly, this occurred even when the contrast in the distribution was along color directions that differed from the chromatic axis along which observers judged the achromatic balance. We consider the implications of these effects for how and how well the visual system might encode and represent the achromatic mean of a color distribution.
As noted in the Introduction, the average chromaticity in a scene can provide potential information about the illuminant and thus could provide a powerful cue to color constancy, though several authors have noted that its utility depends in part on an unbiased distribution of reflectances (the “gray world” assumption) [23, 24]. Studies of color constancy have demonstrated mechanisms that do respond to mean changes in the stimulus. For example, the cones adapt to the time-averaged signals they are exposed to and thus could adjust to the mean by sampling the image with successive fixations [46, 47]. However, this adaptation should actually work against detecting an average color bias since it acts to remove this bias. A uniform shift in the chromaticity (consistent with a global illuminant change) can also be readily distinguished from random changes in the colors within a distribution (consistent with local reflectance changes) supporting relational color constancy [48]. In principle, mechanisms tuned to lower spatial frequencies could also extract the average color of the scene by providing an estimate of the illuminant [49].
As the latter example suggests, one strategy for estimating the mean could be to attend to the low spatial frequency component of the palettes, since this might correspond to the global illumination. There is evidence that the visual system can form layered representations of the illumination and surface color [50], and transparency effects have been widely studied [51]. Indeed, we specifically considered the possibility that observers might perceive the palettes as unbiased but with an overlying transparent layer of biased color. The control experiment with gaps added between the palette elements was designed to reduce this impression of transparency. However, this did not alter the pattern of settings, arguing against this interpretation. While we did not vary the element size, the perception of the mean also depends strongly on this, since both optical and neural blur would increasingly blend the perceived color as the spatial frequency of the array increases [52, 53], ultimately rendering the mean easier to perceive.
Our principal finding is that the extraction of the average is more difficult as the variance in the distribution increases. One mechanism that could give rise to this effect for color is contrast masking. Contrast discrimination thresholds increase with increasing pedestal contrast for both luminance and chromatic contrast, consistent with a saturating nonlinearity in the contrast response [7, 8, 54, 55]. Thus the higher-variance patterns might reduce sensitivity to a chromatic bias. Contrast-dependent losses of sensitivity could also occur with contrast adaptation, which produces stronger losses for higher adapting contrasts [56]. Our stimuli involved brief and intermittent presentations and thus limited but did not completely control for potential adaptation effects.
However, a problem with both masking and adaptation accounts is that both are strongly color-selective. That is, masking or adaptation along the LvsM axis strongly affects sensitivity along the LvsM axis but not along the SvsLM axis or vice versa [7, 56–58]. Instead, we found pronounced “cross-axis” interactions on the settings. Specifically, judging the LvsM balance was affected in similar ways whether the color distribution varied only along the LvsM axis or the SvsLM axis, and was also affected even when the distribution varied only in luminance. These cross-axis interactions argue against a simple nonlinearity as the basis for the effects, and suggest they may reflect a fundamentally different cause. Related to this, they may also reflect a fundamentally different judgment. In masking studies the task of the observers is to discriminate between two colors or color distributions, without regard to their color appearance. In contrast, our task required observers to directly judge the appearance.
The focus on appearance rather than discrimination in our task may make the achromatic settings more akin to ensemble coding. As we noted, ensemble coding of the mean has been demonstrated for a wide range of stimuli [25], and like our color settings, becomes less precise with increasing variance in the ensemble [35]. The mechanisms mediating this representation are not well understood. However, our results suggest that the “averaging” does not occur independently within the cardinal mechanisms underlying early post-receptoral color coding, potentially pointing to higher stages of color processing. Moreover, we found little evidence for increased variability along the blue-yellow or daylight locus characteristic of achromatic settings [11, 45]. This may be because the noise introduced by the color variations in the palette became more important in limiting performance than the intrinsic sensitivity to white, but at least for our limited settings this suggests that there do not appear to be any privileged axes for the averaging. How then was an average estimated?
An important issue for understanding the underlying processes is whether the achromatic settings reflected an explicit vs. implicit percept of gray in the stimulus – that is whether the visual system forms an actual representation of the mean of the distribution or only infers it indirectly. In the case of color – as well as potentially many of the other stimulus dimensions studied in ensemble coding – this issue remains unresolved. However, it is worth noting that it is not intuitive that the mean of two complementary colors is gray; and in fact, when naïve observers are asked to select the complement of a color so that the mean is gray, their settings are highly variable [59]. Thus at least anecdotally there seems to be little conscious access to the mean. Moreover, it is possible that observers were not directly sensing the mean hue, but instead gauging the relative contrast of different hues. For example, the white point might have been set by adjusting the reds and greens in the palette to appear equal in saturation. In fact some observers reported this strategy after testing. By this account, increasing the variance along other color directions might make these relative saturation judgments more difficult, because they introduced random hue variations in the stimuli to be compared.
Finally, we note that our settings were confined to the perception of unbiased color distributions, and very different factors may come into play when the average color of the stimulus strongly deviates from white. For example, a number of studies have found that in a variegated distribution, the more saturated colors tend to dominate the average perceived color [60–62], while lightness judgments are biased by the tendency to fixate the lightest parts of objects [63]. This makes sense because in scenes with lighting-induced variation the purest colors or brightest elements may be interpreted as the most undiluted sample of the surface color. However, such effects again point to a role for higher-level inferences in the perception of the average color.
Acknowledgements
Supported by NIH EY-010834.
Footnotes
Disclosures
The authors declare no conflicts of interest.
References
- 1.Beer D, Wortman J, Horwitz G, and MacLeod D, “Compensation of white for macular filtering [Abstract],” Journal of vision 5, 282a (2005). [Google Scholar]
- 2.Webster MA and Leonard D, “Adaptation and perceptual norms in color vision,” Journal of the Optical Society of America A 25, 2817–2825 (2008). [DOI] [PMC free article] [PubMed] [Google Scholar]
- 3.Werner JS and Schefrin BE, “Loci of achromatic points throughout the life span,” Journal of the Optical Society of America A 10, 1509–1516 (1993). [DOI] [PubMed] [Google Scholar]
- 4.Wuerger SM, “Colour constancy across the life span: Evidence for compensatory mechanisms,” PloS one 8(5), e63921 (2013). [DOI] [PMC free article] [PubMed] [Google Scholar]
- 5.Delahunt PB, Webster MA, Ma L, and Werner JS, “Long-term renormalization of chromatic mechanisms following cataract surgery,” Visual neuroscience 21, 301–307 (2004). [DOI] [PMC free article] [PubMed] [Google Scholar]
- 6.Chauhan T, Perales E, Xiao K, Hird E, Karatzas D, and Wuerger S, “The achromatic locus: effect of navigation direction in color space,” Journal of vision 14(2014). [DOI] [PMC free article] [PubMed] [Google Scholar]
- 7.Krauskopf J and Gegenfurtner K, “Color discrimination and adaptation,” Vision research 32, 2165–2175 (1992). [DOI] [PubMed] [Google Scholar]
- 8.Switkes E, Bradley A, and De Valois KK, “Contrast dependence and mechanisms of masking interactions among chromatic and luminance gratings,” Journal of the Optical Society of America. A, Optics and image science 5, 1149–1162 (1988). [DOI] [PubMed] [Google Scholar]
- 9.MacLeod DIA, “Colour discrimination, colour constancy, and natural scene statistics (The Verriest Lecture),” in Normal and Defective Colour Vision, Mollon JD, Pokorny J, and Knoblauch K, eds. (Oxford University Press, London, 2003). [Google Scholar]
- 10.Brainard DH and Wandell BA, “Asymmetric color matching: how color appearance depends on the illuminant,” Journal of the Optical Society of America. A, Optics and image science 9, 1433–1448 (1992). [DOI] [PubMed] [Google Scholar]
- 11.Bosten JM, Beer RD, and MacLeod DI, “What is white?,” Journal of vision 15, 5 (2015). [DOI] [PMC free article] [PubMed] [Google Scholar]
- 12.Pearce B, Crichton S, Mackiewicz M, Finlayson GD, and Hurlbert A, “Chromatic illumination discrimination ability reveals that human colour constancy is optimised for blue daylight illuminations,” PloS one 9, e87989 (2014). [DOI] [PMC free article] [PubMed] [Google Scholar]
- 13.McDermott KC and Webster MA, “Uniform color spaces and natural image statistics,” Journal of the Optical Society of America. A, Optics, image science, and vision 29, A182–187 (2012). [DOI] [PMC free article] [PubMed] [Google Scholar]
- 14.Goddard E, Mannion DJ, McDonald JS, Solomon SG, and Clifford CW, “Combination of subcortical color channels in human visual cortex,” Journal of vision 10, 25 (2010). [DOI] [PubMed] [Google Scholar]
- 15.Winkler AD, Spillmann L, Werner JS, and Webster MA, “Asymmetries in blue-yellow color perception and in the color of ‘the dress’,” Current biology : CB 25, R547–548 (2015). [DOI] [PMC free article] [PubMed] [Google Scholar]
- 16.Weiss D, Witzel C, and Gegenfurtner K, “Determinants of Colour Constancy and the Blue Bias,” i-Perception 8, 2041669517739635 (2017). [DOI] [PMC free article] [PubMed] [Google Scholar]
- 17.Webster MA and Mollon JD, “Adaptation and the color statistics of natural images,” Vision research 37, 3283–3298 (1997). [DOI] [PubMed] [Google Scholar]
- 18.Burton GJ and Moorhead IR, “Color and spatial structure in natural scenes,” Applied optics 26, 157–170 (1987). [DOI] [PubMed] [Google Scholar]
- 19.Ruderman DL, Cronin TW, and Chiao CC, “Statistics of cone responses to natural images: implications for visual coding,” Journal of the Optical Society of America A 15, 2036–2045 (1998). [Google Scholar]
- 20.Linhares JM, Pinto PD, and Nascimento SM, “The number of discernible colors in natural scenes,” Journal of the Optical Society of America. A, Optics, image science, and vision 25, 2918–2924 (2008). [DOI] [PubMed] [Google Scholar]
- 21.Webster MA, Mizokami Y, and Webster SM, “Seasonal variations in the color statistics of natural images,” Network 18, 213–233 (2007). [DOI] [PubMed] [Google Scholar]
- 22.Nascimento SM, de Almeida VM, Fiadeiro PT, and Foster DH, “Effect of scene complexity on colour constancy with real three-dimensional scenes and objects,” Perception 34, 947–950 (2005). [DOI] [PubMed] [Google Scholar]
- 23.Smithson HE, “Sensory, computational and cognitive components of human colour constancy,” Philosophical transactions of the Royal Society of London. Series B, Biological sciences 360, 1329–1346 (2005). [DOI] [PMC free article] [PubMed] [Google Scholar]
- 24.Foster DH, “Color constancy,” Vision research 51, 674–700 (2011). [DOI] [PubMed] [Google Scholar]
- 25.Whitney D and Yamanashi Leib A, “Ensemble Perception,” Annual review of psychology 69, 105–129 (2018). [DOI] [PubMed] [Google Scholar]
- 26.Ariely D, “Seeing sets: representation by statistical properties,” Psychological science 12, 157–162 (2001). [DOI] [PubMed] [Google Scholar]
- 27.Robitaille N and Harris IM, “When more is less: extraction of summary statistics benefits from larger sets,” Journal of vision 11(2011). [DOI] [PubMed] [Google Scholar]
- 28.Watamaniuk SN and Duchon A, “The human visual system averages speed information,” Vision research 32, 931–941 (1992). [DOI] [PubMed] [Google Scholar]
- 29.Haberman J and Whitney D, “Seeing the mean: ensemble coding for sets of faces,” Journal of experimental psychology. Human perception and performance 35, 718–734 (2009). [DOI] [PMC free article] [PubMed] [Google Scholar]
- 30.Sweeny TD and Whitney D, “Perceiving crowd attention: ensemble perception of a crowd’s gaze,” Psychological science 25, 1903–1913 (2014). [DOI] [PMC free article] [PubMed] [Google Scholar]
- 31.McDermott JH, Schemitsch M, and Simoncelli EP, “Summary statistics in auditory perception,” Nature neuroscience 16, 493–498 (2013). [DOI] [PMC free article] [PubMed] [Google Scholar]
- 32.Piazza EA, Sweeny TD, Wessel D, Silver MA, and Whitney D, “Humans use summary statistics to perceive auditory sequences,” Psychological science 24, 1389–1397 (2013). [DOI] [PMC free article] [PubMed] [Google Scholar]
- 33.Alvarez GA, “Representing multiple objects as an ensemble enhances visual cognition,” Trends in cognitive sciences 15, 122–131 (2011). [DOI] [PubMed] [Google Scholar]
- 34.Maule J and Franklin A, “Accurate rapid averaging of multihue ensembles is due to a limited capacity subsampling mechanism,” Journal of the Optical Society of America. A, Optics, image science, and vision 33, A22–29 (2016). [DOI] [PubMed] [Google Scholar]
- 35.Maule J and Franklin A, “Effects of ensemble complexity and perceptual similarity on rapid averaging of hue,” Journal of vision 15, 6 (2015). [DOI] [PubMed] [Google Scholar]
- 36.Maule J, Witzel C, and Franklin A, “Getting the gist of multiple hues: metric and categorical effects on ensemble perception of hue,” Journal of the Optical Society of America. A, Optics, image science, and vision 31, A93–102 (2014). [DOI] [PubMed] [Google Scholar]
- 37.Webster J, Kay P, and Webster MA, “Perceiving the average hue of color arrays,” Journal of the Optical Society of America. A, Optics, image science, and vision 31, A283–292 (2014). [DOI] [PMC free article] [PubMed] [Google Scholar]
- 38.Chetverikov A, Campana G, and Kristjansson A, “Representing Color Ensembles,” Psychological science 28, 1510–1517 (2017). [DOI] [PubMed] [Google Scholar]
- 39.Krauskopf J, Williams DR, and Heeley DW, “Cardinal directions of color space,” Vision research 22, 1123–1131 (1982). [DOI] [PubMed] [Google Scholar]
- 40.Regan BC, Reffin JP, and Mollon JD, “Luminance noise and the rapid determination of discrimination ellipses in colour deficiency,” Vision research 34, 1279–1299 (1994). [DOI] [PubMed] [Google Scholar]
- 41.MacLeod DI and Boynton RM, “Chromaticity diagram showing cone excitation by stimuli of equal luminance,” Journal of the Optical Society of America 69, 1183–1186 (1979). [DOI] [PubMed] [Google Scholar]
- 42.Webster MA, Miyahara E, Malkoc G, and Raker VE, “Variations in normal color vision. II. Unique hues,” Journal of the Optical Society of America. A, Optics, image science, and vision 17, 1545–1555 (2000). [DOI] [PubMed] [Google Scholar]
- 43.Krauskopf J, Williams DR, Mandler MB, and Brown AM, “Higher order color mechanisms,” Vision research 26, 23–32 (1986). [DOI] [PubMed] [Google Scholar]
- 44.Webster MA, De Valois KK, and Switkes E, “Orientation and spatial-frequency discrimination for luminance and chromatic gratings,” Journal of the Optical Society of America. A, Optics and image science 7, 1034–1049 (1990). [DOI] [PubMed] [Google Scholar]
- 45.Chauhan T, Perales E, Xiao K, Hird E, Karatzas D, and Wuerger S, “The achromatic locus: effect of navigation direction in color space,” Journal of vision 14:1:25, 1–11 (2014). [DOI] [PMC free article] [PubMed]
- 46.Chichilnisky EJ and Wandell BA, “Photoreceptor sensitivity changes explain color appearance shifts induced by large uniform backgrounds in dichoptic matching,” Vision research 35, 239–254 (1995). [DOI] [PubMed] [Google Scholar]
- 47.D’Zmura M and Lennie P, “Mechanisms of color constancy,” Journal of the Optical Society of America. A, Optics and image science 3, 1662–1672 (1986). [DOI] [PubMed] [Google Scholar]
- 48.Foster DH and Nascimento SM, “Relational colour constancy from invariant cone-excitation ratios,” Proceedings. Biological sciences / The Royal Society 257, 115–121 (1994). [DOI] [PubMed] [Google Scholar]
- 49.Dixon EL and Shapiro AG, “Spatial filtering, color constancy, and the color-changing dress,” Journal of vision 17, 7 (2017). [DOI] [PubMed] [Google Scholar]
- 50.Anderson BL and Winawer J, “Image segmentation and lightness perception,” Nature 434, 79–83 (2005). [DOI] [PubMed] [Google Scholar]
- 51.Anderson BL, “The perceptual representation of transparency, lightness, and gloss,” in Oxford Handbook of Perceptual Organization, Wagemans J, ed. (Oxford University Press, 2015). [Google Scholar]
- 52.Poirson AB and Wandell BA, “Pattern-color separable pathways predict sensitivity to simple colored patterns,” Vision research 36, 515–526 (1996). [DOI] [PubMed] [Google Scholar]
- 53.Mullen KT, “The contrast sensitivity of human colour vision to red-green and blue-yellow chromatic gratings,” The Journal of physiology 359, 381–400 (1985). [DOI] [PMC free article] [PubMed] [Google Scholar]
- 54.Legge GE and Foley JM, “Contrast masking in human vision,” Journal of the Optical Society of America 70, 1458–1471 (1980). [DOI] [PubMed] [Google Scholar]
- 55.Chen C, Foley JM, and Brainard DH, “Detection of chromoluminance patterns on chromoluminance pedestals I: threshold measurements,” Vision research 40, 773–788 (2000). [DOI] [PubMed] [Google Scholar]
- 56.Webster MA and Mollon JD, “The influence of contrast adaptation on color appearance,” Vision research 34, 1993–2020 (1994). [DOI] [PubMed] [Google Scholar]
- 57.Li A and Lennie P, “Mechanisms underlying segmentation of colored textures,” Vision research 37, 83–97 (1997). [DOI] [PubMed] [Google Scholar]
- 58.Sankeralli MJ and Mullen KT, “Postreceptoral chromatic detection mechanisms revealed by noise masking in three-dimensional cone contrast space,” Journal of the Optical Society of America. A, Optics, image science, and vision 14, 2633–2646 (1997). [DOI] [PubMed] [Google Scholar]
- 59.Webster J, Kay P, and Webster MA, “Counting colors,” Journal of vision 13, T29–T29 (2013). [Google Scholar]
- 60.Kuriki I, “Testing the Possibility of Average-Color Perception from Multi-Colored Patterns,” Optical Review 11, 249–257 (2004). [Google Scholar]
- 61.Kimura E, “Averaging colors of multicolor mosaics,” Journal of the Optical Society of America. A, Optics, image science, and vision 35, B43–B54 (2018). [DOI] [PubMed] [Google Scholar]
- 62.Wollschlager D and Anderson BL, “The role of layered scene representations in color appearance,” Current biology : CB 19, 430–435 (2009). [DOI] [PubMed] [Google Scholar]
- 63.Toscani M, Valsecchi M, and Gegenfurtner KR, “Optimal sampling of visual information for lightness judgments,” Proceedings of the National Academy of Sciences of the United States of America 110, 11163–11168 (2013). [DOI] [PMC free article] [PubMed] [Google Scholar]


