

ABSTRACT
Artificial sweeteners have been shown to induce glucose intolerance by altering the gut microbiota; however, little is known about the effect of stevia. Here, we investigate whether stevia supplementation induces glucose intolerance by altering the gut microbiota in mice, hypothesizing that stevia would correct high fat diet-induced glucose intolerance and alter the gut microbiota. Mice were split into four treatment groups: low fat, high fat, high fat + saccharin and high fat + stevia. After 10 weeks of treatment, mice consuming a high fat diet (60% kcal from fat) developed glucose intolerance and gained more weight than mice consuming a low fat diet. Stevia supplementation did not impact body weight or glucose intolerance. Differences in species richness and relative abundances of several phyla were observed in low fat groups compared to high fat, stevia and saccharin. We identified two operational taxonomic groups that contributed to differences in beta-diversity between the stevia and saccharin groups: Lactococcus and Akkermansia in females and Lactococcus in males. Our results demonstrate that stevia does not rescue high fat diet-induced changes in glucose tolerance or the microbiota, and that stevia results in similar alterations to the gut microbiota as saccharin when administered in concordance with a high fat diet.
Keywords: gut microbiota, 16S rRNA, glucose tolerance, saccharin, Lactococcus, SIMPER, PERMANOVA
Stevia, a non-caloric sweetener, alters the gut microbiota, but does not influence glucose intolerance in the obese mouse.
INTRODUCTION
More than one-third of Americans are overweight or obese (Ogden et al. 2015), leading the United States Surgeon General to declare obesity as the most important public health epidemic of our time (Surgeon General 2001). Emerging evidence strongly implicates an important role for the gut microbial community, or microbiota, in the etiology of obesity. For example, obesity is transferable via microbiota transfer (Turnbaugh et al. 2008; Ridaura et al. 2013), the transfer of lean microbiota to obese patients improves insulin sensitivity (Vrieze et al. 2012), and microbiota diversity is associated with improved insulin resistance (Cani et al. 2007; Vrieze et al. 2012).
Paralleling the rise in obesity has been the inclusion of non-caloric artificial sweeteners (NAS) in dietary intake. Recent research suggests that consumption of NAS may actually contribute to the development of obesity and metabolic disease (Fowler 2016). The effects of NAS are in part mediated by the microbiota, as diet is a known mediator of microbiota composition and function (David et al. 2013; Zhao et al. 2018). NAS consumption (saccharin, sucralose or aspartame) leads to increased glucose intolerance in mice as compared to those fed glucose or sucrose, irrespective of whether mice consume a high fat diet or normal chow; importantly, antibiotic treatment eliminates this difference (Suez et al. 2014). While numerous NAS have been shown to induce glucose intolerance, only saccharin, sucralose and stevia consumption are known to alter microbiota composition as well (Ruiz-Ojeda et al. 2019). In particular, saccharin induces dysbiosis (Suez et al. 2014; Bian et al. 2017), an effect that may exacerbate glucose intolerance.
While NAS consumption is associated with negative consequences, the metabolic impact of naturally-occurring non-caloric sweeteners like stevia is currently unclear. The plant Stevia rebaudiana Bertoni has been used by indigenous South American populations for centuries as a food sweetener and medicine, as it is known for its antibacterial and antifungal properties (Lemus-Mondaca et al. 2012; Magnuson et al. 2016; Marcinek and Krejpcio 2016; Wang et al. 2018); however, it has only recently been incorporated into the diets of developed countries. Stevia glycosides may assist with glycemic control by improving glucose tolerance (Curi et al. 1986; Gregersen et al. 2004; Anton et al. 2010; Kujur et al. 2010; Assaei et al. 2016; Ritu and Nandini 2016) and insulin sensitivity (Chang et al. 2005; Mohd-Radzman et al. 2013; Aghajanyan, Movsisyan and Trchounian 2017), although the exact mechanism is not known. It is known that the gastrointestinal tract is an important interpolator in glycemic control, relaying nutrient intake to the brain via the gut–brain axis (Cummings and Overduin 2007). Nutrients may act alone or trigger the production of gut peptides from enteroendocrine cells lining the gut lumen to act as signal molecules in an endocrine or paracrine manner (Duca et al. 2015). It has been suggested that stevia may act as a ligand for insulin receptors in the intestinal tract, thus increasing glucose uptake by increasing GLP-1 (Glucagon-like peptide 1) release from enteroendocrine cells lining the small intestine (Ripken et al. 2014; van der Wielen et al. 2016) and potentiating insulin release, feelings of increased satiety and probable weight loss (Prata et al. 2017). Stevia may also act to increase insulin release by activating TRPM5 (Transient receptor potential channel M5) ion channels found in type II taste receptors (Philippaert et al. 2017). This subset of taste receptors are expressed by enteroendocrine cells in the small intestine, as well as on the tongue and in pancreatic ß-cells in the liver, and have been shown to determine the activation of glucose-induced insulin release (Colsoul et al. 2010; Philippaert et al. 2017). Such effects on glycemic control suggest that stevia may aid in the management of obesity and associated metabolic syndrome, positioning stevia as a potentially safer NAS compared to saccharin.
Stevia metabolism is dependent upon the gut microbiota because mammalian host enzymes are incapable of degrading stevia glycosides, whereas microbial enzymes have been shown to degrade stevia glycosides into steviols that can be absorbed by the host (Hutapea et al. 1997; Nikiforov et al. 2013). However, the effects of stevia on the gut microbiota remains poorly studied. Given the effect of both high fat diet and NAS consumption on shaping the microbiota, and the deleterious effects such alterations can pose to an individual's metabolic health, this study sought to characterize the effect of stevia on glycemic response and the microbiota using a murine model. We hypothesized that chronic consumption of stevia in C57BL/6 J mice would correct high fat diet-induced glucose intolerance and induce demonstrable shifts in the microbiota.
METHODS
Study design
C57BL/6 J mice (n = 40) from Jackson Laboratory (Bar Harbor, ME, USA) were randomly assigned to cages and individually housed at 23°C on a 12 hour light/dark cycle throughout the experiment. Individuals were randomly assigned (unblinded) to one of four treatment groups, each consisting of 10 animals (5 males, 5 females). These included groups consuming (Fig. 1): (i) low fat (low fat food and drinking water), (ii) high fat (high fat food and drinking water), (iii) saccharin (high fat food and drinking a saccharin solution), and (iv) stevia (high fat food and drinking a stevia solution). Throughout this study, we will refer to these four different groups as different ‘treatments.’ The term ‘diet’ will reference whether individuals received low fat or high fat food, regardless of their consumed liquid.
Figure 1.

Experimental design.
Before beginning treatment, animals were allowed to acclimate for 8 days while consuming a low fat diet (Research Diets formula D12450B, New Brunswick, NJ, USA). Baseline body weight, food intake and water consumption were determined each day for each animal. After the acclimation period, the low fat group continued to consume a low fat diet while high fat, saccharin and stevia groups were placed on a high fat diet (Research Diets formula D12492). After 6 days, saccharin and stevia groups were provided with a saccharin or stevia solution in their water bottle, whereas low fat and high fat groups continued drinking water. Saccharin was used as a positive NAS control because it is a well-studied NAS with demonstrated negative health effects that may be more acute than other NAS (Suez et al. 2014). One female mouse from the stevia group did not adjust to the high fat diet and refused food, dying in the third week of treatment. We did not believe this death was caused by the stevia supplementation and this animal was not included in statistical analyses. The treatments lasted 10 weeks, during which time food intake, body weight and liquid consumption were measured tri-weekly.
The Williams College Institutional Animal Care and Use Committee approved this study (protocol # SS-P-17). All experiments were performed in accordance with the guidelines described by the US National Institutes of Health Guide for the Care and Use of Laboratory Animals.
Sweeteners
Saccharin (98% purity) was obtained from Sigma Aldrich (St. Louis, MO, USA) (product code: 1 002 359 797, lot # MKCB3758). Powdered organic stevia leaf extract was bought commercially (SweetLeaf, Gilbert, AZ, USA, lot #6 060 417). Dosage was calculated to reflect the United States Federal Drug Administration's (FDA) allowable daily intake (5 mg/kg) (Hsieh et al. 2003). These dosages were calculated by group as follows: allowable daily intake was multiplied by the average mouse weight of saccharin or stevia groups, then divided by the average daily liquid intake of the group. Dosages were recalculated each week to reflect changes in weight gain and liquid consumption.
To account for bias caused by liquid lost due to handling, we set up five empty cages with control water. Each time a treatment group's water was measured, we also measured changes in control water weight. We attributed these changes to evaporation and handling. This amount was averaged between the empty cages to calculate the average water loss, which was subtracted from the liquid weight of the treatment groups to determine the amount lost solely to drinking.
Glucose tolerance
Glucose tolerance tests were conducted before and after 10 weeks of the treatments (Fig. 1). Ten animals were randomly selected to establish a baseline area under the curve (AUC) prior to the start of the high fat diet and all animals were tested post-treatment. On the day of the test, fresh glucose solution was prepared (2 g of glucose dissolved in a final volume of 10 mL of sterile saline). Animals were weighed and then fasted for 6 hours during their light phase in a fresh cage with water (or sweetener solution) ad libitum. Following the fast, animal tails were nipped with a surgical blade and a drop of blood was placed on a glucometer test strip (Nova Max product code #3, Bellerica, MA, USA) to obtain the fasting blood glucose concentration prior to injection. Animals were then injected intraperitoneally with 1 mg glucose per kg body weight. Blood glucose was measured with a glucometer at 0, 15, 30, 60, 90 and 120 min in the initial phase (before treatment) and at 0, 20, 40, 60, 90 and 120 min post-treatment. Due to the greater number of animals in the post-treatment testing, a longer time interval was needed to measure all the individuals before beginning the next round. Mice were returned to their treatment diet following testing. The AUC was calculated in Excel by adding two consecutive data points, dividing by two, and multiplying by the difference in time per the formula ((B1+B2)/2)x(A2−A1), where column A contains the time in minutes and column B contains the blood glucose measurement at that time. This formula was applied to the full duration of the blood glucose test and values were summed to calculate total AUC.
Microbiota sample collection and sequencing
Fecal samples were collected from cages prior to beginning the high fat diet (pre-treatment: 14 days after animals had been established in our facility) and at the end of the 10-week treatment (post-treatment). Fecal pellets were removed from the bottom of cages using forceps and stored at −80°C until processing. Samples were processed frozen using the QIAamp Fast DNA Stool Mini Kit according to the manufacturer's instructions (Qiagen, Venlo, Netherlands). Samples were then shipped to the University of Wisconsin-Madison where DNA was quantified using a Qubit Fluorometer (Invitrogen, San Diego, CA, USA) and stored at −80°C. DNA was diluted to a maximum concentration of 5 ng/μL (due to variation in DNA extraction yield, concentration range = 0.37–5 ng/uL).
PCR (polymerase chain reaction) was performed using universal bacterial primers flanking the 16S rRNA V4 region (Kozich et al. 2013). One PCR reaction was performed for each sample. Each PCR reaction included 5 μL of diluted DNA (total DNA range = 1.87–25 ng), 0.4 μM of each primer, 12.5 μL of 2X HotStart ReadyMix (KAPA Biosystems, Wilmington, MA, USA) and 6.5 μL of water for a total of 25 μL. Cycling conditions included initial denaturation at 95°C for 3 min, 25 cycles of 95°C for 30 s, 55°C for 30 s, 72°C for 30 s, and a final extension at 72°C for 5 min.
PCR products were purified by gel extraction from 1.0% low-melt agarose gel (Gold Biotechnology, Olivette, MO, USA) using a ZR-96 Zymoclean Gel DNA Recovery Kit (Zymo Research, Irvine, CA). Samples were quantified by Qubit Fluorometer and pooled at equal molarities. The pool plus 5% PhiX control DNA was sequenced on an Illumina MiSeq with a MiSeq 2 × 250 bp v2 kit (Illumina, San Diego, CA, USA) using custom sequencing primers (Kozich et al. 2013).
Microbiota sequence clean-up
All sequences were demultiplexed on the Illumina MiSeq. Sequences were processed using mothur v.1.39.5 (Schloss et al. 2009) following the MiSeq standard operating procedure (accessed on Feb 19, 2018). To cluster sequences into operational taxonomic units (OTUs), the average neighbor method was used to cluster sequences with 97% similarity. The SILVA database (release 128) was used for sequence alignment and classification, with the consensus confidence threshold set to 80% (Quast et al. 2013). Samples were normalized to 1907 sequences, which corresponded to the sample with the lowest number of generated sequences. This cutoff was selected based on the sample with the lowest number of sequences that resulted in normalized samples with Good's coverage of ≥95% for all samples, which indicated sufficient sequencing (Good 1953). Fastq files were submitted to the NCBI's Short Read Archive and are publicly available under accession number PRJNA554503. Mothur logfiles and output files are available at https://github.com/ednachiang/Stevia/.
Statistical analysis
AUC was evaluated using SPSS with a 1 × 4 analysis of variance (ANOVA) test followed by a least significant difference alpha post hoc test. Data for caloric intake, AUC and body weight are reported as mean ± standard error of the mean (SEM), with P-values reported in the figure legends. P-values < 0.05 were considered significant. All physiological data were evaluated using SPSS with a 1 × 4 ANOVA followed by a least significant difference alpha post hoc test.
Mothur outputs were imported into R version 3.5.1 (Ihaka and Gentleman 1996) using the phyloseq package (McMurdie and Holmes 2013). All data visualizations were created using the ggplot2 (Wickham 2016), grid (R Core 2018) and extrafont (Chang 2014) packages unless otherwise noted. All code to replicate our microbiota analyses and generate figures is available at https://github.com/ednachiang/Stevia/. We removed four individuals that did not have both a pre- and post-treatment sample due to inability to collect a sample or PCR failure. This ensured sample consistency throughout the analyses because we performed paired tests.
Phylum- and family-level relative abundances were computed using the phyloseq (McMurdie and Holmes 2013) and dplyr (Wickham 2017) packages, grouping samples by treatment and time. Only phyla and families with an average relative abundance >0.1% were considered.
To determine whether samples with low DNA concentration (<1 ng/uL) result in sequence data that are significantly different from samples with high DNA concentrations, we performed a robust two one-sided test (RTOST) of equivalence (rtost, equivalence package (Robinson 2016)) (Yuen and Dixon 1973; Yuen 1974). The RTOST is a nonparametric test with a null hypothesis that two means are not equivalent and an alternative hypothesis that two means are equivalent. We used the RTOST to compare the OTU table of each low DNA concentration sample against the mean OTU table of high DNA concentration samples in the same experimental group (Skarlupka et al. 2019).
The ratio of Firmicutes/Bacteroidetes (F/B ratio) was calculated by dividing the relative abundance of Firmicutes by that of Bacteroidetes. Normality was evaluated using quantile–quantile plots and the Shapiro test (qqnorm, qqline, shapiro.test, stats package (R Core 2018)) to inform what statistical tests would be appropriate. Comparisons within each treatment between pre- and post-treatment timepoints were performed using paired Wilcoxon rank sum tests (wilcox.test, stats package (R Core 2018)). Comparisons between treatments in post-treatment samples were performed using Kruskal–Wallis tests and post hoc comparisons were performed using Wilcoxon rank sum tests with false discovery rate correction using the Benjamini–Hochberg procedure (kruskal.test and pairwise.wilcox.test, stats package (R Core 2018)). To compare F/B ratios in post-treatment samples between high fat diets (high fat, saccharin and stevia treatments) and low fat diet (low fat treatment), we used the Wilcoxon rank sum test (wilcox.test, stats package (R Core 2018)).
We evaluated within-sample diversity (alpha diversity) using the Chao richness metric and Shannon weighted diversity index, which were calculated in mothur (summary.single) (Schloss et al. 2009). Prior to selecting a statistical test, we evaluated normality using quantile–quantile plots and the Shapiro test (qqnorm, qqline, shapiro.test, stats package (R Core 2018)). Because Chao values were not normally distributed, comparisons within each treatment between pre- and post-treatment timepoints were performed using paired Wilcoxon rank sum tests (wilcox.test, stats package (R Core 2018)). Comparisons between treatments were completed using Kruskal–Wallis tests and post hoc comparisons were performed using Wilcoxon rank sum tests with false discovery rate correction using the Benjamini–Hochberg procedure (kruskal.test and pairwise.wilcox.test, stats package (R Core 2018)). As Shannon values were normally distributed, comparisons within each treatment between pre- and post-treatment timepoints were performed using paired Student's t-tests (t.test, stats package (R Core 2018)). Comparisons between treatments were completed using analysis of variance tests and post hoc comparisons were performed using Tukey's honest significant differences tests (aov and TukeyHSD, stats package (R Core 2018)).
We visualized between-sample diversity (beta-diversity) using Bray–Curtis dissimilarity (distance, phyloseq package (McMurdie and Holmes 2013)) and principal coordinate analysis (PCoA) ordinations (ordinate and plot_ordination, phyloseq (McMurdie and Holmes 2013) and ggplot2 (Wickham 2016) packages). To evaluate significance between different samples, we performed permutational multivariate analysis of variance (PERMANOVA) (adonis, vegan package (Oksanen et al. 2014)) with false discovery rate correction using the Benjamini–Hochberg procedure (p.adjust, stats package (R Core 2018)). Due to the observed differences in sex, we analysed sexes separately in subsequent tests. To identify OTUs that contributed to differences in between-sample diversity, we performed similarity percentages analyses (SIMPER; simper, vegan package (Oksanen et al. 2014)) and determined significance using Kruskal–Wallis tests (kruskal.test, stats package (R Core 2018)) with false discovery rate correction using the Benjamini–Hochberg method (p.adjust, stats package (R Core 2018)). OTUs were deemed significant at adjusted P < 0.05, and a trend at 0.10 < adjusted P < 0.05. SIMPER results were visualized in heatmaps using plot_heatmap (phyloseq (McMurdie and Holmes 2013) and ggplot2 (Neuwirth 2014; Wickham 2016) packages).
RESULTS
Stevia does not change caloric consumption on high fat diet or rescue high fat diet-induced glucose intolerance
Neither consumption of saccharin nor stevia led to a change in caloric consumption (Fig. 2A). Over the 10 weeks of sweetener treatment, stevia mice consumed an average of 1244 ± 44 kcalories per animal. This was not significantly different than other mice on a high fat diet, with the high fat treatment group consuming an average of 1312 ± 140 kcalories and saccharin treatment mice consuming 1309 ± 203 kcalories (Fig. 2A). Compared to groups on a high fat diet, the group of mice on a low fat diet consumed significantly more water (P < 0.001); however, this may be due to the higher fiber content of their feed. There was no difference in liquid consumption by groups on high fat diets.
Figure 2.

Physiological effects of stevia treatment. (A) Caloric intake over 10 week treatment indicates that animals on a high fat diet ate significantly more calories than those on a low-fat diet, and that addition of stevia or saccharin to the drinking water of mice on a high fat diet did not influence caloric intake. Graph displays aggregate data of both males and females. * P < 0.05 vs low fat. (B) Mice in the low fat group have significantly lower body weight than any of the mice in the experimental treatments (P < 0.0001). No significant difference was observed between groups on a high fat diet (high fat, saccharin, stevia). (C) Area under the curve (AUC) analysis of glucose tolerance tests in aggregate. All animals on a high fat diet showed elevated AUC when administered a glucose tolerance test (P < 0.0001 males, 0.003 females), and addition of NAS to the drinking water did not significantly affect the AUC vs high fat diet alone. Low fat was significantly lower than all other groups.
Weight gain and glucose tolerance were analysed separately for males and females as male mice tend to be heavier than females. Diet was the strongest driver of weight gain, as all animals on a high fat diet gained more weight compared to those on the low fat diet (ANOVA, P < 0.0001 and 0.003 for males and females respectively). NAS addition to a high fat diet did not lead to a change in body weight as there was no difference in body weight between the high fat, saccharin and stevia groups (Fig. 2B).
Following treatment, glucose tolerance tests were conducted on all animals and the AUC was used to quantify the glucose response. There was no difference in AUC in the low fat group between baseline and the low fat group post-treatment (Fig. 2C). However, there was a significant difference between the low fat group and all groups on the high fat diet when AUC was compared among all groups post-treatment (P < 0.0002) (Fig. 2C). Stevia did not have a significant effect on glucose response, with no differences observed between high fat, saccharin and stevia groups (81 300 ± 3300, 76 200 ± 2800 and 85 800 ± 3400 mg-min/dL, respectively) (Fig. 2C).
Sequence coverage and taxonomy of microbiota analysis
We collected 79 fecal samples, of which 76 were successfully sequenced using Illumina MiSeq. This generated a total of 1 855 724 raw sequences for an average of 24 417 ± 3.447 sequences per sample (mean ± SEM; range = 2388–157 433). Sequence clean-up in mothur resulted in a total of 1 536 889 sequences for an average of 20 222 ± 2858 sequences per sample (range = 1907–130 721). After normalization, the range of reads in our samples was 1863–1937. All samples had Good's coverage ≥95%, which indicated sufficient sequencing (Good 1953).
A total of 431 OTUs were identified among all samples. Samples were dominated by the phyla Firmicutes (45.85 ± 1.54%; mean ± SEM) and Bacteroidetes (42.88 ± 1.57%), with smaller contributions from the Verrucomicrobia (6.12 ± 0.90%), Tenericutes (4.30 ± 0.57%), Proteobacteria (0.55 ± 0.07%) and Actinobacteria (0.29 ± 0.06%) (Figure 3).
Figure 3.
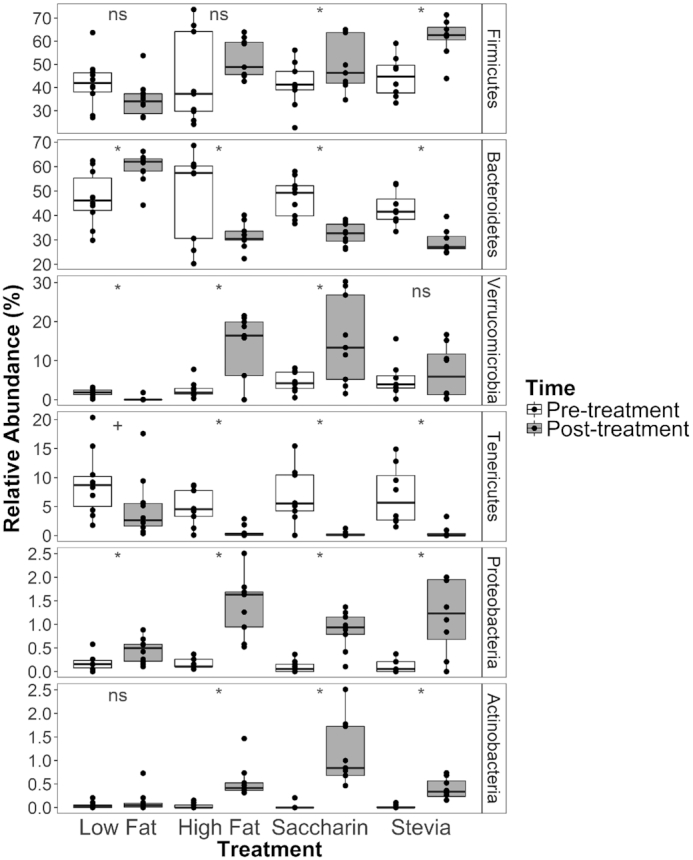
Mean relative abundance of phyla in samples categorized by treatment and time. Illustrated phyla have an average relative abundance >0.1% across all samples. Samples are categorized by treatment (horizontal) and colored by time, with pre-treatment samples as white and post-treatment samples as gray. Phyla are listed in order of highest to lowest average relative abundance and error bars represent the standard error. An increase in F/B ratio can be seen in all groups on a high fat diet in the post-treatment measurement. Annotations above the boxplots represent comparisons between pre- and post-treatment samples within each of the four treatment groups: an asterisk represents adjusted P < 0.05, a plus sign represents adjusted P = 0.05, and ‘ns’ represents adjusted P > 0.05 as compared by paired Wilcoxon ranked sums tests.
Low DNA concentration does not bias sample composition
Because low DNA concentration is known to bias microbiota sequencing (Multinu et al. 2018), we tested samples with <1 ng/uL DNA against other replicate samples with >1 ng/uL DNA. Five of the 76 samples were identified with low DNA concentration (Supplementary Table S5, see online supplementary material), all belonging to the post-treatment stevia samples (two males and three females). Using the robust RTOST of equivalence, we compared the OTU table of each low DNA concentration sample against the OTU table of its high DNA concentration counterpart(s). In both females and males, the RTOST was significant (all P < 0.001), allowing for a rejection of the null hypothesis and the acceptance of the alternative hypothesis that each low DNA concentration sample is statistically equivalent to the high DNA concentration samples within the same group. We further confirmed our RTOST results by examining the taxonomic composition of samples at the phylum and family levels (Supplementary Figures S2 and S3, respectively, see online supplementary material) and found that the phyla and family compositions in the low DNA concentration samples are similar to those in the high DNA concentration samples.
To visually confirm our RTOST results, we examined the taxonomic composition of samples at phylum- and family-levels (Supplementary Figures S2 and S3, respectively). The phyla and families in low DNA concentration samples are very similar to those in high DNA concentration samples. Combined, these results provide strong evidence that the microbiota of low DNA concentration samples do not represent contamination from the extraction kit, but rather represent the murine microbiota.
High fat diet drives phyla-level differences more than NAS treatment
To examine how each treatment influenced the microbiota, we compared phyla relative abundances in pre- versus post-treatment samples. We found differences in the dominant phyla Firmicutes and Bacteroidetes (Fig. 3). The relative abundance of Firmicutes was significantly higher in saccharin and stevia post-treatment samples when compared to their respective pre-treatment samples (paired Wilcoxon, adjusted P = 0.035 and 0.018, respectively). However, there was no change in low fat (adjusted P = 0.121) or high fat samples (adjusted P = 0.179). The relative abundance of Bacteroidetes was significantly higher in pre-treatment high fat, saccharin and stevia samples when compared to their respective post-treatment samples (adjusted P = 0.019, 0.010 and 0.018, respectively). The opposite was true of low fat samples (adjusted P = 0.011).
We also observed differences in the less dominant phyla: Verrucomicrobia, Tenericutes, Proteobacteria and Actinobacteria (Fig. 3). The relative abundance of Verrucomicrobia in high fat and saccharin pre-treatment samples was lower than that of the respective post-treatment samples (adjusted P = 0.018 and 0.026, respectively). However, the opposite was found in low fat samples (adjusted P = 0.011) and there was no change in stevia samples (adjusted P = 0.64). The relative abundance of Tenericutes decreased in post-treatment samples compared to pre-treatment samples. This change was significant in high fat (adjusted P = 0.018), saccharin (adjusted P = 0.010) and stevia (adjusted P = 0.010) groups. Low fat samples demonstrated a trend of decreased Tenericutes in post-treatment samples compared to pre-treatment (adjusted P = 0.050). The opposite was observed for Proteobacteria, whose relative abundance increased over the course of treatment in pre- compared to post-treatment samples (adjusted P = 0.010 (low fat), 0.010 (high fat), 0.010 (saccharin) and 0.018 (stevia)). Actinobacteria in high fat, saccharin and stevia treatments had higher relative abundance in post- versus pre-treatment (all adjusted P = 0.010) but there was no change in low fat samples (adjusted P = 0.64).
Both stevia and saccharin alter F/B ratio
We then performed additional analyses on the phyla Firmicutes and Bacteroidetes because the ratio of these two taxa have been correlated with obesity (Ley et al. 2006; Koliada et al. 2017; Riva et al. 2017). We focused our analysis on post-treatment samples to identify differences caused by low versus high fat diets. The F/B ratio was significantly higher in high fat diet samples after treatment (1.81 ± 0.10; mean ± SEM) compared to low fat diet samples (0.61 ± 0.07) (Wilcoxon test, P = 4.72e-08). Within high fat diet treatments, the F/B ratio was significantly higher in post-treatment saccharin and stevia samples compared to their respective pre-treatment samples (Paired Wilcoxon test, both adjusted P = 0.016); however, there was no difference in high fat samples (adjusted P = 0.25). In contrast, the F/B ratio decreased in the low fat group when comparing pre versus post samples (Paired Wilcoxon test, adjusted P = 0.018).
OTU richness differs between post-treatment low fat and high fat diet samples
Within-sample diversity (alpha diversity) was evaluated using two metrics: Chao richness (Chao 2016) and Shannon's index (Shannon 1948). We used Chao richness to estimate the number of all OTUs in samples from individual mice at pre- and post-treatment timepoints and found that post-treatment groups were significantly different (Kruskal–Wallis, P = 0.004) while pre-treatment groups were not (P = 0.473) (Fig. 4). Within post-treatment samples, low fat diet had significantly higher Chao richness compared to high fat diet, saccharin or stevia groups (Wilcoxon, respective adjusted P = 0.007, 0.004 and 0.009). When comparing pre- and post-treatment samples within each treatment, only the high fat group had a significant change in Chao richness (Paired Wilcoxon, adjusted P = 0.016).
Figure 4.

Chao richness is different in post-treatment samples. Samples from individual mice at pre- and post-treatment timepoints are separated by time (horizontal) and colored by treatment. Chao richness estimates the number of all OTUs in a sample. Pre-treatment samples were not significantly different (‘ns’; Kruskal–Wallis, P = 0.473). In post-treatment samples, samples labeled ‘a’ are significantly different from those labeled ‘b’. Post-treatment high fat, saccharin and stevia samples had significantly lower richness than that of low fat (Wilcoxon, adjusted P < 0.01). When comparing pre- and post-treatment samples within each treatment, richness decreased for high fat samples (Paired Wilcoxon, adjusted P = 0.016) but not for low fat (adjusted P = 0.432) or NAS treatments (saccharin adjusted P = 0.074, stevia adjusted P = 0.313).
We also evaluated within-sample diversity using Shannon's index, a weighted diversity metric that considers both the presence/absence and the relative abundance of OTUs. No significant differences were detected, suggesting that differences in within-sample diversity were driven by the number of unique OTUs rather than their relative abundances.
Between-sample diversity differs by sex and treatment
To determine the contribution of different categorical factors to between-sample diversity (beta diversity), we calculated Bray–Curtis dissimilarity, performed multifactorial PERMANOVA separately for each treatment, and tested for time, sex and individual (to account for paired samples). In all treatments, time was significant and explained the most variability in between-sample diversity (PERMANOVA, all P = 0.002; R2 = 0.202 (low fat), 0.484 (high fat), 0.437 (saccharin) and 0.481 (stevia)) (Fig. 5A). In low fat, saccharin and stevia samples, sex was significant and explained less variability than time (low fat P = 0.002, R2 = 0.143; saccharin P = 0.029, R2 = 0.099; stevia P = 0.029, R2 = 0.111). Sex was a trend in high fat samples (P = 0.057, R2 = 0.084). Individuals (to account for paired samples) were not significant in any treatment (all P > 0.363).
Figure 5.
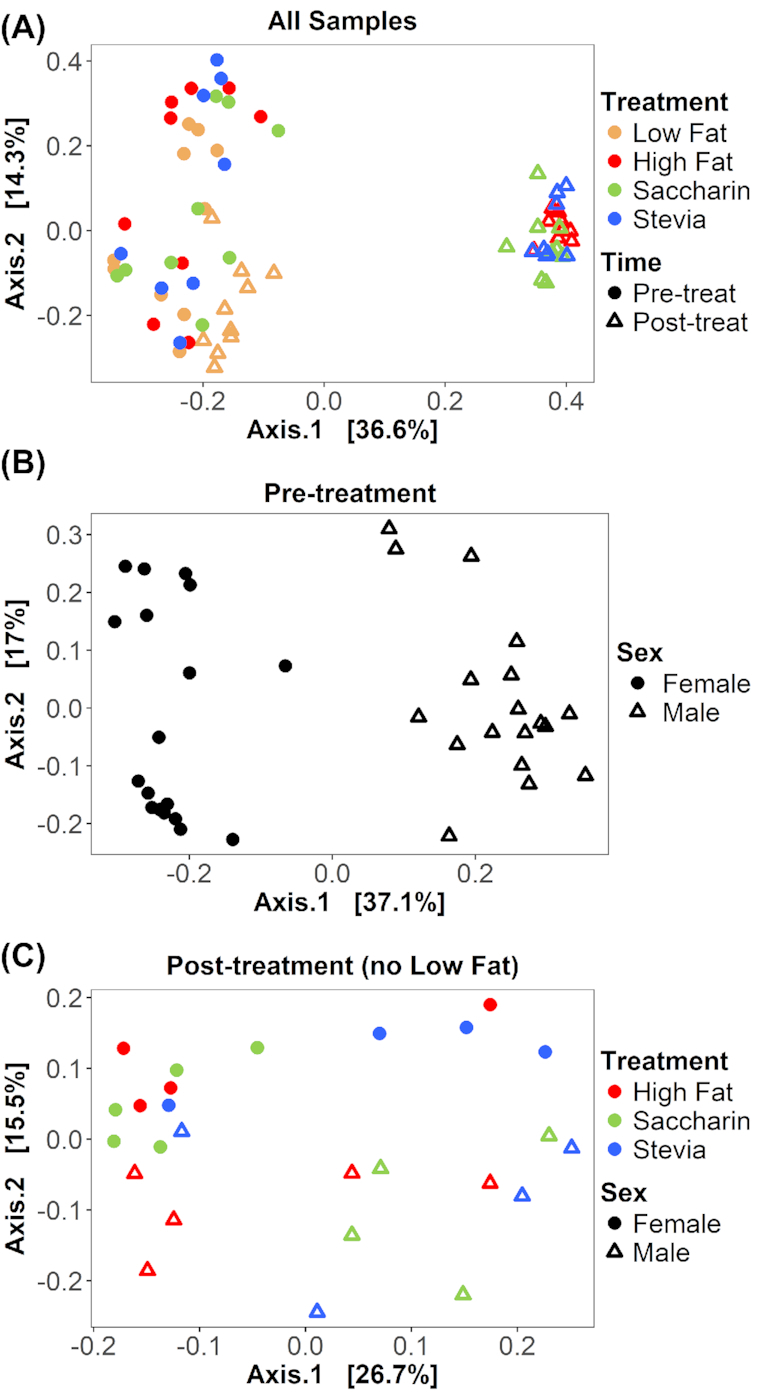
Between-sample diversity is different between time, sex and treatment. Bray–Curtis dissimilarity is visualized on principal coordinate analysis (PCoA) ordinations. (A) All 72 samples from 36 individuals are displayed, with treatment represented by color and time (pre-treatment or post-treatment) represented by shape. With each treatment, all pre-treatment samples are significantly different from post-treatment samples (PERMANOVA, all adjusted P = 0.002). Notably, low fat post-treatment samples cluster distinctly from all other post-treatment samples. (B) Only 36 pre-treatment samples are displayed, with sex distinguished by shape. Sex is significantly different in pre-treatment samples (adjusted P = 0.001). (C) Only post-treatment samples from high fat diets (high fat, saccharin and stevia) are displayed (n = 26), with treatment represented by color and sex represented by shape. There is no significant difference between all high fat and all saccharin samples (adjusted P = 0.188) nor between all high fat and all stevia samples (adjusted P = 0.351). However, all saccharin and all stevia samples are significantly different (adjusted P = 0.039). When considering sex-driven differences, saccharin and stevia were significantly different in females (adjusted P = 0.048) but not males (adjusted P = 0.444).
Because sex was significant in most treatments, we compared sex differences in pre- and post-treatment samples. Sex was significantly different in pre-treatment samples (adjusted P = 0.001, R2 = 0.344) (Fig. 5B) but not post-treatment samples (adjusted P = 0.166, R2 = 0.041). However, when examining post-treatment samples separately within each treatment, sex was significantly different in saccharin samples (adjusted P = 0.040, R2 = 0.311) but not in other treatments (all adjusted P = 0.172).
To compare the effects of different treatments on between-sample diversity, we examined all post-treatment samples and found that treatment led to significantly different between-sample diversity (adjusted P = 0.001, R2 = 0.474). Specifically, low fat was significantly different from all high fat diet treatments (high fat adjusted P = 0.002, R2 = 0.482; saccharin adjusted P = 0.002, R2 = 0.445; stevia adjusted P = 0.002, R2 = 0.459). Within high fat diets, there was no significant difference between high fat and saccharin or stevia samples (adjusted P = 0.188 and 0.351, respectively) (Fig. 5C). However, saccharin and stevia were significantly different (R2 = 0.122, adjusted P = 0.039). Given the observed sex-driven differences, we also performed these post-treatment comparisons separately for each sex. The aforementioned results were all true for each sex, except for the comparison between saccharin and stevia. Saccharin and stevia groups had significantly different between-sample diversity in females (adjusted P = 0.048, R2 = 0.297) but not males (adjusted P = 0.444, R2 = 0.150).
Few OTUs shape the overall bacterial community between treatment groups
To determine which OTUs significantly contributed to the differences in between-sample diversity, we performed SIMPER analyses. We examined sexes separately due to the aforementioned sex-driven differences and identified significantly different OTUs in pre- versus post-treatment samples within each treatment. In females, nine significant OTUs were identified, with one additional OTU identified as a trend (Supplementary Figure S3A). In males, 10 significant OTUs were identified (Supplementary Figure S3B). Only three OTUs were shared between the sexes (Supplementary Tables S2 and S3, see online supplementary material). These three OTUs belonged to the phylum Firmicutes and their most resolved taxonomic classifications were to the family Lachnospiraceae and the genera Ruminiclostridium and Lactococcus.
We next identified OTUs in post-treatment samples that were significantly different between treatments. While females had eight significant OTUs, males had no significant OTUs although seven were identified as trends (Fig. 6A and B). Of these OTUs, five were shared between the sexes (Supplementary Tables S4 and S5, see online supplementary material). The most resolved taxonomic classification of these shared OTUs were to the families S24–7 and Lachnospiraceae and the genera Akkermansia, Ruminiclostridium and Lactococcus. In both sexes, almost all different OTUs were identified in comparisons between low fat samples and high fat diet samples, suggesting these differences were primarily driven by diet rather than treatment.
Figure 6.

Mean relative abundances of OTUs that significantly contribute to between-sample diversity. OTUs were identified using SIMPER and classification is shown for the most resolved taxonomic level. The heatmaps represent comparisons of treatment groups in post-treatment samples for females (A) and males (B). Annotations represent significant results for the following comparisons: A = low fat versus high fat, B = low fat versus saccharin, C = low fat versus stevia, D = saccharin versus stevia. Uppercase letters represent significance (adjusted P < 0.05) and lowercase letters represent a trend (0.10 > adjusted P > 0.05). Females had eight significant OTUs while males had seven trending OTUs. Almost all significant OTUs were identified in comparisons between low fat and high fat diet samples. Two OTUs contributed to differences between saccharin and stevia samples: one Lactococcus species and one Akkermansia species.
In females, a comparison of low fat versus high fat groups identified seven significant OTUs (29.75%; % of variation in between-sample diversity explained by these OTUs) (Fig. 6A). The low fat group compared to the saccharin group had four significant OTUs (26.36%), while low fat and stevia groups had six significant OTUs (28.06%) and one trending OTU (significant and trending OTUs = 32.28%) (Fig. 6A). Comparison between saccharin and stevia identified one significant OTU (6.04%) and one trending OTU (significant and trending OTUs = 24.09%), which were respectively classified to the genera Lactococcus and Akkermansia (Fig. 6A).
In males, comparison of low fat versus high fat groups identified five OTUs trends (19.81%) (Fig. 6B). Low fat and saccharin groups also had five OTUs (18.66%), three of which were shared with the low fat versus high fat comparison (Fig. 6B). Low fat and stevia had seven OTUs (28.97%), while saccharin and stevia had one OTU (genus Lactococcus) (6.77%) (Fig. 6B).
DISCUSSION
This study presents the first in vivo characterization of the effect of stevia on the gut microbiota using amplicon sequencing and extends our understanding of stevia's effect on glucose intolerance. We found that stevia was unable to rescue high fat diet-induced glucose intolerance or alter caloric intake, weight gain or liquid consumption in mice. Differences in microbiota within- and between-sample diversity were driven primarily by differences in low versus high fat diet, rather than NAS supplementation. Together, these results suggest that on a high fat diet, stevia consumption produces similar physiological and microbiological results as other NAS such as saccharin.
Diet was the strongest driver of weight gain, caloric intake and glucose tolerance. Mice on a high fat diet gained significantly more weight, consumed more calories and had higher glucose intolerance compared to mice on a low fat diet (Fig. 2). Addition of the sweeteners to the drinking water did not influence total caloric intake or total liquid consumption by the groups on a high fat diet.
There were no differences in glucose intolerance between the three high fat diet treatments (high fat, saccharin and stevia). Our results are in contrast to previous work that demonstrated a distinct increase in glucose intolerance by saccharin compared to a high fat diet alone (Suez et al. 2014). However, rodent and human models of NAS consumption have produced mixed results: saccharin consumption causes increased weight gain in some studies while others report that saccharin relieves weight gain and exerts anti-hyperglycemic effects in both diet (Mitsutomi et al. 2014) and genetically induced models of obesity (Bailey et al. 1997). These seemingly contradictory results have been attributed to differences in methodology and animal husbandry, which are hypothesized to cause changes in microbiome composition and function, thus leading to discrepancies in glucose tolerance (Suez et al. 2015). An individual's inflammatory phenotype (Rodriguez-Palacios et al. 2018) and diet (Zeevi et al. 2015; Desai et al. 2016) may also influence how they respond to NAS-induced microbiota changes, thereby leading to different effects of NAS in human populations. It should also be noted that due to small sample sizes, we have low power to detect differences that may exist; therefore, we caution readers that the lack of evidence for a difference cannot be taken to be mean that there is no difference.
We concentrated our phyla-level microbiota analyses on the Firmicutes and the Bacteroidetes as the ratio of these two taxa has been used in obesity studies. While the relative contribution of the F/B ratio remains controversial in the pathophysiology of obesity (Schwiertz et al. 2010), some studies have correlated a higher F/B ratio with obesity (Ley et al. 2006; Koliada et al. 2017; Riva et al. 2017), an increased capacity for energy harvest (Turnbaugh et al. 2006) and a greater ability to absorb fatty acids (Semova et al. 2012). We found that F/B ratio was significantly higher in high fat diet samples than in low fat diet samples, consistent with previously published mouse studies (Xiao et al. 2017), though there is some controversy surrounding the attribution of decreased Bacteroidetes to a high fat diet (Cani et al. 2008; Duncan et al. 2008; Daniel et al. 2014). The F/B ratio in the low fat group decreased from pre-treatment to post-treatment. However, within groups on a high fat diet, only saccharin and stevia groups increased their F/B ratio despite mice in the high fat group having similar body weights. The differences in F/B ratios could also be attributed to factors other than chow caloric or fat content, such as nutrient composition or bacterial load. Our results highlight the controversial relationship between F/B ratio and obesity as we did not identify a clear link between F/B ratio and weight.
Similar to the effect of diet on host physiology, we found that microbiota diversity was most strongly influenced by diet. High fat diet caused a significant decrease in within-sample richness compared to the low fat diet; however, there was no difference in within-sample richness between groups on a high fat diet. Likewise, between-sample diversity was significantly different between high fat and low fat diet treatments, but there was no difference in between-sample diversity within high fat diet treatments. Furthermore, we identified only two OTUs that significantly contributed to differences in between-sample diversity of high fat diet post-treatment samples. Of these OTUs, one classified to the genus Akkermansia, which is thought to protect against high fat diet-induced obesity and is typically inversely associated with obesity (Cani and de Vos 2017). However, it has been suggested that increased Akkermansia abundance due to a high fat diet may help to counteract the inflammation induced by a high fat diet (Xiao et al. 2017). This is consistent with our finding that the vast majority of significant OTUs in this study contributed to differences between low fat samples and samples from groups on a high fat diet. These results highlight the influential impact of diet on the microbiota and indicate that stevia does not rescue high fat diet-induced changes to the microbiota.
In addition to diet, we also found that sex was an important driver of between-sample diversity. Sex was significantly different in pre-treatment samples and in saccharin post-treatment samples. Within all post-treatment samples, saccharin and stevia were distinct in females but not males. A similar result was found when identifying OTUs that significantly contributed to differences in between-sample diversity. We identified significant OTUs when comparing different post-treatment samples in females, but not males. Such sex-specific effects are in agreement with previous research that found differences in both baseline microbiota composition and in response to a high fat diet between male and female mice (Bridgewater et al. 2017). Our observed sex-specific effects of NAS on the microbiota highlights a need to consider sex-mediated microbiota differences and encourages the continued use of both males and females in microbiota studies utilizing animal models.
Another important experimental design consideration we identified was acclimation time or feed lots. We observed differences between low fat pre- and post-treatment samples, which suggest that at the beginning of the experiment, an individual's gut microbiota had not yet reached a steady state despite being fed a low fat diet for 2 weeks. Alternatively, if the low fat diet consisted of different lots over the 10 week experiment, these changes could be attributed to variation in lot.
We identified few OTUs in females and males that significantly contributed to differences in between-sample diversity. These OTUs explained <33% of this diversity, suggesting that analyses at higher taxonomic levels may be more appropriate in identifying differences between samples. We note that the SIMPER test used to generate these results does not account for compositional bias, so our findings do not represent differences in absolute abundance. Our results are in contrast with previous work that identified at least 40 OTUs that contributed to dysbiotic signatures in male saccharin-fed mice (Suez et al. 2014). This discrepancy is likely due to differences in experimental and statistical methodology. We note that this previous study did not indicate the supplier for their mice, so there is a possibility that our study used mice from a different supplier. Additionally, the previous study analysed changes in relative abundances whereas our study tested contributions to between-sample diversity.
We examined differences between the two NAS treatments (saccharin and stevia) and identified only two OTUs that contributed to differences between saccharin and stevia post-treatment samples. One Lactococcus species had higher relative abundance in stevia compared to saccharin samples; this was significant in females and a trend in males. There are conflicting reports of Lactococcus in association with diseases such as obesity. One study found Lactococcus to not differ between fecal samples from obese and non-obese human patients (Million et al. 2012). In contrast, a study of diet-induced lean and obese mice found Lactococcus relative abundances to be significantly higher in obese individuals (Clarke et al. 2013). Lactococcus in mice is also positively correlated with leptin, a hormone that controls hunger, and inflammatory markers associated with weight gain. Given the contrasting results about Lactococcus and obesity, the potential effect of its higher relative abundance in the stevia group is unclear. We also identified an Akkermansia OTU that was a trend in only females and had higher relative abundance in saccharin compared to stevia. Akkermansia is known to provide protective benefits to the host by strengthening the intestinal barrier (Reunanen et al. 2015; Derrien, Belzer and de Vos 2017). It is also negatively associated with diseases such as type 2 diabetes and obesity (Everard et al. 2013; Schneeberger et al. 2015); however, in some instances Akkermansia has higher relative abundances in patients with these diseases (Collado et al. 2012; Qin et al. 2012). Nevertheless, Akkermansia has not been positively correlated with diseases or pathogenic markers and has also been found to be underrepresented due to saccharin treatment (Suez et al. 2014).
Additional taxa of interest include those identified in culture-based studies that examined human gut microbes capable of degrading stevia glycosides: members of the family Bacteroidaceae (Gardana et al. 2003; Kunova et al. 2014). We did not detect OTUs classified to Bacteroidaceae that significantly contributed to differences between stevia and other groups. This result could be due to the effects of the high fat diet overwhelming the effects of stevia supplementation.
In conclusion, our results demonstrate that stevia supplementation does not prevent high fat diet-induced changes in glucose tolerance and the microbiota. We found that stevia supplementation had similar effects on the host and its microbiota to saccharin, suggesting that stevia performs similarly to other NAS when administered on a high fat diet. We also identified sex-specific changes in the microbiota, highlighting a need to study both males and females in animal microbiota studies. Our study demonstrates that diet is a strong driver of host physiology and microbiota diversity. To better understand the microbiota's response to stevia, future work should also employ omics-based approaches to identify functional changes within the microbiota. Our study is the first analysis employing amplicon sequencing to examine the in vivo response of the murine gut microbiota to stevia supplementation; this work contributes to our understanding of the effect of stevia and NAS supplementation on high fat diet-induced changes in host physiology and microbiota diversity.
Supplementary Material
ACKNOWLEDGEMENTS
The authors would like to acknowledge the animal facility care staff at Williams College for their support in this project. We would also like to thank Joseph H. Skarlupka for sequencing assistance with the microbiota samples.
AUTHOR CONTRIBUTIONS
S.L.B conceived of the experiment, designed and performed experiments, interpreted results and wrote the manuscript. E.C. performed the computational microbiota analysis and statistics, interpreted results and wrote the manuscript. S.J.S. conceived and directed the project, performed experiments and interpreted results. A.P. analysed microbiota data and consulted on statistical analysis. H.V.C. and G.S. consulted on study design and provided sequencing services. All authors read and approved the final manuscript.
FUNDING
This work was supported by the Williams College Biology Department, in addition to a traineeship from the National Institute of General Medical Sciences of the NIH under award number T32GM008349 supporting E.C., the National Institute of Allergy and Infectious Disease of the National Institutes of Health under award number F31AI131595 to A.P., and a National Science Foundation Grant IOS-1 558 044 to H.V.C. and G.S.
Conflict of interest. None declared.
REFERENCES
- Aghajanyan A, Movsisyan Z, Trchounian A. Antihyperglycemic and Antihyperlipidemic Activity of Hydroponic Stevia rebaudiana Aqueous Extract in Hyperglycemia Induced by Immobilization Stress in Rabbits. Biomed Res Int. 2017;2017:9251358. [DOI] [PMC free article] [PubMed] [Google Scholar]
- Anton SD, Martin CK, Han Het al.. Effects of stevia, aspartame, and sucrose on food intake, satiety, and postprandial glucose and insulin levels. Appetite. 2010;55:37–43. [DOI] [PMC free article] [PubMed] [Google Scholar]
- Assaei R, Mokarram P, Dastghaib Set al.. Hypoglycemic Effect of Aquatic Extract of Stevia in Pancreas of Diabetic Rats: PPARgamma-dependent Regulation or Antioxidant Potential. Avicenna journal of medical biotechnology. 2016;8:65–74. [PMC free article] [PubMed] [Google Scholar]
- Bailey CJ, Day C, Knapper JMet al.. Antihyperglycaemic effect of saccharin in diabetic ob/ob mice. Br J Pharmacol. 1997;120:74–78. [DOI] [PMC free article] [PubMed] [Google Scholar]
- Bian X, Tu P, Chi Let al.. Saccharin induced liver inflammation in mice by altering the gut microbiota and its metabolic functions. Food Chem Toxicol. 2017;107:530–9. [DOI] [PMC free article] [PubMed] [Google Scholar]
- Bridgewater LC, Zhang C, Wu Yet al.. Gender-based differences in host behavior and gut microbiota composition in response to high fat diet and stress in a mouse model. Sci Rep. 2017;7:10776. [DOI] [PMC free article] [PubMed] [Google Scholar]
- Cani PD, Amar J, Iglesias MAet al.. Metabolic endotoxemia initiates obesity and insulin resistance. Diabetes. 2007;56:1761–72. [DOI] [PubMed] [Google Scholar]
- Cani PD, Bibiloni R, Knauf Cet al.. Changes in gut microbiota control metabolic endotoxemia-induced inflammation in high-fat diet-induced obesity and diabetes in mice. Diabetes. 2008;57:1470–81. [DOI] [PubMed] [Google Scholar]
- Cani PD, de Vos WM. Next-Generation Beneficial Microbes: The Case of Akkermansia muciniphila. Frontiers in microbiology. 2017;8:1765. [DOI] [PMC free article] [PubMed] [Google Scholar]
- Chang JC, Wu MC, Liu IMet al.. Increase of insulin sensitivity by stevioside in fructose-rich chow-fed rats. Hormone and metabolic research=Hormon- und Stoffwechselforschung=Hormones et metabolisme. 2005;37:610–6. [DOI] [PubMed] [Google Scholar]
- Chang W. Extrafont: Tools for using fonts. https://CRAN.R-project.org/package=extrafont. 2014.
- Chao CCaA. Species Richness: Estimation and Comparison. In Wiley StatsRef: Statistics Reference Online. 2016. [Google Scholar]
- Clarke SF, Murphy EF, O'Sullivan Oet al.. Targeting the Microbiota to Address Diet-Induced Obesity: A Time Dependent Challenge. PLoS One. 2013;8:e65790. [DOI] [PMC free article] [PubMed] [Google Scholar]
- Collado MC, Laitinen K, Salminen Set al.. Maternal weight and excessive weight gain during pregnancy modify the immunomodulatory potential of breast milk. Pediatr Res. 2012;72:77–85. [DOI] [PubMed] [Google Scholar]
- Colsoul B, Schraenen A, Lemaire Ket al.. Loss of high-frequency glucose-induced Ca2+ oscillations in pancreatic islets correlates with impaired glucose tolerance in Trpm5-/- mice. Proc Natl Acad Sci USA. 2010;107:5208–13. [DOI] [PMC free article] [PubMed] [Google Scholar]
- Cummings DE, Overduin J. Gastrointestinal regulation of food intake. J Clin Invest. 2007;117:13–23. [DOI] [PMC free article] [PubMed] [Google Scholar]
- Curi R, Alvarez M, Bazotte RBet al.. Effect of Stevia rebaudiana on glucose tolerance in normal adult humans. Brazilian journal of medical and biological research = Revista brasileira de pesquisas medicas e biologicas. 1986;19:771–4. [PubMed] [Google Scholar]
- Daniel H, Gholami AM, Berry Det al.. High-fat diet alters gut microbiota physiology in mice. The ISME Journal. 2014;8:295–308. [DOI] [PMC free article] [PubMed] [Google Scholar]
- David LA, Maurice CF, Carmody RNet al.. Diet rapidly and reproducibly alters the human gut microbiome. Nature. 2013;505:559. [DOI] [PMC free article] [PubMed] [Google Scholar]
- Derrien M, Belzer C, de Vos WM. Akkermansia muciniphila and its role in regulating host functions. Microb Pathog. 2017;106:171–81. [DOI] [PubMed] [Google Scholar]
- Desai MS, Seekatz AM, Koropatkin NMet al.. A Dietary Fiber-Deprived Gut Microbiota Degrades the Colonic Mucus Barrier and Enhances Pathogen Susceptibility. Cell. 2016;167:1339–1353.e1321. [DOI] [PMC free article] [PubMed] [Google Scholar]
- Duca FA, Bauer PV, Hamr SCet al.. Glucoregulatory Relevance of Small Intestinal Nutrient Sensing in Physiology, Bariatric Surgery, and Pharmacology. Cell Metab. 2015;22:367–80. [DOI] [PubMed] [Google Scholar]
- Duncan SH, Lobley GE, Holtrop Get al.. Human colonic microbiota associated with diet, obesity and weight loss. International journal of obesity (2005). 2008;32:1720–4. [DOI] [PubMed] [Google Scholar]
- Everard A, Belzer C, Geurts Let al.. Cross-talk between Akkermansia muciniphila and intestinal epithelium controls diet-induced obesity. Proc Natl Acad Sci. 2013;110:9066–71. [DOI] [PMC free article] [PubMed] [Google Scholar]
- Fowler SPG. Low-calorie sweetener use and energy balance: Results from experimental studies in animals, and large-scale prospective studies in humans. Physiol Behav. 2016;164:517–23. [DOI] [PMC free article] [PubMed] [Google Scholar]
- Gardana C, Simonetti P, Canzi Eet al.. Metabolism of stevioside and rebaudioside A from Stevia rebaudiana extracts by human microflora. J Agric Food Chem. 2003;51:6618–22. [DOI] [PubMed] [Google Scholar]
- Good IJ. The Population Frequencies of Species and the Estimation of Population Parameters. Biometrika. 1953;40:237–64. [Google Scholar]
- Gregersen S, Jeppesen PB, Holst JJet al.. Antihyperglycemic effects of stevioside in type 2 diabetic subjects. Metabolism. 2004;53:73–6. [DOI] [PubMed] [Google Scholar]
- Hsieh M, Chan P, Sue Yet al.. Efficacy and tolerability of oral stevioside in patients with mild essential hypertension: A two-year, randomized, placebo-controlled study. Clin Ther. 2003;25:2797–808. [DOI] [PubMed] [Google Scholar]
- Hutapea AM, Toskulkao C, Buddhasukh Det al.. Digestion of Stevioside, a Natural Sweetener, by Various Digestive Enzymes. Journal of Clinical Biochemistry and Nutrition. 1997;23:177–86. [Google Scholar]
- Ihaka R, Gentleman R. R: A Language for Data Analysis and Graphics. J Comput Graph Statist. 1996;5:299–314. [Google Scholar]
- Koliada A, Syzenko G, Moseiko Vet al.. Association between body mass index and Firmicutes/Bacteroidetes ratio in an adult Ukrainian population. BMC Microbiol. 2017;17:120. [DOI] [PMC free article] [PubMed] [Google Scholar]
- Kozich JJ, Westcott SL, Baxter NLet al.. Development of a Dual-Index Sequencing Strategy and Curation Pipeline for Analyzing Amplicon Sequence Data on the MiSeq Illumina Sequencing Platform. Appl Environ Microbiol. 2013;79:5112–20. [DOI] [PMC free article] [PubMed] [Google Scholar]
- Kujur RS, Singh V, Ram Met al.. Antidiabetic activity and phytochemical screening of crude extract of Stevia rebaudiana in alloxan-induced diabetic rats. Pharmacognosy research. 2010;2:258–63. [DOI] [PMC free article] [PubMed] [Google Scholar]
- Kunova G, Rada V, Vidaillac Aet al.. Utilisation of steviol glycosides from Stevia rebaudiana (Bertoni) by lactobacilli and bifidobacteria in in vitro conditions. Folia Microbiol (Praha). 2014;59:251–5. [DOI] [PubMed] [Google Scholar]
- Lemus-Mondaca R, Vega-Gálvez A, Zura-Bravo Let al.. Stevia rebaudiana Bertoni, source of a high-potency natural sweetener: A comprehensive review on the biochemical, nutritional and functional aspects. Food Chem. 2012;132:1121–32. [DOI] [PubMed] [Google Scholar]
- Ley RE, Turnbaugh PJ, Klein Set al.. Human gut microbes associated with obesity. Nature. 2006;444:1022. [DOI] [PubMed] [Google Scholar]
- Magnuson BA, Carakostas MC, Moore NHet al.. Biological fate of low-calorie sweeteners. Nutr Rev. 2016;74:670–89. [DOI] [PubMed] [Google Scholar]
- Marcinek K, Krejpcio Z. Stevia rebaudiana Bertoni: health promoting properties and therapeutic applications. Journal für Verbraucherschutz und Lebensmittelsicherheit. 2016;11:3–8. [Google Scholar]
- McMurdie PJ, Holmes S. phyloseq: An R Package for Reproducible Interactive Analysis and Graphics of Microbiome Census Data. PLoS One. 2013;8:e61217. [DOI] [PMC free article] [PubMed] [Google Scholar]
- Million M, Maraninchi M, Henry Met al.. Obesity-associated gut microbiota is enriched in Lactobacillus reuteri and depleted in Bifidobacterium animalis and Methanobrevibacter smithii. International journal of obesity (2005). 2012;36:817–25. [DOI] [PMC free article] [PubMed] [Google Scholar] [Retracted]
- Mitsutomi K, Masaki T, Shimasaki Tet al.. Effects of a nonnutritive sweetener on body adiposity and energy metabolism in mice with diet-induced obesity. Metabolism. 2014;63:69–78. [DOI] [PubMed] [Google Scholar]
- Mohd-Radzman NH, Ismail WI, Jaapar SSet al.. Stevioside from Stevia rebaudiana Bertoni Increases Insulin Sensitivity in 3T3-L1 Adipocytes. Evidence-based complementary and alternative medicine: eCAM. 2013;2013:938081. [DOI] [PMC free article] [PubMed] [Google Scholar]
- Multinu F, Harrington SC, Chen Jet al.. Systematic Bias Introduced by Genomic DNA Template Dilution in 16S rRNA Gene-Targeted Microbiota Profiling in Human Stool Homogenates. mSphere. 2018;3. [DOI] [PMC free article] [PubMed] [Google Scholar]
- Neuwirth E. RColorBrewer: ColorBrewer Palettes. https://CRAN.R-project.org/package=RColorBrewer. 2014.
- Nikiforov AI, Rihner MO, Eapen AKet al.. Metabolism and toxicity studies supporting the safety of rebaudioside D. Int J Toxicol. 2013;32:261–73. [DOI] [PubMed] [Google Scholar]
- Ogden CL, Carroll MD, Fryar CDet al.. Prevalence of Obesity Among Adults and Youth: United States, 2011–4.. U.S. Department of Health and Human Services Centers for Disease Control and Prevention National Center for Health Statistics. 2015. [Google Scholar]
- Oksanen J, Blanchet FG, Kindt Ret al.. Vegan: Community Ecology Package. 2014. [Google Scholar]
- Philippaert K, Pironet A, Mesuere Met al.. Steviol glycosides enhance pancreatic beta-cell function and taste sensation by potentiation of TRPM5 channel activity. Nat Commun. 2017;8:14733. [DOI] [PMC free article] [PubMed] [Google Scholar]
- Prata C, Zambonin L, Rizzo Bet al.. Glycosides from Stevia rebaudiana Bertoni Possess Insulin-Mimetic and Antioxidant Activities in Rat Cardiac Fibroblasts. Oxidative medicine and cellular longevity. 2017;2017:3724545. [DOI] [PMC free article] [PubMed] [Google Scholar]
- Qin J, Li Y, Cai Zet al.. A metagenome-wide association study of gut microbiota in type 2 diabetes. Nature. 2012;490:55. [DOI] [PubMed] [Google Scholar]
- Quast C, Pruesse E, Yilmaz P. et al. The SILVA ribosomal RNA gene database project: improved data processing and web-based tools. Nucl Acids Res. 2013;41:D590–6. [DOI] [PMC free article] [PubMed] [Google Scholar]
- R Core T. R: A language and environment for statistical computing. 2018.
- Reunanen J, Kainulainen V, Huuskonen Let al.. Akkermansia muciniphila Adheres to Enterocytes and Strengthens the Integrity of the Epithelial Cell Layer. Appl Environ Microbiol. 2015;81:3655. [DOI] [PMC free article] [PubMed] [Google Scholar]
- Ridaura VK, Faith JJ, Rey FEet al.. Cultured gut microbiota from twins discordant for obesity modulate adiposity and metabolic phenotypes in mice. Science. 2013;341. DOI: 10.1126/science.1241214. [DOI] [PMC free article] [PubMed] [Google Scholar]
- Ripken D, van der Wielen N, Wortelboer HMet al.. Steviol glycoside rebaudioside A induces glucagon-like peptide-1 and peptide YY release in a porcine ex vivo intestinal model. J Agric Food Chem. 2014;62:8365–70. [DOI] [PubMed] [Google Scholar]
- Ritu M, Nandini J. Nutritional composition of Stevia rebaudiana, a sweet herb, and its hypoglycaemic and hypolipidaemic effect on patients with non-insulin dependent diabetes mellitus. J Sci Food Agric. 2016;96:4231–4. [DOI] [PubMed] [Google Scholar]
- Riva A, Borgo F, Lassandro Cet al.. Pediatric obesity is associated with an altered gut microbiota and discordant shifts in Firmicutes populations. Environ Microbiol. 2017;19:95–105. [DOI] [PMC free article] [PubMed] [Google Scholar]
- Robinson A. equivalence: Provides Tests and Graphics for Assessing Tests of Equivalence. R package version. 072. 2016. [Google Scholar]
- Rodriguez-Palacios A, Harding A, Menghini Pet al.. The Artificial Sweetener Splenda Promotes Gut Proteobacteria, Dysbiosis, and Myeloperoxidase Reactivity in Crohn's Disease–Like Ileitis. Inflamm Bowel Dis. 2018;24:1005–20. [DOI] [PMC free article] [PubMed] [Google Scholar]
- Ruiz-Ojeda FJ, Plaza-Díaz J, Sáez-Lara MJet al.. Effects of Sweeteners on the Gut Microbiota: A Review of Experimental Studies and Clinical Trials. Adv Nutr. 2019;10:S31–48. [DOI] [PMC free article] [PubMed] [Google Scholar]
- Schloss PD, Westcott SL, Ryabin Tet al.. Introducing mothur: open-source, platform-independent, community-supported software for describing and comparing microbial communities. Appl Environ Microbiol. 2009;75:7537–41. [DOI] [PMC free article] [PubMed] [Google Scholar]
- Schneeberger M, Everard A, Gómez-Valadés AGet al.. Akkermansia muciniphila inversely correlates with the onset of inflammation, altered adipose tissue metabolism and metabolic disorders during obesity in mice. Sci Rep. 2015;5:16643. [DOI] [PMC free article] [PubMed] [Google Scholar]
- Schwiertz A, Taras D, Schafer Ket al.. Microbiota and SCFA in lean and overweight healthy subjects. Obesity. 2010;18:190–5. [DOI] [PubMed] [Google Scholar]
- Semova I, Carten JD, Stombaugh Jet al.. Microbiota regulate intestinal absorption and metabolism of fatty acids in the zebrafish. Cell Host Microbe. 2012;12:277–88. [DOI] [PMC free article] [PubMed] [Google Scholar]
- Shannon CE. A Mathematical Theory of Communication. Bell Syst Tech J. 1948;27:379–423. [Google Scholar]
- Skarlupka JH, Kamenetsky ME, Jewell KAet al.. The ruminal bacterial community in lactating dairy cows has limited variation on a day-to-day basis. J Anim Sci Biotechnol. 2019;10:66. [DOI] [PMC free article] [PubMed] [Google Scholar]
- Suez J, Korem T, Zeevi Det al.. Artificial sweeteners induce glucose intolerance by altering the gut microbiota. Nature. 2014;514:181–6. [DOI] [PubMed] [Google Scholar]
- Suez J, Korem T, Zilberman-Schapira Get al.. Non-caloric artificial sweeteners and the microbiome: findings and challenges. Gut Microbes. 2015;6:149–55. [DOI] [PMC free article] [PubMed] [Google Scholar]
- Surgeon General. The Surgeon General's call to action to prevent and decrease overweight and obesity. (Services USDoHaH, ed.) U.S. Department of Health and Human Services, Public Health Service, Office of the Surgeon General, Rockville, MD. 2001. [PubMed] [Google Scholar]
- Turnbaugh PJ, Backhed F, Fulton Let al.. Diet-induced obesity is linked to marked but reversible alterations in the mouse distal gut microbiome. Cell Host Microbe. 2008;3:213–23. [DOI] [PMC free article] [PubMed] [Google Scholar]
- Turnbaugh PJ, Ley RE, Mahowald MAet al.. An obesity-associated gut microbiome with increased capacity for energy harvest. Nature. 2006;444:1027. [DOI] [PubMed] [Google Scholar]
- van der Wielen N, Ten Klooster JP, Muckenschnabl Set al.. The Noncaloric Sweetener Rebaudioside A Stimulates Glucagon-Like Peptide 1 Release and Increases Enteroendocrine Cell Numbers in 2-Dimensional Mouse Organoids Derived from Different Locations of the Intestine. J Nutr. 2016;146:2429–35. [DOI] [PubMed] [Google Scholar]
- Vrieze A, Van Nood E, Holleman Fet al.. Transfer of Intestinal Microbiota From Lean Donors Increases Insulin Sensitivity in Individuals With Metabolic Syndrome. Gastroenterology. 2012;143:913–916.e917. [DOI] [PubMed] [Google Scholar]
- Wang Q-P, Browman D, Herzog Het al.. Non-nutritive sweeteners possess a bacteriostatic effect and alter gut microbiota in mice. PLoS One. 2018;13:e0199080. [DOI] [PMC free article] [PubMed] [Google Scholar]
- Wickham H. ggplot2: Elegant graphics for data analysis. New York: Springer-Verlag, 2016. [Google Scholar]
- Wickham HF, Romain; Henry, Lionel; Müller, Kirill. dplyr: A Grammar of Data Manipulation. 2017. [Google Scholar]
- Xiao L, Sonne SB, Feng Qet al.. High-fat feeding rather than obesity drives taxonomical and functional changes in the gut microbiota in mice. Microbiome. 2017;5:43. [DOI] [PMC free article] [PubMed] [Google Scholar]
- Yuen KK, Dixon WJ. The approximate behaviour and performance of the two-sample trimmed t. Biometrika. 1973;60:369–74. [Google Scholar]
- Yuen KK. The two-sample trimmed t for unequal population variances. Biometrika. 1974;61:165–170. [Google Scholar]
- Zeevi D, Korem T, Zmora Net al.. Personalized Nutrition by Prediction of Glycemic Responses. Cell. 2015;163:1079–94. [DOI] [PubMed] [Google Scholar]
- Zhao L, Zhang F, Ding Xet al.. Gut bacteria selectively promoted by dietary fibers alleviate type 2 diabetes. Science. 2018;359:1151–6. [DOI] [PubMed] [Google Scholar]
Associated Data
This section collects any data citations, data availability statements, or supplementary materials included in this article.