

Abstract
2,3,7,8-Tetrachlordibenzo-p-dioxin (TCDD) is an environmental pollutant that can cause various toxic effects, including chloracne, metabolic syndrome, and immune suppression. Most of the toxicity associated with TCDD is mediated through activation of the aryl hydrocarbon receptor (AHR). Recent research has suggested the presence of a wide-range of interindividual variability in TCDD-mediated suppression of the Immunoglobulin-M (IgM) response across the human population. In an attempt to identify putative modifiers of AHR-mediated immunosuppression beyond the AHR, B cells were isolated from a panel of genetically diverse mouse strain to scan for modulators that drive interstrain differences in TCDD-mediated suppression of the IgM response. Results implicated a region of mouse Chromosome 1 near a gene encoding serine peptidase inhibitor, clade B, member 2 (Serpinb2) whose human ortholog is plasminogen activator inhibitor 2 (PAI2). Further downstream analyses indicated that Serpinb2 is dysregulated by TCDD and, furthermore, that B cells from Serpinb2−/− mice are significantly more sensitive to TCDD-mediated suppression as compared to littermate controls. This study suggests a protective role of Serpinb2 within TCDD-mediated immunosuppression and, furthermore, a novel function of Serpinb2-related activity in the IgM response.
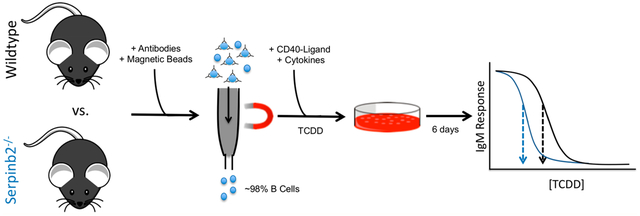
Graphical Abstract
INTRODUCTION
2,3,7,8-Tetrachlordibenzo-p-dioxin (TCDD) is an ubiquitous and persistent environmental contaminant that has been associated with a wide range of pathological conditions such as chloracne, metabolic dysfunction and immune suppression. Most of TCDD-induced toxicity is mediated through activation of a transcription factor called the aryl hydrocarbon receptor (AHR). Upon ligand-binding, AHR, a member of the PAS superfamily of environmental sensors, separates from cytosolic chaperones HSP90 and ARA9 and translocates to the nucleus.1–3 Within the nucleus, AHR dimerizes with ARNT and becomes a functional transcription factor.4,5 While many studies have documented the resulting changes in gene expression following TCDD exposures, much remains unknown regarding how such changes lead to downstream disease states6–11
The B cell has been well-established as a target of TCDD-induced toxicity.12 Recent reports have indicated that TCDD suppresses the activation and differentiation of human B cells into Immunoglobulin-M (IgM) secreting cells.13–16 In a previous study, B cells were isolated from 51 unique human donors, activated with CD40 ligand, and dosed with increasing concentrations of TCDD.16 In comparing results across donors, profound interindividual variability was identified among the response to TCDD with up to 71-fold differences at the highest dose of TCDD (30 nM). While interindividual variability in response to toxicants can be driven by many factors, previous reports have shown that genetic background can have profound impacts on responses. As such, we hypothesize that there are genetic modulators that impact individual’s response to TCDD-mediated suppression of the B cell.
To address our hypothesis, we used a panel of genetically diverse mouse strains to screen for potential genetic modulators of TCDD-mediated suppression of the B cell. The TCDD-mediated suppression of the IgM response of isolated B cells was assayed across 12 genetically diverse inbred mouse strains. As mice inherit alleles of the AHR with documented differences in sensitivity to TCDD-induced toxicity, interstrain differences in response to TCDD that are directly relatable to the Ahr allele inherited were expected.17–19 However, given the previously documented complexity of TCDD-mediated suppression of the B cell as well as the wide-ranging response within the human population, a mouse panel was used to scan for genetic-modifiers beyond the Ahr that impact TCDD-mediated immunosuppression.
Results from this study implicated a gene called Serpinb2, which encodes the ortholog of the human plasminogen activator inhibitor-2 (PAI2), as modulator of TCDD-mediated immunosuppression. Further downstream functional analyses suggest that Serpinb2-related activity protects against TCDD-mediated suppression of the IgM response. Although Serpinb2 has been shown to play a role within the immune system20 and known to be dysregulated by TCDD exposure in mouse and human B cells,21 this is the first report suggesting a functional role of Serpinb2-related activity in B cells. Such results, along with increasing understanding of TCDD-mediated suppression of the B cell, suggest a novel role of Serpinb2 in modulating the IgM response. These results also have potential to aid in identifying human individuals that may be more susceptible to TCDD-mediated immunosuppression.
MATERIALS AND METHODS
B Cell Isolation.
B cells from 12 inbred mouse strains were used: (1) C57BL/6J (n = 6), (2) 129S1/SvlmJ (n = 3), (3) NOD/ShiLtJ (n = 6), (4) A/J (n = 6), (5) NZO/HILTJ (n = 5), (6) C3HeB/FeJ (n = 5), (7) CBA/J (n = 3), (8) DBA/1J (n = 5), (9) FVB/NJ (n = 5), (10) BALB/CJ (n = 6), (11) CC019 (n = 4), and (12) CC041 (n = 5). Ages ranged between 2 and 5 months at the time when spleens were processed. Technical replicates contain pools of splenocytes from male and female mice in all cases with the exception of C3HeB/FeJ and CBA/J which only contained male mice. A replicate was considered a biological replicate (i.e., n = 1) following isolation of B cells from the splenocyte pools. Table S1 outlines the total number of male and female mice used for each strain. In all cases, mice were anesthetized with 2,2,2-tribromoethanol (225 mg/kg of bodyweight) and euthanized via CO2 asphyxiation at Texas A&M. Spleens were sent to Michigan State University overnight on wet ice for B cell isolation. Spleens were mashed in a culture dish to create a single cell suspension. The single cell suspension was washed with 10 mL of Hank’s Balanced Salt Solution (HBSS) and resuspended in 1 mL of HBSS per mouse spleen included in the pool. The number of cells were quantified with an automated cell counter (Beckman Coulter Inc., Brea, CA) following treatment with 2 drops of Zapaglobin to lyse red blood cells (Beckman Coulter Inc.). B cells were subject to negative selection using the magnetic-activated cell sorting (MACS) mouse B cell II isolation kits per the manufacturer’s instructions (MiltenyiBiotec, Auburn, CA). B cell purity for all samples included in this study (i.e., percentage of CD19+ cells) averaged 98.08% ± standard deviation of 2.25. Following isolation, B cells were cultured at 1 × 10⁶ cells/mL in RPMI 1640, supplemented with 10% HyClone Cosmic Calf Serum (CCS; GE Healthcare, Piscatawy, NJ), 100 U/ml of penicillin, 100 μg/mL of streptomycin, and 50 μM of 2-mercaptoethanol.
B Cell Activation with CD40 Ligand.
The mouse B cells were activated via coculture with mouse fibroblast cells that express membrane-bound CD154/CD40 ligand (CD40L cells) which were a generous gift from Dr. David Sherr (Boston University). CD40L cells were cultured in Dulbecco’s Modified Eagle Medium (DMEM) supplemented with 10% HyClone Fetal Bovine Serum (FBS; GE Healthcare), 100 U/ml of penicillin, 100 μg/mL of streptomycin, 50 μM of 2-mercaptoethanol, and Gibco HT supplement (Thermo Fisher Scientific, Waltham, MA) to select for CD40L-expressing cells. Prior to coculture, the CD40L cells were irradiated (3500 c/Gy) with an X-RAD 320 (PXI, North Branford, CT). Following irradiation, CD40L cells were plated on 96-well plates at a concentration of 5 × 10⁴ cells/mL for ≥24 h. CD40L cells were then washed with RPMI 1640 and isolated B cells were layered on top of the irradiated CD40L cells and supplemented with recombinant interleukin 2 (5 ng/mL, Cell Signaling Technologies, Danver, MA), interleukin 6 (0.0375 ng/mL, Biolegend, San Diego, CA), and interleukin 10 (2 ng/mL, Cell Signaling Technologies). B cells were cocultured with the CD40L cells for 3 days and then an additional 3 days in the absence of the CD40L cells at 37°C and 5% CO2.
TCDD Exposure.
B cells were either untreated (i.e., no vehicle, naïve control) or treated with vehicle (DMSO; 0.04%) or TCDD (0.0001, 0.001, 0.01, 0.1, 0.3, 1, 3, 10, or 30 nM) prior to the start of the 6 day culture period. This dose-response provides environmentally relevance as the concentration range overlaps serum lipid-adjusted TEQ values for TCDD and dioxin-like compounds that were reported across the human population.22 Immediately after TCDD exposure, the B cells were cocultured with the irradiated CD40L cells. Throughout culture (i.e., total of 6 days), media was not renewed. In all cases, there were no significant difference between the naïve control and the vehicle control group. Magnitude of antibody responses in the presence of increasing [TCDD] were analyzed via an ANOVA with either a (1) Dunnett’s two-tailed posthoc for dose-response analysis or a (2) Tukey’s posthoc for comparison of groups. In all cases, statistical analyses were performed using version 3.0.2 in R23 and p < 0.05 was considered significant. Data distributions were analyzed with histograms and q-q plots prior to statistical analyses and, when appropriate, log-transformed to achieve a normal distribution. Data was log-transformed prior to the dose-response analysis; histograms and q-q-plots were created to ensure the transformation was effective.
Enzyme-Linked ImmunoSpot (ELISPOT) Assay.
The ELISPOT assay was used to quantify the number of B cells secreting IgM as previously described.16 Briefly, 96-well multiscreen filter plates (Millipore, Billerica, MA) were coated with antimouse IgM antibody (5 μg/mL)(Sigma-Aldrich, St. Louis, MO) overnight at 4°C. The plates were washed 3× with phosphate-buffered saline with 0.1% Tween-20 (0.1% PBST; Sigma), 3× with nanopure H2O, and blocked with 5% bovine serum albumin (Sigma). Plates were then washed 3× with PBST and 3× with nanopure H2O. The treated B cells were washed 2× in RPMI 1640 and resuspended in RPMI 1640 supplemented with 10% CCS (GE Healthcare) and incubated over the primary antibody overnight at 37°C and 5% CO2. The culture plates were then washed 6× with 0.1% PBST, 3× with nanopure H2O, and coated with biotin-conjugated antimouse IgM antibody (Sigma) for 1 h incubation at 37°C and 5% CO2. The culture plates were then washed 3× with 0.1% PBST, 3× with nanopure H2O, and coated with Streptavidin-conjugated horseradish peroxidase for 1 h at 37°C and 5% CO2. The culture plates were washed 3× with 0.1% PBST, 3× with nanopure H2O, and spots were developed with an aminoethylcarbazole staining kit (Sigma) per the manufacturer’s instructions. Spots were enumerated with Immunospot Software (Cellular Technology, Ltd., Shaker Heights, OH). Each biological replicate (i.e., n of 1) consisted of four experimental replicates at each dose of TCDD and in all cases the data sets analyzed are complete and balanced at each concentration of TCDD tested. The number of spots were normalized to the total number of cells plated in each well of the ELISPOT plate which was quantified with an automated cell counter (Beckman Coulter Inc.).
Ahr Phylogenetic Analysis.
Genomes were downloaded from the Collaborative Cross Web site (http://csbio.unc.edu/). In cases where full genomes have not been fully sequenced (i.e., DBA/1J and C3HeB/FeJ), SNP and INDEL data was used to compare the genetic region containing the Ahr sequence with closely related strains that have been sequenced (i.e., DBA/2J and C3H/HeJ) using the Sanger SNP querying tool.24,25 In all cases, there were no differing SNPs or indels between DBA/1J vs DBA/2J or C3Heb/FeJ versus C3H/HeJ near the Ahr gene. The Ahr gene sequences were extracted by flanking the coordinates based on the reference mouse genome (C57BL/6J mm10) using a custom python script (freely available at https://github.com/PeterDornbos/Extracting_Gene_Sequences). The extracted sequences were then processed manually to remove the flanking sequences around the gene of interest. The extracted gene sequence was then aligned to the cDNA sequence of the gene of interest using EMBOSS Stretcher. The alignment output was used to extract the exons of the gene and remove intronic regions using a custom python script (i.e., predict the cDNA sequence for each individual strain). The predicted cDNA sequence was translated into the protein sequence using EMBOSS Transeq software. The predicted protein sequences were manually trimmed to remove untranslated amino acids. Predicted protein sequences from all strains were aligned via Multiple Alignment using Fast Fourier Transform (MAFFT) software.26 Phylogenetic trees were built based on MAFFT outputs using FigTree v1.4.2. In all cases, custom python scripts were written in-lab using Python version 2.7.10. Statistical differences between allelic category phenotypes were assess with an ANOVA with a Tukey’s posthoc.
Heritability Analysis.
As the R2 of a linear regression model reflects the proportion of experimental variance in the dependent variable that is attributed to the variability within the independent variable replicates, the heritability (h2) of the percent inhibition of the IgM response induced TCDD at the high dose of TCDD was estimated via the R2 of the following linear regression model
In this regression model, β0 is the intercept while the remaining coefficients reflect the response seen within each strain set as categorical variables. The regression coefficient estimates are relative to the 129S1/SvlmJ (i.e., the least responsive strain to TCDD): β1 = A/J, β2 = BALB/CJ, β3 = C3HeB/FeJ, β4 = C57BL/6J, β5 = CBA/J, β6 = CC019, β7 = CC041, β8 = DBA/1J, β9 = FVB/NJ, β10 = NOD/ShiLtJ, and β11 = NZO/HILTJ. The coefficient estimates and model summary values are reported in Table S2. The 95% confidence intervals associated with multiple R2 of the regression model were calculated via bootstrapping with 1000 replications using bias corrected and accelerated method in the boot library in R.27
Quantitative Trait Loci (QTL).
All QTL analysis was performed using Gene Network’s online-based WebQTL program (http://www.genenetwork.org/webqtl/main.py).28 The scan for QTLs was performed using each individual strain’s mean percent inhibition in the number of cells secreting IgM (i.e., ELISPOT data) at the high dose (30 nM) of TCDD along with trait variance and sample size for that strain. The mapping was performed using the data from the 10 strains that are members of the Mouse Diversity Panel: (1) C57BL/6J, (2) 129S1/SvlmJ, (3) NOD/ShiLtJ, (4) A/J, (5) NZO/HILTJ, (6) C3HeB/FeJ, (7) CBA/J, (8) DBA/1J, (9) FVB/nJ, and (10) BALB/cJ. The whole-genome interval mapping was performed using the default settings of 2000 bootstrap tests. The threshold of significance was determined via permutation test (n = 10 000).29 In all cases, log of the odds (LOD) ratio is reported which was calculated as outlined in the WebQTL glossary of terms (i.e., LRS/4.61).
RNA Expression Analysis.
Total RNA was extracted from B cells isolated from male C57BL/6J (n = 3) and DBA/1J (n = 3) mice that were treated with DMSO (0.01%) or TCDD (30 nm) for 0.33, 1, 2, 3, 4, 5, or 6 days. Isolated B cells were diluted to 1 × 10⁶ cells/mL, supplemented with cytokines, and activated using CD40L cell coculture scheme as previously outlined with the exception that six well dishes were used in this exposure (i.e., larger volumes of cells at the same density). RNA was extracted with Qiagen RNeasy Mini Kits per the manufacturer’s instructions. RNA quality (i.e., A260/A280 ratio) and quantity was assessed with a NanoDrop 1000 spectrophotometer. Total RNA (0.5 μg) was converted to cDNA using oligo dT primer and reverse transcriptase superscript III per the manufacturer’s instructions. Quantitative real-time polymerase chain reaction (QRTPCR) was performed using SYBR green Mastermix (Life Technologies) and a DNA Engine Opticon 2 (Bio-Rad, Hercules CA). Fold changes were calculated using the 2−ΔΔCT method. Expression was normalized to a housekeeping gene (Hprt) and the vehicle (DMSO) treated groups. Primer sequences are located in Table S3. Potential statistical differences at each end point were assessed with an ANOVA and a Tukey’s posthoc.
Intracellular Protein Expression Analysis.
For flow cytometry analysis, B cells, isolated from C57BL/6J (n = 4) and DBA/1J (n = 4) mice and were activated with cytokines and CD40L cells as previously outlined with the exception that 12 well dishes were used for this exposure. Activation was performed in the presence of DMSO (0.01%) or TCDD (30 nm) for 0, 2, 3, 4, and 5 days. Following exposure, cells were washed with HBSS and treated with Fc Block (BD Pharminogen, San Diego, CA) and unlabeled antimouse IgM (BD Pharminogen) for 15 min at 4°C to ensure surface receptors were blocked. Following three washes with FACS buffer, cells were fixed with Cytofix (BD Pharminogen) for 20 min at room temperature. Cells were washed 2× with FACS buffer and then treated with PermWash (BD Pharminogen) for 10 min. Intracellular SERPINB2 and IgM were stained simultaneously with antimouse SERPINB2 conjugated to biotin (1 μg per 100 μL; LS Bioscience, Seattle, WA) and antimouse IgM conjugated to FITC (1 μg per 100 μL; BD Pharminogen), respectively for 20 min at 4°C. Cells were then washed 4× with 3 mL of Permwash and treated with streptavidin-conjugated Alexa Fluor 647 (1 μg per 100 μL; AF647) for 20 min at 4°C. Cells were then washed 4× with 3 mL of Permwash and resuspended in FACS buffer and analyzed with a BD FACSCanto II. Data was analyzed with FlowJo Software version 10.2 (Treestar Software, Ashland, OR). Gates were created to isolate singlets and B cells (Supplemental Figure 1). In all cases, a 1:1 mixture of vehicle and TCDD treated cells that were stained with an isotype control including streptavidin-conjugated AF647 to determine AF647 and FITC background levels. Potential statistical differences for each time-point were assessed with an ANOVA and a Tukey’s posthoc.
Knockout Studies.
The Serpinb2-null (Serpinb2−/−) mice and wildtype controls were graciously provided by the lab of Dr. Toni Antalis (University of Maryland School of Medicine, Baltimore, MD). The mice were originally developed by the lab of Dr. David Ginsburg (University of Michigan Medical School, Ann Arbor, MI) and have been further backcrossed onto C57BL/6 background for a total of 13 generations.30,31 The Serpine1-null (Serpine1−/−) mice were graciously provided by the lab of Dr. Jim Luyendyk (Michigan State University, East Lansing, MI). The mice were originally donated to Jackson Laboratories (JAX stock #002507) by Dr. Peter Carmeliet (University of Leuvin, Leuvin, Belgium).32 The mice were backcrossed onto C57BL/6J background until congenic. All mice included in knockout studies were male ranging from 14 and 17 weeks of age. All mice were anesthetized with isoflurane and euthanized via cervical dislocation. Statistical differences were calculated with an ANOVA and Tukey’s posthoc.
RESULTS
Interstrain Differences in Response to TCDD.
All 12 strains had a decrease in the number of cells secreting IgM at the high dose of TCDD (30 nM), each mouse strain displayed a unique dose-dependent response to TCDD (Figure 1A). In a comparison between the percent inhibition induced at the high dose of TCDD (30 nM) within the mice included in the current study with a previous study with TCDD-induced suppression of human B cells from 51 unique human donors, an overlapping histogram suggest the interindividual differences between the two data sets are comparable (Figure 1B).16 Of the 12 strains, 2 were found to contain a statistically significant decrease as indicated with ANOVA and Dunnett’s posthoc with the log-transformed response: (1) C57BL/6J (n = 6; p < 0.05) and (2) FVB/nJ (n = 5; p < 0.05) (Figure 1C,D, respectively). There was also a 10-fold difference in the number of cells secreting IgM at the highest dose of TCDD for the most- and least-suppressed mice. As such, results show that mice within the genetic screen have a wide-range in sensitivities to TCDD.
Figure 1.

Interstrain differences in the response to TCDD-mediated immunosuppression. B cells isolated from 12 genetically diverse strains of mice were exposed to increasing concentrations of TCDD (0–30 nM) for 6 days and the percentage of cells secreting IgM was determined by ELISPOT. Each strain was normalized to its own vehicle control to compare TCDD-mediated effects within the IgM response across strains (A). The distributions of the percentage of cells secreting IgM at the high dose of TCDD (30 nM) as normalized to the vehicle control for all mice (blue) and humans (red) was created to visualize overlap (maroon) between the mouse and previous human study (B). The dose-response analysis for the C57BL/6J (C, n = 6) and FVB/nJ (D, n = 5) strains indicate statistically significant, concentration-dependent decreases in the number of cells secreting IgM as compared to the vehicle control as indicated with an ANOVA with a Dunnett’s posthoc. Stars (*) indicate a p < 0.05 and error bars indicate standard error.
Differences among Ahr Allelic Categories.
A linear regression model with individual strains as the independent variables and the percent inhibition of the IgM response at [30 nM] TCDD as the dependent variables was used to estimate the observed variance that is due to interstrain differences (Table S2). The multiple R2 value was 0.33 with 95% confidence intervals that span from 0.20 to 0.40. As such, we estimate that ~33% of the observed variance is due to genetic differences across strains. Previous reports have established that mouse strains carry one of four different Ahr alleles that encode for receptors with differing binding affinities for TCDD.17–19 A multiple global sequence alignment indicates that the strains in this panel carry three different Ahr alleles: (1) Ahrb1 (n = 1; gray), (2) Ahrb2 (n = 5; blue), and (3) Ahrd (n = 6; green) (Figure 2A). Allelic clustering was used to group mice of the same allele together to compare the percentage of cells secreting IgM at 30 nM TCDD across the three Ahr alleles. The results indicate that mice carrying the Ahrb1 and Ahrb2 alleles have a significantly lower percentage of cells secreting IgM as compared to the Ahrd mice (p < 0.05; Figure 2B). There was no significant difference when comparing the of Ahrb1 and Ahrb2 allelic categories. These results agree with previous reports.18 In comparing percentage of cells secreting IgM across the individual strains at the 30 nM treatment of TCDD, several strains were found to behave differently than what might be predicted based on the Ahr allele carried (Figure 2C). For example, the NZO/HILTJ and CC019 strains, which both carry the Ahrd allele, appear to respond similarly to the majority of the mice that carry Ahrb2 mice. Similarly, the A/J strain, which carries the Ahrb2 allele, appear to respond quite similarly to the C57BL/6J strain which carry Ahrb1 allele.
Figure 2.

The Ahr allele does not drive all interstrain differences to TCDD-mediated suppression of the IgM response. Genomic data was used to predict the AHR amino acid sequence for each mouse strain included in the study. A multiple sequence alignment of the AHR protein sequences from the 12 mouse strains assayed indicates that 3 unique alleles are present in this panel: (1) Ahrb1 (gray), (2) Ahrb2 (blue), and (3) Ahrd (green) (A). The average percent decrease in IgM secreting B cells at 30 nM TCDD as normalized to the vehicles control was determined from all the mice within their respective Ahr allele (B). Comparison of the TCDD-induced suppression of IgM secretion in B cells from the individual strains (Ahrb1 (gray), Ahrb2 (blue), and Ahrd (green)) indicates that some strains do not respond like strains within their respective AHR allelic categories (C). Stars (*) indicate a p < 0.05 and error bars indicate standard error.
QTL Analysis of Percent Inhibition Identifies Significant Association.
Exploratory QTL analysis was performed using the percent inhibition at the high dose of TCDD (30 nM) where statistical significant inhibition in was present among several mouse strains. The genome-wide scan indicated a significant association with Chromosome 1 (LOD = 5.61; p < 0.05)(Figure 3). Genes within 1 Mb of the marker with the maximal LOD score were compiled into lists of potential candidates that may be modulating the TCDD-induced suppression in the number of antibody secreting cells (Table 1). While several candidate genes near the interval identified may contribute TCDD-mediated suppression of the B cell, expression of Serpinb2 mRNA has been previously reported to be dysregulated by TCDD in both mouse and human B cells.21 Furthermore, Serpinb2 gene is located less than 60 kb of the marker significantly associated with the B cell phenotype. As such, Serpinb2 was selected for further confirmatory analysis and to evaluate potential roles in modulating interstrain differences in susceptibility to TCDD-mediated suppression of the immune response.
Figure 3.

QTL analysis indicates a significant association within Chromosome 1. The TCDD-mediated percent suppression in the number of cells secreting IgM at 30 nM TCDD as normalized to the vehicle control was determined with an ELISPOT assay. The percent suppression was used to scan the genome for quantitative trait loci (QTLs) that potentially drive interstrain differences using the WebQTL software from GeneNetwork. A significant association was identified on chromosome 1 at a marker located at 107.584 Mb (LOD = 5.611; p = 0.031). The horizontal black-dotted line indicates the threshold of significance based on a permutation test (n = 1000).
Table 1.
Candidate Genes Associated with TCDD-Induced Suppression of the B Cella
| chromosome | location (Mb) | logs of difference (LOD) | P-value | genes within region |
|---|---|---|---|---|
| Chr 1 | 107.584 | 5.611 | 0.031 | Bcl2, Kdsr, Vps4d, SerpinbS, Pou2f3-rs1, Serpinb12, Serpinb13, Serpinb3a, Serpinb3d, Serpinb3b, Serpinb3c, Serpinb11, Serpinb7, Serpinb2, Serpinb10, Serpinb8 |
Genes located within 1 Mb upstream or downstream of the statistically significant association on chromosome 1 were considered. A literature search indicated that Serpinb2 (bolded), which is located from 107.500–107.526 Mb on Chromosome 1 (i.e. within 59 000 bp of the significant marker), is dysregulated by TCDD within pokeweed mitogen-activated mouse and human B cells.
Time Course of TCDD-Mediated Serpinb2 Expression.
B cells were compared from a sensitive (C57BL/6J; Ahrb1 allele) and a less-sensitive strain (DBA/1J; Ahrd allele) to TCDD-mediated immunosuppression to investigate for the presence of interstrain differences in Serpinb2 mRNA expression. Results indicated a significant increase in Serpinb2 expression following 2 days of exposure to TCDD in DBA/1J mice (p < 0.05) but not C57BL/6J mice (Figure 4A). More notably, Serpinb2 expression was found to be significantly higher in DBA/1J as compared to C57BL/6J (p < 0.05, Figure 4A). In addition, Cyp1a1 expression was also assessed as a biomarker for AHR activation. Expression of Cyp1a1 mRNA was significantly increased at day 2 in DBA/1J (p < 0.05) and at day 2, 3, and 4 for C57BL/6J (p < 0.05; Figure 4B). Interestingly, DBA/1J mice were found to have a significantly higher TCDD-induced fold change in Cyp1a1 expression on day 2 as compared to C57BL/6J strain (p < 0.05) but the upregulation dissipates by day 3 (Figure 4B). In contrast, C57BL/6J had significantly more Cyp1a1 expression induced by TCDD as compared DBA/1J at day 3 and day 4 (p < 0.05; Figure 4B). As such, results indicate statistically significant interstrain differences in TCDD-mediated expression of Serpinb2 and Cyp1a1 within B cells.
Figure 4.

Serpinb2 gene expression was found to be dysregulated by TCDD in the DBA/1J and not in the C57BL/6J. Total RNA was extracted from B cells isolated from C57BL/6J (Ahrb1 allele) and DBA/1J (Ahrd allele) mice that were exposed to TCDD (30 nM) for 0.33, 1, 2, 3, 4, 5, and 6 days. QRTPCR was used to assess whether expression of Serpinb2 mRNA is affected by TCDD exposure in the both strains (A). QRTPCR was also used to analyze Cyp1a1 mRNA induction as a biomarker of AHR activation (B). All fold changes are reported for TCDD-treated cells that are normalized to the vehicle control (not shown). Stars (*) indicate a p < 0.05; stars directly over bars indicate differences in the TCDD treatment as compared to the vehicle control or when over bracket indicate a comparison of TCDD treatments across strains. Error bars indicate standard error.
Time-Course of TCDD-Dysregulated Intracellular SerpinB2 and IgM Expression.
To assess whether the differential Serpinb2 gene expression is also found at the protein level, SERPINB2 protein expression was analyzed over a 4-day time-course with a focus on the time-points where expression of Serpinb2 and Cyp1a1 mRNA was dysregulated. Results indicated significant TCDD-induced increases in the fold change of the percentage of SERPINB2+ cells after TCDD treatment as compared to the vehicle control for DBA/1J mice at day 3 and 4 (p < 0.05; Figure 5A). Similarly, there was a significant increase in mean fluorescent intensity (MFI) of SERPINB2 in DBA/1J at day 3 and day 4 following TCDD treatment (p < 0.05; Figure 5B). In contrast, there were no significant changes in the percentage SERPINB2+ cells or the SERPINB2 MFI for C57BL/6J mice (Figure 5A,B). In comparing the strains, the percentage of SERPINB2+ cells were significantly higher in the DBA/1J at day 2 and day 3 (p < 0.05, respectively; Figure 5A). Similarly, DBA/1J also had significantly higher TCDD-induced SERPINB2 expression as indicated by the SERPINB2 MFI at day 3 and day 4 (p < 0.05; Figure 5B). A representative sample for each strain was chosen to visualize the increase in the expression of SERPINB2 in DBA/1J as compared to the slight decrease seen within C57BL/6J (Figure 5C,D, respectively). Results suggest that, along with the mRNA expression data, the protein expression data also suggests interstrain differences in the levels of intracellular SERPINB2.
Figure 5.

TCDD exposure increased the percentage of SERPINB2+ and level of intracellular SERPINB2 expression in DBA/1J but not C57BL/6J mice. B cells isolated from a C57BL/6J and DBA/1J mice were exposed to TCDD (30 nM) for 2, 3, 4, and 5 days. Flow cytometry was used to assess the level of intracellular SERPINB2 protein expression. The percentage of cells that are SERPINB2+ were assessed at each time point (A). Similarly, mean fluorescence intensity for the SERPINB2 antibody was used to assess the level of SERPINB2 expression at each time point (B). A representative sample for DBA/1J (C) and C57BL/6J (D) was chosen to visualize the shift of SERPINB2 expression in the population of B cells treated with TCDD as compared to the vehicle. All fold changes are reported for TCDD-treated cells that are normalized to the vehicle control (not shown). Stars (*) indicate a p < 0.05; stars directly over bars indicate differences in the TCDD treatment as compared to the vehicle control or when over bracket indicate a comparison of TCDD treatments across strains. Error bars indicate standard error.
As the QTL analyses were based on TCDD-induced interstrain differences in the number of cells secreting IgM, intracellular IgM expression was also assessed to potentially identify a correlation with SERPINB2 expression. The TCDD-induced fold change in the frequency of SERPINB2+, SERPINB2−, IgM+, and IgM− cells were compared at each time point across the two strains. Results indicate that on day 2 post-TCDD exposure, there is a significantly smaller fold change in the number of cells that are SERPINB2+/IgM+ induced by TCDD in DBA/1J as compared to C57BL/6J (p < 0.05; Figure 6A). However, on day 3 postexposure, TCDD-induced a significantly higher fold change of SERPINB2+/IgM+ cells in DBA/1J as compared to C57BL/6J (p < 0.05; Figure 6B). Notably, while TCDD-induced an increase in SERPINB2+/IgM+ DBA/1J mice on day 3, the C57BL6J was found to have a decrease (i.e., >6 fold difference between mice). As such, there appears to be a time-dependent correlation between SERPINB2 expression and higher levels of intracellular IgM in the DBA/1J. This trend continues on Day 4 as DBA/1J was found to have a significantly higher fold change in SERPINB2+/IgM+ as compared to SERPINB2+/IgM+ in C57BL/6J (p < 0.05; Figure 6C). However, the TCDD-induced frequency of SERPINB2+/IgM− cells in the DBA/1J also increases on day 4 as compared to the C57BL/6J (p < 0.05; Figure 6C). Finally, on day 5, where the TCDD-induced increase in SERPINB2 levels has dissipated, there was a significantly larger TCDD-induced fold change in SERPINB2−/IgM+ cells in DBA/1J compared to the C57BL/6J (p < 0.05). Consequently, there appears to be a correlation with TCDD-induced expression of intracellular SERPINB2 and IgM on day 3 in the DBA/1J but not the C57BL/6J.
Figure 6.

Intracellular SERPINB2 expression correlates with high level of intracellular IgM in a time-dependent manner. B cells isolated from C57BL/6J and DBA/1J mice were exposed to TCDD (30 nM) for 2, 3, 4, and 5 days. Flow cytometry was used to assess the TCDD-induced fold change in the frequency of cells that are SERPINB2+ and high IgM+ on day 2 (A), day 3 (B), day 4 (C), and day 5 (D). All fold changes are reported for TCDD-treated cells that are normalized to the vehicle control (not shown). Stars (*) indicate a p < 0.05; stars directly over bars indicate differences in the TCDD treatment as compared to the vehicle control or when over bracket indicate a comparison of TCDD treatments across strains. Error bars indicate standard error.
Serpinb2−/− Mice Are More Sensitive to TCDD-Induced Immunosuppression.
While the above comparison suggests the Serpinb2 gene and SERPINB2 protein expression display significant interstrain variation, the results do not provide a functional relationship for SERPINB2 in TCDD-induced suppression of the IgM response. To test this relationship directly, a SERPINB2 knockout mouse on a C57BL/6J background was used. B cells from Serpinb2−/− mice along with wildtype controls were isolated and treated with TCDD using the same model as for the genomic screen (i.e., 6 total days of culture). Results indicated that both Serpinb2−/− mice and wildtype controls had significant decreases in the percentage of cells secreting IgM (p < 0.05; Figure 7A). More notably, Serpinb2−/− mice were significantly more sensitive to TCDD-mediated suppression with significantly lower percentages of cells secreting IgM as compared to wildtype controls (p < 0.05; Figure 7A). The Serpinb2−/− and wildtype mice both were found to significantly induce Cyp1a1 mRNA expression on day 2 (p < 0.05; Figure 7B). The expression of Cyp1a1 mRNA for the TCDD treatments were not different between strains suggesting that, while the AHR is activated in both strains, the difference in sensitivity between the Serpinb2−/− and wildtype mice is likely not due to differing levels of AHR activity (Figure 7B).
Figure 7.

Serpinb2−/− mice, but not Serpine1−/− mice, are more sensitive to TCDD-induced immunosuppression. B cells isolated from Serpinb2−/− and Serpine1−/− mice along with the respective wildtype controls were exposed to TCDD (30 nM) for 6 days. An ELISPOT assay was used to assess for TCDD-mediated percent suppression as normalized to the vehicle control in the Serpinb2−/− and wildtype controls (A). RNA was isolated from Serpinb2−/− and wildtype controls that were exposed to TCDD (30 nM) for 2 days. QRTPCR was used to assess the level of TCDD-mediated Cyp1A1 induction in both strains as a marker of AHR activation (B). An ELISPOT was also used to assess the percentage of cells secreting IgM as normalized to the vehicle control in the Serpine1−/− mice and wildtype controls (C). RNA was isolated from Serpine1−/− and wildtype controls that were exposed to TCDD (30 nM) for 2 days. QRTPCR was used to assess the level of TCDD-mediated Cyp1A1 induction in both strains (D).
Serpine1−/− Mice Are Not More Susceptible to TCDD-Induced Immunosuppression.
To determine if the above results were specific to SERPINB2 activity, B cells were also analyzed from SERPINE1 null mice. Similar to the results from the Serpinb2−/− study, there was a significant TCDD-induced decrease in the percentage of cells secreting IgM in Serpine1−/− and wildtype controls (p < 0.05; Figure 7C). Significant increases in TCDD-induced Cyp1a1 mRNA expression were found in both strains as well (p < 0.05; respectively; Figure 7D). However, in comparing the TCDD treatments between the Serpine1−/− mice with wildtype controls, there was no significant differences in either the percentage of cells secreting IgM or in the induction of Cyp1a1 mRNA (Figure 7C,D). As such, the loss of SERPINE1 did not appear to affect sensitivity to TCDD-induced suppression in the number of antibody-secreting cells with similar levels of AHR activation between the Serpine1−/− and wildtype controls. Thus, the aforementioned differences in sensitivity appear to be specific to the activity of SERPINB2.
DISCUSSION
Traditional toxicological studies focused on environmental contaminants have rarely considered the influence of genetic variability when assessing risk associated with exposures. As genetic background has been shown to play an important role in influencing individual’s responses to chemicals, such information can be used to predict which individuals may be more susceptible to chemical-toxicity following exposure to certain chemicals and better understand the mechanism of toxicity.33,34 Here, a panel of genetically diverse mouse strains were used to scan for potential modifiers that impact the response to TCDD-mediated immunosuppression observed in human B cells.16
As CD40 signaling is highly conserved between mouse and human,35 the same CD40-ligand activation and TCDD exposure in vitro model was used in this study as our previous human-based study.16 Results indicated a wide-range in the mouse strain’s responses to TCDD-induced B cell suppression which was very-comparable to our previous human study (Figure 1A,B). The interstrain differences were used to identify a region of mouse Chromosome 1 that was significantly correlated with interstrain differences (Figure 2C and Figure 3). A gene within this region, Serpinb2, had previously been reported to be influenced at the level of mRNA expression by TCDD in mouse and human B cells.21 TCDD exposure was found to alter Serpinb2 expression at the transcriptional and translational level in CD40 ligand-activated B cells in the DBA/1J strain, but not in the C57BL/6J strain (Figure 4A, Figure 5A,B). Further functional analysis indicated that Serpinb2−/− mouse strain was found to be more sensitive to TCDD-mediated suppression in the percentage of cells secreting IgM, suggesting that SERPINB2 plays a protective role in TCDD-mediated immunosuppression of the B cell (Figure 7A). The induction of SERPINB2 in DBA/1J was found to correlate with a higher level of intracellular IgM on day 3 but not on day 4, which may suggest some time-dependence as to when the protection of TCDD-mediated suppression may occur (Figure 6B and 6C). Finally, the increased susceptibility to TCDD was found to be specific to Serpinb2 as the same phenotype was not observed in Serpine1−/− mice (Figure 7C).
On the basis of the expression patterns of PAI2, the human ortholog of Serpinb2, during infection and inflammatory stimuli (i.e., cytokines), PAI2 has been suggested to play an important role within the immune response.36,37 Previous reports, however, have primarily focused on the role of Serpinb2 in the macrophage where, after activation, SERPINB2 is one of the most abundant proteins.36,38–43 Although TCDD-induced Serpinb2 mRNA expression has been reported in human and mouse B cells activated with pokeweed mitogen,21 this is the first report indicating a TCDD-mediated increase Serpinb2 mRNA and SERPINB2 protein expression in CD40 ligand-activated B cells. As such, these findings suggest a novel role of Serpinb2 in B cell function and further confirms that Serpinb2 plays a key role within multiple-levels of immune function.
While SERPINB2/PAI2 has been extensively studied, its role in immune function still remains elusive.43 Here, we have shown that loss of the gene results in a greater sensitivity to TCDD-mediated immune suppression in mice. In speculating on the potential mechanism to explain this suppressed immunity, previous reports have identified that human PAI2 binds directly to proteasome subunit β1 which may provide some insight into the phenotype we observed.44 Past studies have also shown that CD40 signaling activates and promotes translocation of NFKB into the nucleus.45 As the proteasome has been shown to play a key role in regulating NFKB signaling in several cell types, including human B cells, previous reports have suggested that PAI2’s association with the proteasome may be involved in regulation of NFKB signaling.20,36,45–47 Similarly, Serpinb2−/− mice have also been reported to have enhanced levels of NFKB activity.36 Interestingly, the AHR and NFKB have been previously reported to interact both physically and via downstream signaling cascades.48–50 Furthermore, a recent paper has shown that upon TCDD treatment altered expression of NFKB/REL members may, along with AHR activation, mediate a decrease in Ig expression.51 As such, increased PAI2 expression may provide protection to less-sensitive strains via regulation of NFKB/REL signaling. Human PAI2 has also been reported to bind and protect retinoblastoma protein (RB1) from calpain cleavage ultimately leading to increase RB1 levels within the cell leading to increased cell survival.52 A physical interaction between AHR and RB1 has also been reported and this interaction might modulate the cell cycle.53,54 As such, the increase in the PAI2 pool within activated B cells may promote cell survival in an RB1-dependent manner. Finally, human PAI2 has been shown to bind and stabilize CDKN1A in human fibroblasts.55 Previous reports have noted B cells accumulate CDKN1A upon CD40 ligation.56 While CDKN1A is known to promote cell senescence, it also has been found to be necessary for the assembly and nuclear localization of cyclin D/CDK4 and, thus, progression to G1 phase of replication.57,58 Increased PAI2 expression, therefore, might increase the pool of CDKN1A to a level high-enough in the nucleus to move to the G1 phase contributing to the separation seen between the number of IgM secreting cells of sensitive and less-sensitive strains.56
Genetically diverse models have been used to inform human-based risk assessment in the past.33 Here, a genetically diverse mouse panel was used to characterize the functional role of Serpinb2 in TCDD-mediated suppression of the mouse B cell. The results from this study suggest that human PAI2 plays a role in mediating the IgM response. Notably, a number of Serpinb2 polymorphisms within the human population have been identified that impact a plethora of disease-states.59–63 While further research is needed, we speculate that polymorphisms that impact human PAI2 activity will alter individual’s susceptibility to TCDD-mediated immunosuppression and, more broadly, the CD40-mediated IgM response.
Supplementary Material
ACKNOWLEDGMENTS
This work was supported by the National Institute of Environmental Health Sciences Superfund Basic Research Program (NIEHS SBRP P42ES4911). J.J.L. is partially supported by AgBioResearch at Michigan State University. P.D. is supported by the National Institute of Environmental Health Sciences Training Grant at Michigan State University (T32 ES007255).
ABBREVIATIONS
- AHR
Aryl hydrocarbon Receptor
- ARNT
Aryl hydrocarbon receptor nuclear translocator
- CD40
Cluster of differentiation 40
- DMSO
Dimethyl Sulfoxide
- HSP90
Heat shock protein of 90 kDa
- PAI2
Plasminogen activator inhibitor-2
- SERPINB2
Serine peptidase inhibitor, clade B, member 2
- TCDD
2,3,7,8-tetrachlorodibenzo-p-dioxin
- AIP/ARA9
AHR-interacting protein
- IgM
Immunoglobulin-M
Footnotes
Supporting Information
The Supporting Information is available free of charge on the ACS Publications website at DOI: 10.1021/acs.chemrestox.8b00225.
List of the number of males and female mice used for each strain; regression model results used to estimate the heritability of TCDD-induced percent inhibition in the IgM response of primary mouse B cells; primer sequences used for QRTPCR; figure which provides an overview of the flow-cytometry gates used to assess B cells (PDF)
The authors declare no competing financial interest.
REFERENCES
- (1).Carver LA, LaPres JJ, Jain S, Dunham EE, and Bradfield CA (1998) Characterization of the Ah receptor-associated protein, ARA9. J. Biol. Chem 273, 33580–33587. [DOI] [PubMed] [Google Scholar]
- (2).Heid SE, Pollenz RS, and Swanson HI (2000) Role of heat shock protein 90 dissociation in mediating agonist-induced activation of the aryl hydrocarbon receptor. Mol. Pharmacol 57, 82–92. [PubMed] [Google Scholar]
- (3).Meyer BK, and Perdew GH (1999) Characterization of the AhR-hsp90-XAP2 core complex and the role of the immunophilin-related protein XAP2 in AhR stabilization. Biochemistry 38, 8907–8917. [DOI] [PubMed] [Google Scholar]
- (4).Sorg O (2014) AhR signalling and dioxin toxicity. Toxicol. Lett 230, 225–233. [DOI] [PubMed] [Google Scholar]
- (5).Abel J, and Haarmann-Stemmann T (2010) An introduction to the molecular basics of aryl hydrocarbon receptor biology. Biol. Chem 391, 1235–1248. [DOI] [PubMed] [Google Scholar]
- (6).Marinkovic N, Pasalic D, Ferencak G, Grskovic B, and Stavljenic Rukavina A (2010) Dioxins and human toxicity. Arh. Hig. Rada Toksikol 61, 445–453. [DOI] [PubMed] [Google Scholar]
- (7).Leng L, Chen X, Li CP, Luo XY, and Tang NJ (2014) 2,3,7,8-Tetrachlorodibezo-p-dioxin exposure and prostate cancer: a meta-analysis of cohort studies. Public Health 128, 207–213. [DOI] [PubMed] [Google Scholar]
- (8).Uemura H, Arisawa K, Hiyoshi M, Kitayama A, Takami H, Sawachika F, Dakeshita S, Nii K, Satoh H, Sumiyoshi Y, Morinaga K, Kodama K, Suzuki T, Nagai M, and Suzuki T (2009) Prevalence of metabolic syndrome associated with body burden levels of dioxin and related compounds among Japan’s general population. Environ. Health Perspect 117, 568–573. [DOI] [PMC free article] [PubMed] [Google Scholar]
- (9).Warner M, Mocarelli P, Brambilla P, Wesselink A, Samuels S, Signorini S, and Eskenazi B (2013) Diabetes, metabolic syndrome, and obesity in relation to serum dioxin concentrations: the Seveso women’s health study. Environ. Health Perspect 121, 906–911. [DOI] [PMC free article] [PubMed] [Google Scholar]
- (10).Kerkvliet NI (2002) Recent advances in understanding the mechanisms of TCDD immunotoxicity. Int. Immunopharmacol 2, 277–291. [DOI] [PubMed] [Google Scholar]
- (11).Holsapple MP, Morris DL, Wood SC, and Snyder NK (1991) 2,3,7,8-tetrachlorodibenzo-p-dioxin-induced changes in immunocompetence: possible mechanisms. Annu. Rev. Pharmacol. Toxicol 31, 73–100. [DOI] [PubMed] [Google Scholar]
- (12).Sulentic CE, and Kaminski NE (2011) The long winding road toward understanding the molecular mechanisms for B-cell suppression by 2,3,7,8-tetrachlorodibenzo-p-dioxin. Toxicol. Sci 120, S171–S191. [DOI] [PMC free article] [PubMed] [Google Scholar]
- (13).Phadnis-Moghe AS, Crawford RB, and Kaminski NE (2015) Suppression of human B cell activation by 2,3,7,8-tetrachlorodibenzo-p-dioxin involves altered regulation of B cell lymphoma-6. Toxicol. Sci 144, 39–50. [DOI] [PMC free article] [PubMed] [Google Scholar]
- (14).Lu H, Crawford RB, Suarez-Martinez JE, Kaplan BL, and Kaminski NE (2010) Induction of the aryl hydrocarbon receptor-responsive genes and modulation of the immunoglobulin M response by 2,3,7,8-tetrachlorodibenzo-p-dioxin in primary human B cells. Toxicol. Sci 118, 86–97. [DOI] [PMC free article] [PubMed] [Google Scholar]
- (15).Lu H, Crawford RB, Kaplan BL, and Kaminski NE (2011) 2,3,7,8-Tetrachlorodibenzo-p-dioxin-mediated disruption of the CD40 ligand-induced activation of primary human B cells. Toxicol. Appl. Pharmacol 255, 251–260. [DOI] [PMC free article] [PubMed] [Google Scholar]
- (16).Dornbos P, Crawford RB, Kaminski NE, Hession SL, and LaPres JJ (2016) The Influence of Human Interindividual Variability on the Low-Dose Region of Dose-Response Curve Induced by 2,3,7,8-Tetrachlorodibenzo-p-Dioxin in Primary B Cells. Toxicol. Sci 153, 352–360. [DOI] [PMC free article] [PubMed] [Google Scholar]
- (17).Thomas RS, Penn SG, Holden K, Bradfield CA, and Rank DR (2002) Sequence variation and phylogenetic history of the mouse Ahr gene. Pharmacogenetics 12, 151–163. [DOI] [PubMed] [Google Scholar]
- (18).Poland A, Palen D, and Glover E (1994) Analysis of the four alleles of the murine aryl hydrocarbon receptor. Mol. Pharmacol 46, 915–921. [PubMed] [Google Scholar]
- (19).Poland A, and Glover E (1990) Characterization and strain distribution pattern of the murine Ah receptor specified by the Ahd and Ahb-3 alleles. Mol. Pharmacol 38, 306–312. [PubMed] [Google Scholar]
- (20).Schroder WA, Major L, and Suhrbier A (2011) The role of SerpinB2 in immunity. Crit. Rev. Immunol 31, 15–30. [DOI] [PubMed] [Google Scholar]
- (21).Kovalova N, Nault R, Crawford R, Zacharewski TR, and Kaminski NE (2017) Comparative analysis of TCDD-induced AhR-mediated gene expression in human, mouse and rat primary B cells. Toxicol. Appl. Pharmacol 316, 95–106. [DOI] [PMC free article] [PubMed] [Google Scholar]
- (22).Nault R, Fader KA, Ammendolia DA, Dornbos P, Potter D, Sharratt B, Kumagai K, Harkema JR, Lunt SY, Matthews J, and Zacharewski T (2016) Dose-Dependent Metabolic Reprogramming and Differential Gene Expression in TCDD-Elicited Hepatic Fibrosis. Toxicol. Sci 154, 253–266. [DOI] [PMC free article] [PubMed] [Google Scholar]
- (23).R Core Team. (2015) R: A language and environment for statistical computing [Internet] R Foundation for Statistical Computing, Vienna, Austria; 2013 Document freely available on the internet at: http://www.r-project.org/. [Google Scholar]
- (24).Yalcin B, Wong K, Agam A, Goodson M, Keane TM, Gan X, Nellaker C, Goodstadt L, Nicod J, Bhomra A, Hernandez-Pliego P, Whitley H, Cleak J, Dutton R, Janowitz D, Mott R, Adams DJ, and Flint J (2011) Sequence-based characterization of structural variation in the mouse genome. Nature 477, 326–329. [DOI] [PMC free article] [PubMed] [Google Scholar]
- (25).Keane TM, Goodstadt L, Danecek P, White MA, Wong K, Yalcin B, Heger A, Agam A, Slater G, Goodson M, Furlotte NA, Eskin E, Nellaker C, Whitley H, Cleak J, Janowitz D, Hernandez-Pliego P, Edwards A, Belgard TG, Oliver PL, McIntyre RE, Bhomra A, Nicod J, Gan X, Yuan W, van der Weyden L, Steward CA, Bala S, Stalker J, Mott R, Durbin R, Jackson IJ, Czechanski A, Guerra-Assuncao JA, Donahue LR, Reinholdt LG, Payseur BA, Ponting CP, Birney E, Flint J, and Adams DJ (2011) Mouse genomic variation and its effect on phenotypes and gene regulation. Nature 477, 289–294. [DOI] [PMC free article] [PubMed] [Google Scholar]
- (26).Katoh K, Kuma K, Toh H, and Miyata T (2005) MAFFT version 5: improvement in accuracy of multiple sequence alignment. Nucleic Acids Res 33, 511–518. [DOI] [PMC free article] [PubMed] [Google Scholar]
- (27).Canty A, and Ripley B (2017) boot: Bootstrap R (S-Plus) Functions, R package version 1.3–20.
- (28).Wang J, Williams RW, and Manly KF (2003) WebQTL: web-based complex trait analysis. Neuroinformatics 1, 299–308. [DOI] [PubMed] [Google Scholar]
- (29).Mulligan MK, Mozhui K, Prins P, and Williams RW (2017) GeneNetwork: A Toolbox for Systems Genetics. Methods Mol. Biol 1488, 75–120. [DOI] [PMC free article] [PubMed] [Google Scholar]
- (30).Dougherty KM, Pearson JM, Yang AY, Westrick RJ, Baker MS, and Ginsburg D (1999) The plasminogen activator inhibitor-2 gene is not required for normal murine development or survival. Proc. Natl. Acad. Sci. U. S. A 96, 686–691. [DOI] [PMC free article] [PubMed] [Google Scholar]
- (31).Siefert SA, Chabasse C, Mukhopadhyay S, Hoofnagle MH, Strickland DK, Sarkar R, and Antalis TM (2014) Enhanced venous thrombus resolution in plasminogen activator inhibitor type-2 deficient mice. J. Thromb. Haemostasis 12, 1706–1716. [DOI] [PMC free article] [PubMed] [Google Scholar]
- (32).Carmeliet P, Kieckens L, Schoonjans L, Ream B, van Nuffelen A, Prendergast G, Cole M, Bronson R, Collen D, and Mulligan RC (1993) Plasminogen activator inhibitor-1 gene-deficient mice. I. Generation by homologous recombination and characterization. J. Clin. Invest 92, 2746–2755. [DOI] [PMC free article] [PubMed] [Google Scholar]
- (33).Dornbos P, and LaPres JJ (2018) Incorporating Population-Level Genetic Variability within Laboratory Models in Toxicology: From the Individual to the Population. Toxicology 395, 1. [DOI] [PMC free article] [PubMed] [Google Scholar]
- (34).Harrill AH, and McAllister KA (2017) New Rodent Population Models May Inform Human Health Risk Assessment and Identification of Genetic Susceptibility to Environmental Exposures. Environ. Health Perspect 125, 086002. [DOI] [PMC free article] [PubMed] [Google Scholar]
- (35).Spriggs MK, Armitage RJ, Strockbine L, Clifford KN, Macduff BM, Sato TA, Maliszewski CR, and Fanslow WC (1992) Recombinant human CD40 ligand stimulates B cell proliferation and immunoglobulin E secretion. J. Exp. Med 176, 1543–1550. [DOI] [PMC free article] [PubMed] [Google Scholar]
- (36).Schroder WA, Le TT, Major L, Street S, Gardner J, Lambley E, Markey K, MacDonald KP, Fish RJ, Thomas R, and Suhrbier A (2010) A physiological function of inflammation-associated SerpinB2 is regulation of adaptive immunity. J. Immunol 184, 2663–2670. [DOI] [PubMed] [Google Scholar]
- (37).Zhao A, Yang Z, Sun R, Grinchuk V, Netzel-Arnett S, Anglin IE, Driesbaugh KH, Notari L, Bohl JA, Madden KB, Urban JF Jr., Antalis TM, and Shea-Donohue T (2013) SerpinB2 is critical to Th2 immunity against enteric nematode infection. J. Immunol 190, 5779–5787. [DOI] [PMC free article] [PubMed] [Google Scholar]
- (38).Losick VP, and Isberg RR (2006) NF-kappaB translocation prevents host cell death after low-dose challenge by Legionella pneumophila. J. Exp. Med 203, 2177–2189. [DOI] [PMC free article] [PubMed] [Google Scholar]
- (39).Gan H, Lee J, Ren F, Chen M, Kornfeld H, and Remold HG (2008) Mycobacterium tuberculosis blocks crosslinking of annexin-1 and apoptotic envelope formation on infected macrophages to maintain virulence. Nat. Immunol 9, 1189–1197. [DOI] [PMC free article] [PubMed] [Google Scholar]
- (40).Costelloe EO, Stacey KJ, Antalis TM, and Hume DA (1999) Regulation of the plasminogen activator inhibitor-2 (PAI-2) gene in murine macrophages. Demonstration of a novel pattern of responsiveness to bacterial endotoxin. J. Leukocyte Biol 66, 172–182. [DOI] [PubMed] [Google Scholar]
- (41).Sekine H, Mimura J, Oshima M, Okawa H, Kanno J, Igarashi K, Gonzalez FJ, Ikuta T, Kawajiri K, and Fujii-Kuriyama Y (2009) Hypersensitivity of aryl hydrocarbon receptor-deficient mice to lipopolysaccharide-induced septic shock. Mol. Cell. Biol 29, 6391–6400. [DOI] [PMC free article] [PubMed] [Google Scholar]
- (42).Kruithof EK, Baker MS, and Bunn CL (1995) Biological and clinical aspects of plasminogen activator inhibitor type 2. Blood 86, 4007–4024. [PubMed] [Google Scholar]
- (43).Medcalf RL, and Stasinopoulos SJ (2005) The undecided serpin. The ins and outs of plasminogen activator inhibitor type 2. FEBS J. 272, 4858–4867. [DOI] [PubMed] [Google Scholar]
- (44).Fan J, Zhang YQ, Li P, Hou M, Tan L, Wang X, and Zhu YS (2004) Interaction of plasminogen activator inhibitor-2 and proteasome subunit, beta type 1. Acta Biochim. Biophys. Sin 36, 42–46. [DOI] [PubMed] [Google Scholar]
- (45).Berberich I, Shu GL, and Clark EA (1994) Cross-linking CD40 on B cells rapidly activates nuclear factor-kappa B. J. Immunol 153, 4357–4366. [PubMed] [Google Scholar]
- (46).Karin M, and Ben-Neriah Y (2000) Phosphorylation meets ubiquitination: the control of NF-[kappa]B activity. Annu. Rev. Immunol 18, 621–663. [DOI] [PubMed] [Google Scholar]
- (47).Kosaka Y, Calderhead DM, Manning EM, Hambor JE, Black A, Geleziunas R, Marcu KB, and Noelle RJ (1999) Activation and regulation of the IkappaB kinase in human B cells by CD40 signaling. Eur. J. Immunol 29, 1353–1362. [DOI] [PubMed] [Google Scholar]
- (48).Tian Y, Ke S, Denison MS, Rabson AB, and Gallo MA (1999) Ah receptor and NF-kappaB interactions, a potential mechanism for dioxin toxicity. J. Biol. Chem 274, 510–515. [DOI] [PubMed] [Google Scholar]
- (49).Tian Y (2009) Ah receptor and NF-kappaB interplay on the stage of epigenome. Biochem. Pharmacol 77, 670–680. [DOI] [PubMed] [Google Scholar]
- (50).Vogel CF, and Matsumura F (2009) A new cross-talk between the aryl hydrocarbon receptor and RelB, a member of the NF-kappaB family. Biochem. Pharmacol 77, 734–745. [DOI] [PMC free article] [PubMed] [Google Scholar]
- (51).Salisbury RL, and Sulentic CE (2015) The AhR and NF-kappaB/Rel Proteins Mediate the Inhibitory Effect of 2,3,7,8-Tetrachlorodibenzo-p-Dioxin on the 3′ Immunoglobulin Heavy Chain Regulatory Region. Toxicol. Sci 148, 443–459. [DOI] [PMC free article] [PubMed] [Google Scholar]
- (52).Tonnetti L, Netzel-Arnett S, Darnell GA, Hayes T, Buzza MS, Anglin IE, Suhrbier A, and Antalis TM (2008) SerpinB2 protection of retinoblastoma protein from calpain enhances tumor cell survival. Cancer Res. 68, 5648–5657. [DOI] [PMC free article] [PubMed] [Google Scholar]
- (53).Puga A, Barnes SJ, Dalton TP, Chang C, Knudsen ES, and Maier MA (2000) Aromatic hydrocarbon receptor interaction with the retinoblastoma protein potentiates repression of E2F-dependent transcription and cell cycle arrest. J. Biol. Chem 275, 2943–2950. [DOI] [PubMed] [Google Scholar]
- (54).Murray IA, Patterson AD, and Perdew GH (2014) Aryl hydrocarbon receptor ligands in cancer: friend and foe. Nat. Rev. Cancer 14, 801–814. [DOI] [PMC free article] [PubMed] [Google Scholar]
- (55).Hsieh HH, Chen YC, Jhan JR, and Lin JJ (2017) The serine protease inhibitor SerpinB2 binds and stabilizes p21 in senescent cells. J. Cell Sci 130, 3272–3281. [DOI] [PubMed] [Google Scholar]
- (56).Mullins MW, Pittner BT, and Snow EC (1998) CD40-mediated induction of p21 accumulation in resting and cycling B cells. Mol. Immunol 35, 567–580. [DOI] [PubMed] [Google Scholar]
- (57).Zhang H, Hannon GJ, and Beach D (1994) p21-containing cyclin kinases exist in both active and inactive states. Genes Dev. 8, 1750–1758. [DOI] [PubMed] [Google Scholar]
- (58).LaBaer J, Garrett MD, Stevenson LF, Slingerland JM, Sandhu C, Chou HS, Fattaey A, and Harlow E (1997) New functional activities for the p21 family of CDK inhibitors. Genes Dev. 11, 847–862. [DOI] [PubMed] [Google Scholar]
- (59).Palafox-Sanchez CA, Vazquez-Del Mercado M, Orozco-Barocio G, Garcia-De la Torre I, Torres-Carrillo N, Torres-Carrillo NM, Illades-Aguiar B, and Munoz-Valle JF (2009) A functional Ser(413)/Ser(413) PAI-2 polymorphism is associated with susceptibility and damage index score in systemic lupus erythematosus. Clin. Appl. Thromb./Hemostasis 15, 233–238. [DOI] [PubMed] [Google Scholar]
- (60).Vazquez-Del Mercado M, Garcia-Cobian TA, Munoz Valle JF, Torres-Carrillo N, Martin-Marquez BT, Arana-Argaez VE, Best-Aguilera CR, Martinez-Garcia EA, Petri MH, Nunez-Atahualpa L, and Delgado-Rizo V (2007) Genotype Ser413/Ser of PAI-2 polymorphism Ser413/Cys is associated with anti-phospholipid syndrome and systemic lupus erythematosus in a familial case: comparison with healthy controls. Scand. J. Rheumatol 36, 206–210. [DOI] [PubMed] [Google Scholar]
- (61).Buyru N, Altinisik J, Gurel CB, and Ulutin T (2003) PCR-RFLP detection of PAI-2 variants in myocardial infarction. Clin. Appl. Thromb./Hemostasis 9, 333–336. [DOI] [PubMed] [Google Scholar]
- (62).Corsetti JP, Salzman P, Ryan D, Moss AJ, Zareba W, and Sparks CE (2016) Influences on plasminogen activator inhibitor-2 polymorphism-associated recurrent cardiovascular disease risk in patients with high HDL cholesterol and inflammation. Atherosclerosis 250, 1–8. [DOI] [PubMed] [Google Scholar]
- (63).Andraweera PH, Dekker GA, Thompson SD, Nowak RC, Jayasekara RW, Dissanayake VH, and Roberts CT (2014) Polymorphisms in the fibrinolytic pathway genes and the risk of recurrent spontaneous abortion. Reprod. BioMed. Online 29, 745–751. [DOI] [PubMed] [Google Scholar]
Associated Data
This section collects any data citations, data availability statements, or supplementary materials included in this article.