Abstract
Metformin, the world’s most prescribed anti-diabetic drug, is also effective in preventing Type 2 diabetes in people at high risk1,2. Over 60% of this effect is attributable to metformin’s ability to lower body weight in a sustained manner3. The molecular mechanisms through which metformin lowers body weight are unknown. In two, independent randomised controlled clinical trials, circulating levels of GDF15, recently described to reduce food intake and lower body weight through a brain stem-restricted receptor, were increased by metformin. In wild-type mice, oral metformin increased circulating GDF15 with GDF15 expression increasing predominantly in the distal intestine and the kidney. Metformin prevented weight gain in response to high fat diet in wild-type mice but not in mice lacking GDF15 or its receptor GFRAL. In obese, high fat-fed mice, the effects of metformin to reduce body weight were reversed by a GFRAL antagonist antibody. Metformin had effects on both energy intake and energy expenditure that required GDF15. Metformin retained its ability to lower circulating glucose levels in the absence of GDF15 action. In summary, metformin elevates circulating levels of GDF15, which are necessary for its beneficial effects on energy balance and body weight, major contributors to its action as a chemopreventive agent.
Metformin has been used as a treatment for Type 2 diabetes since the 1950s. Recent studies have shown that it can also prevent or delay the onset of Type 2 diabetes in people at high risk1,2. At-risk individuals treated with metformin manifest a reduction in body weight, glucose and insulin levels and enhanced insulin sensitivity3. Although many mechanisms for the insulin sensitizing actions of metformin have been proposed4, none would explain weight loss. The robustness and persistence metformin-induced weight loss in participants in the Diabetes Prevention Program (DPP) has drawn attention to the importance of this to the chemopreventive effects of the drug 5. A recent observational epidemiological study6 noted a strong association of metformin use with circulating levels of GDF15, a peptide hormone produced by cells responding to stressors7. GDF15 acts through a receptor complex solely expressed in the hindbrain, through which it suppress food intake8–11. We hypothesized that metformin’s effects to lower body weight might involve the elevation of circulating levels of GDF15.
Human studies
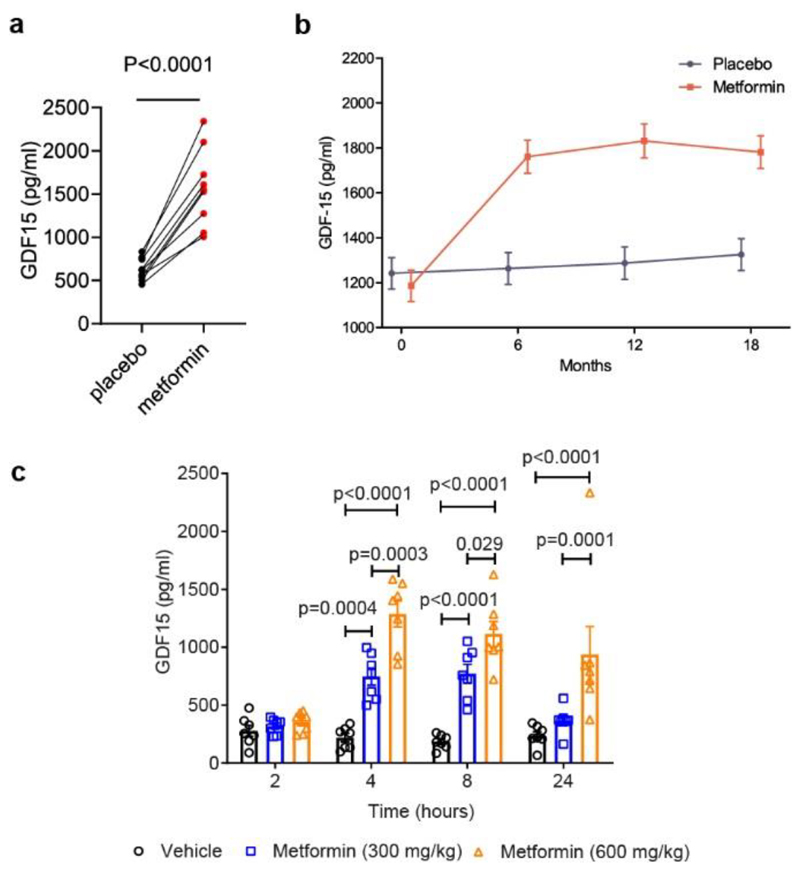
We first measured circulating GDF15 in a short term human study12 and found that after 2 weeks of metformin, there was a ~2.5-fold increase in mean circulating GDF15 (Fig. 1a).
Figure 1. Effect of Metformin on circulating GDF15 levels in humans and mice.
a, Paired serum GDF15 concentration in 9 human subjects after 2 weeks of either placebo or metformin, P (95% confidence interval) by 2-tailed t-test.
b, Plasma GDF15 concentration (mean± SEM) in overweight or obese non-diabetic participants with known cardiovascular disease randomised to metformin or placebo in CAMERA, using a mixed linear model. Subject numbers: placebo vs metformin, respectively, at time points: baseline, n=85 vs n=86; 6 months, n=81 vs n= 71;12 months, n=77 vs n=68; 18 months, n=83 vs n=74. Comparing metformin vs placebo groups, two-sided p=0.311 at baseline, and p<0.0001 at 6,12 and 18 months individually.
c, Serum GDF15 levels (mean± SEM) in obese mice measured 2, 4, 8 or 24 hours after a single oral dose of 300 mg/kg or 600 mg/kg metformin, n=7/group, P by 2-way ANOVA with Tukey’s correction for multiple comparisons.
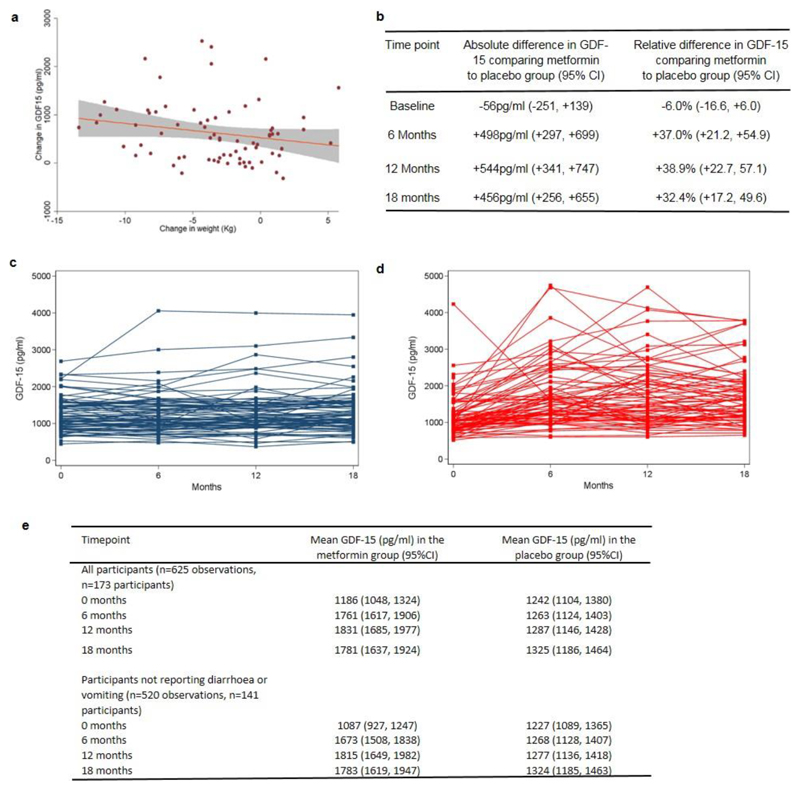
To determine if this increase was sustained, we measured circulating GDF15 levels at 6, 12 and 18 months in all available participants in CAMERA 13, a randomized placebo-control trial of metformin in people without diabetes but with a history of cardiovascular disease. In this study, metformin treated participants lost ~3.5% of body weight with no significant change in weight in the placebo arm13. Metformin treatment was associated with significantly (p < 0.0001) increased levels of circulating GDF15 at all three time points (Fig.1b and Extended Data Fig.1b,c,d,e). Furthermore, the change in serum GDF15 from baseline in metformin recipients was significantly correlated (r=-0.26, p=0.024) with weight loss (Extended Data Fig. 1a).
The correlation of GDF15 increment with changes in body weight, while statistically significant, was modest in size. While we consider it does contribute to weight loss in some individuals taking metformin, we acknowledge is by no means necessary and there are individuals with increases in GDF-15 that do not exhibit weight loss. However, in the context of a long term human study with imperfect drug compliance and intermittent sampling of GDF15 levels it is noteworthy that such an association was seen at all. Further, there was no association of weight change with change in GDF-15 in the placebo group (r=-0.0374, p=0.740, n=81).”
Murine studies
Following these findings in humans, we undertook a series of animal experiments to determine the potential causal link between the changes in GDF-15 and weight changes induced by metformin. We administered metformin to high fat diet fed mice by oral gavage and measured serum GDF15. A single dose of 300 mg/kg of metformin increased GDF15 levels for at least 8 hours (Fig. 1c). A higher dose of metformin, 600 mg/kg, increased serum GDF15 levels sixfold at 4 and 8-hours post-dose, which were sustained over vehicle-treated mice for 24 hours. The effects of metformin in chow-fed mice were less pronounced (Extended Data Fig.2) suggesting an interaction between metformin and the high fat fed state.
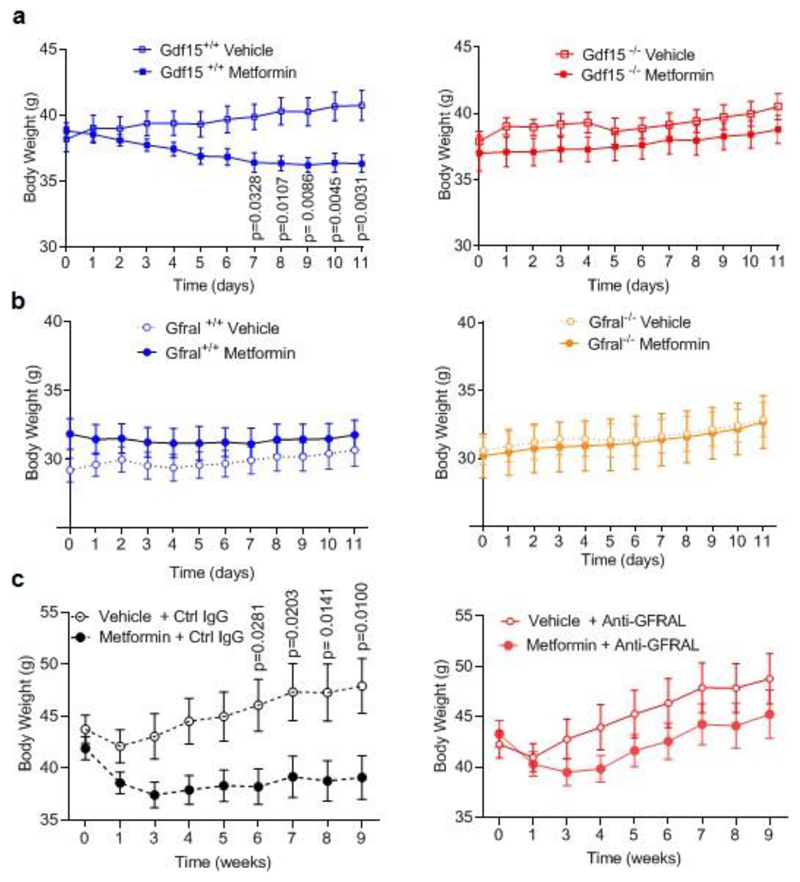
To determine the extent to which metformin- induced increase in GDF15 affects body weight, Gdf15 +/+ and Gdf15 -/- mice were switched from chow to a high fat diet and dosed with metformin for 11 days. High fat feeding induced similar weight gain in both genotypes (Fig. 2a). Metformin completely prevented weight gain in Gdf15 +/+ mice but Gdf15 -/- mice were insensitive to the weight-reducing effects of metformin (Fig.2a, Extended data Fig.3a). Metformin significantly reduced cumulative food intake in wild type mice but this effect was abolished in Gdf15-/- mice (Fig. 2b).
Figure 2. GDF15/GFRAL signalling is required for the weight loss effects of metformin on a high fat diet.
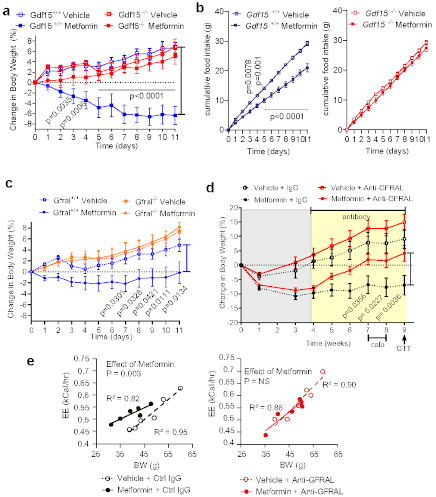
a, Percentage change in body weight of Gdf15+/+ and Gdf15-/- mice on a high-fat diet treated with metformin (300mg/kg/day) for 11 days, mean ± SEM, n=6/group except Gdf15+/+ vehicle n=7, P by 2-way ANOVA with Tukey’s correction for multiple comparisons.
b, Cumulative food intake of mice as Figure 2a, P by 2-way ANOVA with Tukey’s correction for multiple comparisons.
c, Percentage change in body weight of Gfral+/+ and Gfral-/- mice on a high-fat diet treated with metformin (300mg/kg/day) for 11 days, mean ± SEM, n=6/groups, P by 2-way ANOVA with Tukey’s correction for multiple comparisons.
d, Percentage change in body weight of metformin-treated obese mice dosed with an anti-GFRAL antagonist antibody, weekly for 5 weeks (yellow), starting 4 weeks after initial metformin exposure (grey),mean ± SEM, n=7 Vehicle + control IgG and Metformin + anti –GFRAL, n=8 other groups, P by 2-way ANOVA with Tukey’s correction for multiple comparisons. “calo” = period in which energy expenditure measured (see Figure 2e), Arrow and “GTT”- timing of oral glucose tolerance test (see Figure 3e-h).
e, ANCOVA analysis of energy expenditure against body weight of mice treated as in Figure 2d, n=6 mice/group. Data are individual mice and P for metformin calculated using ANCOVA with body weight as a covariate and treatment as a fixed factor.
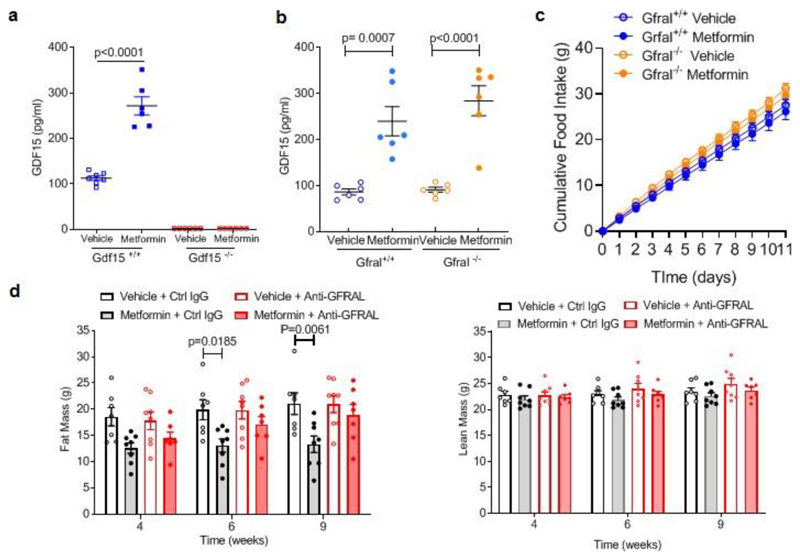
The identical protocol was applied to mice lacking GFRAL, the ligand-binding component of the hindbrain-expressed GDF15 receptor complex. Consistent with the results in mice lacking GDF15, metformin was unable to prevent weight gain in Gfral-/- mice (Fig. 2c, Extended data Fig.3b), despite similar levels of serum GDF15 (Extended Data Fig. 4a,b). In this experiment, the reduction in cumulative food intake did not reach statistical significance (Extended Data Fig. 4c).
To investigate the contribution of GDF15/GFRAL signalling to sustained, metformin-dependent weight regulation, we performed a 9-week study in which mice received approximately 250-300 mg/kg/day of metformin incorporated into their high-fat diet. The mice lost around 9% of their body weight after 1 month on this diet (Fig. 2d). At this time, an anti-GFRAL antagonist antibody or IgG control was administered. Metformin-consuming mice treated with anti-GFRAL regained ~12% body weight after 5 weeks, while the weight loss seen in IgG control treated mice was maintained, reaching ~7% below starting weight (Fig. 2d). The significant reduction in fat mass seen with metformin treatment and control antibody was not seen in the anti-GFRAL group. (Extended Data Fig. 4d). The delivery of metformin in chow resulted in an initial reduction in food intake in all metformin treated groups, presumably because of a taste effect. This reduction in food intake will have affected metformin levels and is likely to have impacted GDF15 levels with potential to bias the results. However, it is reassuring to note that any persistence of this would have worked against the detection of a specific effect of GFRAL antagonism, which was clearly demonstrable. We undertook indirect calorimetry in metformin- and placebo-treated mice treated with anti-GFRAL antibody to establish whether there are additional effects on energy expenditure. Data were analysed by ANCOVA with body weight as the co-variate. Metformin treatment resulted in a significant increase in metabolic rate which was blocked by antagonism of GFRAL (Fig. 2e). Thus under conditions where GDF15 levels are increased by metformin, body weight reduction is contributed to by both reduced food intake and an inappropriately high energy expenditure.
GDF15 and glucose homeostasis
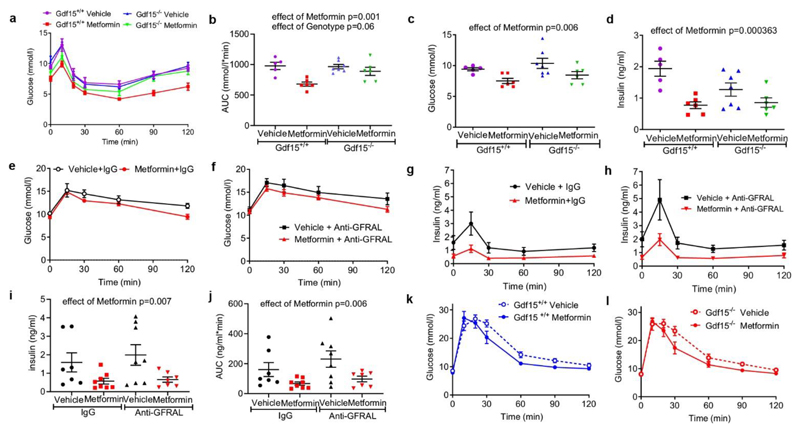
To examine the extent to which the insulin sensitising effects of metformin are dependent on GDF15 we repeated the experiment described in Fig.2a (see Extended Data Fig. 5), undertaking insulin tolerance testing in metformin and vehicle-treated GDF15 null mice and their wild type littermates (Fig. 3a). Circulating metformin levels achieved in both genotypes were identical (Extended Data Fig. 5d) and consistent with the high end of the human therapeutic range 14. Metformin significantly increased insulin sensitivity as assessed by the area under the plasma glucose curve with no significant effect of genotype (Fig. 3b). Similarly, metformin reduced fasting blood glucose and fasting insulin in a GDF15-independent manner (Fig. 3 c,d).
Figure 3. Effects of metformin on glucose homeostasis.
a, Insulin tolerance test (ITT) (insulin=0.5 U/kg) after 11 days of metformin treatment (300mg/kg) to high fat fed Gdf15 +/+ and Gdf15 -/- mice, glucose levels are mean ± SEM, n=6/group, except Gdf15 -/- vehicle= 7, Gdf15+/+ vehicle= 5.
b, Area under curve (AUC) analysis of glucose over time in Figure 3a, mean ± SEM, P by 2-way ANOVA, interaction of genotype and metformin p= 0.037.
c, Fasting glucose (time 0) of ITT in Figure 3a, mean ± SEM, P by 2-way ANOVA, effect of genotype p= 0.144, interaction of genotype and metformin p= 0.988.
d, Fasting insulin (time 0) of ITT in Figure 3a, mean ± SEM, P by 2-way ANOVA, effect of genotype p= 0.131, interaction of genotype and metformin p 0.056.
e, f, Glucose over time after oral glucose tolerance test (GTT) in metformin treated obese mice given either IgG (e) or anti –GFRAL (f) once weekly for 5 weeks (as Figure 2d). AUC analysis by 2-way ANOVA, effect of antibody p= 0.031, effect of metformin p= 0.072, interaction of antibody and metformin p 0.91.
g, h, Insulin (mean ± SEM) over time after GTT in mice as Figure 3e and f.
i, Fasting insulin (time 0) of GTT in mice as Figure 3e and f, mean ± SEM, P by 2-way ANOVA, effect of antibody p= 0.544, interaction of genotype and metformin p 0.691.
j, AUC analysis of insulin over time in Figure 3g and h, mean ± SEM, P by 2 -way ANOVA, effect of antibody p= 0.197, interaction of genotype and metformin p 0.607.
k, l, Glucose (mean ± SEM) over time after intraperitoneal GTT in high fat fed mice given single dose of oral metformin (300mg/kg) 6 hrs before GTT, n=8/group.
We also undertook oral glucose tolerance testing of metformin treated mice given either control IgG or anti-GFRAL antibody for 5 weeks (Fig 3e,f, Extended Data Fig. 6a and see Fig. 2d). Although the effect of metformin glucose disposal at OGTT as assessed by the area under the plasma glucose curve did not reach statistical significance (2W ANOVA, p=0.072), there was a significant effect of metformin on insulin, both fasting and AUC after glucose bolus, that was independent of antibody (Fig. 3 g,h,i,j).
As these mice were of different body weight at the time of assessment (Fig. 2d and Extended Data Fig. 3c), we undertook further glucose tolerance testing in a cohort of weight matched Gdf15 +/+ and Gdf15-/- mice that had been fed a high fat diet for 2 weeks before receiving a single dose of metformin (300mg/kg) (Fig 3k,l and Extended Data Fig. 6b-d) In these mice there was a significant effect of metformin upon glucose (AUC plasma glucose) that was independent of GDF15 (extended Data Fig. 6 e).
Metformin’s effect to lower fasting glucose and insulin and to improve glucose tolerance appear not to require GDF15. Given the “a priori” expected effect of weight loss on insulin sensitivity it is worthy of comment that the effect of GDF15 status on insulin sensitivity as measured by ITT (Fig 3b) fell just short of statistical significance. In the follow up of the DPP study in non–diabetic individuals, weight loss after 5 years of metformin therapy was approximately 6.5% of baseline weight5. We therefore estimated the effect of a 6.5% weight loss on improvements in fasting insulin over 5 years in the Ely Study, a prospective observational population-based cohort study of men (n=465) and women (n=634) in the UK (mean age 52 years, mean BMI 26 at baseline)15, showing that this magnitude of weight loss was associated with a reduction in fasting plasma insulin (mean ±95% CI) of -5.74 (-9.03, -2.45) pmol/l in women and -8.78 (-16.24, -1.33) in men. We conclude that while there are GDF15-independent effects of metformin on circulating levels of glucose and insulin, it is likely that the GDF15 dependent weight loss will make a contribution to enhancing insulin sensitivity.
Source of GDF15 production
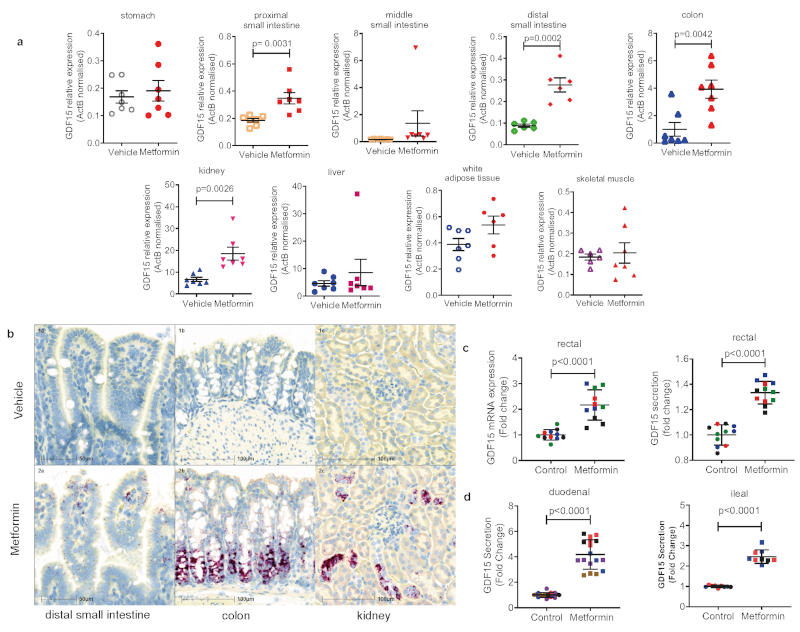
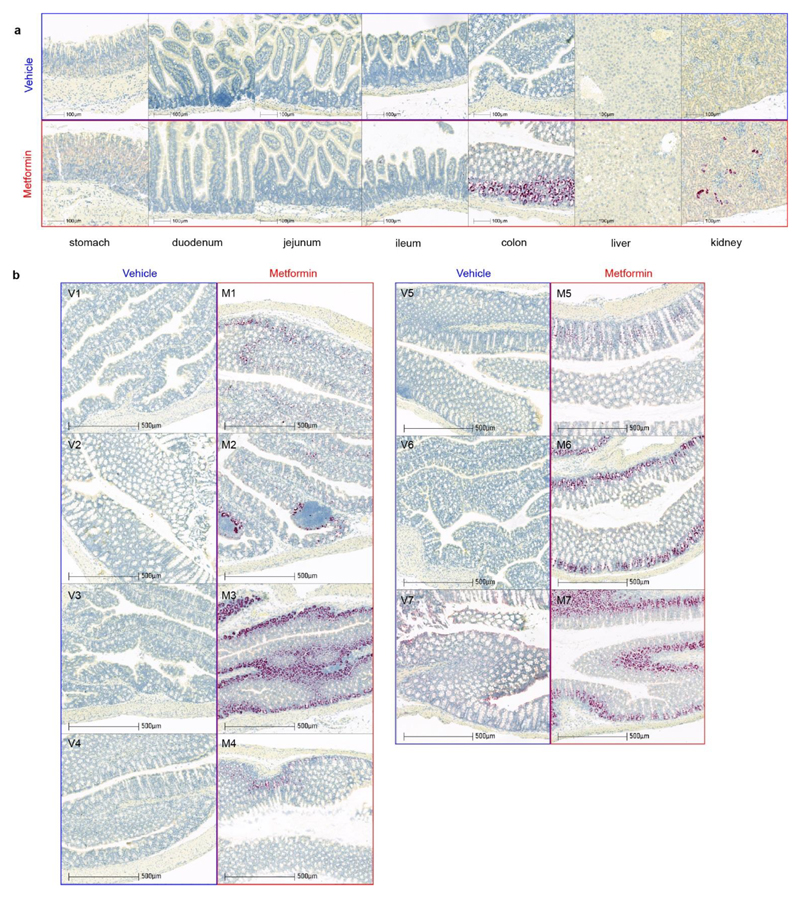
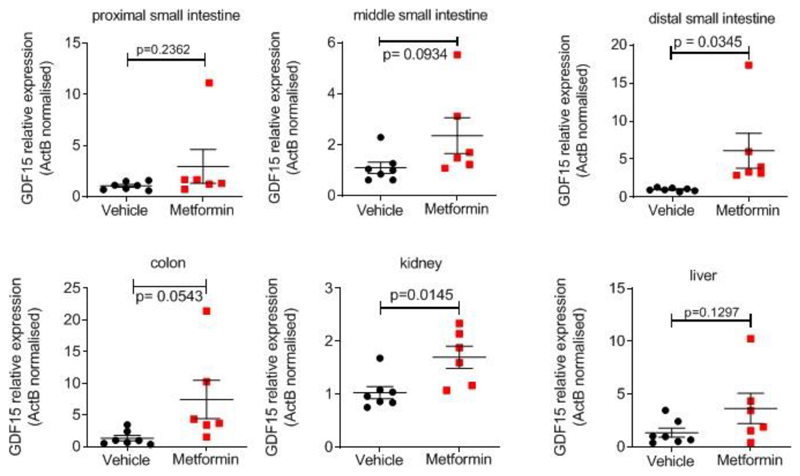
We examined GDF15 gene expression in a tissue panel obtained from mice fed a high fat diet (for 4 weeks) and sacrificed 6 hours after a single gavage dose of metformin (600mg/kg). Circulating concentrations of GDF15 increased about 5.5 fold compared to vehicle treated mice (Extended Data Fig. 6f). Gdf15 mRNA was significantly increased by metformin in small intestine, colon and kidney. (Fig. 4a). In situ hybridisation studies demonstrated strong Gdf15 expression in crypt enterocytes in the colon and small intestine and in periglomerular renal tubular cells (Fig. 4b, Extended Data Fig. 7a, b). We confirmed these sites of tissue expression in HFD fed mice (those used in Fig 2a), treated with metformin for 11 days (Extended Data Fig. 8).
Figure 4. Metformin increases GDF15 expression in the enterocytes of distal intestine and the renal tubular epithelial cells.
a, Gdf15 mRNA expression (normalised to expression levels of ActB) in tissues from high-fat fed wild type mice 6 hrs after single dose of oral metformin (600mg/kg), mean ± SEM, n=7/group, P value (95% confidence interval) by two tailed t-test.
b, In situ hybridization for Gdf15 mRNA (red spots) n= 7 per group. Representative images from the mouse with circulating GDF15 level closest to group median, either vehicle-treated (panel 1a,1b,1c, blue box) or metformin-treated (panels 2a, 2b, 2c, red box). Mice from groups described in Figure 4a.
c, Gdf15 mRNA expression (left panel) and GDF15 protein in supernatant (right panel) of human derived 2D monolayer rectal organoids treated with metformin. Each colour represents independent experiments (n= 4), mean ± SD, P value (95% confidence interval) by two-tailed t-test.
d, GDF15 protein in supernatants of mouse-derived 2D monolayer duodenal (left panel) and ileal (right panel) organoids treated with metformin. Each colour represents independent experiment (duodenal n= 5, ileal n=3),mean ± SD, P value (95% confidence interval) by two-tailed t-test.
Further, in human (Fig. 4c) and murine (Fig. 4d) intestinal-derived organoids grown in 2D transwells and treated with metformin, we saw a significant induction of mRNA expression and GDF15 protein secretion.
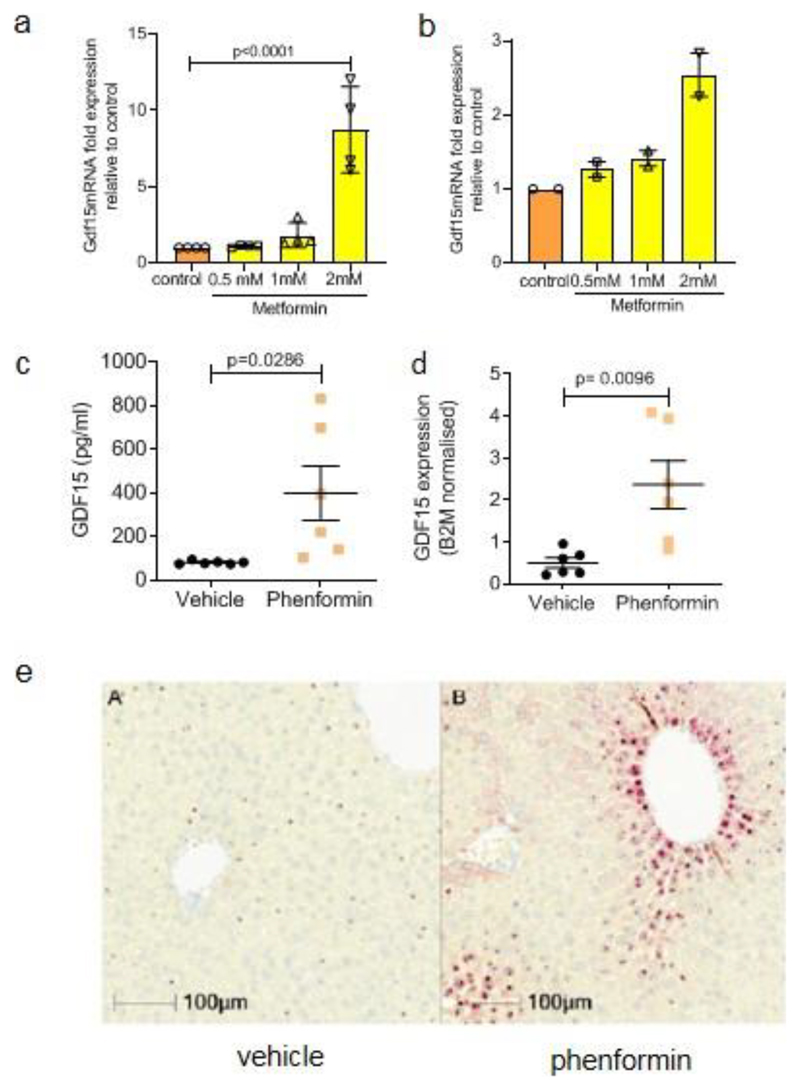
Given the proposed importance of the liver for metformin’s metabolic action it was notable that the dominant GDF15 expression signal was not from the liver (Fig. 4a, Extended Data Fig. 7a, Extended Data Fig. 8). To test whether hepatocytes are capable of responding to biguanide drugs with an increase in GDF15 we incubated freshly isolated murine hepatocytes (Extended Data Fig. 9a) and stem-cell derived human hepatocytes (Extended Data Fig. 9b) with metformin and found a clear induction of GDF15 expression. Additionally, acute administration of the more cell penetrant biguanide drug phenformin to mice increased circulating GDF15 levels (Extended Data Fig. 9c) and markedly increased Gdf15 mRNA expression in hepatocytes (Extended Data Fig. 9d,e). We conclude that biguanides can induce GDF15 expression in many cell types, but at least when given orally to mice, GDF15 mRNA is most strikingly induced in the distal small intestine, colon and kidney.
GDF15 expression has been reported to be a downstream target of the cellular integrated stress response (ISR) pathway16–18.Gdf15 mRNA levels were increased in kidney and colon 24 h after a single oral dose of metformin and these changes correlated positively with the fold elevation of CHOP mRNA (Extended Data Fig. 10a,b). As phenformin has broader cell permeability than metformin19 we used it to explore the effects of biguanides on the ISR and its relationship to GDF15 expression in cells. In murine embryonic fibroblasts (MEFs), which do not express the organic cation transporters needed for the uptake of metformin, phenformin (but not metformin) increased EIF2α phosphorylation, ATF4 and CHOP expression, (Extended Data Fig. 10c) and GDF15 mRNA (Extended Data Fig. 10d), though the changes in EIF2a phosphorylation and ATF4 and CHOP expression were modest compared with those induced by tunicamycin despite similar levels of GDF15 mRNA induction. Both genetic deletion of ATF4 and siRNA-mediated knockdown of CHOP significantly reduced phenformin-mediated induction of GDF15 mRNA expression (Extended Data Fig. 10e,f). In addition, phenformin induction of GDF15 was markedly reduced by co-treatment with the EIF2α inhibitor, ISRIB but, notably, not by the PERK inhibitor, GSK2606414 (Extended Data Fig. 10g). Further, GDF15 secretion in response to metformin in murine duodenal organoids was also significantly reduced by co-treatment with ISRIB (Extended Data Fig. 10h). However, gut organoids derived from CHOP null mice are still able to increase GDF15 secretion in response to metformin (Extended Data Fig. 10i) indicating the existence of CHOP-independent pathways under some circumstances. The data suggest that the effects of biguanides on GDF15 expression are at least partly dependent on the ISR pathway but are independent of PERK. However, the relative importance of components of the ISR pathway may vary depending on specific cell type, dose and agent used.
Our observations represent a significant advance in our understanding of the action of metformin, one of the world’s most frequently prescribed drugs. Metformin increases circulating GLP1 levels20–22, but its metabolic effects in mice are unimpaired in mice lacking the GLP-1 receptor 23. Metformin alters the intestinal microbiome24,25 but it is challenging to firmly establish acausal relationship to the beneficial effects of the drug26.
In the work presented herein, we describe a body of data from humans, cells, organoids and mice that securely establish a major role for GDF15 in the mediation of metformin’s beneficial effects on energy balance. While these effects likely contribute to metformin’s role as an insulin sensitizer, metformin continues to have effects to lower glucose and insulin in the absence of GDF15.
While there have been many mechanisms suggested for the glucoregulatory mechanisms of metformin27 there has been less attention paid to its effects on weight. Our discoveries relating to metformin’s effects via GDF15 provide a compelling explanation for this important aspect of metformin action.
It is notable that the lower small intestine and colon are a major site of metformin induced GDF15 expression. A body of work is emerging which strongly implicates the intestine as a major site of metformin action. Metformin increased glucose uptake into colonic epithelium from the circulation28 and a gut-restricted formulation of metformin had greater glucose lowering efficacy than systemically absorbed formulations 29. Our finding that the intestine is a major site of metformin-induced GDF15 expression provides a further mechanism through which metformin’s action on the intestinal epithelium may mediate some of its benefits.
Methods
Human Studies
We analysed samples from 9 participants from a study with a placebo-controlled, double-blind crossover design (previously described in12). In brief, placebo or metformin (week 1, 500mg twice daily; week, 2 1000mg twice daily) were administered following a six week period of washout. Samples were collected in the morning after overnight fasting. The study was approved by the Mayo Clinic Institutional Review Board and all participants provided written, informed consent (NCT01956929).
CAMERA was a randomized, double-blinded, placebo-controlled trial designed to investigate the effect of metformin on surrogate markers of cardiovascular disease in patients without diabetes, aged 35 to 75, with established coronary heart disease and a large waist circumference (≥ 94cm in men, ≥80 cm in women) (NCT00723307). This single-centre trial enrolled 173 adults who were followed up for 18 months each. A detailed description of the trial and its results has been published previously13. In brief, participants were randomized 1:1 to 850mg metformin or matched placebo twice daily with meals. Participants attended six monthly visits after overnight fasts and before taking their morning dose of metformin. Blood samples collected during the trial were centrifuged at 4 degrees Celsius soon after sampling, separated and stored at -80°C
All participants provided written informed consent. The study was approved by the Medicines and Healthcare Products Regulatory Agency and West Glasgow Research Ethics Committee, and done in accordance with the principles of the Declaration of Helsinki and good clinical practice guidelines.
Serum GDF15 assays were completed by the Cambridge Biochemical Assay Laboratory, University of Cambridge. Measurements were undertaken with antibodies & standards from R&D Systems (R&D Systems Europe, Abingdon UK) using a microtiter plate-based two-site electrochemiluminescence immunoassay using the MesoScale Discovery assay platform (MSD, Rockville, Maryland, USA).
Mouse Studies
Studies were carried out in two sites; NGM Biopharmaceuticals, California, USA and University of Cambridge, UK.
At NGM, all experiments were conducted with NGM IACUC approved protocols and all relevant ethical regulations were complied with throughout the course of the studies, including efforts to reduce the number of animals used. Experimental animals were kept under controlled light (12hour light and 12hour dark cycle, dark 6:30 pm - 6:30 am), temperature (22 ± 3°C) and humidity (50% ± 20%) conditions. They were fed ad libitum on 2018 Teklad Global 18% Protein Rodent Diet containing 24 kcal% fat, 18 kcal% protein and 58 kcal% carbohydrate, or on high fat rodent diet containing 60 kcal% fat, 20 kcal% protein and 20 kcal% carbohydrates from Research Diets D12492i,(New Brunswick NJ 089901 USA) herein referred to as “60%HFD”.
In Cambridge, all mouse studies were performed in accordance with UK Home Office Legislation regulated under the Animals (Scientific Procedures) Act 1986 Amendment, Regulations 2012, following ethical review by the University of Cambridge Animal Welfare and Ethical Review Body (AWERB). They were maintained in a 12-hour light/12-hour dark cycle (lights on 0700–1900), temperature-controlled (22°C) facility, with ad libitum access to food (RM3(E) Expanded chow, Special Diets Services, UK) and water. Any mice bought from an outside supplier were acclimatised in a holding room for at least one week prior to study. During study periods they were fed ad libitum high fat diet, either D12451i (45 kcal% fat, 20 kcal% protein and 35 kcal% carbohydrates, herein referred to as “45%HFD”) or D12492i (Research Diets, as above) as highlighted in individual study.
Sample sizes were determined on the basis of homogeneity and consistency of characteristics in the selected models and were sufficient to detect statistically significant differences in body weight, food intake and serum parameters between groups. Experiments were performed with animals of a single gender in each study. Animals were randomized into the treatment groups based on body weight such that the mean body weights of each group were as close to each other as possible, but without using excess number of animals. No samples or animals were excluded from analyses. Researchers were not blinded to group allocations.
Mouse study 1. Acute two- dose metformin study in high fat diet fed mice
Male C57Bl6/J mice fed 60% HFD for 17 weeks were studied aged 23 weeks (body weight, mean±SEM, 45.6±0.8g). Metformin (Sigma-Aldrich # 1396309) was reconstituted in water at 30 mg/ml for oral gavage and given in early part of light cycle. Terminal blood was collected by cardiac puncture into EDTA- coated tubes. GDF15 levels were measured using Mouse/Rat GDF15 Quantikine ELISA Kit (Cat#: MGD-150, R&D Systems, Minneapolis, MN) according to the manufacturers’ instructions. RNA was isolated from tissues using the Qiagen RNeasy Kit. RNA was quantified and 500ng was used for cDNA synthesis (SuperScript VILO 11754050 ThermoFisher) followed by qPCR. All Taqman probes were purchased from Applied Biosystems. All genes are expressed relative to 18s control probe and were run in triplicate.
Mouse study 2. Acute metformin study in chow fed animals
2.i) ad libitum group
Male C57BL6/J mice (Charles River, Margate, UK) were studied at 11 weeks old. 500mg of metformin was dissolved in 20 mls of water to make a working stock of 25mg/ml. 1 hr after onset of light cycle mice received a single dose by oral gavage of either metformin at 300mg/kg dose (Sigma, PHR1084-500MG) or matched volume of vehicle (water). Weight (mean± SEM) of control and treatment groups were 27.2 ± 0.3 vs 26.7 ± 0.2 g, respectively on day of study. After gavage mice were returned to an individual cage and were sacrificed at relevant time point by terminal anaesthesia (Euthatal by Intraperitoneal injection). Blood was collected into Sarstedt Serum Gel 1.1ml Micro Tube, left for 30mins at room temperature, spun for 5mins at 10k at 40C before being frozen and stored at -80oC until assayed. Mouse GDF15 levels were measured using a Mouse GDF15 DuoSet ELISA (R&D Systems) which had been modified to run as an electrochemiluminescence assay on the Meso Scale Discovery assay platform.
2.ii) fasted group
Mice, conditions and methods as in (2.i) except male mice studied at 9 weeks old and that 12 hr prior to administration of metformin mice and bedding were transferred to new cages with no food in hopper. Weight (mean± SEM) after fasting and on day of gavage were 22.3±0.5 g and 23.2±0.7g for control and treatment groups, respectively.
Mouse study 3. Metformin to high fat diet fed Gdf15 -/- mice and wild type controls
C57BL/6N-Gdf15tm1a(KOMP)Wtsi/H mice (herein referred to as “Gdf15 -/- mice“) were obtained from the MRC Harwell Institute which distributes these mice on behalf of the European Mouse Mutant Archive (www.infrafrontier.eu). The MRC Harwell Institute is also a member of the International Mouse Phenotyping Consortium (IMPC) and has received funding from the MRC for generating and/or phenotyping the C57BL/6N-Gdf15tm1a(KOMP)Wtsi/H mice. The research reported in this publication is solely the responsibility of the authors and does not necessarily represent the official views of the Medical Research Council. Associated primary phenotypic information may be found at www.mousephenotype.org. Details of the alleles have been published30–32.
Experimental cohorts of male Gdf15 -/- and wild type mice were generated by het x het breeding pairs. Mice were aged between 4.5 and 6.5 months. One week prior to study start mice were single housed and 3 days prior to first dose of metformin treatment, mice were transferred from standard chow to 60% high fat diet. On day of first gavage body weight of study groups (mean±SEM) were 38.2±1.0g vs 38.8±0.6g for wild type vehicle and metformin treatment respectively, and 37.9±0.8g vs 37.0±1.4g for Gdf15 -/- vehicle and metformin treatment respectively. Each mouse received a daily gavage of either vehicle or metformin for 11 days, and their body weight and food intake measured daily in the early part of the light cycle. One data point of 25 food intake points collected on day11 of study was lost due to technical error (mouse; Gdf15 +/+ metformin). On day 11 mice were sacrificed by terminal anaesthesia 4 hours post gavage, blood was obtained as in study 2. Tissues were fresh frozen on dry ice and kept at -800C until day of RNA extraction.
Mouse study 4. Metformin to high fat diet fed Gfral -/- mice
Gfral-/- mice were purchased from Taconic (#TF3754) on a mixed 129/SvEv-C57BL/6 background and backcrossed for 10 generations to >99% C57BL/6 background at NGM’s animal facility. Experimental cohorts were generated by het X het breeding pairs. Study design as Study 3, except terminal blood was collected into EDTA-coated tubes.
Mouse study 5. Anti GFRAL antibody to metformin treated high fat diet fed mice
Anti-GFRAL antibody generation
Anti-GFRAL monoclonal antibodies were generated by immunizing C57Bl/6 mice with recombinant purified GFRAL ECD-hFc fusion protein, which was purified via sequential protein-A affinity and size exclusion chromatography (SEC) techniques using MabSelect SuRe and Superdex 200 purification media respectively (GE Healthcare), as described in patent number US10174119B2, https://patents.google.com/patent/US10174119B2/en. An in-house pTT5 hIgK hIgG1 expression vector was engineered to include the DEVDG (caspase-3) proteolytic site N-terminal to the Fc domain. The heavy chains of anti-GFRAL mAbs were subcloned via EcoR1/HindIII sites of in-house engineered pTT5 hIgK hIgG1 caspase-cleavable vector. Light chains of anti-GFRAL mAbs were also subcloned within the EcoR1/HindIII sites in the pTT5 hIgK hKappa vector. The antibody were transiently expressed in Expi293 cells (Thermo Fisher Scientific) transfected with the pTT5 expression vector, and purified from conditioned media by sequential protein-A affinity and size-exclusion chromatographic (SEC) methods using MabSelect SuRe and Superdex 200 purification media respectively (GE Healthcare). All purified antibody material was verified endotoxin-free and formulated in PBS for in vitro and in vivo studies. Characterization of anti-GFRAL functional blocking antibodies was carried out using a cell-based RET/GFRAL luciferase gene reporter assays, in vitro binding studies (ELISA and Biacore) and in vivo studies, as described in patent number; US10174119B2, https://patents.google.com/patent/US10174119B2/en).
In all studies with anti-GFRAL, purified recombinant non-targeting IgG on the same antibody framework was used as control. Metformin was mixed with food paste made from the 60 kcal% fat diet (Research diet# D12492) using a food blender at a concentration to achieve an approximate consumption of 300mg/kg metformin per day per mouse. Male animals were single housed throughout and at start of study period body weight (mean ±SEM) was 43.7±1.4g, 42.3±1.4g, 41.9±1.1g,43.3±1.3g, veh + control IgG, veh +anti-GFRAL, metformin + control IgG, Metformin + anti-GFRAL, respectively. Recombinant antibodies were administered by subcutaneous injection in the early part of the light cycle. Body composition (lean and fat mass) was analyzed by ECHO MRI M113 mouse system (Echo Medical Systems). The metabolic parameters oxygen consumption (VO2) and carbon dioxide production (VCO2) were measured by an indirect calorimetry system (LabMaster TSE System, Germany) in open circuit sealed chambers. Measurements were performed for the dark (from 6pm to 6am) or light (from 6am to 6pm) period under ad libitum feeding conditions. Mice were placed in individual metabolic cages and allowed to acclimate for a period of 24 hours prior to data collection in every 30 minutes.
Finally, mice underwent a glucose tolerance test. Mice were fasted for 6 hours (7am-1pm) in a clean cage. Blood samples (~30 ul) were collected as baseline prior to oral glucose tolerance test. Mice were orally gavaged with 1 g/kg of 20% glucose solution with a dosing volume of 5 mL/kg. Blood samples were then collected through tail nick into K2EDTA-coated tubes (SARSTEDT Microvette; REF 20.1278.100) at 15, 30, 60 and 120 minutes post glucose challenge. Blood samples were centrifuged at 4 °C and the separated plasma are stored at -20 °C until used for plasma glucose and insulin assays. Glucose assay reagents obtained from Wako, Cat# 439-90901, and the insulin ELISA kit obtained from ALPCO, Cat# 80-INSMSU-E01.
Mouse study 6. Insulin tolerance test after metformin treatment to high fat diet fed Gdf15-/- and wild type controls
Mice generation and protocol as Study 3, except aged 4 to 6 months. On day of first gavage body weights (mean±SEM) of study groups were 35.1±1.2g; 35.05±1.2g for wild type Vehicle and Metformin treatment respectively, and 35.08±1.02g; 35.02±1.47g for Gdf15-/- Vehicle and Metformin treatment respectively. On day 11, after final dose of metformin mice were fasted for 4 hours. Baseline venous blood sample was collected into heparinised capillary tube for insulin measurement and blood glucose was measured using approximately 2 μl blood drops using a glucometer (AlphaTrak2; Abbot Laboratories) and glucose strips (AlphaTrak2 test 2 strips, Abbot Laboratories, Zoetis). Mice were given intraperitoneal injection of insulin (0.5U/kg mouse, Actrapid, NovoNordisk Ltd) and serial mouse glucose levels measured at time points indicated. Mice were sacrificed by terminal anaesthesia as in Study 2. Mouse insulin was measured using a 2-plex Mouse Metabolic immunoassay kit from Meso Scale Discovery Kit (Rockville, MD, USA), performed according to the manufacturer’s instructions and using calibrators provided by MSD. Serum metformin levels were quantified using a stable isotope dilution LC-MS/MS method described previously33.
Mouse study 7. Glucose tolerance test after single dose metformin treatment to high fat diet fed Gdf15-/- and wild type controls
Mice generation as Study 3, except female mice aged 3.5 to 5.5 months. 2 groups of mice (Gdf15+/+ and Gdf15-/-littermates, body weight (mean±S.E.M), 24.1 ±1.4g vs 24.3±1.3g, respectively) were fed 60% HFD for 2 weeks. Each genotype was then further split into vehicle or metformin (300mg/kg) treatment group, given a single gavage dose at 8am and fasted for 6 hrs. At time of GTT, body weights (mean±S.E.M) of study groups were 26.4.1±1.5g; 26.5±1.0g for wild type Vehicle and Metformin treatment respectively, and 25.6±1.2g; 27.1±1.3g for Gdf15-/- Vehicle and Metformin treatment respectively (1 way ANOVA, p=0.8722). Baseline testing as mouse study 6. Mice then received a single dose of 20% glucose via intraperitoneal route (2mg/g dose) with serial measurement of glucose levels measured at time points indicated. Sacrifice and insulin analysis as mouse study 6.
Mouse study 8. Acute single high dose metformin study in high fat diet fed wild type mice
Male C57BL6/J mice (Charles River,Margate, UK) aged 14 weeks were switched from standard chow to 45 %HFD fat (D12451i) for 1 week then 60%HFD (D12492i,) for 3 weeks). At time of study (18 weeks old) body weights (mean ±SEM) were 40.4± 1.2g vs 41.1±1.3g, vehicle vs metformin group, respectively. 500mg of metformin (Sigma, PHR1084-500MG) was dissolved in 8.35 mls of water to make a working stock of 60mg/ml. Mice received a single dose by oral gavage of either 600mg/kg metformin or matched volume of vehicle (water). They were returned to ad lib 60 % fat diet and 6 hrs later blood was collected as study 2. Tissue samples for RNA analysis were collected into Lysing Matrix D homogenisation tube (MP Biomedicals) on dry ice and stored at -800C until processed. Intestine between pylorus of stomach and caecum was laid out into 3 equal parts, with tissue taken from mid-point of each third labelled as “proximal”, “ middle” and “ distal” (adapted from 34). Colon section was from mid-point between caecum and anus. Tissue for in-situ hybridisation were dissected and placed into 10% formalin/PBS for 24hr at room temp, transferred to 70% ethanol, and processed into paraffin. 5μm sections were cut and mounted onto Superfrost Plus (Thermo-Fisher Scientific). Detection of Mouse Gdf15 was performed on FFPE sections using Advanced Cell Diagnostics (ACD) RNAscope® 2.5 LS Reagent Kit-RED (Cat No. 322150) and RNAscope® LS 2.5 Probe Mm-Gdf15-O1 (Cat No. 442948) (ACD, Hayward, CA, USA). Briefly, sections were baked for 1 hour at 60oC before loading onto a Bond RX instrument (Leica Biosystems). Slides were deparaffinized and rehydrated on board before pre-treatments using Epitope Retrieval Solution 2 (Cat No. AR9640, Leica Biosystems) at 95°C for 15 minutes, and ACD Enzyme from the LS Reagent kit at 40oC for 15 minutes. Probe hybridisation and signal amplification was performed according to manufacturer’s instructions. Fast red detection of mouse Gdf15 was performed on the Bond RX using the Bond Polymer Refine Red Detection Kit (Leica Biosystems, Cat No. DS9390) according to the ACD protocol. Slides were then counterstained with haematoxylin, removed from the Bond RX and were heated at 60°C for 1 hour, dipped in Xylene and mounted using EcoMount Mounting Medium (Biocare Medical, CA, USA. Cat No. EM897L).
Slides imaged on an automated slide scanning microscope (Axioscan Z1 and Hamamatsu orca flash 4.0 V3 camera) using a 20x objective with a numerical aperture of 0.8. Hybridisation specificity was confirmed by the absence of staining in Gdf15-/- mice.
RNA extraction was carried out with approximately 100mg of tissue in 1ml Qiazol Lysis Reagent (Qiagen 79306l) using Lysing Matrix D homogenisation tube and Fastprep 24 Homogeniser (MP Biomedicals) and Qiagen RNeasy Mini kit (Cat no 74106) with DNase1 treatment following manufacturers’ protocols. 500ng of RNA was used to generate cDNA using Promega M-MLV reverse transcriptase followed by TaqMan qPCR in triplicates for GDF15. Samples were normalised to Act B. TaqMan Probes: Mm00442228 m1 GDF15, Mm02619580_g1 Act B, TaqMan;2X universal PCR Master mix (Applied Biosystems Thermo Fisher 4318157); QuantStudio 7 Flex Real time PCR system (Applied Biosystems Life Technologies)
Mouse study 9. Acute phenformin study in standard chow-fed wild type animals
Male C57BL6/J mice aged 14 weeks with supplier, protocol and methods as study 2, except phenformin (Sigma PHR1573-500mg) used instead of metformin.
Organoid studies
Duodenal and ileal mouse organoid line generation, maintenance and 2D culture was performed as previously described35. CHOP null mice were kind gift of Dr Jane Goodall (University of Cambridge), with line from Jackson Laboratory,Maine (B6.129S(Cg)-Ddit3tm2.1Dron/J, Stock No: 005530) Human rectal organoids (experiments approved by the Research Ethics Committee under license number 09/H0308/24) were generated from fresh surgical specimens (Tissue Bank Addenbrooke’s Hospital (Cambridge, UK)) following a modified protocol 35,36. Briefly rectal tissue was chopped into 5mm fragments and incubated in 30 mM EDTA for 3x10mins, with tissue shaken in PBS after each EDTA treatment to release intestinal crypts. The isolated crypts were then further digested using TrypLE (Life Technologies) for 5 mins at 37°C to generate small cell clusters. These were then seeded into basement membrane extract (BME, R&D technology), with 20 μl domes polymerised in multiwell (48) dishes for 30-60 mins at 37°C. Organoid medium (Sato et al 2011) was then overlaid and changed 3 times per week. Human organoids were passaged every 14-21 days using TrypLE digestion for 15 mins at 37°C, followed by mechanical shearing with rigorous pipetting to breakup organoids into small clusters which were then seeded as before in BME. For transwell experiments TrypLE digested organoids were seeded onto matrigel (Corning) coated (2% for 60 mins at 37°C) polyethylene Terephthalate cell culture inserts, pore size 0.3 μm (Falcon) in organoid medium supplemented with Y-27632 (R&D technology). Organoids were observed through the transparent cell inserts to ensure 2D culture formation (allowing apical cell access for drug treatments). Medium was changed after 2 days and then switched on day 3 to a differentiation medium with wnt3A conditioned medium reduced to 10% and SB202190 / nicotinamide omitted from culture for 5 days.
For GDF 15 secretion experiments 2D cultured organoid cells were treated for 24 hrs with indicated drugs, with medium then collected and GDF15 measured at the Core Biochemical Assay Laboratory (Cambridge) using the human or mouse GDF15 assay kit as outlined in CAMERA human study and mouse study 2 above.
RNA was extracted using TRI reagent (Sigma), with any contaminated DNA eliminated using DNA free removal kit (Invitrogen). Purified RNA was then reverse transcribed using superscript II (Invitrogen) as per manufacturer’s protocol. RT-qPCR was performed on a QuantStudio 7 (Applied Biosystems) using Fast Taqman mastermix and the following probes (Applied Biosystems); Human GDF15 (Hs00171132_m1), Human ACTB (Hs01060665_g1). Gene expression was measured relative to β-actin in the same sample using the ΔCt method, with fold (cf. control) shown for each experiment.
Hepatocyte studies
Primary mouse hepatocyte isolation and culture
Hepatocytes from 8-12 week old C57B6J male mice were isolated by retrograde, non-recirculating in situ collagenase liver perfusion. In brief: livers were perfused with modified Hanks medium without calcium (NaCl- 8.0 g/L; KCl- 0.4 g/L; MgSO4.7H2O- 0.2 g/L; Na2HPO4.2H2O-0.12 g/L; KH2PO4- 0.12 g/L; Hepes- 3 g/L; EGTA- 0.342 g/L; BSA- 0.05 g/L) followed by digestion with perfusion media supplemented with calcium (CaCl2.2H2O- 0.585 g/L) and 0.5mg/ml of collagenase IV (Sigma, C5138). The digested liver was removed and washed using chilled DMEM:F12 (Sigma) medium containing 2 mM L-glutamine, 10 % FBS, 1% penicillin/streptomycin (Invitrogen). Viable cells were harvested by Percoll (Sigma) gradient. The final pellet was resuspended in the same DMEM:F12 media. Cell viability was greater than 90%. Hepatocytes were plated onto primaria plates (Corning). Hepatocytes were allowed to recover and attach for 4-6 hr before replacement of the medium overnight prior to stress treatments the following day for the times and concentrations indicated.
Generation and culture of iPSC derived human hepatocytes
The human induced pluripotent cell (hiPSC) line A1ATDR/R used in this work was derived as previously described 37,38 under approval by the regional research ethics committee (reference number 08/H0311/201). hiPSCs were maintained in Essential 8 chemically defined media39 3supplemented with 2ng/ml Tgf-ß (R&D) and 25ng/ml FGF2 (R&D), and cultured on plates coated with 10μg/ml Vitronectin XFTM (STEMCELL Technologies). Colonies were regularly passaged by short-term incubation with 0.5mM EDTA in PBS. For hepatocyte differentiation, colonies were dissociated into single cells following incubation with StemPro™ Accutase™ Cell Dissociation Reagent (Gibco) for 5 minutes at 37°C. Single cell suspensions were seeded on plates coated with 10μg/ml Vitronectin XFTM (STEMCELL Technologies) in maintenance media supplemented with 10μM ROCK Inhibitor Y-27632 (Selleckchem) and grown for up to 72h prior to differentiation. Hepatocytes were differentiated as previously reported40, with minor modifications as listed. Briefly, following endoderm differentiation, anterior foregut specification was achieved after 5 days of culture with RPMI-B27 differentiation media supplemented with 50ng/ml Activin A (R&D)4. Foregut cells were further differentiated into hepatocytes with HepatoZYME-SFM (Gibco) supplemented with 2mM L-glutamine (Gibco), 1% penicillin-streptomycin (Gibco), 2% non-essential amino acids (Gibco), 2% chemically defined lipids (Gibco), 14μg/ml of insulin (Roche), 30μg/ml of transferrin (Roche), 50 ng/ml hepatocyte growth factor (R&D), and 20 ng/ml oncostatin M (R&D), for up to 27 days.
The human induced pluripotent cell (hiPSC) line A1ATDR/R used in this work was derived as previously described37,38 under approval by the regional research ethics committee (reference number 08/H0311/201). hiPSCs were maintained in Essential 8 chemically defined media39 3supplemented with 2ng/ml Tgf-ß (R&D) and 25ng/ml FGF2 (R&D), and cultured on plates coated with 10μg/ml Vitronectin XFTM (STEMCELL Technologies). Colonies were regularly passaged by short-term incubation with 0.5mM EDTA in PBS. For hepatocyte differentiation, colonies were dissociated into single cells following incubation with StemPro™ Accutase™ Cell Dissociation Reagent (Gibco) for 5 minutes at 37°C. Single cell suspensions were seeded on plates coated with 10μg/ml Vitronectin XFTM (STEMCELL Technologies) in maintenance media supplemented with 10μM ROCK Inhibitor Y-27632 (Selleckchem) and grown for up to 72h prior to differentiation. Hepatocytes were differentiated as previously reported40, with minor modifications as listed. Briefly, following endoderm differentiation, anterior foregut specification was achieved after 5 days of culture with RPMI-B27 differentiation media supplemented with 50ng/ml Activin A (R&D)4. Foregut cells were further differentiated into hepatocytes with HepatoZYME-SFM (Gibco) supplemented with 2mM L-glutamine (Gibco), 1% penicillin-streptomycin (Gibco), 2% non-essential amino acids (Gibco), 2% chemically defined lipids (Gibco), 14μg/ml of insulin (Roche), 30μg/ml of transferrin (Roche), 50 ng/ml hepatocyte growth factor (R&D), and 20 ng/ml oncostatin M (R&D), for up to 27 days.
Cellular studies on integrated stress response
Chemicals and Reagents
Tunicamycin and ISRIB were purchased from Sigma-Aldrich. Metformin and Phenformin was purchased from Cayman Chemicals and GSK2606414 from Calbiochem. The antibody for GDF15 and CHOP (sc-7351) were obtained from Santa Cruz. Phospho S51 EIF2α (ab32157) and Calnexin (ab75801) were purchased from Abcam. The antibody for ATF4 was a kind gift from Dr David Ron (CIMR, Cambridge).
Eukaryotic cell lines and treatments
Mouse embryonic fibroblast (MEF) cells lines were obtained from David Ron (CIMR/IMS, Cambridge) and maintained as previously described18. MEFs were transfected with 30 nM control siRNA or a smartpool on-target plus siRNA for mouse CHOP (Dharmacon -L-062068-00-0005) using Lipofectamine RNAi MAX (Invitrogen) according to the manufacturer’s instruction. 48 h post siRNA transfection, cells were processed for RNA and protein expression analysis. All cells were maintained at 37 °C in a humidified atmosphere of 5 % CO2 and seeded onto 6- or 12-well plates prior to stress treatments for the times and concentrations indicated. Vehicle treatments (e.g. DMSO) were used for control cells when appropriate.
RNA isolation/cDNA synthesis/Q-PCR
Following treatments, cells were lysed with Buffer RLT (Qiagen) containing 1 % 2-Mercaptoethanol and processed through a Qiashredder with total RNA extracted using the RNeasy isolation kit according to manufacturer’s instructions (Qiagen). RNA concentration and quality was determined by Nanodrop. 400 ng - 500 ng of total RNA was treated with DNase1 (Thermofisher Scientific) and then converted to cDNA using MMLV Reverse Transcriptase with random primers (Promega).
Quantitative RT-PCR was carried out with either TaqMan™ Universal PCR Master Mix or SYBR Green PCR master mix on the QuantStudio 7 Flex Real time PCR system (Applied Biosystems). All reactions were carried out in either duplicate or triplicate and Ct values were obtained. Relative differences in the gene expression were normalized to expression levels of housekeeping genes, HPRT or GAPDH for cell analysis, using the standard curve method. Primers used for this study: mouse GDF15 (Mm00442228_m1 – ThermoFisher Scientific), human GDF15 (Hs00171132_m1 - ThermoFisher Scientific), human GAPDH (Hs02758991_g1 – ThermoFisher Scientific), mouse HPRT (Forward – AGCCTAAGATGAGCGCAAGT, reverse - GGCCACAGGACTAGAACACC)
Immunoblotting
Following treatments, cells were washed twice with ice cold D-PBS and proteins harvested using RIPA buffer supplemented with cOmplete protease and PhosStop inhibitors (Sigma). The lysates were cleared by centrifugation at 13 000 rpm for 15 min at 4 °C, and protein concentration determined by a Bio-Rad DC protein assay. Typically, 20-30 μg of protein lysates were denatured in NuPAGE 4× LDS sample buffer and resolved on NuPage 4-12 % Bis-Tris gels (Invitrogen) and the proteins transferred by iBlot (Invitrogen) onto nitrocellulose membranes. The membranes were blocked with 5 % nonfat dry milk or 5 % BSA (Sigma) for 1 h at room temperature and incubated with the antibodies described in the reagents section. Following a 16 h incubation at 4 °C, all membranes were washed five times in Tris-buffered saline-0.1% Tween-20 prior to incubation with horseradish peroxidase (HRP)-conjugated anti-rabbit immunoglobulin G (IgG), HRP-conjugated anti-mouse IgG (Cell Signalling Technologies). The bands were visualized using Immobilon Western Chemiluminescent HRP Substrate (Millipore). All images were acquired on the ImageQuant LAS 4000 (GE Healthcare).
Statistical analyses
CAMERA data were analysed using a mixed linear model with restricted maximum likelihood to investigate the metformin effect on GDF-15. This is analogous to conducting a repeated measures ANOVA, but is a more flexible analysis and allows for missing observations within subject. The 0-18 months difference in weight and GDF15 correlation was tested using Spearman’s coefficient. CAMERA data were analysed using STATA version 15.1.
Other statistical analyses were performed using Prism 7 and Prism 8, using unpaired 2 tailed t-tests, or 2-way ANOVA, with multiple comparison adjustment by Tukey’s or Sidak’s test. Metabolic rate was determined using ANCOVA with energy expenditure as the dependent variable, body weight as a covariate and treatment as a fixed factor. ANCOVA and analyses of glucose and insulin tolerance testing in mice were performed using SPSS 25 (IBM).
Extended Data
Extended Data Figure 1. Expanded CAMERA data set.
a, Linear association between change in body weight and change in plasma GDF15 between 0 and 18 months among metformin treated participants (n=74, Spearman correlation r=-0.26, two-sided p=0.024). Red line is linear regression slope, and grey area is 95% confidence interval for slope.
b, Absolute and relative differences in plasma GDF15 concentration between metformin and placebo groups at each time point (total 625 observations in 173 participants).
c,d, Individual measures of plasma GDF15 levels in placebo group (c) and metformin group (d) over time.
e, Plasma GDF15 concentration (95%CI) in overweight or obese non-diabetic participants with known cardiovascular disease randomised to metformin or placebo in CAMERA; modelled using a mixed linear model as per Figure 1 and grouped as “all participants” and “ all participants not reporting diarrhoea and vomiting”. Model includes all participants
Extended Data Figure 2. Effect of single oral dose of metformin in chow fed mice.
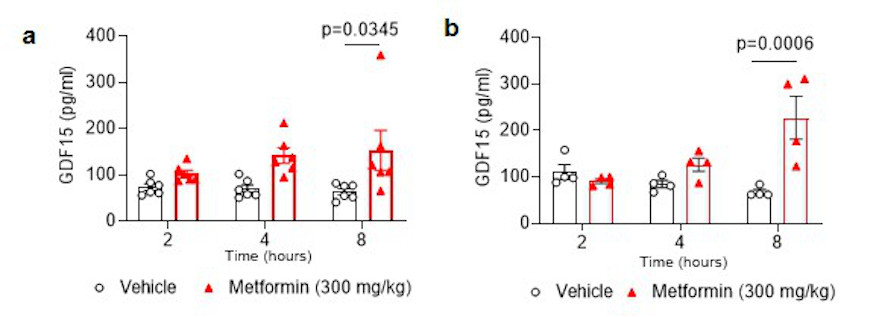
Serum GDF15 levels in male mice measured 2, 4, or 8 hours after a single gavage dose of metformin (300mg/kg). a, mice ad libitum overnight fed prior to gavage. b, mice fasted for 12 hour prior to gavage. Data are mean ± SEM (a; n=6/group, b; n= 4/group); P by 2-way ANOVA with Tukeys correction for multiple comparisons.
Extended Data Figure 3. Body weight changes with metformin treatment in mice with disrupted GDF15-GFRAL signalling.
a, Absolute body weight in Gdf15 +/+ and Gdf15 -/- mice on a high-fat diet treated with metformin (300mg/kg/day) for 11 days, mice as Figure 2a. Data are mean ± SEM, P by 2-way ANOVA with Tukey’s correction for multiple comparisons.
b, Absolute body weight in high fat diet fed Gfral +/+ and Gfral -/- mice given oral dose of metformin (300mg/kg) once daily for 11 days, mice as Figure 2c. Data are mean ± SEM.
c, Absolute body weight of metformin-treated, obese mice dosed with an anti-GFRAL antagonist antibody or with control IgG weekly for 5 weeks starting 4 weeks after initial metformin exposure, mice as Figure 2d. Data are mean ± SEM. P by 2-way ANOVA with Tukey’s correction for multiple comparisons.
Extended Data Figure 4. Response of high fat diet fed Gdf15 -/- and Gfral -/- mice to metformin.
a, Circulating GDF15 levels in high fat diet fed Gdf15 +/+ and Gdf15 -/- mice given oral dose of metformin (300mg/kg) once daily for 11 days. Data are mean ± SEM, mice as Figure 2a. All samples from Gdf15 -/- were below lower limit of assay (< 2pg/ml), P value by 2-way ANOVA with Tukey’s correction for multiple comparisons.
b, Circulating GDF15 levels in high fat diet fed Gfral +/+ and Gfral -/- mice given oral dose of metformin (300mg/kg) once daily for 11 days. Data are mean ± SEM, mice as Figure 2c, P by 2-way ANOVA with Tukey’s correction for multiple comparisons.
c, Cumulative food intake in high fat diet fed Gfral +/+ and Gfral -/- mice on a high fat diet given oral dose of metformin (300mg/kg) once daily for 11 days. Data are mean ± SEM, mice as Figure 2c, non-significant difference vehicle vs metformin by 2W ANOVA.
d, Fat mass (left panel) and lean mass (right panel) in metformin-treated obese mice dosed with an anti-GFRAL antagonist antibody, weekly for 5 weeks, starting 4 weeks after initial metformin exposure (mice as Figure 2d). Body composition was measured using MRI after 4 weeks of metformin exposure, prior to receiving anti-GFRAL (week 4), after 6 weeks of metformin exposure and 2 weeks after receiving anti-GFRAL (week 6) and after 9 weeks of metformin exposure and 5 weeks after receiving anti-GFRAL (week 9). Data are mean ± SEM (n=7 Vehicle + control IgG and Metformin + anti – GFRAL; n=8 other groups); P by 2-way ANOVA with Tukey’s correction for multiple comparisons.
Extended Data Figure 5. Response of second, independent cohort of high-fat diet fed Gdf15 +/+ and Gdf15 -/- mice to metformin.
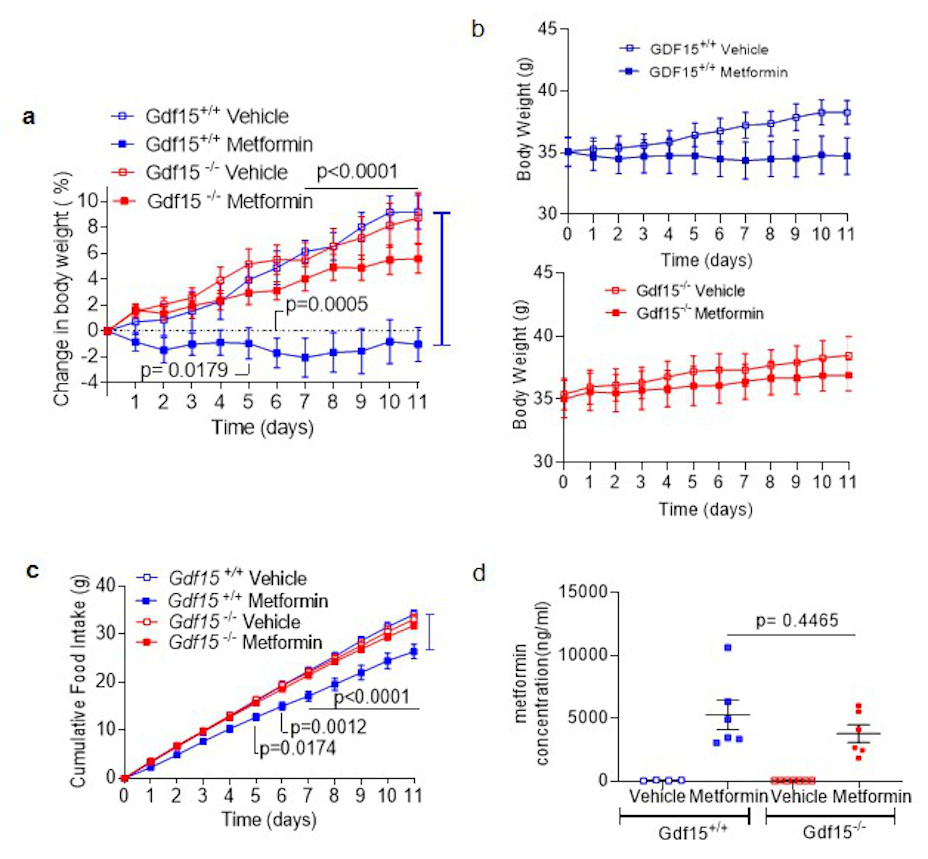
a,b,c, Percentage change in body weight (a), absolute body weight (b) and cumulative food intake (c) in Gdf15 +/+ and Gdf15 -/- mice on a high-fat diet treated with metformin (300mg/kg/day) for 11 days. Data are mean ± SEM (n=6/group, except Gdf15 -/- vehicle= 7), P by 2-way ANOVA with Tukey’s correction for multiple comparisons.
d, Circulating metformin levels in mice 6 hrs after final dose of metformin on day 11. Data are mean ± SEM (n=6/group, except Gdf15 +/+ vehicle= 4, Gdf15 -/- vehicle= 7), P by 2-way ANOVA with Tukey’s correction for multiple comparisons.
Extended Data Figure 6. Glucose, insulin and GDF15 response to metformin.
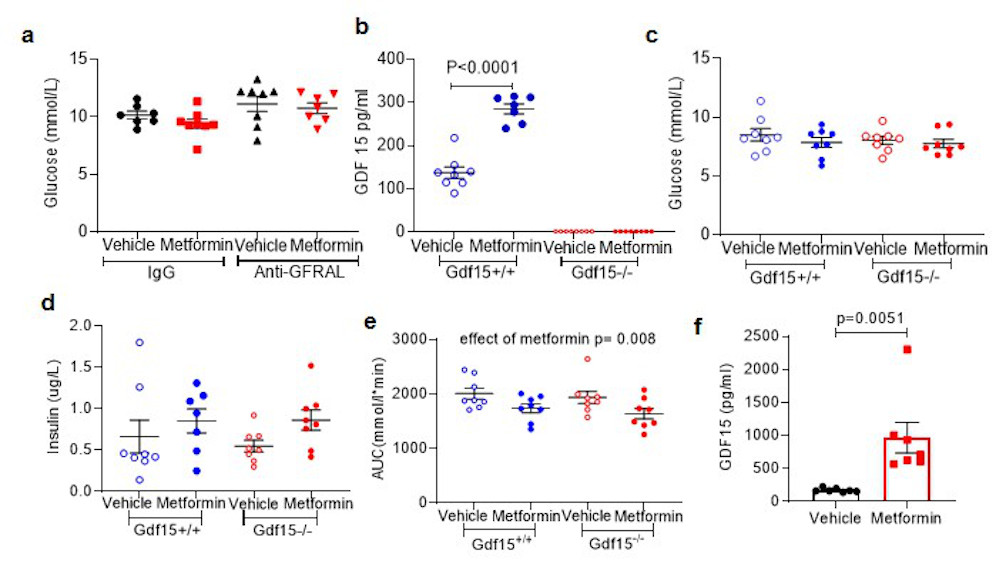
a, Fasting glucose from OGTT as Figure 3e and 3f. ANOVA analysis, effect of antibody p= 0.028, effect of metformin p= 0.271, interaction of antibody and metformin p 0.707.
b, Circulating GDF15 in mice undergoing ipGTT post single dose metformin as Figure 3 k and 3l. P by 2-way ANOVA with Tukey’s correction for multiple comparisons.
c,d, Fasting glucose (c) and fasting insulin (d)at time 0 of ipGTT as Figure 3 k and 3l, non-significant by 2-way ANOVA.
e, AUC analysis of glucose levels as in Figure 3k and l. P by 2-way ANOVA, effect of genotype p= 0.392, interaction of genotype and metformin p= 0.883.
f, Circulating GDF15 levels in high-fat diet fed Gdf15 +/+ mice after single oral dose of metformin (600mg/kg). Samples were collected 6 hours after dosing, data are mean ± SEM, (n=7/group), P value (95% confidence interval) by two tailed t-test.
Extended Data Figure 7.
a, Representative images from the mouse with circulating GDF15 level closest to group median shown in Fig4b with images from other regions of the gut and from liver. b, In situ hybridization for Gdf15 mRNA expression (red spots) in colon. Tissue collected from high-fat fed wild type mice, 6 hrs after single dose of oral metformin (600mg/kg)(right side, red box, m1-m7) or vehicle gavage (left side, blue box, v1-v7), n=7/group, mice as Figure 4.
Extended Data Figure 8. Analysis of Gdf15 mRNA expression (normalised to expression levels of ActB) in tissue from high fat diet fed Gdf15 +/+ mice.
Metformin dose (300mg/kg) once daily for 11 days (see Figure 2a). Data are mean ± SEM, n=6 metformin, n=7 vehicle, P value (95% confidence interval) by two tailed t-test.
Extended Data Figure 9. Hepatic GDF15 response to biguanides.
a,b,Gdf15 mRNA expression in (a) primary mouse hepatocytes or (b) human iPSC derived hepatocytes treated with vehicle control (Con) or metformin for 6 h. mRNA expression is presented as fold expression relative to control treatment (set at 1), normalised to Hprt and GAPDH gene in mouse and human cells, respectively. Data are expressed as mean ± SEM from four (a) and two (b) independent experiments. P value (95% confidence interval) by 1 way ANOVA with Tukey’s correction for multiple comparisons.
c,d, Circulating levels of GDF15 (c) and hepatic Gdf15 mRNA expression (d) (normalised toβ2 microglobulin) in chow fed, wild type mice 4 hrs after single oral dose of phenformin (300mg/kg). Data are mean ± SEM, n= 6/group, P value (95% confidence interval) by two tailed t-test.
e, Representative image of in situ hybridization for Gdf15 mRNA expression (red spots) of fixed liver tissue derived from animals treated as described in (c) and (d).
Extended Data Figure 10. Role of the Integrated Stress Response (ISR) in biguanide-induced Gdf15 expression.
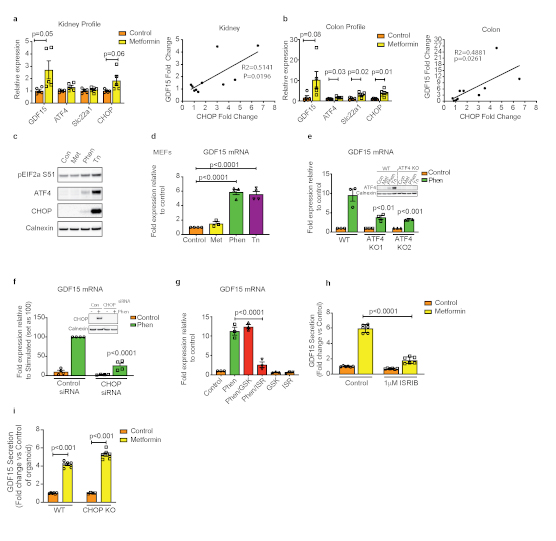
a,b, mRNA levels in kidney (a) and colon (b) isolated from obese mice 24 hours after a single oral dose of metformin (600mg/kg). Data are mean ± SEM (n=5/group). P values (95% confidence interval) by two tailed t-test. Gdf15 mRNA fold induction 24 hrs post metformin 600mgs/kg is positively correlated with CHOP mRNA induction in both kidney (a, right panel) and colon (b, right panel), black line= linear regression analysis.
c-g, Immunoblot analysis of ISR components (c) and Gdf mRNA expression (d) in wild type MEFs (mouse embryonic fibroblasts) treated with vehicle control (Con), metformin (Met, 2 mM) or phenformin (Phen, 5 mM) or tunicamycin (Tn, 5 g/ml - used as a positive control) for 6 hrs. e, Gdf15 mRNA expression in ATF4 knockout (KO) MEFs or (f) in control siRNA and CHOP siRNA transfected wild type MEFs treated with Tn or Phen for 6 hrs or (g) in wild type MEFs pre-treated for 1 h either with the PERK inhibitor GSK2606414 (GSK, 200 nM) or eIF2α inhibitor ISRIB (ISR, 100 nM) then co-treated with Phen for a further 6 hrs. mRNA expression is presented as fold-expression relative to its respective control treatment (set at 1) or phen treated samples (set as 100) with normalisation to Hprt gene expression. Data are expressed as mean ± SEM from two for (c) and (d) and at least three independent experiments for (e-g). P value (95% confidence interval) by two tailed t-test relative to Phen treated control wild and control siRNA treated samples.
h, GDF15 protein in supernatant of mouse derived 2D duodenal organoids treated with metformin in the absence or presence of ISRIB (1 μM). Data are expressed as mean ± SEM from two independent experiments. From each well, measurement of protein was at least in duplicate. P by 2 way ANOVA with Sidak’s correction for multiple comparisons.
i, GDF15 protein in supernatants of mouse-derived 2D duodenal organoids from wild type and CHOP null mice treated with metformin from two independent experiments From each well, measurement of protein was at least in duplicate. Data are mean ± SEM, P value (95% confidence interval) by two-tailed t-test.
Acknowledgments
CAMERA trial funded by a project grant from the Chief Scientist Office, Scotland (CZB/4/613).D.P. supported by a University of Oxford British Heart Foundation Centre of Research Excellence Senior Transition Fellowship (RE/13/1/30181). N.S. and P.W. acknowledge support from BHF Centre of Excellence award (COE/RE/18/6/34217).The authors would like to thank Peter Barker, Keith Burling and other members of the Cambridge Biochemical Assay Laboratory (CBAL).This project is supported by the National Institute for Health Research (NIHR) Cambridge Biomedical Research Centre. The views expressed are those of the authors and not necessarily those of the NIHR or the Department of Health and Social Care. A.P.C., D.Rimmington, J.T., I.C., Y.C.L.T. and G.S.H.Y. are supported by the Medical Research Council (MRC Metabolic Diseases Unit [MC_UU_00014/1]). Mouse studies in Cambridge supported by Sarah Grocott and the Disease Model Core, with pathology support from James Warner and Histopathology Core (MRC Metabolic Diseases Unit (MC_UU_00014/5) and Wellcome Trust Strategic Award (100574/Z/12/Z).D.B.S. and S.O’R. are supported by the Wellcome Trust (WT 107064 and WT 095515/Z/11/Z), the MRC Metabolic Disease Unit (MC_UU_00014/1), and The National Institute for Health Research (NIHR) Cambridge Biomedical Research Centre and NIHR Rare Disease Translational Research Collaboration. We thank Julia Jones and other members of Histopathology and ISH Core Facility, Cancer Research UK Cambridge Institute, University of Cambridge, Li Ka Shing Centre, Robinson Way, Cambridge CB2 0RE, UK.D. Ron is supported by a Wellcome Trust Principal Research Fellowship (Wellcome 200848/Z/16/Z) and a Wellcome Trust Strategic Award to the Cambridge Institute for Medical Research (Wellcome 100140). A.V.-P., S.R.-C.and S.V. are supported by the BHF (RG/18/7/33636) and MRC (MC_UU_00014/2).A.M. is supported by a studentship from the Experimental Medicine Training Initiative/AstraZeneca.R.A.T. and L.V. are supported by ERC advanced grant NewChol and core support from the Wellcome Trust and Medical Research Council to the Wellcome–Medical Research Council Cambridge Stem Cell Institute.M.Y., D.A.G., E.M., F.M.G. and F.R. are supported by the MRC (MC_UU_00014/3) and Wellcome Trust (106262/Z/14/Z and 106263/Z/14/Z). M.Y. is supported by a BBSRC-DTP studentship. A.R.K., R.R.E. and K.S.N. supported by NIH Grants R21 AG60139, UL1 TR000135 and T32DK007352 and acknowledge Katherine Klaus for technical assistance. N.J.W. is supported by the MRC (MC_UU_12015/1) and is an NIHR Senior Investigator. We acknowledge Jian’an Luan for statistical assistance.
CHOP null mice were kind gift of Dr Jane Goodall (University of Cambridge).
Footnotes
Data availability
The data that support the findings of this study are available from the corresponding authors upon request. The CAMERA trial dataset is held at the University of Glasgow and is available on request from the investigators subject to a signed agreement operating within the confines of the original ethics application.
Author Contributions
Overall conceptualization of studies included in this body of work by A.P.C., N.S., D.B.S., B.B.A. and S.O’R. These authors contributed equally to this work.
A.P.C., M.C., P.T., D.Rimmington, I.C. and Y.C.L.T. designed, managed, performed and analysed data from mouse experiments. S.V. designed experiments and analysed data. A.M. and G.S.H.Y. contributed to conceptualisation of experiments and data analysis. J.T. performed ISH experiments. S.P. designed, managed and performed cell based assays along with E.L.M., S.R.C., R.A.T., H.P.H., A.V-P., L.V. and D.Ron. J.T.J.H. undertook measurement of serum metformin levels.M.Y., D.A.G., F.M.G., F.R. designed, performed and analysed organoid experiments. A.R.K., R.R.E. and K.S.N. designed and performed short term metformin studies in humans. N.J.W undertook analysis of Ely Study Cohort. P.W., D.P. and N.S. designed, analysed and interpreted data arising from the CAMERA study. A.P.C., D.B.S., B.B.A. and S.O’R. wrote the paper, which was reviewed and edited by all the authors.
Author information
P. W. has received grant support from Roche Diagnostics, AstraZeneca, and Boehringer Ingelheim. N.S. has consulted for AstraZeneca, Boehringer Ingelheim, Eli Lilly, Napp, Novo Nordisk and Sanofi, and received grant support from Boehringer Ingelheim. M.C., P.T. and B.B.A. are or were employees of NGM Biopharmaceuticals and may hold NGM stock or stock options. F.R. and F.M.G. have received support from AstraZeneca and Eli Lilly. F.M.G. has provided remunerated consultancy services to Kallyope. S.O’R has provided remunerated consultancy services to Pfizer, AstraZeneca, Novo-Nordisk and ERX Pharmaceuticals.
All other authors declare no competing financial interests.
References
- 1.Knowler WC, et al. Reduction in the incidence of type 2 diabetes with lifestyle intervention or metformin. N Engl J Med. 2002;346:393–403. doi: 10.1056/NEJMoa012512. [DOI] [PMC free article] [PubMed] [Google Scholar]
- 2.Ramachandran A, et al. The Indian Diabetes Prevention Programme shows that lifestyle modification and metformin prevent type 2 diabetes in Asian Indian subjects with impaired glucose tolerance (IDPP-1) Diabetologia. 2006;49:289–297. doi: 10.1007/s00125-005-0097-z. [DOI] [PubMed] [Google Scholar]
- 3.Lachin JM, et al. Factors associated with diabetes onset during metformin versus placebo therapy in the diabetes prevention program. Diabetes. 2007;56:1153–1159. doi: 10.2337/db06-0918. [DOI] [PMC free article] [PubMed] [Google Scholar]
- 4.Rena G, Hardie DG, Pearson ER. The mechanisms of action of metformin. Diabetologia. 2017;60:1577–1585. doi: 10.1007/s00125-017-4342-z. [DOI] [PMC free article] [PubMed] [Google Scholar]
- 5.Apolzan JW, et al. Long-Term Weight Loss With Metformin or Lifestyle Intervention in the Diabetes Prevention Program Outcomes Study. Ann Intern Med. 2019 doi: 10.7326/M18-1605. [DOI] [PMC free article] [PubMed] [Google Scholar]
- 6.Gerstein HC, et al. Growth Differentiation Factor 15 as a Novel Biomarker for Metformin. Diabetes Care. 2017;40:280–283. doi: 10.2337/dc16-1682. [DOI] [PubMed] [Google Scholar]
- 7.Tsai VWW, Husaini Y, Sainsbury A, Brown DA, Breit SN. The MIC-1/GDF15-GFRAL Pathway in Energy Homeostasis: Implications for Obesity, Cachexia, and Other Associated Diseases. Cell Metab. 2018;28:353–368. doi: 10.1016/j.cmet.2018.07.018. [DOI] [PubMed] [Google Scholar]
- 8.Mullican SE, et al. GFRAL is the receptor for GDF15 and the ligand promotes weight loss in mice and nonhuman primates. Nat Med. 2017;23:1150–1157. doi: 10.1038/nm.4392. [DOI] [PubMed] [Google Scholar]
- 9.Emmerson PJ, et al. The metabolic effects of GDF15 are mediated by the orphan receptor GFRAL. Nat Med. 2017;23:1215–1219. doi: 10.1038/nm.4393. [DOI] [PubMed] [Google Scholar]
- 10.Yang L, et al. GFRAL is the receptor for GDF15 and is required for the anti-obesity effects of the ligand. Nat Med. 2017;23:1158–1166. doi: 10.1038/nm.4394. [DOI] [PubMed] [Google Scholar]
- 11.Hsu JY, et al. Non-homeostatic body weight regulation through a brainstem-restricted receptor for GDF15. Nature. 2017;550:255–259. doi: 10.1038/nature24042. [DOI] [PubMed] [Google Scholar]
- 12.Konopka AR, et al. Hyperglucagonemia Mitigates the Effect of Metformin on Glucose Production in Prediabetes. Cell Rep. 2016;15:1394–1400. doi: 10.1016/j.celrep.2016.04.024. [DOI] [PMC free article] [PubMed] [Google Scholar]
- 13.Preiss D, et al. Metformin for non-diabetic patients with coronary heart disease (the CAMERA study): a randomised controlled trial. Lancet Diabetes Endocrinol. 2014;2:116–124. doi: 10.1016/S2213-8587(13)70152-9. [DOI] [PubMed] [Google Scholar]
- 14.McCreight LJ, et al. Pharmacokinetics of metformin in patients with gastrointestinal intolerance. Diabetes Obes Metab. 2018;20:1593–1601. doi: 10.1111/dom.13264. [DOI] [PMC free article] [PubMed] [Google Scholar]
- 15.Forouhi NG, Luan J, Hennings S, Wareham NJ. Incidence of Type 2 diabetes in England and its association with baseline impaired fasting glucose: the Ely study 1990-2000. Diabet Med. 2007;24:200–207. doi: 10.1111/j.1464-5491.2007.02068.x. [DOI] [PubMed] [Google Scholar]
- 16.Chung HK, et al. Growth differentiation factor 15 is a myomitokine governing systemic energy homeostasis. J Cell Biol. 2017;216:149–165. doi: 10.1083/jcb.201607110. [DOI] [PMC free article] [PubMed] [Google Scholar]
- 17.Li D, Zhang H, Zhong Y. Hepatic GDF15 is regulated by CHOP of the unfolded protein response and alleviates NAFLD progression in obese mice. Biochem Biophys Res Commun. 2018;498:388–394. doi: 10.1016/j.bbrc.2017.08.096. [DOI] [PubMed] [Google Scholar]
- 18.Patel S, et al. GDF15 Provides an Endocrine Signal of Nutritional Stress in Mice and Humans. Cell Metab. 2019;29:707–718 e708. doi: 10.1016/j.cmet.2018.12.016. [DOI] [PMC free article] [PubMed] [Google Scholar]
- 19.Shu Y, et al. Effect of genetic variation in the organic cation transporter 1 (OCT1) on metformin action. J Clin Invest. 2007;117:1422–1431. doi: 10.1172/JCI30558. [DOI] [PMC free article] [PubMed] [Google Scholar]
- 20.DeFronzo RA, et al. Once-daily delayed-release metformin lowers plasma glucose and enhances fasting and postprandial GLP-1 and PYY: results from two randomised trials. Diabetologia. 2016;59:1645–1654. doi: 10.1007/s00125-016-3992-6. [DOI] [PMC free article] [PubMed] [Google Scholar]
- 21.Preiss D, et al. Sustained influence of metformin therapy on circulating glucagon-like peptide-1 levels in individuals with and without type 2 diabetes. Diabetes Obes Metab. 2017;19:356–363. doi: 10.1111/dom.12826. [DOI] [PMC free article] [PubMed] [Google Scholar]
- 22.Bahne E, et al. Metformin-induced glucagon-like peptide-1 secretion contributes to the actions of metformin in type 2 diabetes. JCI Insight. 2018;3 doi: 10.1172/jci.insight.93936. [DOI] [PMC free article] [PubMed] [Google Scholar]
- 23.Maida A, Lamont BJ, Cao X, Drucker DJ. Metformin regulates the incretin receptor axis via a pathway dependent on peroxisome proliferator-activated receptor-alpha in mice. Diabetologia. 2011;54:339–349. doi: 10.1007/s00125-010-1937-z. [DOI] [PubMed] [Google Scholar]
- 24.de la Cuesta-Zuluaga J, et al. Metformin Is Associated With Higher Relative Abundance of Mucin-Degrading Akkermansia muciniphila and Several Short-Chain Fatty Acid-Producing Microbiota in the Gut. Diabetes Care. 2017;40:54–62. doi: 10.2337/dc16-1324. [DOI] [PubMed] [Google Scholar]
- 25.Shin NR, et al. An increase in the Akkermansia spp. population induced by metformin treatment improves glucose homeostasis in diet-induced obese mice. Gut. 2014;63:727–735. doi: 10.1136/gutjnl-2012-303839. [DOI] [PubMed] [Google Scholar]
- 26.Forslund K, et al. Disentangling type 2 diabetes and metformin treatment signatures in the human gut microbiota. Nature. 2015;528:262–266. doi: 10.1038/nature15766. [DOI] [PMC free article] [PubMed] [Google Scholar]
- 27.Foretz M, Guigas B, Viollet B. Understanding the glucoregulatory mechanisms of metformin in type 2 diabetes mellitus. Nat Rev Endocrinol. 2019;15:569–589. doi: 10.1038/s41574-019-0242-2. [DOI] [PubMed] [Google Scholar]
- 28.Massollo M, et al. Metformin temporal and localized effects on gut glucose metabolism assessed using 18F-FDG PET in mice. J Nucl Med. 2013;54:259–266. doi: 10.2967/jnumed.112.106666. [DOI] [PubMed] [Google Scholar]
- 29.Buse JB, et al. The Primary Glucose-Lowering Effect of Metformin Resides in the Gut, Not the Circulation: Results From Short-term Pharmacokinetic and 12-Week Dose-Ranging Studies. Diabetes Care. 2016;39:198–205. doi: 10.2337/dc15-0488. [DOI] [PubMed] [Google Scholar]
- 30.Skarnes WC, et al. A conditional knockout resource for the genome-wide study of mouse gene function. Nature. 2011;474:337–342. doi: 10.1038/nature10163. [DOI] [PMC free article] [PubMed] [Google Scholar]
- 31.Bradley A, et al. The mammalian gene function resource: the International Knockout Mouse Consortium. Mamm Genome. 2012;23:580–586. doi: 10.1007/s00335-012-9422-2. [DOI] [PMC free article] [PubMed] [Google Scholar]
- 32.Pettitt SJ, et al. Agouti C57BL/6N embryonic stem cells for mouse genetic resources. Nat Methods. 2009;6:493–495. doi: 10.1038/nmeth.1342. [DOI] [PMC free article] [PubMed] [Google Scholar]
- 33.McNeilly AD, Williamson R, Balfour DJ, Stewart CA, Sutherland C. A high-fat-diet-induced cognitive deficit in rats that is not prevented by improving insulin sensitivity with metformin. Diabetologia. 2012;55:3061–3070. doi: 10.1007/s00125-012-2686-y. [DOI] [PubMed] [Google Scholar]
- 34.Ortega-Cava CF, et al. Strategic compartmentalization of Toll-like receptor 4 in the mouse gut. J Immunol. 2003;170:3977–3985. doi: 10.4049/jimmunol.170.8.3977. [DOI] [PubMed] [Google Scholar]
- 35.Goldspink DA, et al. Mechanistic insights into the detection of free fatty and bile acids by ileal glucagon-like peptide-1 secreting cells. Mol Metab. 2018;7:90–101. doi: 10.1016/j.molmet.2017.11.005. [DOI] [PMC free article] [PubMed] [Google Scholar]
- 36.Sato T, et al. Long-term expansion of epithelial organoids from human colon, adenoma, adenocarcinoma, and Barrett's epithelium. Gastroenterology. 2011;141:1762–1772. doi: 10.1053/j.gastro.2011.07.050. [DOI] [PubMed] [Google Scholar]
- 37.Rashid ST, et al. Modeling inherited metabolic disorders of the liver using human induced pluripotent stem cells. J Clin Invest. 2010;120:3127–3136. doi: 10.1172/JCI43122. [DOI] [PMC free article] [PubMed] [Google Scholar]
- 38.Yusa K, et al. Targeted gene correction of alpha1-antitrypsin deficiency in induced pluripotent stem cells. Nature. 2011;478:391–394. doi: 10.1038/nature10424. [DOI] [PMC free article] [PubMed] [Google Scholar]
- 39.Chen G, et al. Chemically defined conditions for human iPSC derivation and culture. Nat Methods. 2011;8:424–429. doi: 10.1038/nmeth.1593. [DOI] [PMC free article] [PubMed] [Google Scholar]
- 40.Hannan NR, Segeritz CP, Touboul T, Vallier L. Production of hepatocyte-like cells from human pluripotent stem cells. Nat Protoc. 2013;8:430–437. doi: 10.1038/nprot.2012.153. [DOI] [PMC free article] [PubMed] [Google Scholar]


