

Abstract
Goal:
The goal of this study was to describe potential key differences in thromboelastography (TEG) variables in hospitalized cirrhotics compared with a healthy population, identify patterns of hematologic disturbance with disease progression, and assess the value of traditional tests such as international normalized ratio (INR) and platelet count to determine coagulopathy in cirrhotics.
Background:
TEG, a functional assay of coagulation, has emerged as a useful tool for predicting bleeding risk in cirrhosis.
Study:
Hospitalized cirrhotics who received a TEG before any blood products between January 2017 and February 2018 at a liver transplant center were included. Reaction time (r-time), coagulation time (k-time), angle-rate of clot polymerization (α) and maximum clot strength (maximum amplitude) were measured with kaolin-activated citrated blood TEG assays.
Results:
A total of 106 cirrhotic patients (Child-Turcotte-Pugh A, B, C; n=25, 25, 56) were identified for comparison against data from 53 healthy controls. TEG parameters in cirrhotics were statistically different from controls. Mean INR and platelet count for all cirrhotics were largely outside the normal reference range, contrary to TEG parameters which demonstrated parameters mostly within the normal reference ranges. The r-time, k-time, and α values in the cirrhotics progressively increased and maximum amplitude values progressively decreased as the liver disease progressed. Regression analysis showed no significant correlations between INR and r-time across any Child-Turcotte-Pugh class (r=0.01, 0.18, 0.23; P=0.95, 0.39, 0.08, respectively).
Conclusions:
Although cirrhotics had TEG parameters within normal ranges, there was a propensity for decreased clot formation as liver function worsened. Importantly, the INR did not correlate with TEG parameters in cirrhotic patients, and given the precarious hemostatic balance in these patients, a TEG may be a better predictor of bleeding risk.
Keywords: TEG, INR, bleeding, coagulation, cirrhosis
Thromboelastography (TEG) is a rapid global assessment tool of hemostasis using whole blood, allowing for effective quantification of platelet function, thrombus formation, clot tensile strength, and fibrinolysis. This functional assay of coagulation has been useful in liver transplant surgery and transfusion management in cirrhotics undergoing invasive procedures, by decreasing blood product transfusions and reducing the associated transfusion reactions.1,2 Cirrhosis leads to a complex balance between bleeding and coagulation.3 When obtained in hospitalized cirrhotics, the classic measures of coagulation status such as international normalized ratio (INR), prothrombin time (PT), and activated PT often dictate whether a procedure is performed or if blood products need to be administered. However, emerging data suggests these traditional markers of coagulation may not be accurate nor predictive of bleeding in cirrhosis.4 Given the dynamic and altered hemostatic system in cirrhotics, TEG may provide a more accurate means of measuring coagulopathy, predicting bleeding, and guiding prophylactic transfusions before invasive procedures.
Previous studies have defined the average TEG parameters in cirrhotics undergoing liver transplant as compared with a healthy control population.5 The majority of cirrhotics appropriate for liver transplant (79%) have TEG values that are outside the normal reference range for healthy patients and have a tendency toward parameters that suggest impaired hemostasis. A reference range for hospitalized patients with all severities of cirrhosis has not been clearly described in the literature to date. This study aims to more completely describe potential key differences in TEG variables in hospitalized cirrhotics compared with a healthy normal population, identify patterns of hematologic disturbance with disease progression, and assess the value of continuing to use common surrogate markers of prothrombotic and antithrombotic states within this complex disease process.
MATERIALS AND METHODS
We performed an institutional review board–approved retrospective study at an academic liver transplant center. The study population was generated from an administrative database query of all patients with the ICD-9 diagnosis code for chronic liver disease and cirrhosis (571.0–571.9) or ICD-10 diagnosis code for diseases of liver (K70-K74), who were hospitalized between January 1, 2017, and February 28, 2018, and had at least 1 TEG completed during the hospitalization. A total of 209 patients were identified, many of whom had multiple TEGs performed during hospitalization. Only the first TEG obtained in the hospitalization was included in this analysis as subsequent TEGs could have been altered by blood product transfusion. Exclusion criteria included patients who lacked imaging or clinical evidence of cirrhosis, patients on anticoagulation or antiplatelet therapy, patients with bleeding diatheses or primary bone marrow disorders, and patients with any blood product transfusions during the hospitalization before the TEG. After exclusion, there were 106 individual cirrhotic patients who were included in the study.
Child-Turcotte-Pugh (CTP) classes were calculated from the closest laboratory values on hospital admission and progress notes obtained before the TEG. Additional abstracted variables included age, gender, etiology of cirrhosis, use of therapeutic or prophylactic anticoagulation, diagnosis of cancer, bleeding diathesis, total number of blood product transfusions given in the first 24 hours after the TEG (including packed red blood cells, platelets, fresh frozen plasma, cryoprecipitate, and prothrombin complex concentrate), length of hospital stay, and if the patient had repeat TEGs 24 hours after the initial study.
The indication for a TEG was ascertained from chart review and was then categorized as follows: (1) active bleeding. (2) Preliminary testing before a liver transplant. (3) Preliminary testing before any other procedure. (4) Evaluation of coagulopathy and bleeding risk stratification in a patient not actively bleeding and not about to undergo any procedure.
The studies were all done in the same laboratory and were all kaolin-activated citrated blood TEG assays. TEG parameters measured included: reaction time to initiating a clot (r-time), coagulation time from 2 to 20mm in the strength of clot (k-time), angle-rate of clot polymerization (α), and maximum clot strength in millimeters [maximum amplitude (MA)] (Fig. 1). These values in the cirrhotic population were compared with the results from 53 healthy control subjects who were tested on an outpatient basis using a 2-tailed Student t test for normally distributed parameters. In addition, the TEG values were assessed for significant differences within CTP classes, with statistical significance assessed by 1-way analysis of variance. TEG parameters, length of hospital stay (d), and in-hospital mortality were also assessed between cirrhotics who required any blood products 24 hours after the TEG compared with those who did not require any blood products using the Student t test and Fisher exact test. Regression analysis was also performed between INR and r-time, and between platelet count and MA across all CTP classes.
FIGURE 1.
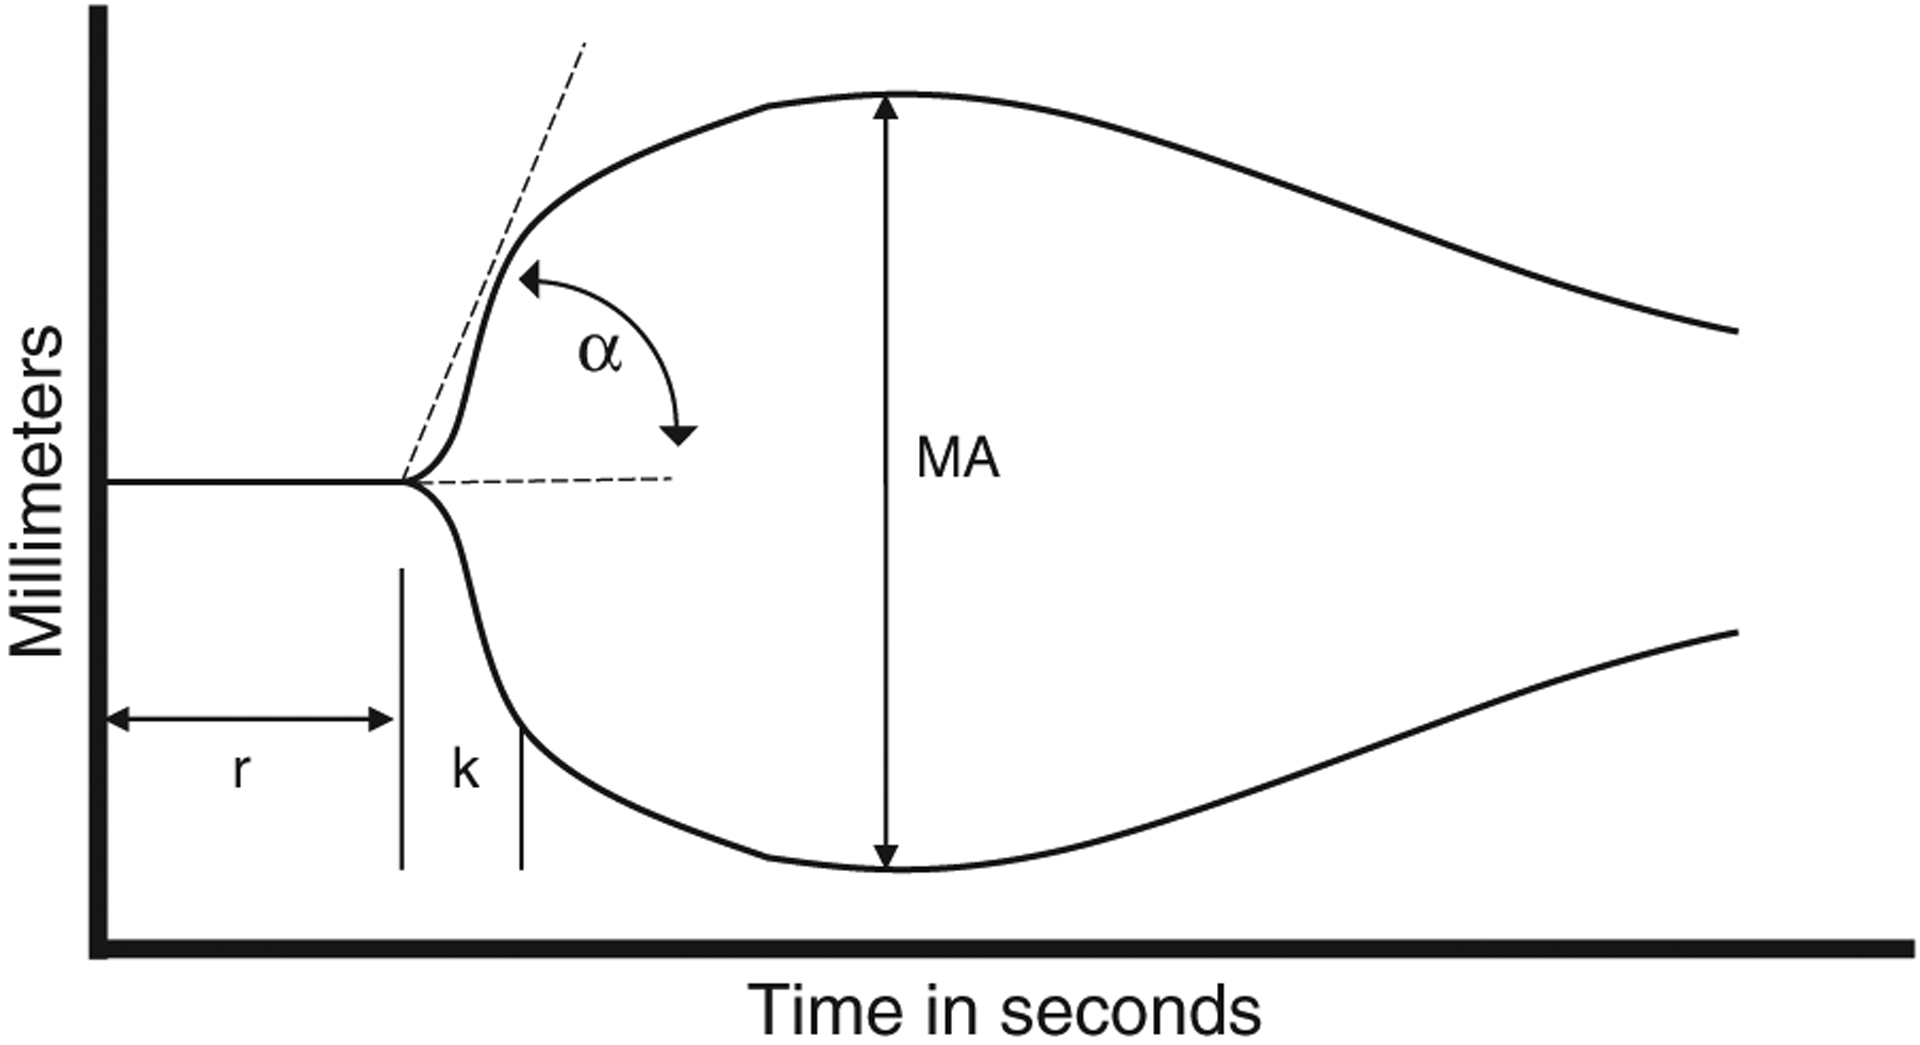
Thromboelastography tracing, reaction time (r-time), coagulation time (k-time), angle-rate of clot polymerization (α), maximum clot strength [maximum amplitude (MA)].
RESULTS
The 106 cirrhotics who had a TEG were categorized into CTP class A [n=25 (23.6%)], CTP class B [n=25 (23.6%)], and CTP class C [n=56 (52.8%)]. The most common cause of liver cirrhosis was from chronic hepatitis C virus infection, followed by alcoholic cirrhosis, then nonalcoholic steatohepatitis cirrhosis [n=43 (40.5%), n=32 (30.2%), n=16 (15.1%), respectively]. The average sodium Model for End-Stage Liver Disease score was 20 with an anticipated rise in sodium Model for End-Stage Liver Disease score as the liver disease progressed from CTP A to B to C. As expected, the mean platelet count decreased as the liver disease progressed (A=156k, B=114k, C=85k). The average INR of the entire cirrhotic cohort was 2.10 and progressively worsened with the CTP classes (A=1.13, B=1.57, C=2.46) (Table 1).
TABLE 1.
Characteristics of Cirrhotic Patients Receiving TEG
| All Cirrhotics (n=106) | CTP A (n=25) | CTP B (n=25) | CTP C (n=56) | |
|---|---|---|---|---|
| Age [mean (SD)] | 58.0 (10.8) | 63.1 (10.9) | 61.2 (8.2) | 54.3 (10.6) |
| Gender, male (%) | 62.3 | 80 | 51.5 | 51.8 |
| Reason for getting TEG | ||||
| Bleeding | 30 | 9 | 8 | 13 |
| Before liver transplant | 42 | 9 | 11 | 22 |
| Before other procedure | 19 | 3 | 4 | 13 |
| Evaluation of coagulopathy, bleeding risk stratification | 15 | 5 | 2 | 8 |
| Cause of liver diagnosis | ||||
| Alcoholic | 32 | 11 | 6 | 25 |
| HCV | 43 | 16 | 15 | 12 |
| NASH | 16 | 2 | 3 | 11 |
| Autoimmune | 3 | 0 | 0 | 3 |
| HBV | 3 | 1 | 1 | 1 |
| PSC | 5 | 1 | 1 | 3 |
| PBC | 4 | 0 | 0 | 4 |
| Cryptogenic | 4 | 0 | 3 | 1 |
| Other | 2 | 1 | 0 | 2 |
| Na-MELD [mean (SD)] | 20.08 (10.7) | 9.56 (3.9) | 14.76 (4.8) | 27.16 (9.4) |
| Platelets [mean (SD)] | 108.33 (84.2) | 155.72 (92.3) | 113.68 (105.7) | 84.79 (58.0) |
| INR [mean (SD)] | 2.10 (2.1) | 1.13 (0.2) | 1.57 (0.4) | 2.46 (1.3) |
| Patients receiving any blood product 24 hours after TEG | ||||
| Packed red blood cells | 51 | 4 | 19 | 36 |
| Platelets | 39 | 5 | 15 | 27 |
| FFP or cryoprecipitate | 46 | 2 | 16 | 36 |
| Prothrombin complex concentrate | 3 | 0 | 1 | 2 |
| Needing to get another TEG over 24 h after for continued bleeding | 18 | 1 | 4 | 13 |
| Cancer diagnosis | 41 | 11 | 17 | 13 |
| Bleeding diathesis | 2 | 1 | 0 | 1 |
| DVT prophylaxis during TEG study | 8 | 2 | 0 | 6 |
| Therapeutic anticoagulation during TEG study | 5 | 0 | 2 | 3 |
CTP indicates Child-Turcotte-Pugh; DVT, deep vein thrombosis; FFP, fresh frozen plasma; HBV, hepatitis B virus; HCV, hepatitis C virus; INR, international normalized ratio; Na-MELD, sodium Model for End-Stage Liver Disease; NASH, nonalcoholic steatohepatitis; PBC, primary biliary cirrhosis; PSC, primary sclerosing cholangitis; TEG, thromboelastography
Preoperative assessment for liver transplant was the most common reason for providers to obtain a TEG (n=42, 39%). The remaining indications for a TEG were for active bleeding (n=30, 28%), for assessment of bleeding risk before any other invasive procedure (n=19, 15.1%) and for evaluation of worsening coagulopathy but not bleeding (n=15, 14.2%). Bleeding during the hospital course requiring repeat TEG 24 hours after the first study occurred in 18 patients (17.0%), with the majority obtained on CTP C patients. The majority of blood products include packed red blood cells, platelets, fresh frozen plasma, and cryoprecipitate were transfused in CTP C patients. Two of the 3 patients who received prothrombin complex concentrates had CTP C liver disease (Table 1).
TEG parameters for all cirrhotics (n=106) were compared with the healthy control population (n=53) (Table 2). Several components of the TEG in cirrhotics suggested a trend toward impaired hemostasis compared with healthy controls. The r-time and k-time in cirrhotics tended to be longer than in healthy controls (P=0.029, 0.011, respectively). The MA height tended to be smaller in cirrhotics than healthy controls (P<0.001). Although the average values for the r and k in cirrhotics still lie within the normal reference range for healthy controls, this was not the case for MA as the cirrhotic patients have an average MA of 53.5 mm which is lower than the normal reference range of 55 to 70 mm.
TABLE 2.
Mean With SD and Reference Ranges for Platelet Count, INR, and TEG Variables in Healthy and Cirrhotic Patients
| Plt (10/L) | INR | r (min) | k (min) | α (deg.) | MA (mm) | |
|---|---|---|---|---|---|---|
| Reference ranges | 150–400 | 0.90–1.20 | 5.0–10.0 | 1.0–3.0 | 53.0–72.0 | 55.0–70.0 |
| Healthy population (n=53) | ||||||
| Mean (SD) | — | — | 7.2 (1.3) | 1.9 (0.9) | 64.0 (7.8) | 59.6 (6.8) |
| All cirrhotics (n=106) | ||||||
| Mean (SD) | 108.0 (83.8) | 2.1 (1.1) | 6.5 (2.7) | 2.4 (1.4) | 69.0 (6.8) | 53.5 (12.2) |
| P | — | — | 0.029 | 0.011 | < 0.001 | < 0.001 |
Reference ranges for TEG parameters established by a healthy population.
INR and platelet count reference ranges are accepted laboratory reference ranges.
P-value: significant differences between healthy and total cirrhotic population.
INR indicates international normalized ratio; MA, maximum amplitude; Plt, platelet; TEG, thromboelastography
Furthermore, statistically significant trends in certain TEG parameters suggesting impaired hemostasis were observed as liver cirrhosis worsened (Table 3, Fig. 2). The reaction time to clot formation, r-time, increased from 5.6 to 6.1 to 7.1 minutes in CTP A, B, and C groups, respectively (P=0.047). The coagulation time (k), increased from 1.7 to 1.9 to 2.9 minutes in each advancing CTP class (P=0.001). The rate of clot polymerization slows down going from CTP A to B to C as seen by the degree of the α-angle decreasing (P=0.001). Finally, the strength of the clot (MA), is decreased going from 61.3 to 57.8 to 48.0 mm as we progress from CTP A to B to C groups (P<0.001).
TABLE 3.
Mean, Range, and Reference Values for Platelet Count, INR, and TEG Parameters Within Cirrhotics
| Plt (10/L) | INR | r (min) | k (min) | α (deg.) | MA (mm) | |
|---|---|---|---|---|---|---|
| CTP A (n=25) | ||||||
| Mean (SD) | 155.0 (90.4) | 1.1 (0.17) | 5.6 (1.8) | 1.7 (0.6) | 72.1 (4.9) | 61.3 (7.7) |
| Range | 32.0–461.0 | 0.9–1.7 | 2.5–10.7 | 0.8–3.2 | 60.6–80.6 | 44.6–77.3 |
| CTP B (n=25) | ||||||
| Mean (SD) | 113.0 (101.0) | 1.6 (0.4) | 6.1 (1.9) | 1.9 (1.0) | 71.2 (6.6) | 57.8 (9.7) |
| Range | 20.0–537.0 | 1.1–2.6 | 3.2–10.3 | 0.8–5.2 | 53.2–80.8 | 38.3–77.8 |
| CTP C (n=56) | ||||||
| Mean (SD) | 84.0 (57.4) | 2.5 (1.2) | 7.1 (3.1) | 2.9 (1.6) | 66.6 (6.8) | 48.0 (12.0) |
| Range | 15.0–344.0 | 1.3–8.1 | 3.3–23.0 | 1.0–8.2 | 44.2–78.7 | 15.5–81.1 |
| P | 0.002 | < 0.001 | 0.047 | 0.001 | 0.001 | < 0.001 |
P-value: significant differences between CTP classes.
CTP indicates Child-Turcotte-Pugh; INR, international normalized ratio; MA, maximum amplitude; Plt, platelet; TEG, thromboelastography
FIGURE 2.
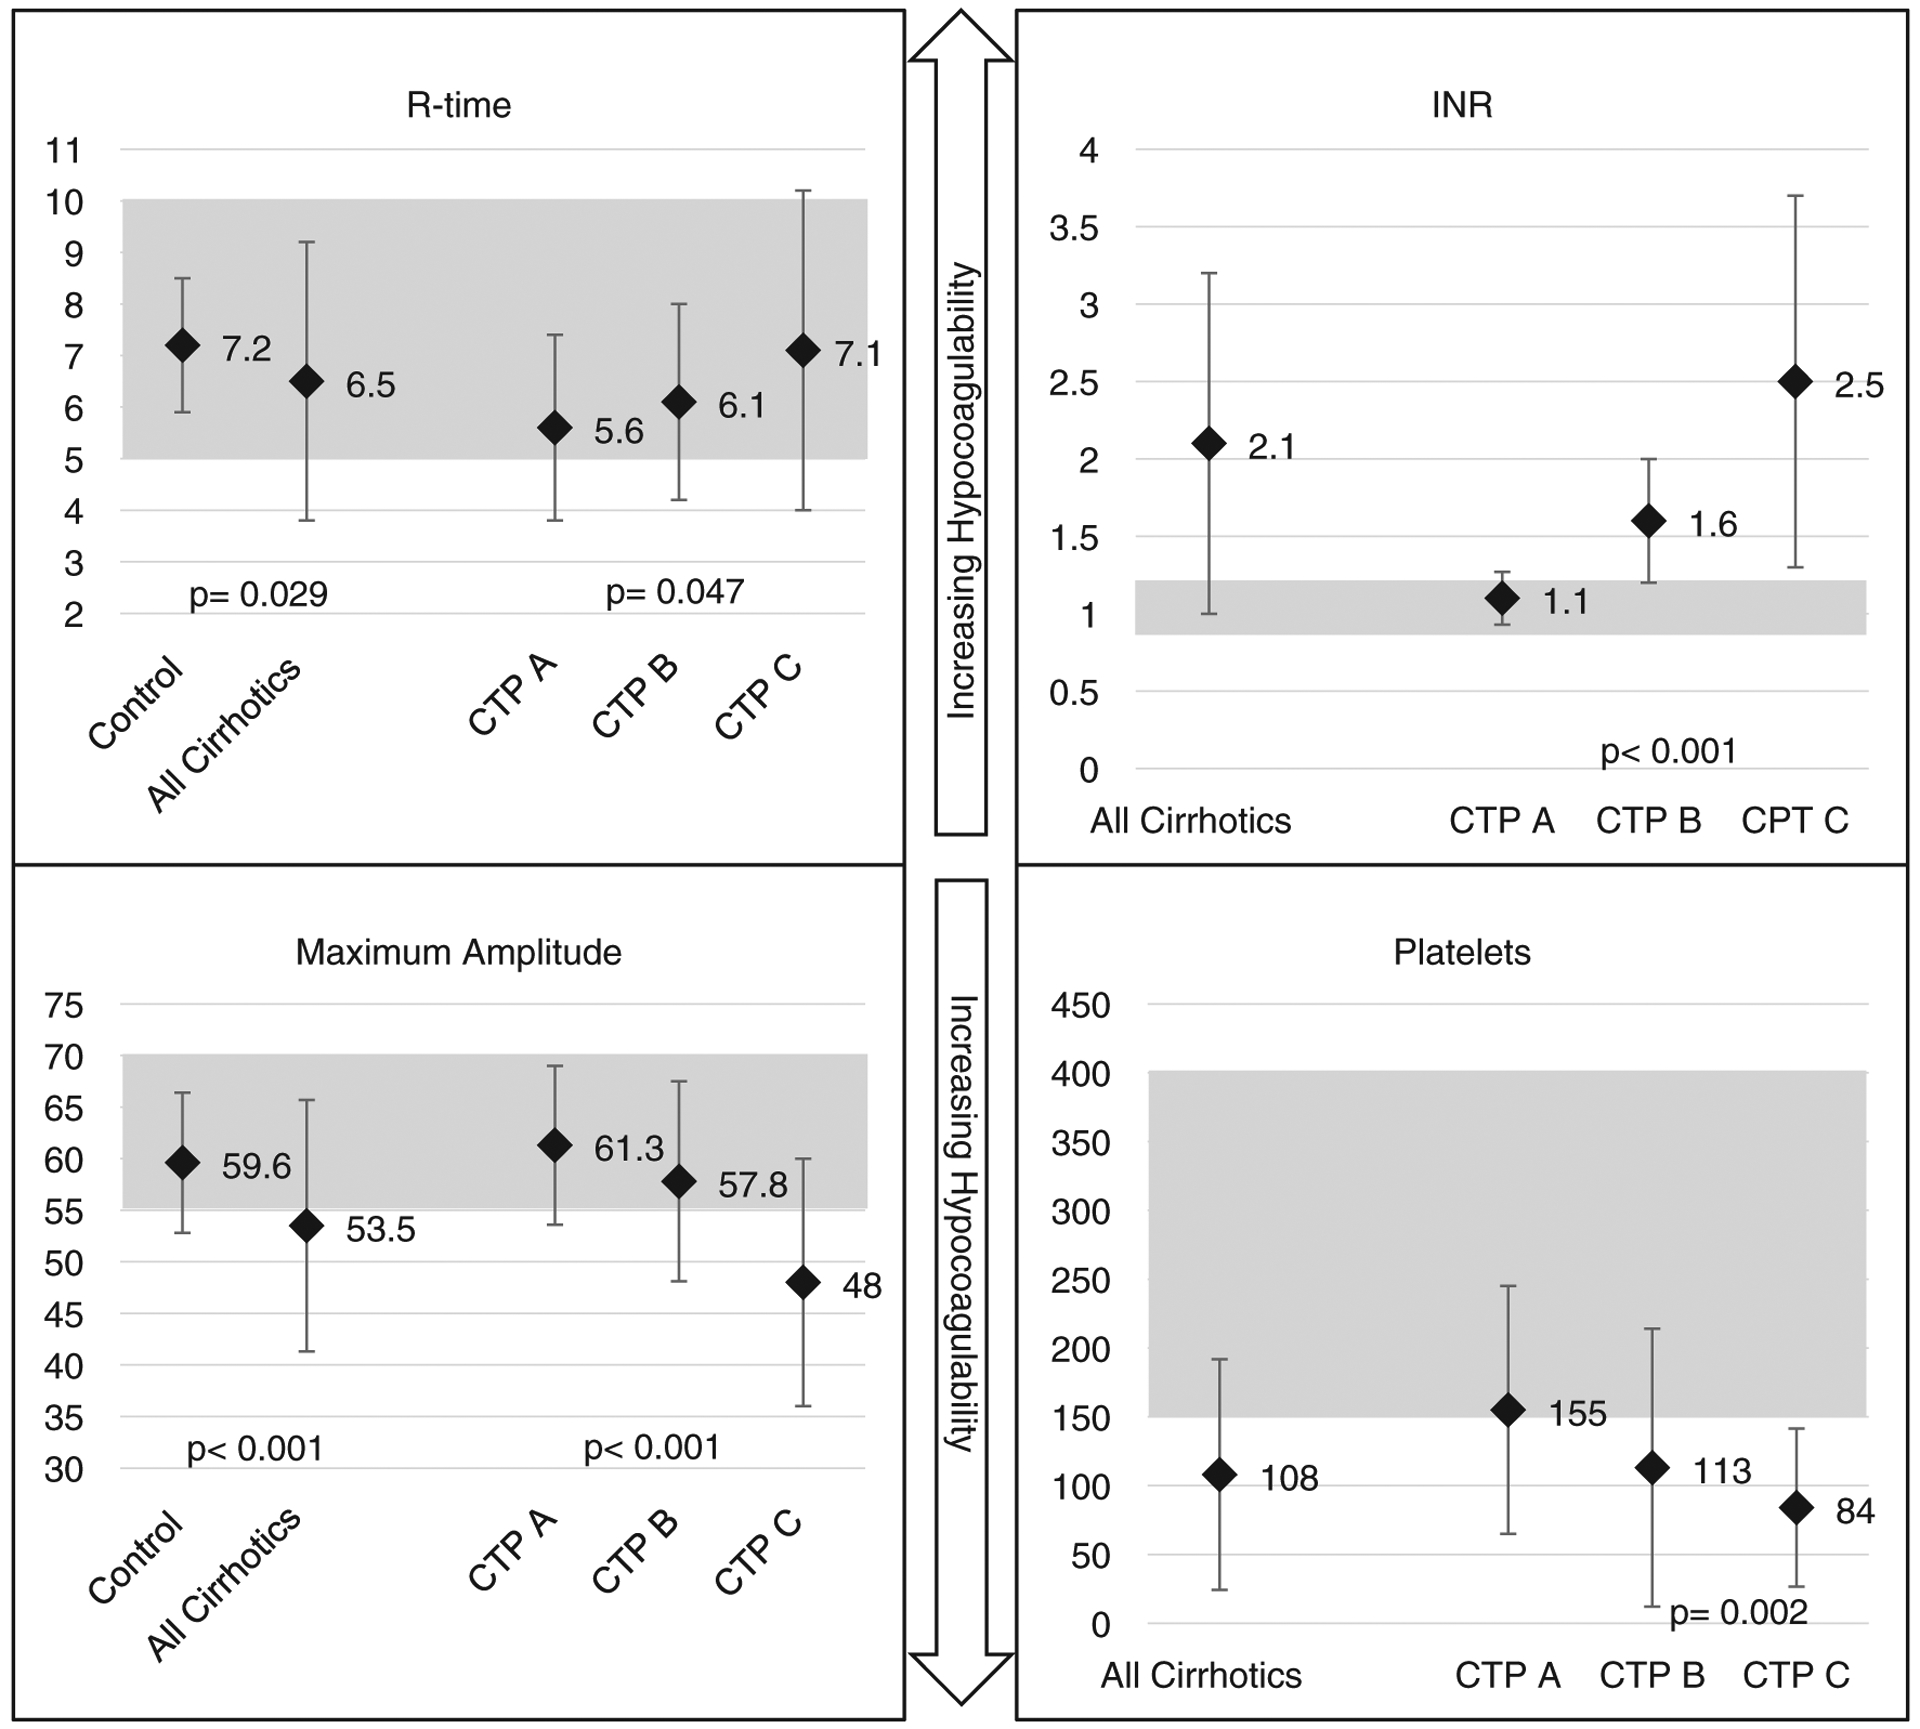
r-time (min) and maximum amplitude (mm), shaded reference ranges established by a healthy population. P-value: significant differences between healthy and total cirrhotic population. INR and platelets (×106), shaded laboratory reference ranges. P-value: significant differences between CTP classes. Mean parameters with ± SD. CTP indicates Child-Turcotte-Pugh; INR, international normalized ratio.
TEGs of Cirrhotics who Required Blood Products or Were Bleeding
In cirrhotics who had a TEG that led to blood product transfusions within 24 hours of the study (n=62) compared with those who did not require any blood products (n=44), the TEG parameters in the patients requiring transfusions suggested a more significant degree of hemostatic impairment. The MA was 49 mm in patients who needed blood product transfusions, which was shorter than patients who did not need any blood products, MA=59 mm, P<0.001) (Table 4). In addition, patients who needed blood product transfusions had a longer hospital length of stay, mean 15.22 (±SD 5.9) versus 8.36 (±SD 15.1) days (P=0.005). There was no statistical difference in in-hospital mortality between cirrhotic patients who needed blood products and those who did not 12.9% (8/62) versus 20% (9/44) (P=0.421). No statistically significant difference between TEG values, INR, or platelet count existed between cirrhotics who had the TEG for active bleeding (n=30) compared with those who were not (n=76) (P: r=0.96, k=0.54, MA=0.87, α=0.84, INR=0.28, platelet count=0.28). When comparing cirrhotics who were bleeding (n=30) with controls without cirrhosis (n=53), the MA value was 53.8 versus 59.6 (P=0.008), the difference in k-value was 2.5 versus 1.9 (P=0.02), and all other TEG parameters were not statistically different.
TABLE 4.
TEG Parameters in Cirrhotics Requiring Blood Product Transfusions Within 24 Hours Post-TEG and Cirrhotics who did not Need any Blood Product Transfusions
| Mean (SD) | ||||
|---|---|---|---|---|
| r (min) | k (min) | α (deg.) | MA (mm) | |
| TEG leading to transfusion (n=62) | 6.85 (3.05) | 2.73 (1.59) | 67.40 (7.47) | 49.12 (12.16) |
| TEG that did not lead to transfusion (n=44) | 6.02 (1.94) | 1.90 (0.88) | 71.23 (5.26) | 59.61 (9.41) |
| P | 0.116 | 0.002 | 0.004 | < 0.001 |
P-value: significant differences between transfusion and no transfusion groups.
MA indicates maximum amplitude; TEG, thromboelastography
No Correlation Between Traditional Coagulation Laboratories and TEG
A regression analysis showed no significant correlations between INR and the TEG reaction time to initiating a clot (r) across CTP class A, B, and C (r=0.01, 0.18, 0.23; P=0.95, 0.39, 0.08, respectively). There was a weak correlation between the platelet count and the strength of the clot (MA). The correlation was strongest in CTP class A and decreased as cirrhosis became more severe in CTP B and C (r=0.53, 0.39, 0.19; P=0.00 for all correlations).
DISCUSSION
In this study of hospitalized cirrhotics, we found increasing INR and worsening thrombocytopenia as the degree of liver disease advanced, which would suggest a trend toward impaired hemostasis. However, the TEG reaction time (r), coagulation time (k) and rate of polymerization (α), all remained within normal ranges of healthy controls. It was only the mass amplitude (MA), which is known to correlate well with platelet count that was consistently disparate from the healthy control reference range in CTP C cirrhotic patients.
The results of this study support a balance of hemostasis in cirrhotics not accurately reflected by the INR. The INR is an excellent measure of liver synthetic function, as decreasing the production of factor VII occurs in the cirrhotic liver as disease severity worsens.6 However, concomitant decreased production of antithrombotic proteins in the cirrhotic liver balances overall hemostasis. This is not reflected by the INR, a test of the direct coagulation cascade almost solely dependent on factor VII. In general, cirrhotic patients have clot formation parameters in normal ranges across liver disease severity as measured by a TEG, although the results do suggest impaired hemostasis as liver disease worsens. These results strongly suggest that the INR is not a good surrogate for predicting clot formation in cirrhotics, and thus may be suboptimal for predicting bleeding risk in this population. Because a TEG considers all aspects of clot formation, it may be better suited for predicting bleeding risk in cirrhotics.
The utility of the TEG has been well described in the trauma population where blood product transfusions are often guided by its values due to significant alteration in coagulation.7 TEG-guided transfusions in cirrhotics undergoing invasive procedures, compared with standard of care of transfusing until the INR>1.5 and platelets >50×106 also led to less blood product transfusions and no difference in 30-day mortality or postprocedure bleeding.2 Over the years the TEG has also been used for cirrhotics but primarily in the setting of a liver transplant. When obtained preoperatively, it predicted the need for massive transfusions, >10U of packed red blood cells. In a study of 23 liver transplants, the TEG-MA <47mm had a 90% sensitivity and 72% specificity in predicting a massive transfusion required within 24 hours.8 A lower MA <48.8mm was also found to correlate to cirrhotic patients bleeding after placement of a central venous catheter in the intensive care unit setting.9 The predictive nature of MA to suggest bleeding likely represents dysfunction in 2 components of hemostasis in cirrhotics, (1) decreased platelet quantity and function and (2) inadequate fibrin formation, suggesting both quantitative and qualitative defects in the fibrin precursor, fibrinogen, which is a glycoprotein produced by the liver. Indeed, qualitative defects in fibrinogen or dysfibrinogenemia are commonly seen in advanced cirrhosis.10
A strong correlation between MA and platelet count (r=0.712) was seen in a previous study of clinically stable, well-compensated cirrhotics in the ambulatory setting.11 This correlation is likely explained by the fact that platelet count and platelet function are likely well preserved in early or compensated cirrhosis, and this was corroborated by our study for CTP A cirrhotics. However, for CTP B and C classes, there was a weaker correlation between MA and platelet count. Thrombocytopenia alone cannot fully explain the deterioration of MA value between CTP classes because (1) the correlation between platelet count and MA disappears with liver disease progression and (2) the mean platelet value of observed class C cirrhotics, 84×106, is well above the universally accepted cutoff for increased bleeding risk. These 2 factors suggest that the decrease in MA value with disease progression is more heavily dependent on platelet function and dysfibrinogenemia, as opposed to platelet count alone. As cirrhosis progresses, platelet count, platelet function, and effective fibrin generation contribute to the trend towards anticoagulation.
Through our regression analysis, we also saw a poor correlation between the r-time of the TEG and INR. The time to clot initiation (r), has been suggested as a surrogate for the INR. Studies in noncirrhotic patients demonstrate a strong correlation and significant prolongation of the r and INR in patients on therapeutic vitamin K antagonists.12 An r-time in the normal range is considered sufficient to rule out anticoagulant effects. In cirrhosis, the INR is a marker of hepatic function as an indirect measure of the liver’s ability to synthesize coagulation factors but is not an accurate portrayal of coagulability as there is a reduction of both procoagulant and anticoagulant proteins, leading to a rebalanced hemostasis.3,13
Although it can be argued that the TEG is better in evaluating coagulopathy than the INR in cirrhotics, there are limitations to consider. The test is still an ex vivo simulated hemostatic challenge, that is not without potential biases. Results can be altered if the patient is hypothermic as the sample of blood is tested at 37°C, and the sample should be analyzed expediently after drawing the blood. In addition, there is a possibility for human error depending on the level of experience of the technician performing the evaluation. Information on the initial clot formation can be obtained quickly on a TEG study, but to get the full information from a TEG the sample must be evaluated for 60 minutes to get the CL30 and CL60 values which indicate the percentage of lysis of the clot after reaching its maximum amplitude at 30 and 60 minutes. Studies have implicated that hyperfibrinolysis is common among cirrhotic patients and is a significant factor in the balancing of coagulation.14 In our study, half the samples did not have a CL30 value as just the initial clot formation information was collected and the sample was not run to the extent required to generate a CL30 or CL60 value. A TEG is also costlier to run than an INR. At our hospital, Medicare reimbursement quotes for a TEG study are about 55 USD compared with 3 USD for an INR. Although the upfront cost may be higher, a more in-depth cost analysis should account for the possible decrease in blood product transfused for patients who get a TEG analysis rather than just INR.
Despite these limitations, these data, taken cumulatively, argue that hospitalized cirrhotic patients may benefit from TEG-guided risk stratification. Particularly for CTP C cirrhotics as TEG-MA becomes more significantly abnormal compared with a healthy population, the use of TEG may help to reduce unnecessary transfusions compared with current standards such as the INR, PT, and activated PT.
In our academic hospital, TEG-guided transfusion is variable among providers. In general, a prolonged r value outside the normal reference range prompts a unit of fresh frozen plasma. A MA value below the normal reference range prompts a unit of platelets. A prolonged k-time or decreased α-angle leads to a unit of cryoprecipitate. After transfusion of blood products, we found that the majority of providers repeated a TEG to evaluate changes in the parameters before proceeding with a procedure. For cirrhotics who were actively bleeding typically massive transfusion protocols were enacted and a TEG was used at random intervals to help guide if units of fresh frozen plasma or cryoprecipitate or platelets were necessary. Given the rapid results from TEGs, they could be used in real-time during massive transfusion situations. Future studies can help clarify the threshold providers should be using to begin blood product transfusions for cirrhotics as there was no significant difference between TEG parameters of bleeding and nonbleeding cirrhotic patients. As we found that r-time, k-time, and α-angle for hospitalized cirrhotics were mostly in the normal reference range of control patients, using those normal reference ranges may be appropriate to guide transfusion of blood products. With the MA, this was significantly lower in cirrhotics compared with normal controls, thus there may be another threshold we should be using to transfuse blood products for the MA value in cirrhotics. Further investigation within a larger population, including studying nonhospitalized cirrhotics, is required to better stratify risk of bleeding when parameters of the TEG fall out of the normal reference range.
Footnotes
The authors declare that they have nothing to disclose.
REFERENCES
- 1.Gillies BS. Thromboelastography and liver transplantation.Semin Thromb Hemost. 1995;21(suppl 4):45–49. [PubMed] [Google Scholar]
- 2.De Pietri L, Bianchini M, Montalti R, et al. Thrombelastography-guided blood product use before invasive procedures in cirrhosis with severe coagulopathy: a randomized, controlled trial. Hepatology. 2016;63:566–573. [DOI] [PubMed] [Google Scholar]
- 3.Kujovich JL. Coagulopathy in liver disease: a balancingact. Hematology Am Soc Hematol Educ Program. 2015;2015: 243–249. [DOI] [PubMed] [Google Scholar]
- 4.Somani V, Amarapurkar D, Shah A. Thromboelastography forassessing the risk of bleeding in patients with cirrhosis-moving closer. J Clin Exp Hepatol. 2017;7:284–289. [DOI] [PMC free article] [PubMed] [Google Scholar]
- 5.De Pietri L, Bianchini M, Rompianesi G, et al. Thromboelastographic reference ranges for a cirrhotic patient population undergoing liver transplantation. World J Transplant. 2016;6: 583–593. [DOI] [PMC free article] [PubMed] [Google Scholar]
- 6.Senzolo M, Burra P, Cholongitas E, et al. New insights into thecoagulopathy of liver disease and liver transplantation. World J Gastroenterol. 2006;12:7725–7736. [DOI] [PMC free article] [PubMed] [Google Scholar]
- 7.Abdelfattah K, Cripps MW. Thromboelastography and rotational thromboelastometry use in trauma. Int J Surg. 2016;33: 196–201. [DOI] [PubMed] [Google Scholar]
- 8.Lawson PJ, Moore HB, Moore EE, et al. Preoperativethrombelastography maximum amplitude predicts massive transfusion in liver transplantation. J Surg Res. 2017;220:171–175. [DOI] [PMC free article] [PubMed] [Google Scholar]
- 9.Pandey CK, Saluja V, Gaurav K, et al. K time & maximumamplitude of thromboelastogram predict post-central venous cannulation bleeding in patients with cirrhosis: a pilot study. Indian J Med Res. 2017;145:84–89. [DOI] [PMC free article] [PubMed] [Google Scholar]
- 10.Palascak JE, Martinez J. Dysfibrinogenemia associated withliver disease. J Clin Invest. 1977;60:89–95. [DOI] [PMC free article] [PubMed] [Google Scholar]
- 11.Shin KH, Kim IS, Lee HJ, et al. Thromboelastographicevaluation of coagulation in patients with liver disease. Ann Lab Med. 2017;37:204–212. [DOI] [PMC free article] [PubMed] [Google Scholar]
- 12.Franchi F, Hammad JS, Rollini F, et al. Role of thromboelastography and rapid thromboelastography to assess the pharmacodynamic effects of vitamin K antagonists. J Thromb Thrombolysis. 2015;40:118–125. [DOI] [PubMed] [Google Scholar]
- 13.Tripodi A, Mannucci PM. The coagulopathy of chronic liverdisease. N Engl J Med. 2011;365:147–156. [DOI] [PubMed] [Google Scholar]
- 14.Rijken DC, Kock EL, Guimaraes AH, et al. Evidence for anenhanced fibrinolytic capacity in cirrhosis as measured with two different global fibrinolysis tests. J Thromb Haemost. 2012;10: 2116–2122. [DOI] [PubMed] [Google Scholar]