

Abstract
Background/Objective:
Few studies examine the impact of frailty on long-term patient-oriented outcomes after emergency general surgery (EGS). We measured the prevalence of frailty among older EGS patients and examined the impact of frailty on one-year outcomes.
Design:
Retrospective cohort study using 2008–2014 Medicare claims.
Setting:
Acute care hospitals.
Participants:
Patients ≥65 years who received one of the five EGS procedures with the highest mortality burden (partial colectomy, small-bowel resection, peptic ulcer disease repair, adhesiolysis, laparotomy).
Measurements:
A validated Claims-Based Frailty Index (CFI) identified patients who were not frail (CFI<0.15), pre-frail (0.15≤CFI<0.25), mildly frail (0.25≤CFI<0.35) and moderately-severely frail (CFI≥0.35). Multivariable Cox regression compared 1-year mortality. Multivariable Poisson regression compared rates of post-discharge hospital encounters (hospitalizations, intensive care unit stay, emergency department visit) and home-time over one-year after discharge. All regression models adjusted for age, sex, race, admission from facility, procedure, sepsis, inpatient palliative care delivery, trauma center designation, hospital bed size, teaching status, and were clustered by patient and hospital referral region.
Results:
Among 468,459 older EGS adults, 37.4% were pre-frail, 12.4% were mildly frail, and 3.6% were moderately-severely frail. Patients with mild frailty experienced higher risk of 1-year mortality compared to non-frail patients (Hazard Ratio, CI: 1.97, 1.94–2.01). In the year after discharge, patients with mild and moderate-severe frailty had more hospital encounters compared to non-frail patients (7.8 and 11.5 vs 2.0 per person-year; Incidence Rate Ratio [IRR], CI: 4.01, 3.93–4.08; 5.89, 5.70–6.09). Patients with mild and moderate-severe frailty also had fewer days at home in the year after discharge compared to non-frail patients (256 and 203 vs. 302 mean days; IRR, CI: 0.97, 0.96–0.97; 0.95, 0.94–0.95).
Conclusions:
Older EGS patients with frailty are at increased risk for poor one-year outcomes and decreased home-time. Targeted interventions for older EGS patients with frailty during the index EGS hospitalization are urgently needed to improve long-term outcomes.
Keywords: emergency general surgery, frailty, geriatric surgery, hospital volume, outcomes
INTRODUCTION
Frailty is a multi-dimensional syndrome indicating a loss of physiologic reserve and increased vulnerability to stressors that is present in up to 50% of surgical patients.1–3 Frailty better predicts post-operative morbidity and mortality than chronological age alone in older patients.4–7 Acute intra-abdominal conditions, such as bowel perforations, bleeding ulcers, or problematic adhesions, often present unexpectedly and require emergency general surgery (EGS). In this acute setting, there is little time to medically optimize a patient with frailty prior to treatment. In single center studies within the United States (US), EGS patients with frailty suffer from a higher risk of in-hospital complications, prolonged length of hospital and intensive care unit (ICU) stay, and 30-day mortality.5,6,8 One prior study has examined long-term mortality among patients with frailty after EGS in Canada.7 However, there is little evidence regarding other patient-oriented long-term outcomes such as days at home or post-discharge healthcare utilization for EGS patients with frailty beyond the 30-day post-operative period, thereby limiting the scope of quality improvement efforts.
Most existing frailty constructs cannot be directly ascertained from administrative claims data, are resource-intensive for primary data collection, or exclude data about healthcare use and functional status.9,10 However, a recently developed Claims-Based Frailty Index (CFI), modeled off the deficit-accumulation approach, uses a comprehensive combination of administrative codes and has been shown to predict frailty-associated outcomes as well as existing comorbidity indexes in the Medicare population and also correlates robustly with frailty phenotype.11–13 This novel tool allows for claims-based investigations of the impact of frailty on patient outcomes.
This study used Medicare claims to measure the prevalence of frailty in a cohort of older EGS patients and examine the impact of frailty on outcomes up to a year after EGS. We hypothesized that frailty would be associated with 1) higher one-year mortality, 2) higher rates of non-home discharge, and 3) worse long-term post-discharge outcomes, including fewer days at home and increased healthcare utilization one year after discharge.
METHODS
Data Source
This population-based, retrospective cohort study used Medicare fee-for-service claims data from January 1, 2008 to December 31, 2014. The Master Beneficiary Summary File, denominator file, and MedPAR files were used to identify the study population. Study variables were identified through the inpatient, outpatient, carrier claims, durable medical equipment, hospice, and vital status files through the Virtual Research Data Center (VRDC) housed through the Centers for Medicare and Medicare Services (CMS). The hospital provider number was linked with the 2013 American Hospital Association Database to determine hospital characteristics and hospital referral region (HRR). This study was approved by the Partners Human Research Committee with a waiver of informed consent.
Study Population
Patients aged 65 years or older with at least 12 months of continuous Medicare enrollment prior to a qualifying EGS procedure were included. Study subjects were admitted urgently or emergently with an inpatient claim for one of the five EGS procedures with the highest mortality burden (partial colectomy, small bowel resection, repair of peptic ulcer disease, lysis of adhesions, and laparotomy), identified using International Classification of Diseases, Ninth Revision, Clinical Modification (ICD-9-CM) procedure codes.14 Patients with multiple qualifying procedures during the same admission were classified based on the primary procedure. Patients with multiple EGS procedures during the study period were included after a one-year washout period to ensure at least one-year of follow up time.
Assessment of Frailty
A CFI was used to determine preoperative frailty status.11,15 Modeled on the Rockwood Frailty Index, the CFI is calculated by assigning defined weights to 93 ICD-9 diagnosis codes, Current Procedural Terminology variables, and Healthcare Common Procedure Coding System variables for a variety of DME claims, comorbid conditions, and healthcare facility use in the 12 months preceding an admission. The CFI ranges from 0–1, where a higher number indicates greater frailty. Based on prior studies, patients were stratified into four groups: non-frail (CFI<0.15), pre-frail (0.15≤CFI<0.25), mild frailty (0.25≤CFI<0.35) and moderate-severe frailty (CFI≥0.35).12
Patient and Hospital Characteristics
Patient characteristics included age, gender, race, and ethnicity. Patient comorbidities were measured using the Deyo Charlson Comorbidity Index.16 Patients with an immediate pre-admission claim for skilled nursing facility or long-term care facility were assumed to be admitted from a facility.
Admission characteristics included the qualifying EGS procedure, year of hospitalization, inpatient palliative care delivery (ICD-9-CM V66.7) and sepsis diagnosis as a proxy for disease severity (ICD-9-CM 038.x, 995.91, 995.92, 785.5x). Hospital characteristics included the Medicare hospital region, hospital bed size, teaching hospital status, trauma center designation. Trauma center designation was included because prior studies have shown that EGS patients cared for at trauma centers have better outcomes.
Outcomes
In-hospital outcomes included non-home discharge, which was calculated as live discharges to a location other than home or hospice. Longer term outcomes included mortality (30-day, 180-day, one-year) and post-discharge healthcare utilization (hospitalization, emergency department (ED) visit, and ICU stay) in the year after discharge among patients discharged alive. Total hospital encounters, a composite outcome defined as an ED visit with or without hospitalization, was included as a patient-centered outcome given that patients are unaware if they need to be hospitalized when seeking ED care. We also examined days at home over one year as the total days alive from the admission date minus days spent in a hospital, facility, or skilled nursing home.17–19 Home-time is an outcome that is correlated with patient-reported outcomes and reflects the burden of hospital use among seriously ill patients, and is a patient-centered metric that can be feasibly obtained from administrative data.20
Statistical Analysis
Characteristics between the four patient groups were compared using the χ2 test for categorical variables, ANOVA for normally-distributed continuous variables, and Kruskal-Wallis test for non-normally distributed continuous variables. The annual prevalence of frailty among older EGS patients was determined as the proportion of patients with mild or moderate-severe frailty per year in the study population.
For all multivariable analyses, non-frail patients were the reference group. Multivariable logistic regression was performed to compare in-hospital outcomes between the four patient groups, adjusting for age, sex, race, admission from facility, procedure, sepsis diagnosis, inpatient palliative care delivery, hospital bed size, hospital teaching status, and trauma center designation. Kaplan-Meier survival analysis compared one-year survival between the four groups of patients. Multivariable Cox regression compared 30-day, 180-day, and 1-year mortality, adjusting for the same covariates as the logistic regression. Among patients who were discharged alive, crude incidence rates were derived to determine the rate per person-year of healthcare utilization (hospitalization, ED visit, total hospital encounters, ICU stay) in both groups. Multivariable Poisson regression was performed to compare rates of healthcare utilization and home-time, adjusting for the same covariates as the prior regressions. An offset term, each patient’s days alive, was included in the Poisson model to account for differing follow up time.
The unit of analysis was the individual admission. All regression analyses were clustered at the patient and HRR level, using the theory of generalized estimating equations (GEE). GEE allows for more than level of clustering by allowing the correlation on any paired observations in a cluster (such as an HRR) to differ. A p<0.05 was statistically significant. Analysis were conducted using SAS 9.4 (SAS Institute Inc., Cary, NC) within the CMS VRDC secure environment in compliance with CMS regulations and standards.
RESULTS
Patient and Hospital Characteristics
Among 468,459 older Medicare beneficiaries who underwent the EGS procedures of interest, 37.4% were pre-frail, 12.4% were mildly frail, and 3.6% were moderately-severely frail (Table 1). Patient and hospital characteristics are shown in Table 1. Patients with mild and moderate-severe frailty were older, were predominately female (65%), White (85%), and one-fifth were admitted from a facility. Fourteen percent of patients with any frailty received palliative care during the index hospitalization. The annual prevalence of any frailty among the older EGS patients increased over time from 14% in 2008 to 17% in 2014 (Supplementary Figure S1).
Table 1:
Patient and hospital characteristics of older emergency general surgery (EGS) patients separated by frailty status
| Variable | Non-Frail (n=218,264) |
Pre-Frail (n=175,336) |
Mild Frailty (n=58,056) |
Moderate-Severe Frailty (n=16,803) |
|---|---|---|---|---|
| Patient Characteristics | ||||
| Age, years, mean (SD) | 78 (7) | 80 (8) | 80 (8) | 80 (8) |
| Female | 120,841 (55.4) | 102,779 (58.6) | 37,102 (63.9) | 11,180 (66.5) |
| Race / Ethnicity | ||||
| White | 193,722 (88.8) | 154,609 (88.2) | 49,886 (85.9) | 13,725 (81.7) |
| Black | 15,718 (7.2) | 14,206 (8.1) | 5,797 (10.0) | 2,229 (13.3) |
| Hispanic | 2,156 (1.0) | 2,169 (1.2) | 957 (1.6) | 381 (2.3) |
| Other | 6,668 (3.1) | 4,352 (2.5) | 1,416 (2.5) | 468 (2.8) |
| Charlson score ≥2 | 40,604 (18.6) | 100,964 (57.6) | 46,110 (79.4) | 14,849 (88.4) |
| Admitted from facility | 3,368 (1.5) | 15,634 (8.9) | 12,005 (20.7) | 3,870 (23.0) |
| Admission Characteristics | ||||
| Admission Year | ||||
| 2008 | 36,356 (16.7) | 27,042 (15.4) | 8,277 (14.3) | 2,386 (14.2) |
| 2009 | 33,387 (15.3) | 26,065 (14.9) | 7,993 (13.8) | 2,251 (13.4) |
| 2010 | 32,389 (14.8) | 25,723 (14.7) | 7,876 (13.6) | 2,226 (13.2) |
| 2011 | 30,774 (14.1) | 25,365 (14.5) | 8,720 (15.0) | 2,572 (15.3) |
| 2012 | 29,565 (13.5) | 24,141 (13.8) | 8,540 (14.7) | 2,655 (15.8) |
| 2013 | 28,146 (12.9) | 23,549 (13.4) | 8,516 (14.7) | 2,497 (14.9) |
| 2014 | 27,647 (12.7) | 23,451 (13.4) | 8,134 (14.0) | 2,216 (13.2) |
| Type of Procedure | ||||
| Partial colectomy | 80,359 (36.8) | 57,138 (32.6) | 18,366 (31.6) | 5,249 (31.2) |
| Operative management of PUD | 49,003 (22.5) | 52,472 (29.9) | 20,042 (34.5) | 5,952 (35.4) |
| Lysis of Adhesions | 41,622 (19.1) | 29,436 (16.8) | 8,752 (15.1) | 2,572 (15.3) |
| Small Bowel Resection | 41,002 (18.8) | 29,858 (17.0) | 8,695 (15.0) | 2,356 (14.0) |
| Exploratory Laparotomy | 6,278 (2.9) | 6,432 (3.7) | 2,201 (3.8) | 674 (4.0) |
| Sepsis | 28,555 (13.1) | 29,125 (16.6) | 12,164 (21.0) | 4,170 (24.8) |
| Inpatient Palliative Care Delivery | 17,096 (8.9) | 19,594 (11.5) | 7,781 (13.9) | 2,297 (14.2) |
| Hospital Characteristics | ||||
| Bed size | ||||
| <150 | 41,810 (19.2) | 32,024 (18.3) | 10,147 (17.5) | 2,750 (16.4) |
| 150–300 | 69,445 (31.8) | 54,449 (31.1) | 18,385 (31.7) | 5,295 (31.5) |
| >300 | 107,009 (49.0) | 88,863 (50.7) | 29,524 (50.9) | 8,758 (52.1) |
| Teaching Hospital | 33,767 (15.5) | 30,485 (17.4) | 9,744 (16.8) | 2,799 (16.7) |
| Medicare Hospital Region | ||||
| South | 84,187 (38.6) | 66,604 (38.0) | 23,069 (39.7) | 7,570 (45.1) |
| Midwest | 50,637 (23.2) | 47,080 (26.9) | 15,669 (27.0) | 4,120 (24.5) |
| Northeast | 44,410 (20.3) | 33,803 (19.3) | 10,554 (18.2) | 2,692 (16.0) |
| West | 38,834 (17.8) | 27,779 (15.8) | 8,751 (15.1) | 2,415 (14.4) |
| Level I-II Trauma Center Designation | 63,781 (29.2) | 56,424 (32.2) | 18,641 (32.1) | 5,288 (31.5) |
Values are No.(%) unless otherwise noted
Abbreviations: HRR, hospital referral region; PUD, peptic ulcer disease; SD, standard deviation
Mortality and In-Hospital Outcomes
Overall mortality was 73,666 (15.7%) at 30 days, 115,687 (24.7%) at 180 days, and 102,365 (30.4%) at one year for the study population. Patients with moderate-severe frailty had the highest crude mortality rates at all time points, followed by those with mild frailty and pre-frailty, compared to non-frail patients (Figure 1). Table 2 shows the multivariable analysis for mortality and in-hospital outcomes among the four groups. Patients who were pre-frail had a higher risk of 30-day (Hazard Ratio [HR]: 1.39, 95% Confidence Interval [CI]: 1.37–1.41), 180-day (HR: 1.45, 95% CI: 1.43–1.47) and 1-year mortality (HR: 1.48, 95% CI: 1.46–1.50) than non-frail patients. Patients with mild frailty experienced a higher risk of 30-day (HR: 1.69, 95% CI: 1.65–1.72), 180-day (HR: 1.89, 95% CI: 1.86–1.93) and 1-year mortality (HR: 1.97, 95% CI: 1.94–2.01) than non-frail patients. Patients with mild or moderate-severe frailty also experienced two-times higher odds of non-home discharge (Table 2).
Figure 1.
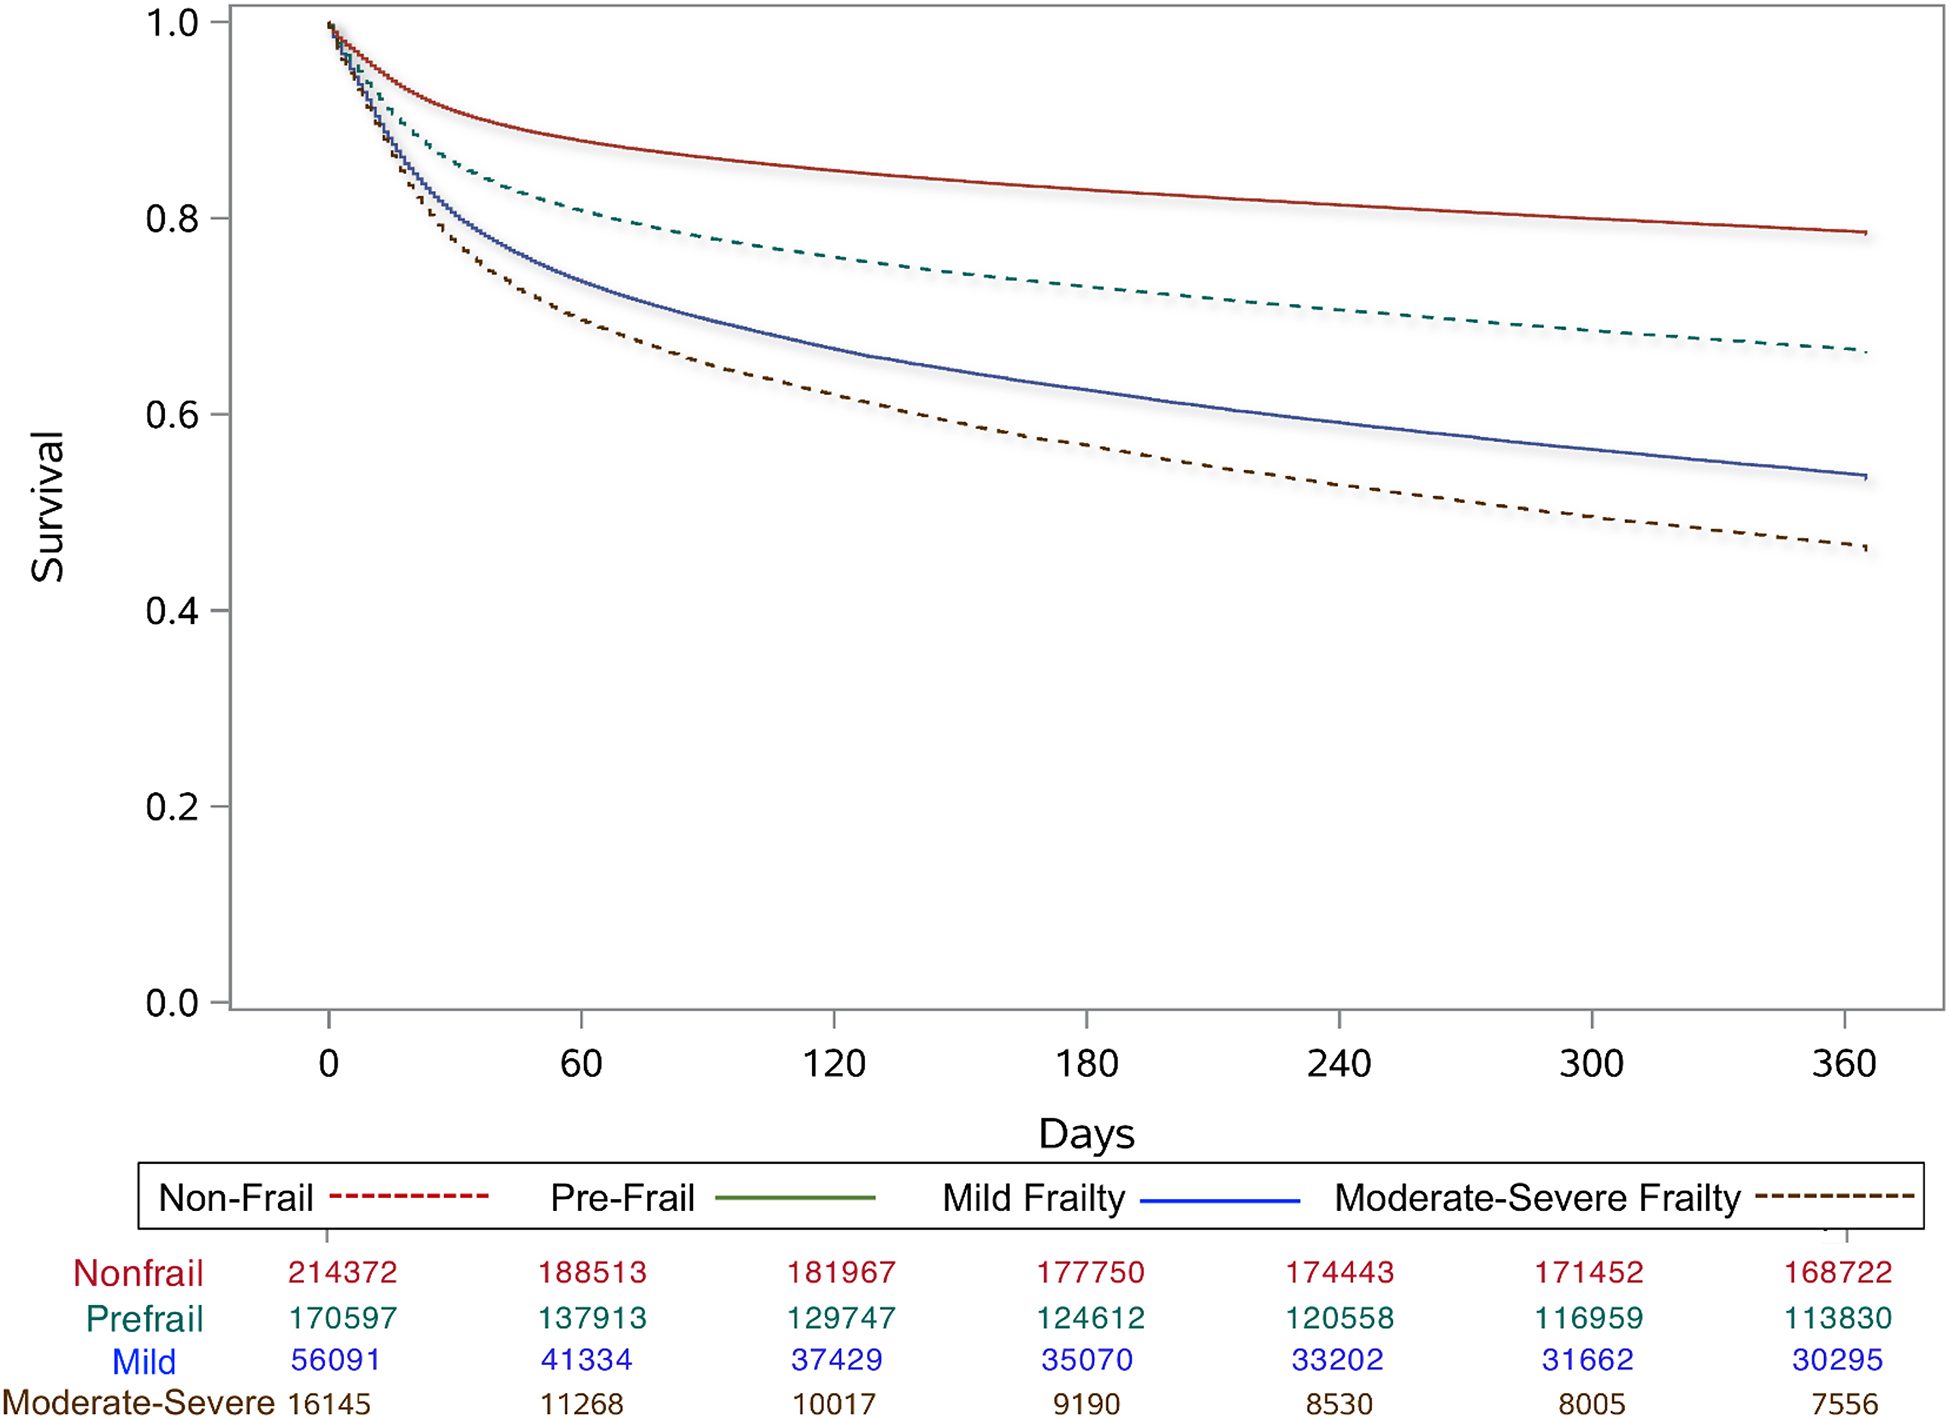
One-year survival among older emergency general surgery patients separated by frailty group
Table 2:
In-hospital and post-discharge outcomes after emergency general surgery (EGS) among older Medicare patients separated by frailty status
| Variable | Non-Frail (n=218,264) |
Adjusted Analysisa | Pre-Frail (n=175,336) |
Adjusted Analysisa | Mild Frailty (n=58,056) |
Adjusted Analysisa | Moderate-Severe Frailty (n=16,803) |
Adjusted Analysisa |
|---|---|---|---|---|---|---|---|---|
| In-Hospital Outcomes | No. (%) | Odds Ratio (95% CI) | No. (%) | Odds Ratio (95% CI) | No. (%) | Odds Ratio (95% CI) | No. (%) | Odds Ratio (95% CI) |
| In-Hospital Mortality | 15,159 (6.9) | REF | 18,658 (10.6) | 1.38 (1.35–1.42) |
8,024 (13.8) | 1.64 (1.58–1.69) |
2,580 (15.4) | 1.72 (1.63–1.81) |
| Non-Home Discharge | 59,647 (27.3) | REF | 65,438 (37.3) | 1.43 (1.41–1.45) |
28,214 (48.6) | 2.03 (1.99–2.07) |
8,317 (49.5) | 2.11 (2.04–2.19) |
| Mortality | No. (%) | Hazard Ratio (95% CI) | No. (%) | Hazard Ratio (95% CI) | No. (%) | Hazard Ratio (95% CI) | No. (%) | Hazard Ratio (95% CI) |
| 30 days | 24,247 (11.1) | REF | 30,892 (17.6) | 1.39 (1.37–1.41) |
13,915 (24.0) | 1.69 (1.65–1.72) |
4,612 (27.4) | 1.84 (1.78–1.90) |
| 180 days | 38,042 (17.4) | REF | 48,131 (27.5) | 1.45 (1.43–1.47) |
22,142 (38.1) | 1.89 (1.86–1.93) |
7,372 (43.9) | 2.14 (2.09–2.20) |
| 1 year | 47,222 (21.6) | REF | 59,118 (33.7) | 1.48 (1.46–1.50) |
26,996 (46.5) | 1.97 (1.94–2.01) |
9,029 (53.7) | 2.30 (2.24–2.35) |
| One-Year Post-Discharge Outcomes b | Incidence per person-year | Incidence Rate Ratio (95% CI) | Incidence per person-year | Incidence Rate Ratio (95% CI) | Incidence per person-year | Incidence Rate Ratio (95% CI) | Incidence per person-year | Incidence Rate Ratio (95% CI) |
| ED Visits | 1.5 | REF | 3.3 | 2.30 (2.27–2.33) |
6.5 | 4.46 (4.38–4.55) |
9.7 | 6.72 (6.50–6.95) |
| Rehospitalizations | 1.7 | REF | 3.4 | 2.00 (1.96–2.03) |
5.9 | 3.50 (3.44–3.56) |
8.4 | 4.98 (4.83–5.13) |
| ICU stays | 0.3 | REF | 0.5 | 1.94 (1.90–1.97) |
0.9 | 3.22 (3.15–3.30) |
1.2 | 4.47 (4.29–4.65) |
| Total Hospital Encounters | 2.0 | REF | 4.2 | 2.16 (2.14–2.19) |
7.8 | 4.01 (3.93–4.08) |
11.5 | 5.89 (5.70–6.09) |
| Days at Home, mean (SD) | 302 (122) | REF | 265 (142) | 0.99 (0.99–0.99) |
256 (150) | 0.97 (0.96–0.97) |
203 (150) | 0.95 (0.94–0.95) |
Abbreviations: CI, confidence interval; ED, emergency department; FEP, hospital frail EGS proportion; HRR, hospital referral region; ICU, intensive care unit; IQR, interquartile range; LOS, length of stay; LTAC, long term acute care hospital; SD, standard deviation; SNF, skilled nursing facility
OR, odds ratio after logistic regression; HR, hazard ratio after Cox regression; IRR, incidence rate ratio after Poisson regression. All regression models adjusted for age, sex, race, admission from facility, procedure, sepsis, inpatient palliative care delivery, trauma center designation, hospital bed size, teaching status, and clustered by patient and HRR
Among patients discharged alive
One-Year Post-Discharge Outcomes
Patients discharged alive who were pre-frail or frail uniformly experienced higher crude incidence rates of hospitalizations, ED visits, total hospital encounters, and ICU stays compared to non-frail patients (Table 2). In adjusted analysis, patients with pre-frailty, mild frailty, and moderate-severe frailty had increasingly higher adjusted frequencies of healthcare utilization in the year after discharge compared to non-frail patients (Table 2). In particular, patients with mild and moderate-severe frailty had four and six times higher adjusted incidence per person-year of total hospital encounters, respectively (adjusted incidence rate ratio [aIRR], 95% CI: 4.01, 3.93–4.08; 5.89, 5.70–6.09). Patients with mild frailty and moderate-severe frailty respectively spent 46 and 99 fewer mean days at home respectively compared to non-frail patients (mean, aIRR, 95% CI: 256 days, 0.97, 0.96–0.97; 203 days, 0.95, 0.94–0.95 vs. 302 days, Ref).
DISCUSSION
This study uses a national, population-level administrative claims database to reveal that older adults with any degree of frailty are particularly vulnerable for poor outcomes in the year after EGS. We found that over one-third of patients are pre-frail, more than 15% of older EGS patients exhibit mild or moderate-severe frailty, and that these patients are have a significantly higher likelihood of mortality within one year. Furthermore, EGS patients with any frailty experience four to six times higher frequency of hospital encounters after discharge. These findings suggest that the index EGS hospitalization is an opportunity for surgeons and non-surgeons who are part of the perioperative care team to set expectations about possible future care trajectories. Given the high risk of mortality or of needing future hospital care, engaging in goals of care conversations during the index hospitalization can also help align any post-operative treatments with the patient’s preferences.
This study revealed remarkably high 30-day, 180-day, and one-year mortality in Medicare patients with frailty who underwent an EGS. Similar to findings from other studies, patients with frailty at least two times the risk of one-year mortality compared to non-frail patients.21,22 Additionally, this relationship was dose-dependent, where a higher degree of frailty conferred a greater risk of mortality. We also found, as in other studies, that most one-year deaths occurred in the 180-day period after discharge.23 Hospital-based frailty initiatives could potentially reduce mortality in these patients. For example, a study of a systemic frailty screening and palliative care referral program at a Veterans Affairs medical center found a 33% reduction in the relative risk of 180-day mortality among patients who completed a preoperative palliative care consult.24 This mortality risk reduction coincided with higher rates of surgeon-initiated palliative care consults and more patients declining surgery. Given the urgent nature of EGS, elective pre-operative evaluation by palliative care specialists is not feasible. Therefore an interdisciplinary inpatient team including geriatricians, palliative care specialists, and surgeons can manage older EGS patients with frailty in the peri-operative period, including risk-stratification with the comprehensive geriatric assessment and goal-setting, symptom management, prevention of complications, and care coordination for discharge planning and post-discharge care. In this study, fifteen percent of patients with any frailty received billing for inpatient palliative care during their surgical hospitalization, which is higher than in other acutely ill older surgical patients.25 A limitation of administrative data is that coding for palliative care underrepresents actual delivery of primary palliative care.26 However, given the high rates of mortality, institutional discharge and healthcare utilization after EGS among older patients with frailty, palliative care should be routinely provided by members of the perioperative team to all of these patients as suggested by national consensus guidelines for quality palliative care endorsed by the American college of Surgeons.27
The unexpected nature of EGS limits opportunities for pre-operative optimization, leading to high rates of non-home discharge, months away from home even after discharge, and high rates of hospital encounters, particularly in patients with frailty. Although preoperative prediction models have been proposed to identify patients at high risk for non-home discharge after surgery, these models do not include frailty assessments and have largely been developed for patients undergoing elective surgery.28–30 Including frailty screens during the EGS hospitalization can have two benefits. Firstly, including frailty screens as part of risk analysis tools in the perioperative setting may support decision-making and also improve outcomes. For example, Bryant et al. showed that implementation of a standardized care pathway triggered by a frailty screen reduced delirium rates in trauma patients by 50%.31 While small sample size and single-site design limit the generalizability of these findings, this intervention demonstrates proof of concept that screening interventions benefit frail non-elective surgical patients. Secondly, frailty screens can help provide anticipatory guidance for the patient and caregiver. Communicating the burden of time away from home and repeated healthcare encounters is particularly significant since older Medicare beneficiaries with frailty are particularly high risk for potentially preventable ED visits and rehospitalizations.32 Older patients with frailty also account for over 50% of potentially preventable healthcare spending despite being a small percentage of the Medicare population.32,33 In this context, the index EGS hospitalization presents an opportunity to engage in advance care planning to inform future medical care, set expectations about post-discharge care and anticipate the high likelihood of future hospital encounters. In addition to targeted clinical pathways, interventions to smooth care transitions and improve care continuity in older EGS patients may reduce unnecessary and avoidable rehospitalizations among older patients with frailty.31,34,35
A significant strength of this study is the use of a validated CFI to identify frailty among older EGS patients and examine longitudinal outcomes and patterns of care after EGS in claims data. Use of the CFI can therefore be a particularly powerful tool to measure frailty in future longitudinal analyses of surgical outcomes. However, there are several limitations to consider. First, this analysis was restricted to the top five EGS procedures with the highest mortality burden in the United States and thus these findings may not be generalizable to patients receiving other EGS procedures or admitted with EGS conditions who are managed non-operatively. This study is limited to fee-for-service Medicare patients and we were unable to general to other insured or uninsured US populations. As with other retrospective analyses of administrative data, lack of granular clinical information limits our ability to fully risk-adjust for disease severity at time of presentation. Finally, we attempted to capture patient-centered outcomes by including non-home discharge and home-time but acknowledge that the lack of patient-reported outcomes in Medicare data precludes our ability to examine the entire surgical experience of an older EGS patient with frailty. Measures for functional decline and patient-reported quality of life are urgently needed in administrative claims data to address these limitations in future studies.
Conclusion
In the national Medicare population, older adults with frailty fare poorly after EGS compared to non-frail patients, have two times higher risk of one-year mortality and are four to six times more likely to encounter a hospital in the year after discharge. All EGS patients spent months away from home; however EGS patients with frailty spent 46 and 99 fewer mean days at home compared to non-frail patients, respectively. Policies and processes of care targeting this vulnerable population are critically needed to improve outcomes in EGS patients with frailty and reduce post-discharge healthcare utilization.
Supplementary Material
Supplementary Figure S1. Percentage of Frailty Among Older Emergency General Surgery Patients Per Year (2008–2014)
ACKNOWLEDGMENTS
The authors would like to thank Dr. Molly Jarman, PhD, MPH for her assistance with editorial review.
Funding:
Dr. Kim is funded by the National Institute of Aging (1R01AG056368-01A1, P30AG048785, P30AG031679).
Dr. Mitchell is supported by NIH-NIA K24AG033640.
Dr. Cooper is funded by the Paul B Beeson Emerging Leaders Career Development Award in Aging (K76AG054859-01) and the American Federation for Aging Research.
Footnotes
Conflict of Interest
The authors declare no conflict of interest
Meeting Presentation:
This study was presented at the 2019 Annual Scientific Meeting of the American Geriatrics Society, Portland, OR, May 2019.
References:
- 1.Hewitt J, Long S, Carter B, Bach S, McCarthy K, Clegg A. The prevalence of frailty and its association with clinical outcomes in general surgery: a systematic review and meta-analysis. Age and ageing. 2018;47(6):793–800. [DOI] [PubMed] [Google Scholar]
- 2.Partridge JS, Harari D, Dhesi JK. Frailty in the older surgical patient: a review. Age Ageing. 2012;41(2):142–147. [DOI] [PubMed] [Google Scholar]
- 3.Beggs T, Sepehri A, Szwajcer A, Tangri N, Arora RC. Frailty and perioperative outcomes: a narrative review. Canadian journal of anaesthesia = Journal canadien d’anesthesie. 2015;62(2):143–157. [DOI] [PubMed] [Google Scholar]
- 4.Khan M, Jehan F, Zeeshan M, et al. Failure to Rescue After Emergency General Surgery in Geriatric Patients: Does Frailty Matter? The Journal of surgical research. 2019;233:397–402. [DOI] [PubMed] [Google Scholar]
- 5.Joseph B, Zangbar B, Pandit V, et al. Emergency General Surgery in the Elderly: Too Old or Too Frail? Journal of the American College of Surgeons. 2016;222(5):805–813. [DOI] [PubMed] [Google Scholar]
- 6.Farhat JS, Velanovich V, Falvo AJ, et al. Are the frail destined to fail? Frailty index as predictor of surgical morbidity and mortality in the elderly. J Trauma Acute Care Surg. 2012;72(6):1526–1530; discussion 1530–1521. [DOI] [PubMed] [Google Scholar]
- 7.McIsaac DI, Moloo H, Bryson GL, van Walraven C. The Association of Frailty With Outcomes and Resource Use After Emergency General Surgery: A Population-Based Cohort Study. Anesthesia and analgesia. 2017;124(5):1653–1661. [DOI] [PubMed] [Google Scholar]
- 8.Akyar S, Armenia SJ, Ratnani P, Merchant AM. The Impact of Frailty on Postoperative Cardiopulmonary Complications in the Emergency General Surgery Population. Surg J (N Y). 2018;4(2):e66–e77. [DOI] [PMC free article] [PubMed] [Google Scholar]
- 9.Buta BJ, Walston JD, Godino JG, et al. Frailty assessment instruments: Systematic characterization of the uses and contexts of highly-cited instruments. Ageing Res Rev. 2016;26:53–61. [DOI] [PMC free article] [PubMed] [Google Scholar]
- 10.Mosquera C, Spaniolas K, Fitzgerald TL. Impact of frailty on surgical outcomes: The right patient for the right procedure. Surgery. 2016;160(2):272–280. [DOI] [PubMed] [Google Scholar]
- 11.Kim DH, Schneeweiss S, Glynn RJ, Lipsitz LA, Rockwood K, Avorn J. Measuring Frailty in Medicare Data: Development and Validation of a Claims-Based Frailty Index. The journals of gerontology Series A, Biological sciences and medical sciences. 2018;73(7):980–987. [DOI] [PMC free article] [PubMed] [Google Scholar]
- 12.Kim DH, Glynn RJ, Avorn J, et al. Validation of a Claims-Based Frailty Index Against Physical Performance and Adverse Health Outcomes in the Health and Retirement Study. The journals of gerontology Series A, Biological sciences and medical sciences. 2018. [DOI] [PMC free article] [PubMed] [Google Scholar]
- 13.Kim DH, Patorno E, Pawar A, Lee H, Schneeweiss S, Glynn RJ. Measuring Frailty in Administrative Claims Data: Comparative Performance of Four Claims-Based Frailty Measures in the United States Medicare Data. The journals of gerontology Series A, Biological sciences and medical sciences. 2019. [DOI] [PMC free article] [PubMed] [Google Scholar]
- 14.Scott JW, Olufajo OA, Brat GA, et al. Use of National Burden to Define Operative Emergency General Surgery. JAMA Surg. 2016;151(6):e160480. [DOI] [PubMed] [Google Scholar]
- 15.Kim DH, Schneeweiss S. Measuring frailty using claims data for pharmacoepidemiologic studies of mortality in older adults: evidence and recommendations. Pharmacoepidemiol Drug Saf. 2014;23(9):891–901. [DOI] [PMC free article] [PubMed] [Google Scholar]
- 16.Deyo RA, Cherkin DC, Ciol MA. Adapting a clinical comorbidity index for use with ICD-9-CM administrative databases. Journal of clinical epidemiology. 1992;45(6):613–619. [DOI] [PubMed] [Google Scholar]
- 17.Greene SJ, O’Brien EC, Mentz RJ, et al. Home-Time After Discharge Among Patients Hospitalized With Heart Failure. Journal of the American College of Cardiology. 2018;71(23):2643–2652. [DOI] [PMC free article] [PubMed] [Google Scholar]
- 18.Xian Y, Wu J, O’Brien EC, et al. Real world effectiveness of warfarin among ischemic stroke patients with atrial fibrillation: observational analysis from Patient-Centered Research into Outcomes Stroke Patients Prefer and Effectiveness Research (PROSPER) study. BMJ : British Medical Journal. 2015;351:h3786. [DOI] [PMC free article] [PubMed] [Google Scholar]
- 19.Jerath A, Austin PC, Wijeysundera DN. Days Alive and Out of Hospital: Validation of a Patient-centered Outcome for Perioperative Medicine. Anesthesiology. 2019;131(1):84–93. [DOI] [PubMed] [Google Scholar]
- 20.Lee H, Shi SM, Kim DH. Home Time as a Patient-Centered Outcome in Administrative Claims Data. J Am Geriatr Soc. 2019;67(2):347–351. [DOI] [PMC free article] [PubMed] [Google Scholar]
- 21.Maxwell CA, Mion LC, Mukherjee K, et al. Preinjury physical frailty and cognitive impairment among geriatric trauma patients determine postinjury functional recovery and survival. J Trauma Acute Care Surg. 2016;80(2):195–203. [DOI] [PubMed] [Google Scholar]
- 22.Sandini M, Pinotti E, Persico I, Picone D, Bellelli G, Gianotti L. Systematic review and meta-analysis of frailty as a predictor of morbidity and mortality after major abdominal surgery. BJS Open. 2017;1(5):128–137. [DOI] [PMC free article] [PubMed] [Google Scholar]
- 23.Cooper Z, Mitchell SL, Gorges RJ, Rosenthal RA, Lipsitz SR, Kelley AS. Predictors of Mortality Up to 1 Year After Emergency Major Abdominal Surgery in Older Adults. J Am Geriatr Soc. 2015;63(12):2572–2579. [DOI] [PMC free article] [PubMed] [Google Scholar]
- 24.Ernst KF, Hall DE, Schmid KK, et al. Surgical palliative care consultations over time in relationship to systemwide frailty screening. JAMA Surg. 2014;149(11):1121–1126. [DOI] [PMC free article] [PubMed] [Google Scholar]
- 25.Lilley EJ, Lee KC, Scott JW, et al. The impact of inpatient palliative care on end-of-life care among older trauma patients who die after hospital discharge. J Trauma Acute Care Surg. 2018;85(5):992–998. [DOI] [PMC free article] [PubMed] [Google Scholar]
- 26.Hua M, Li G, Clancy C, Morrison RS, Wunsch H. Validation of the V66.7 Code for Palliative Care Consultation in a Single Academic Medical Center. J Palliat Med. 2017;20(4):372–377. [DOI] [PMC free article] [PubMed] [Google Scholar]
- 27.National Consensus Project for Quality Palliative Care. Clinical Practice Guidelines for Quality Palliative Care, 4th edition. In: Richmond, VA: National Coalition for Hospice and Palliative Care; 2018: https://www.nationalcoalitionhpc.org/ncp/. [DOI] [PubMed] [Google Scholar]
- 28.Stuebe J, Rydingsward J, Lander H, et al. A Pragmatic Preoperative Prediction Score for Nonhome Discharge After Cardiac Operations. Ann Thorac Surg. 2018;105(5):1384–1391. [DOI] [PubMed] [Google Scholar]
- 29.Acher AW, Squires MH, Fields RC, et al. Can the risk of non-home discharge after resection of gastric adenocarcinoma be predicted: a seven-institution study of the US Gastric Cancer Collaborative. Journal of gastrointestinal surgery : official journal of the Society for Surgery of the Alimentary Tract. 2015;19(2):207–216. [DOI] [PubMed] [Google Scholar]
- 30.Pattakos G, Johnston DR, Houghtaling PL, Nowicki ER, Blackstone EH. Preoperative prediction of non-home discharge: a strategy to reduce resource use after cardiac surgery. Journal of the American College of Surgeons. 2012;214(2):140–147. [DOI] [PubMed] [Google Scholar]
- 31.Bryant EA, Tulebaev S, Castillo-Angeles M, et al. Frailty Identification and Care Pathway: An Interdisciplinary Approach to Care for Older Trauma Patients. Journal of the American College of Surgeons. 2019. [DOI] [PubMed] [Google Scholar]
- 32.Figueroa JF, Joynt Maddox KE, Beaulieu N, Wild RC, Jha AK. Concentration of Potentially Preventable Spending Among High-Cost Medicare Subpopulations: An Observational Study. Ann Intern Med. 2017;167(10):706–713. [DOI] [PubMed] [Google Scholar]
- 33.Joynt KE, Figueroa JF, Beaulieu N, Wild RC, Orav EJ, Jha AK. Segmenting high-cost Medicare patients into potentially actionable cohorts. Healthc (Amst). 2017;5(1–2):62–67. [DOI] [PubMed] [Google Scholar]
- 34.Gadbois EA, Tyler DA, Shield R, et al. Lost in Transition: a Qualitative Study of Patients Discharged from Hospital to Skilled Nursing Facility. Journal of general internal medicine. 2019;34(1):102–109. [DOI] [PMC free article] [PubMed] [Google Scholar]
- 35.Mor V. The Need to Realign Health System Processes for Patients Discharged From the Hospital-Getting Patients Home. JAMA internal medicine. 2019. [DOI] [PubMed] [Google Scholar]
Associated Data
This section collects any data citations, data availability statements, or supplementary materials included in this article.
Supplementary Materials
Supplementary Figure S1. Percentage of Frailty Among Older Emergency General Surgery Patients Per Year (2008–2014)