

Abstract
The purpose of this study was to define the proteome profile of fine needle aspiration (FNA) samples of malignant major salivary gland tumors (MSGT) compared to benign counterparts, and to evaluate potential clinical correlations and future applications. Patients affected by MSGT (n = 20), pleomorphic adenoma (PA) (n = 37) and Warthin’s tumor (WT) (n = 14) were enrolled. Demographic, clinical and histopathological data were registered for all patients. FNA samples were processed to obtain the protein extracts. Protein separation was obtained by two-dimensional electrophoresis (2-DE) and proteins were identified by mass spectrometry. Western blot analysis was performed to validate the 2-DE results. Statistical differences between groups were calculated by the Mann–Whitney U test for non-normal data. Spearman’s rank correlation coefficient was calculated to evaluate correlations among suggested protein biomarkers and clinical parameters. Twelve and 27 differentially expressed spots were found for MSGT versus PA and MSGT versus WT, respectively. Among these, annexin-5, cofilin-1, peptidyl-prolyl-cis–trans-isomerase-A and F-actin-capping-alpha-1 were able to differentiate MSGT from PA, WT, and healthy samples. Moreover, STRING analysis suggested cofilin-1 as a key node of protein interactions. Some of the overexpressed proteins are related to some clinical factors of our cohort, such as survival and outcome. Our results suggest potential protein biomarkers of MSGT, which could allow for more appropriate treatment plans, as well as shedding light on the molecular pathways involved.
Keywords: Major salivary glands, Proteomics, Parotid cancer, Two-dimensional electrophoresis (2-DE), Biomarkers
Introduction
Salivary gland tumors (SGTs) are rare and heterogeneous, with the World Health Organization (WHO) histological classification describing 31 subtypes, 11 benign and 20 malignant, which constitute about 0.3% of all human tumors and 1–7% of all head and neck tumors [1]. Both the rarity and heterogeneity of these salivary gland neoplasms make their diagnosis problematic.
Fine needle aspiration (FNA) cytology is widely used as a first-line technique for the diagnosis of salivary gland pathologies [2]. It is a painless, safe and simple procedure primarily used to distinguish between benign and malignant pathologies of both salivary and non-salivary tissues. Nevertheless it has not gained universal acceptance and many studies have highlighted its limitations, including a high rate of false-negative results and it has a poor accuracy in distinguishing between the various types of SGTs. For example, the primarily benign pleomorphic adenoma (PA) may be confused cytologically with either adenoid cystic carcinoma (ACC) or mucoepidermoid carcinoma (MEC) due to a considerable overlap in their morphologies [3, 4], and squamous cell carcinoma (SCC) and MEC can be misdiagnosed with the benign Warthin’s tumor (WT) due to the presence of squamous elements in each [5].
In clinical decision-making, it is important to determine whether a salivary gland swelling is due to a reactive process or a neoplasm, and whether the neoplasm is benign or malignant. Non-neoplastic lesions are managed conservatively while neoplastic are usually managed surgically, with the benign or malignant nature of the neoplasm determining the extent of surgical dissection. A more reliable diagnostic tool would help distinguish SGTs preoperatively, thus allowing a more appropriate treatment plan for such neoplasms.
In recent years, the study of molecular biomarkers has evolved across many research fields, with the proteomic analysis of a whole range of different biological fluids revealing significant differences in numerous protein concentrations between normal and affected subjects. This has opened the door to the identification of a vast array of novel prognostic, diagnostic, and therapeutic biomarkers. Relevantly, proteomic analysis has been successfully used to determine the proteomic profile of human thyroid FNA biopsies [6], and successively to identify biomarkers of thyroid cancer [7]. In a previous experiment [8] we performed a comparative proteomic analysis of the FNA fluids of the most frequent benign neoplasms of the major salivary glands, namely PA and WT, and identified a total of 26 differentially expressed proteins.
In this current paper, using a combination of two-dimensional electrophoresis (2-DE) and mass spectrometry (MS), the proteomic profiles of FNA samples of malignant SGTs (MSGT), PA and WT were compared. The identified differentially expressed proteins were validated by Western Blot (WB) analysis from both FNA samples and formalin fixed paraffin embedded (FFPE) tissue. To our knowledge, this is the first study that analyses the proteomic profile of FNA fluids of MSGT and our findings, which describe the molecular signature of MSGT in comparison to that of PA and WT, will be useful in improving the preoperative diagnosis of all SGTs.
Materials and Methods
Iodoacetamide, dithiothreitol (DTT), 3-[(3-cholamidopropyl)dimethylammonio]-1-propanesulfonate (CHAPS), urea, thiourea, glycerol, sodium dodecyl sulfate (SDS), tetramethylethylenediamine (TEMED), ammonium persulfate (APS), glycine and 30% acrylamide-N,N,N bisacrylamide were acquired from Applichem (Germany). IPGs pH 3–10 NL, IPG-buffer 3–10NL and dry stripcover fluid were purchased from GE Health Care Europe (Uppsala, Sweden). Enhanced chemiluminescence (ECL) detection system was purchased from PerkinElmer (MA, USA). Anti-cofilin-1 (CFL1), anti-annexin A1 (ANXA1), anti-annexin A5 (ANXA5), anti-peptidyl-prolyl-cis–trans isomerase A (PPIA), anti-alpha-crystallin B chain (CRYAB) and anti-superoxide dismutase 1 (SOD1) antibodies were purchased from Cell Signaling Technology, Inc. (MA, USA). Anti-F-actin-capping protein subunit alpha-1 (CAPZA-1) and -F-actin-capping protein subunit beta (CAPZ-B) antibodies were purchased from Thermo-Fisher Scientific Inc. (MA, USA). Anti-macrophage-capping protein (CAPG) antibody was acquired from Novus Biological (CO, USA) while anti-immunoglobulin heavy chain constant gamma 1 (IGHG1) antibody was purchased from Abnova (Taiwan). A donkey anti-rabbit secondary antibody horseradish peroxidase (HRP)-conjugated was purchased from Stressgen (Belgium) while a donkey anti-goat secondary antibody horseradish peroxidase (HRP)-conjugated was acquired from Santa-Cruz Biotechnology (TX, USA). All other reagents were purchased from standard commercial sources and were of the highest grade available.
Study Design
The flow-chart of this study, illustrated in Fig. 1, included three main phases: collection, discovery and validation phases. First of all collection includes FNA and FFPE samples from benign and malignant SGTs. In the second phase, applied to FNA, the samples were pooled in groups based on the diagnosis, and analyzed by 2-DE coupled with mass spectrometry. A list of proteins differentially expressed has been selected and in the last phase has been validated by WB analysis in individual patient samples. For some of these proteins validation was confirmed by WB applied to FFPE protein extracts. Finally, we examined the statistical correlation of these selected proteins with patients’ clinical features.
Fig. 1.

Overview of study design. The graphical representation of study design
Patients
Twenty consecutive patients (eight men and 12 women, average age 62.9 years old, range 26–84 years), affected by MSGT between 2010 and 2015, were included in the study. All patients were pre-operatively staged by means of an ultrasound scan with FNA cytology (FNAC), head and neck magnetic resonance imaging (MRI) with contrast media enhancement for the evaluation of the loco-regional spread of the tumor, and whole-body positron emission tomography/computed tomography with the glucose analog 2-[F]fluoro-2-deoxy-d-glucose (FDG-PET/CT) to detect potential distant metastases.
On the basis of the pre-operative staging, all patients underwent surgical resection (total parotidectomy with/without facial nerve sacrifice and in the case of submandibular malignancy, complete submandibular sialoadenectomy) associated with selective neck dissection in four cases (20%). In selected cases, presented in further detail below, patients also underwent postoperative adjuvant radiotherapy and eventual chemotherapy. Diagnostic results were obtained from pathology reports that accompanied each specimen, and were confirmed after histological examination. Staging of patients with MSGTs was determined according to the AJCC Cancer Staging Manual (7th Edition). Overall six patients showed T1N0, six patients T2N0, two patients T3N0, two patients T4aN0, two patients T3N2b, 1 patient T4bN2b and one patient T2N2c.
The most common subtypes were mucoepidermoid carcinoma and adenoid cystic carcinoma in seven (35%) and four (20%) cases, respectively. The histopathological classification was performed in accordance with the 2005 WHO classification [1]. The most affected site was the parotid gland, with 16 cases (80%). A curative resection (R0) was obtained in nine cases (45%). Multifocal lesions were found in one patient (5%), a high-grade tumor in ten (50%) and tumor-positive lymph nodes were detected in four cases (20%). According to histology, grade, and staging, ten patients (50%) underwent adjuvant radiotherapy and one patient (5%) chemoradiotherapy. After a mean follow-up of 60 ± 22.5 months, 11 patients (55%) had no evidence of disease (NED), one patient (5%) was alive with disease, six patients (30%) died of disease and one patient (5%) died without disease; only one patient was lost at follow-up. Staging of patients with MSGTs was determined according to the AJCC Cancer Staging Manual (7th Edition). Overall six patients showed T1N0, six patients T2N0, two patients T3N0, two patients T4aN0, two patients T3N2b, one patient T4bN2b and one patient T2N2c. The clinical profile is summarized in Table 1. For comparison, fine needle aspiration cytology was performed on 37 PA (17 M/20F) and 14 WT (4 M/10F) patients.
Table 1.
Demographics and clinicopathologic features of patients with MSGTs
| Gender (M/F) | 8/12 |
|---|---|
| Mean age | 62.9 (26–84) |
| Tumor subtypes | |
| Acinic cell carcinoma | 2 |
| Mucoepidermoid carcinoma | 7 |
| Adenoid cystic carcinoma | 4 |
| Myoepithelial carcinoma | 2 |
| Adenocarcinoma | 1 |
| Salivary duct carcinoma | 1 |
| Carcinoma ex pleomorphic adenoma | 1 |
| Cystadenocarcinoma | 1 |
| Epithelial-myoepithelial carcinoma | 1 |
| Tumor site | |
| Parotid gland | 16 |
| Submandibular gland | 4 |
| Grading | |
| High | 10 |
| Low | 9 |
| N/A | 1 |
| Treatment | |
| Surgery | 9 |
| Surgery and radiotherapy | 10 |
| Surgery and chemoradiotherapy | 1 |
| Follow-up | |
| No evidence of disease (NED) | 11 |
| Alive with disease (AWD) | 1 |
| Dead of disease (DOD) | 6 |
| Dead without disease (DWD) | 1 |
| N/A | 1 |
Ethics Statement
All patients gave their informed consent for proteomic studies and signed consent forms. This study was approved by the Local Ethics Committee (Comitato Etico Area Vasta Nord Ovest—CEAVNO, Azienda Ospedaliera Universitaria Pisana; Reference Number 29937).
Sample Preparation and 2-DE
Immediately after the surgical removal of the salivary gland, FNA was made on the nodule as previously described [7, 8]. Briefly, after passing the needle through the tumor tissue three or four times, 1 mL of saline solution was aspirated with the same syringe. The same procedure was performed on the adjacent healthy tissue. This fluid was immediately centrifuged at 2300×g for 10 min at 4 °C and the supernatants were stored at − 80 °C until use.
FNA proteins were precipitated using trichloroacetic acid following the protocol described by Donadio et al. [8]. Protein pellets were resuspended in a rehydration solution and protein concentrations were measured with a RC-DC Protein Assay from Bio-Rad. Samples from PA, WT and MSGT patients, as determined by histological examination, were combined to form three different pools for 2-DE analysis, respectively. Isoelectrofocusing (IEF) was carried out by using 18 cm immobiline dry-strips with a nonlinear, pH 3–10, gradient. Two-hundred micrograms of protein in 400 µL of rehydration buffer supplemented with 1.2% v/v IPG Buffer pH 3–10 NL. IEF was performed at 16 °C on an Ettan IPGphor II apparatus (GE HealthCare Europe, Uppsala, Sweden) according to the previously described protocol [9]. After IEF, the strips were equilibrated as described and SDS-PAGE was performed using the PROTEAN-II Multi Cell system (Bio-Rad, CA, USA) [9]. Gels were run in triplicate.
Staining and Image Analysis
The gels were stained with Ruthenium II tris (bathophenanthroline disulfonate) tetrasodium salt (SunaTech Inc) according to Aude-Garcia et al. [10] with minor modifications [11, 12]. Briefly, after electrophoresis, gels were fixed for 1 h in 1% phosphoric acid (v/v, starting from commercial 85% phosphoric acid) and 30% ethanol. Then gels were stained overnight with 1 μM ruthenium complex (RuBP) in 1% phosphoric acid and 30% ethanol, subsequently destained for 4–6 h in 1% phosphoric acid and 30% ethanol and then rinsed in water (one rinse, 10 min) prior to imaging. The stained gels were fluorescently visualized on a ImageQuant LAS4010 imaging system (GE-Healthcare Europe, Sweden) and the images were analyzed with SameSpot software (TotalLab, UK) as previously described [12]. The protein spots with a ≥ twofold spot quantity change, p < 0.05 and q value < 0.05, were selected and identified.
NanoLC-ESI–MS/MS Analysis by LTQ-Orbitrap Velos Analysis
Spots of interest were cut out from the reference gel and nano liquid chromatography-electrospray ionization-tandem mass spectrometry (LC–ESI–MS/MS) analysis using a LTQ-Orbitrap Velos mass spectrometer was performed as previously described [12, 13]. Peak lists were generated from raw orbitrap data using the embedded software from the instrument vendor (extract_MSN.exe). The monoisotopic masses of the selected precursor ions were corrected using an in-house written Perl script.
The peak list files were searched against the SwissProt/tremble database using Mascot (Matrix Sciences, London, UK), with human taxonomy specified. The parent ion tolerance was set to 10 ppm. The oxidation of methionine was specified in Mascot as a variable modification. Trypsin was selected as the enzyme, with one potential missed cleavage, and the normal cleavage mode was used.
The Mascot search was validated using Scaffold 4.0 (Proteome Software, Portland, OR). Only proteins matching with two different peptides, with a minimum probability score of 95% were considered to be identified hits. The reference limit to p, 0.05 for the probabilistic scores of MS/MS assignment was 45. When multiple proteins were identified in a single spot, the proteins with the highest number of peptides were considered as those corresponding to the spot.
Western Blot Analysis
For WB, all FNA samples from pathological lesions and surrounding healthy gland tissues were processed to validate the differential protein expression found with 2-DE analysis. Aliquots of each FNA sample were mixed with a SDS sample buffer (Laemmli solution) and a volume of each sample (ranging from 10 to 60 µg of proteins) was run on 12% SDS-PAGE gels, and transferred onto nitrocellulose membranes using 25 V and 1.3 A, for 7 min (TransBlot Turbo, Transfer System, Biorad). In order to normalize the optical density of immune-reactive bands, the total protein optical density was calculated. Therefore, immediately after electrophoresis, the membranes were stained with 1 µM RuBP as previously described [14]. After staining, membranes were processed according to the standard procedure. The primary antibodies anti-CFL1, -ANXA1, -ANXA5, -CAPZA-1, -CAPZB, -CAPG, -CRYAB, -PPIA, -IGHG1 and -SOD were used at a 1:1000 dilution, and the anti-CAPG antibody at 1:500. The immuno complexes were detected using a HRP-conjugated secondary antibody (donkey anti-rabbit 1:10,000, donkey anti-goat 1:5000) and the immunoblots were developed using the ECL detection system. The chemiluminescent images were visualized by the LAS4010 gel imagine system (GE HealthCare). For the comparison of protein expression levels between malignant and benign samples, the antigen-specific bands were quantified using the Image Quant-L (GE Health Care) software.
FFPE Protein Extraction
Protein extraction from FFPE parotid tissues was performed essentially as previously described [14]. Briefly, the specimens of FFPE parotid tissues of nineteen different patients, operated on in our Centre but not included in the previously described group (11 malignant tumors, five PAs and three controls), were collected from the tissue archive of the pathology section of the Department of Surgical, Medical, Molecular and Critical Area Pathology, ENT Unit, of the University of Pisa. Seven to fifteen 5 μm section pieces obtained from each patient were pooled and deparaffinized in 2–5 changes of xylene for 10 min each. The tissue was then rehydrated through a series of graded ethanol incubations (twice at 100%, once at each 85 and 70%) for 10 min each. After rehydration, the tissue was resuspended in 20 mM Tris–HCl pH 6, extraction buffer containing 2% SDS and 0.2 M glycine, sonicated three times for 10 s each and incubated at 4 °C for 1 h under agitation. The homogenates were heated at 100 °C for 20 min and successively at 60 °C for 2 h. The crude extracts were finally clarified by centrifugation at 13,000×g for 20 min at 4 °C. The protein content of the extracts was determined by the RC DC™ protein assay kit (Biorad) using albumin as standard. For WB analysis aliquots of 10 µg or 20 µg of protein were resuspended in Laemmli solution and processed for the detection of ANXA1, CFL1 and CAPZA-1 as described above.
Statistical Analysis and String Analysis
Statistical analysis to detect 2-DE spot differences (MSGT vs. PA and MSGT vs. WT) was performed using SameSpot (TotalLab, UK) software. The software included statistical analysis calculations such as ANOVA and false discovery rate, through which p and q values were calculated, respectively. Statistical analyses were performed with GraphPad Prism (San Diego, CA, USA). Statistical differences in the immunoreactive bands between groups were calculated by the Mann–Whitney U test for non-normal data using GraphPad Prism software (San Diego, CA, USA). To determine the statistical correlations among suggested protein biomarkers and clinical parameters, the Spearman’s rank correlation coefficient was calculated, which is a nonparametric measure of correlation based on data ranks, using SPSS (SPSS/PC statistical Package for the Social Science, update for 10.1.Chicago, IL: SPSS Inc., 2000).
Protein–protein interaction networks were analyzed using String software (string-db.org/). Confidence view was assigned a score of 0.4, indicating medium confidence. All data are presented as mean ± SEM and a p value < 0.05 was considered significant in all cases.
Results
Comparative Proteomic Analysis of Parotid Tumor FNA Samples
A comparative proteomic analysis was performed between MSGT, PA and WT FNA samples using 2-DE followed by nano-LC–ESI–MS/MS. A 2-DE gel image of a representative MSGT FNA sample is shown in Fig. 2. Using computational 2-DE gel image comparison, a total of 12 and 27 differentially expressed spots were found with a fold variation greater than two for MSGT versus PA and MSGT versus WT, respectively. Differentially expressed protein spots were subsequently subjected to nano-LC–ESI–MS/MS analysis and identified. A list of identified proteins and their MW, pI, score and coverage values of MS/MS, fold-change in expression levels and p values are shown in Table 2. Principal component analysis was performed by SameSpot (data not shown) and the proteins that concurred to a net separation between MSGT and the other classes, are highlighted in Table 2.
Fig. 2.
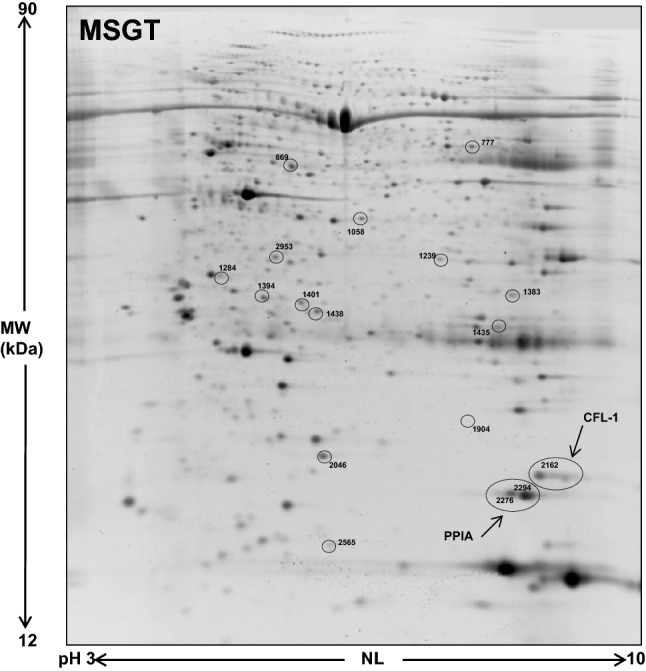
A representative 2-DE map of MSGT. Spots circled indicate all the proteins identified by nano-LC-ESI MS/MS (spot numbers are reported in Table 2)
Table 2.
Protein identification of differentially expressed proteins in FNA samples of benign and MSGTs by MS/MS
| Spot no. | Id. | Protein name | Gene name | Theoretical Mw/pI | Matched peptides | Coverage (%) | Best ion score | FV MSGT vs. WT |
FV MSGT vs. PA |
|---|---|---|---|---|---|---|---|---|---|
| 1435 | P01857 | Ig gamma-1 chain C region | IGHG1 | 36,105/8.46 | 3 | 12 | 60.4 | ↓ 4.7 | ↓ 2.1 |
| 777 | P02675 | Fibrinogen beta chain | FGB | 55,928.6/8.54 | 15 | 32 | 73.5 | ns | ↓ 2.8 |
| 869 | P49189 | 4-trimethylaminobutyraldehyde dehydrogenase | ALDH9A1 | 53,802.0/5.69 | 7 | 17 | 83.2 | ↑ 1.7 | ↑ 2.1 |
| 1239 | P04083 | Annexin A1 | ANXA1 | 38,715.9/6.57 | 16 | 41 | 92.5 | ns | ↓ 2.5 |
| 1383 | P63244 | Guanine nucleotide-binding protein subunit beta-2-like 1 | GNB2L1 | 35,077.0/7.60 | 4 | 11 | 62.2 | ns | ↑ 3.0 |
| 1394 | Q9UL46 | Proteasome activator complex subunit 2 | PSME2 | 27,402.3/5.54 | 3 | 15 | 56.1 | ↑ 2.2 | ↑ 3.2 |
| 1401 | P47756 | F-actin-capping protein subunit beta | CAPZB | 31,351.6/5.36 | 9 | 39 | 101.0 | ↑ 3.0 | ↑ 3.0 |
| 1438 | Q06323 | Proteasome activator complex subunit 1 | PSME1 | 28,723.9/5.78 | 4 | 13 | 67.6 | ↑ 1.6 | ↑ 2.3 |
| 1904 | P02511 | Alpha-crystallin B chain | CRYAB | 20,159.5/6.76 | 4 | 14 | 42.9 | ns | ↓ 6.8 |
| 2162 | P23528 | Cofilin-1 OS = Homo sapiens | CFL1 | 18,503.2/8.22 | 5 | 39 | 78.0 | ↑ 5.3 | ↑ 4.0 |
| 2565 | P06702 | Protein S100-A9 | S100A9 | 13,242.37/5.71 | 3 | 32 | 43.8 | ns | ↑ 4.8 |
| 2953 | P52907 | F-actin-capping protein subunit alpha-1 | CAPZA1 | 32,923.2/5.45 | 5 | 26 | 87.1 | ns | ↑ 2.9 |
| 2046 | P00441 | Superoxide dismutase[Cu–Zn] | SOD1 | 15,935/5.7 | 12 | 41 | 94 | ↑ 2.8 | ns |
| 1058 | P40121 | Macrophage-capping protein | CAPG | 38,498/5.82 | 7 | 20 | 58 | ↑ 3.1 | ns |
| 2276 | P62937 | Peptidyl-prolyl-cis–trans isomerase A | PPIA | 18,012.49/7.68 | 5 | 41 | 67 | ↑ 3.6 | ↑ 1.6 |
| 2294 | P62937 | Peptidyl-prolyl-cis–trans isomerase A | PPIA | 18,012.49/7.68 | 6 | 38 | 45 | ↑ 4.0 | ↑ 2.0 |
| 1284 | P08758 | Annexin 5 | ANXA5 | 35,805.58/4.93 | 5 | 35 | 101 | ↑ 3.4 | ↑ 5.0 |
Abbreviations: MW molecular weight; pI isoelectric point; ns not significant; FV fold variation; MSGT malignant salivary gland tumor; PA pleomorphic adenoma; WT Warthin’s tumor; FNA fine needle aspiration
Validation of MSGT Proteins by WB Analysis
WB analysis, using specific polyclonal antibodies, was used to validate the expression changes of some proteins identified by 2-DE. Particularly, a subset of ten candidate proteins, namely CFL1, ANXA1, ANXA5, PPIA, SOD1, CRYAB, IGHG1, CAPG, CAPZA-1 and CAPZB, were selected for validation by immunoassay. All MSGT, PA, WT and healthy counterpart tissue FNA samples were analyzed. For each tested protein, the optical density (OD) of the specific immunoreactive band was determined and normalized with the corresponding total protein content and the resulting mean values ± SEM were compared. Figure 3 shows the bar graphs obtained for the validated proteins. Table 3 reports the p-value obtained by Mann–Whitney U test from each comparison. Immunoblot analysis indicated the differential expression of ANXA5, CFL1, PPIA and CAPZA proteins in MSGT with respect to PA, WT, and healthy counterpart samples (Table 3, bold character).
Fig. 3.

The validation of CFL1, ANXA5, PPIA, CAPZA-1, ANXA1, SOD1, CRYAB, CAPZB, CAPG and IGHG1, differential expression by WB in MSGT compared to PA and WT. The bar graph shows the mean ± SEM of the normalized OD values. Ruthenium staining was used as a protein-loading control. Statistical differences between the immunoreactive bands were calculated using the Mann–Whitney U test for non-normal data (*p < 0.05, **p < 0.01 ***p < 0.001). Exact p values are summarized in Table 3
Table 3.
Statistical results of WB analysis
| Protein name | p-value | |||||
|---|---|---|---|---|---|---|
| MSGT vs H | PA vs H | WT vs H | PA vs WT | MSGT vs PA | MSGT vs WT | |
| ANXA-A1 | 0.0004 | 0.0017 | ns | 0.052 | ns | 0.0309 |
| SOD1 | 0.09 | 0.0110 | ns | 0.0005 | ns | 0.0075 |
| CFL1 | 0.0038 | ns | 0.0004 | 0.0602 | 0.0146 | 0.0001 |
| CRYAB | ns | ns | <0.0001 | 0.0032 | ns | ns |
| ANXA5 | 0.0003 | 0.004 | ns | 0.0003 | 0.0121 | <0.0001 |
| PPIA | 0.0281 | ns | ns | ns | 0.0086 | 0.0022 |
| CAPZA | <0.0001 | 0.0115 | 0.0232 | ns | 0.0005 | 0.0409 |
| CAPZB | <0.0001 | 0.0004 | <0.0001 | ns | ns | ns |
| CAPG | <0.0001 | <0.0001 | 0.0187 | 0.0312 | ns | 0.0058 |
| IGHG1 | ns | ns | 0.0028 | 0.0018 | ns | 0.0056 |
Mann–Whitney U test for non-normal data of the WB analysis obtained from different comparisons between MSGT, PA and WT groups (Fig. 3). In bold proteins that could discriminate MSGT from the benign tumor groups
Abbreviations: ns not significant; MSGT malignant salivary gland tumor; PA pleomorphic adenoma; WT Warthin’s tumor; H Healthy; ANXA1 annexin A1; SOD1 superoxide dismutase 1; CFL1 cofilin 1; CRYAB alpha-crystallin B chain; ANXA5 annexin A5; PPIA peptidyl-prolyl-cis–trans isomerase A; CAPZA-1 F-actin-capping protein subunit alpha-1; CAPZ-B F-actin-capping protein subunit beta; CAPG macrophage-capping protein; IGHG1 immunoglobulin heavy chain constant gamma 1
Moreover we evaluated if panel of proteins showed significantly difference of expression correlated to subtypes of MSGT. In particular we compared protein expression values obtained for cystic adenoid carcinoma and mucoepidermoid carcinoma., the most representative subtypes. Nonetheless, no significant difference was observed for each of the potential protein biomarkers, with this low number of samples. For the other subtypes it was not possible to extend this comparison because represented by a single sample. On the other hand a significant increase of IGHG1 and SOD expression was confirmed in WT (p < 0.05) and PA (p < 0.05), respectively, compared to MSGT samples.
Clinical Correlations
Statistical correlations were carried out calculating the Spearman’s rank correlation coefficient. All proteins validated by WB, i.e. CFL1, ANXA1, ANXA5, PPIA, SOD1, CRYAB, IGHG1, CAPG, CAPZA-1 and CAPZB were evaluated. The considered clinical parameters were: age, outcome, T and N grading. No statistically significant correlations were observed between any validated protein and any clinical parameter. However, there was a strong negative correlation trend between CFL1 and outcome, with a Spearman’s rank correlation coefficient value of − 0.866 and a p value of 0.05, with a higher CFL1 expression indicating a higher rate of survival. In addition there was a positive correlation trend (r = 0.630, p = 0.08) between CAPG and tumor grading.
WB Analysis of FFPE Tissues
With the aim of evaluating FFPE protein extracts in the validation phase of differentially expressed proteins, WB analysis of ANXA1, CAPZA1 and CFL1 was performed. The representative immunoblots are shown in Fig. 4. The apparent molecular weight of the immunoreactive bands was the same of those detected in FNA samples. Moreover, immunoblot results showed a similar expression trend for each protein in both FNA samples and FFPE tissues. Statistical analysis confirmed a significant difference (p < 0.05) between MSGT and healthy tissues for CFL1 and CAPZA1, but not for ANXA1, while no significant results were obtained between MSGT and PA.
Fig. 4.

WB analysis of CFL1, ANXA1 and CAPZA1 in protein extracts of FFPE tissue. The bar graph shows the mean ± SEM of the normalized OD values. Ruthenium staining was used as a protein-loading control. Statistical differences of the immunoreactive bands between groups were calculated using the Mann–Whitney U test for non-normal data (*p < 0.05)
STRING Analysis
To investigate the relationship between the differentially expressed proteins, protein–protein interactions were analyzed via STRING. The STRING analysis identified a main network correlating to proteins involved in cytoskeleton organization and actin filament depolymerization. The key node of the network was CFL1, which showed a different grade of association to the other proteins depending on the edge thickness. The network is shown in Fig. 5.
Fig. 5.
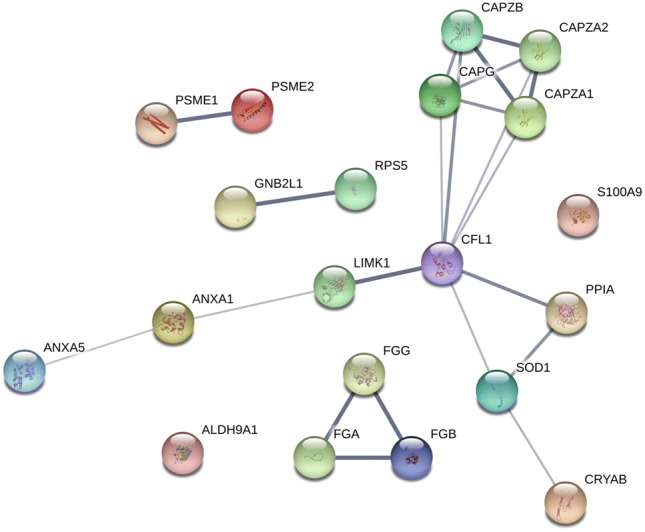
STRING analysis of differentially expressed proteins. Confidence view was assigned a score of 0.4, indicating medium confidence
Discussion
Salivary glands malignancies are a very heterogeneous group of human tumors, which therefore renders the identification of potential biomarkers a clinical challenge. Unlike other human carcinomas, for which prognostic features have been defined, the prognostic profile of salivary gland cancer is limited to staging and grading. In our previous work, we performed a proteomic analysis of FNA fluids of most the common benign salivary gland neoplasms (PA and WT) and identified a panel of potential biomarkers able to discriminate between them in order to improve their diagnosis. In addition, Mutlu et al. performed a proteomic analysis on PA tissue, which also contributed additional insight into this area [15]. However, to date, no proteomic studies have been performed in salivary gland cancer, with the identification of any potential biomarkers limited only to WB and/or immunohistochemical studies [16, 17], and salivary gland miRNA profiles only used in the prediction of the presence of a parotid gland neoplasm [18]. We therefore, performed a comparative proteomic analysis of FNA proteins obtained from salivary gland carcinoma and benign lesions. High-resolution electrophoresis, followed by a comparative analysis, allowed us to find two different proteins profiles able to differentiate malignancies from the PA and WT benign forms. The over-expressed proteins observed in MSGT compared to PA encompass immune response proteins, regulation of cytoskeleton organization and actin filament depolymerization, as highlighted by STRING analysis. Notably we found an increase in PSME1 and two subunits in MSGT, which are, two of the main components of the constitutive immunoproteasome. The immunoproteasome plays a critical role in the immune system because it degrades intracellular proteins, for example of viral origin, prior to their presentation by major histocompatibility complex class I molecules. However, the presence of the immunoproteasome in non-immune cells has been noted and recently, PSME1 overexpression was observed in both ovarian and prostate cancer [19, 20], although its role was not clearly defined. It has also been suggested that the observed increase of PSME1 in oral squamous cells could be the consequence of potential interactions between PSME and inflammatory cytokines and/or mechanisms of oxidative stress, which arise in carcinoma development and progress [21].
We feel that the most important finding of our study, however, is the overexpression of various members of the capping protein family, together with proteins involved in actin remodeling, such as CFL1 and PPIA. The actin-binding complex CapZ can bind to the barbed ends of actin filaments and its expression is associated with the dynamic assembly of actin filaments and cell motility while CAPG has been identified as an oncogene in various carcinomas [22]. Regarding CFL1, various cellular functions have been recently discussed by Kanellos and Frame [23] including the regulation of nuclear integrity and transcriptional activity, apoptosis, nuclear actin monomer transfer and lipid metabolism. In cancer cells CFL1 is described as an actin remodeling protein, which controls cell migration and invasiveness via epithelial mesenchymal transition (EMT) proteins [24]. Recently, in gastric cancer, a positive correlation between CFL1 concentration and level of cytoskeletal rearrangement was observed, with the silencing of CFL1 inhibiting EMT, invasion and metastasis [25]. Similarly, in breast cancer a role of CFL1 in promoting cell invasion has also been proposed [26, 27]. Overall CFL1 can be considered as a multifunctional protein which is involved in several signaling pathways implicated in cell proliferation, invasion and metastasis according to an equilibrium between kinases, phosphatases and other proteins which regulate its activity. Particularly, the balance between phosphorylated and non-phosphorylated CFL1 and the constant cycling between these two forms by LIM kinases and several phosphatases affects metastatic potential [24]. Our 2-DE data showed a significant increase of CFL1 expression in FNA samples in MSGT from the benign forms, which was also validated by WB analysis. The 2-DE results actually indicate the presence of two close spots that differed only in the pI value, and we suggest that the more acidic spot, which is differentially expressed in MSGT compared to healthy and PA samples, could be the phosphorylated form of CFL1, although there are a number of controversial hypothesis regarding the role of phosphorylation on CFL1 activity [28, 29]. We also identified a correlation trend between CFL1 and outcome in MSGTs, with a higher expression being a marker of a good prognosis. The role of CFL1 in the progression and prognosis of different types of cancer has been described previously [30, 31]. Moreover, CFL1 expression levels have been reported as a prognostic and drug resistance marker in non-small cell lung cancer [32]. The STRING analysis of our data indicated CFL-1 as central node with respect other differentially expressed proteins with some of them, i.e. CAPZB and PPIA, showing high confidence. Further investigations would be necessary to understand the possible role of these involved pathways in the context of MSGTs.
We also observed an intense PPIA expression in MSGT FNA samples, with limited expression in the healthy and benign samples. PPIA is a member of the peptidyl-prolyl cis–trans isomerase family, and catalyzes the cis–trans isomerization of proline imidic peptide bonds in oligopeptides, accelerating protein folding. It has also been identified as a key molecule in multiple additional biological functions, including molecular chaperoning, protein trafficking, immune modulation, and cell signaling [33, 34]. Recently, PPIA has been shown to be overexpressed in various cancers, including pancreatic adenocarcinoma [35], and squamous cell carcinoma of the tongue [36], head and neck [37], where it appears to play a pathophysiological function during tumor progression. Given the secretory nature of this cytoplasmic protein, we suppose that the observed expression increase could be due to its secretion from cancer cells into the tumor milieu. In agreement with Feng et al. in gastric cancer [38], but differently to observations in other malignant tumors [39–41], we observed no significant clinical correlations with PPIA in MSGT, possibly indicating the relevance of tumor type.
Finally, we identified ANXA5 as one of the proteins defining the biomarker panel of MSGT, which exhibited a five-fold up-regulation compared to benign FNA samples by WB analysis. There is a large body of evidence indicating the contribution of ANXA5 to tumor progression, invasion and metastasis in many types of cancers [42]. We believe ANXA5 might play a role in defining a malignant phenotype synergistically with other up-regulated proteins.
Another goal of this study was to confirm the possibility of using FFPE samples for the validation phase of potential biomarkers, thus supporting the usefulness of MSGT samples in FFPE archives [14, 43]. Indeed, the WB analysis of protein extracts from FFPE confirmed the over-expression ANXA1, CAPG and CFL1 in MSGT compared to PA and healthy counterpart tissue. These results strengthen the validity of this approach and open the possibility to use the incredible number of FFPE tissue samples as an important source in the study of rare diseases and rare cancers.
Conclusions
In conclusion we performed for the first time a proteomic analysis of MSGTs and propose a panel of potential biomarkers for salivary gland carcinoma. From this starting point, we will subsequently aim to increase both the number and homogenous nature of our sample to strengthen our current validation results and to confirm or refute our observed correlation trends. Due to the rarity of MSGTs, the samples examined in this study were scarce and to overcome this limitation we used FFPE specimens. Based on our results, we encourage the use of FFPE samples which could be vital in increasing sample availability. Finally, we aim to investigate the presence of these biomarkers in human serum and/or whole saliva in order to develop more practical translational tools in the diagnosis and prognosis of MSGT patients.
Acknowledgements
We thank Mrs Diana Elizabeth Hearn for her support in revising and translating the manuscript and Ms. Anna Giovinazzo for her great help in organizing the scientific work.
Compliance with Ethical Standards
Conflicts of interest
None of the authors have any conflicts of interest to disclose.
Ethics Approval
This study was approved by the the Local Ethics Committee (Comitato Etico Area Vasta Nord Ovest—CEAVNO, Azienda Ospedaliera Universitaria Pisana; Reference Number 29937). All procedures performed in studies involving human participants were in accordance with the 1964 Helsinki declaration and its later amendments or comparable ethical standards.
Informed Consent
Patients provided written, informed consent to participate.
Footnotes
Publisher's Note
Springer Nature remains neutral with regard to jurisdictional claims in published maps and institutional affiliations.
Veronica Seccia and Elena Navari have contributed equally to this work.
References
- 1.El-Naggar AK, Chan JKC, Grandis JR, Takata T, Slootweg PJ. WHO Classification of head and neck tumours. 4. Lyon: IARC Press; 2017. [Google Scholar]
- 2.Pfeiffer J, Ridder GJ. Diagnostic value of ultrasound-guided core needle biopsy in patients with salivary gland masses. Int J Oral Maxillofac Surg. 2012;41:437–443. doi: 10.1016/j.ijom.2011.12.005. [DOI] [PubMed] [Google Scholar]
- 3.Brennan PA, Davies B, Poller D, Meadb Z, Bayne D, Puxeddu R, et al. Fine needle aspiration cytology (FNAC) of salivary gland tumours: repeat aspiration provides further information in cases with an unclear initial cytological diagnosis. Br J Oral Maxillofac Surg. 2010;48:26–29. doi: 10.1016/j.bjoms.2008.12.014. [DOI] [PubMed] [Google Scholar]
- 4.Stewart CJ, MacKenzie K, McGarry GW, Mowat A. Fine-needle aspiration cytology of salivary gland: a review of 341 cases. Diagn Cytopathol. 2000;22:139–146. doi: 10.1002/(sici)1097-0339(20000301)22:3<139::aid-dc2>3.0.co;2-a. [DOI] [PubMed] [Google Scholar]
- 5.Yaranal PJ, Umashankar T. Squamous cell carcinoma arising in Warthin’s tumour: a case report. J Clin Diagn Res. 2013;7:163–165. doi: 10.7860/JCDR/2012/4683.2697. [DOI] [PMC free article] [PubMed] [Google Scholar]
- 6.Giusti L, Iacconi P, Ciregia F, Giannaccini G, Basolo F, Donatini GL, et al. Proteomic analysis of human thyroid fine needle aspiration fluid. J Endocrinol Invest. 2007;30:865–869. doi: 10.1007/BF03349229. [DOI] [PubMed] [Google Scholar]
- 7.Giusti L, Iacconi P, Ciregia F, Giannaccini G, Donatini GL, Baolo F, et al. Fine-needle aspiration of thyroid nodules: proteomic analysis to identify cancer biomarkers. J Proteome Res. 2008;7:4079–4088. doi: 10.1021/pr8000404. [DOI] [PubMed] [Google Scholar]
- 8.Donadio E, Giusti L, Seccia V, Ciregia F, da Valle Y, Dallan I, et al. New insight into benign tumours of major salivary glands by proteomic approach. PLoS ONE. 2013;26:e71874. doi: 10.1371/journal.pone.0071874. [DOI] [PMC free article] [PubMed] [Google Scholar]
- 9.Giusti L, Baldini C, Bazzichi L, Ciregia F, Tonazzini I, Mascia G, et al. Proteome analysis of whole saliva: a new tool for rheumatic diseases–the example of Sjögren’s syndrome. Proteomics. 2007;7:1634–1643. doi: 10.1002/pmic.200600783. [DOI] [PubMed] [Google Scholar]
- 10.Aude-Garcia C, Collin-Faure V, Luche S, Rabilloud T. Improvements and simplifications in in-gel fluorescent detection of proteins using ruthenium II tris-(bathophenanthroline disulfonate): the poor man’s fluorescent detection method. Proteomics. 2011;11:324–328. doi: 10.1002/pmic.201000370. [DOI] [PubMed] [Google Scholar]
- 11.Giusti L, Mantua V, Da Valle Y, Ciregia F, Ventroni T, Orsolini G, et al. Search for peripheral biomarkers in patients affected by acutely psychotic bipolar disorder: a proteomic approach. Mol BioSyst. 2014;10:1246–1254. doi: 10.1039/c4mb00068d. [DOI] [PubMed] [Google Scholar]
- 12.Ciregia F, Giusti L, Da Valle Y, Donadio E, Consensi A, Giacomelli C, et al. A multidisciplinary approach to study a couple of monozygotic twins discordant for the chronic fatigue syndrome: a focus on potential salivary biomarkers. J Transl Med. 2013;11:243–256. doi: 10.1186/1479-5876-11-243. [DOI] [PMC free article] [PubMed] [Google Scholar]
- 13.Giusti L, Da Valle Y, Bonotti A, Donadio E, Ciregia F, Ventroni T, et al. Comparative proteomic analysis of malignant pleural mesothelioma evidences an altered expression of nuclear lamin and filament-related proteins. Proteomics Clin Appl. 2014;8:258–268. doi: 10.1002/prca.201300052. [DOI] [PubMed] [Google Scholar]
- 14.Donadio E, Giusti L, Cetani F, Da Valle Y, Ciregia F, Giannaccini G, et al. Evaluation of formalin-fixed paraffin-embedded tissues in the proteomic analysis of parathyroid glands. Proteome Sci. 2011;9:29–38. doi: 10.1186/1477-5956-9-29. [DOI] [PMC free article] [PubMed] [Google Scholar]
- 15.Mutlu A, Ozturk M, Akpinar G, Kasap M, Kanli A. Proteomics analysis of adenoma of the human parotid gland. Eur Arch Otorhinolaryngol. 2017;274:3183–3195. doi: 10.1007/s00405-017-4608-6. [DOI] [PubMed] [Google Scholar]
- 16.Busch A, Bauer L, Wardelmann E, Rudack C, Grünewald I, Stenner M. Prognostic relevance of epithelial-mesenchymal transition and proliferation in surgically treated primary parotid gland cancer. J Clin Pathol. 2017;70:403–409. doi: 10.1136/jclinpath-2016-203745. [DOI] [PubMed] [Google Scholar]
- 17.Schneider S, Kloimstein P, Pammer J, Brannath W, Grasl MCh, Erovic BM. New diagnostic markers in salivary gland tumors. Eur Arch Otorhinolaryngol. 2014;271:1999–2007. doi: 10.1007/s00405-013-2740-5. [DOI] [PubMed] [Google Scholar]
- 18.Matse JH, Yoshizawa J, Wang X, Elashoff D, Bolscher JG, Veerman EC, et al. Human salivary micro-RNA in patients with parotid salivary gland neoplasms. PLoS ONE. 2015;10:e0142264. doi: 10.1371/journal.pone.0142264. [DOI] [PMC free article] [PubMed] [Google Scholar]
- 19.Longuespee R, Boyon C, Castellier C, Jacquet A, Desmons A, Kerdraon O, et al. The C-terminal fragment of the immunoproteasome PA28S (Reg alpha) as an early diagnosis and tumor relapse biomarker: evidence from mass spectrometry profiling. Histochem Cell Biol. 2012;138:141–154. doi: 10.1007/s00418-012-0953-0. [DOI] [PubMed] [Google Scholar]
- 20.Lemaire R, Menguellet SA, Stauber J, Marchaudon V, Lucot JP, Collinet P, et al. Specific MALDI imaging and profiling for biomarker hunting and validation: fragment of the 11S proteasome activator complex, Reg alpha fragment, is a new potential ovary cancer biomarker. J Proteome Res. 2007;6:4127–4134. doi: 10.1021/pr0702722. [DOI] [PubMed] [Google Scholar]
- 21.Feng X, Jiang Y, Xie L, Jiang L, Li J, Sun C, et al. Overexpression of proteasomal activator PA28α serves as a prognostic factor in oral squamous cell carcinoma. J Exp Clin Cancer Res. 2016;35:35–46. doi: 10.1186/s13046-016-0309-z. [DOI] [PMC free article] [PubMed] [Google Scholar]
- 22.Kim K, McCully ME, Bhattacharya N, Butler B, Sept D, Cooper JA. Structure/function analysis of the interaction of phosphatidylinositol 4,5-bisphosphate with actin-capping protein: implications for how capping protein binds the actin filament. J Biol Chem. 2007;282:5871–5879. doi: 10.1074/jbc.M609850200. [DOI] [PMC free article] [PubMed] [Google Scholar]
- 23.Kanellos G, Frame MC. Cellular functions of the ADF/cofilin family at a glance. J Cell Sci. 2016;129:3211–3218. doi: 10.1242/jcs.187849. [DOI] [PubMed] [Google Scholar]
- 24.Shishkin S, Eremina L, Pashintseva N, Kovalev L, Kovaleva M. Cofilin-1 and other ADF/cofilin superfamily members in human malignant cells. Int J Mol Sci. 2016;18:E10. doi: 10.3390/ijms18010010. [DOI] [PMC free article] [PubMed] [Google Scholar]
- 25.Wang H, Tao L, Jin F, Gu H, Dai X, Ni T, et al. Cofilin 1 induces the epithelial-mesenchymal transition of gastric cancer cells by promoting cytoskeletal rearrangement. Oncotarget. 2017;8:39131–39142. doi: 10.18632/oncotarget.16608. [DOI] [PMC free article] [PubMed] [Google Scholar]
- 26.Madak-Erdogan Z, Ventrella R, Petry L, Katzenellenbogen BS. Novel roles for ERK5 and cofilin as critical mediators linking ERα-driven transcription, actin reorganization, and invasiveness in breast cancer. Mol Cancer Res. 2014;12:714–727. doi: 10.1158/1541-7786.MCR-13-0588. [DOI] [PMC free article] [PubMed] [Google Scholar]
- 27.Liu Y, Wang Z, Huang D, Wu C, Li H, Zhang X, et al. LMO2 promotes tumor cell invasion and metastasis in basal-type breast cancer by altering actin cytoskeleton remodeling. Oncotarget. 2017;8:9513–9524. doi: 10.18632/oncotarget.13434. [DOI] [PMC free article] [PubMed] [Google Scholar]
- 28.Wang W, Mouneimne G, Sidani M, Wyckoff J, Chen X, Makris A, et al. The activity status of cofilin is directly related to invasion, intravasation, and metastasis of mammary tumors. J Cell Biol. 2006;173:395–404. doi: 10.1083/jcb.200510115. [DOI] [PMC free article] [PubMed] [Google Scholar]
- 29.Oleinik NV, Helke KL, Kistner-Griffin E, Krupenko NI, Krupenko SA. Rho GTPases RhoA and Rac1 mediate effects of dietary folate on metastatic potential of A549 cancer cells through the control of cofilin phosphorylation. J Biol Chem. 2014;289:26383–26394. doi: 10.1074/jbc.M114.569657. [DOI] [PMC free article] [PubMed] [Google Scholar]
- 30.Satoh M, Takano S, Sogawa K, Noda K, Yoshitomi H, Ishibashi M, et al. Immune-complex level of cofilin-1 in sera is associated with cancer progression and poor prognosis in pancreatic cancer. Cancer Sci. 2017;108:795–803. doi: 10.1111/cas.13181. [DOI] [PMC free article] [PubMed] [Google Scholar]
- 31.Yang ZL, Miao X, Xiong L, Zou Q, Yuan Y, Li J, et al. CFL1 and Arp3 are biomarkers for metastasis and poor prognosis of squamous cell/adenosquamous carcinomas and adenocarcinomas of gallbladder. Cancer Invest. 2013;31:132–139. doi: 10.3109/07357907.2012.756113. [DOI] [PubMed] [Google Scholar]
- 32.Castro MA, Dal-Pizzol F, Zdanov S, Soares M, Müller CB, Lopes FM, et al. CFL1 expression levels as a prognostic and drug resistance marker in nonsmall cell lung cancer. Cancer. 2010;116:3645–3655. doi: 10.1002/cncr.25125. [DOI] [PMC free article] [PubMed] [Google Scholar]
- 33.Nigro P, Pompilio G, Capogrossi MC. Cyclophilin A: a key player for human disease. Cell Death Dis. 2013;4:e888. doi: 10.1038/cddis.2013.410. [DOI] [PMC free article] [PubMed] [Google Scholar]
- 34.Obchoei S, Wongkhan S, Wongkham C, Li M, Yao Q, Chen C. Cyclophilin A: potential functions and therapeutic target for human cancer. Med Sci Monit. 2009;15:221–232. [PubMed] [Google Scholar]
- 35.Li M, Zhai Q, Bharadwaj U, Wang H, Li F, Fisher WE, et al. Cyclophilin A is overexpressed in human pancreatic cancer cells and stimulates cell proliferation through CD147. Cancer. 2006;106:2284–2294. doi: 10.1002/cncr.21862. [DOI] [PubMed] [Google Scholar]
- 36.Huang C, Sun Z, Sun Y, Chen X, Zhu X, Fan C, et al. Association of increased ligand cyclophilin A and receptor CD147 with hypoxia, angiogenesis, metastasis and prognosis of tongue squamous cell carcinoma. Histopathology. 2012;60:793–803. doi: 10.1111/j.1365-2559.2011.04130.x. [DOI] [PubMed] [Google Scholar]
- 37.Tao Y, Wang K, Chen Z, Long L, Wu Q, Cui F, et al. Correlation of five secretory proteins with the nasopharyngeal carcinoma metastasis and the clinical applications. Oncotarget. 2017;8:29383–29394. doi: 10.18632/oncotarget.14725. [DOI] [PMC free article] [PubMed] [Google Scholar]
- 38.Feng W, Xin Y, Xiao Y, Li W, Sun D. Cyclophilin A enhances cell proliferation and xenografted tumor growth of early gastric cancer. Dig Dis Sci. 2015;60:2700–2711. doi: 10.1007/s10620-015-3694-9. [DOI] [PubMed] [Google Scholar]
- 39.Li Y, Guo H, Dong D, Wu H, Li E. Expression and prognostic relevance of cyclophilin A and matrix metalloproteinase 9 in esophageal squamous cell carcinoma. Diagn Pathol. 2013;8:207–212. doi: 10.1186/1746-1596-8-207. [DOI] [PMC free article] [PubMed] [Google Scholar]
- 40.Yang J, Zhou M, Zhao R, Peng S, Luo Z, Li X, et al. Identification of candidate biomarkers for the early detection of nasopharyngeal carcinoma by quantitative proteomic analysis. J Proteomics. 2014;109:162–175. doi: 10.1016/j.jprot.2014.06.025. [DOI] [PubMed] [Google Scholar]
- 41.Cheng S, Luo M, Ding C, Peng C, Lv Z, Tong R, et al. Downregulation of Peptidylprolyl isomerase A promotes cell death and enhances doxorubicin-induced apoptosis in hepatocellular carcinoma. Gene. 2016;591:236–244. doi: 10.1016/j.gene.2016.07.020. [DOI] [PubMed] [Google Scholar]
- 42.Peng B, Guo C, Guan H, Liu S, Sun MZ. Annexin A5 as a potential marker in tumors. Clin Chim Acta. 2014;427:42–48. doi: 10.1016/j.cca.2013.09.048. [DOI] [PubMed] [Google Scholar]
- 43.Giusti L, Lucacchini A. Proteomic studies of formalin-fixed paraffin-embedded tissues. Expert Rev Proteomics. 2013;10:165–177. doi: 10.1586/epr.13.3. [DOI] [PubMed] [Google Scholar]