Abstract
A detailed assessment of smoking behavior under free-living conditions is a key challenge for health behavior research. A number of methods using wearable sensors and puff topography devices have been developed for smoking and individual puff detection. In this paper, we propose a novel algorithm for automatic detection of puffs in smoking episodes by using a combination of Respiratory Inductance Plethysmography and Inertial Measurement Unit sensors. The detection of puffs was performed by using a deep network containing convolutional and recurrent neural networks. Convolutional neural networks (CNN) were utilized to automate feature learning from raw sensor streams. Long Short Term Memory (LSTM) network layers were utilized to obtain the temporal dynamics of sensor signals and classify sequence of time segmented sensor streams. An evaluation was performed by using a large, challenging dataset containing 467 smoking events from 40 participants under free-living conditions. The proposed approach achieved an F1-score of 78% in leave-one-subject-out cross-validation. The results suggest that CNN-LSTM based neural network architecture sufficiently detect puffing episodes in free-living condition. The proposed model be used as a detection tool for smoking cessation programs and scientific research.
Keywords: Cigarette smoking, CNN, Deep learning, Puff, Respiration, PACT, IMU, LSTM
Introduction
Smoking is the world’s leading cause of preventable illness and death [1]. Each year, nearly 7 million people die from smoking-related diseases [2]. The worldwide economic cost of smoking was US$1436 billion in 2012 including direct medical care and lost productivity [3]. If the current trend continues, 8.3 million people per year by 2030 will die from diseases attributable to tobacco smoking [4]. Despite the efforts of anti-tobacco campaigns, tax increases, and comprehensive smoking cessation programs, the prevalence rate of smoking has not fallen intensely. The long-term success rate of most smoking cessation programs is still quite low (i.e., less than 10%) [5]. To improve the outcomes of smoking cessation programs, researchers need to understand not only the diverse factors (i.e., social, economic, environmental) contributing to smoking but also require a more detailed characterization of individual smoking patterns. A detailed assessment of smoking behavior may be possible by detecting each puffing episode and obtaining smoking metrics accurately in an unobstructed way under real-world conditions.
Although a variety of technologies [6–11] have been proposed for monitoring smoking behavior, researchers have more recently focused on wearable sensor systems, as they are lightweight, mobile, and unobtrusive. Wearable sensors and technologies can be grouped as smart cigarette lighters, proximity sensors, Inertial Measurement Units (IMUs), and respiration sensors.
A smart cigarette lighter can detect the lighter press and release events as a measure of frequency and total cigarette consumption [12]. However, no details such as smoking duration, or puff numbers can be extracted from this information [13].
Hand-to-mouth gestures (HMGs) of the arm during smoking have been detected using RF (Radio Frequency) proximity sensors as presented in [14]. This sensor used two battery-powered circuits. A receiver was placed on the dominant wrist, and a transmitter circuit was placed on the chest (or vice versa). However, the power of the signal depends on the orientation of the antenna and may not sense all hand gestures.
IMUs have been broadly used in wearable technologies for assessing hand/arm movements. IMU-based studies have mostly focused on the hand-to-mouth gestures associated with puffs within smoking events. Although the number of HMGs and number of puffs are not matched perfectly since of possible multiple puffs within one HMG, studies have shown that HMGs can be used as a representation for the number of puffs [14, 15].
Table 1 summarizes some of the prior studies on smoking detection using wearable sensors. In [16], the authors obtained the relative position of the arm as an estimator of smoking activity by using two IMUs that includes accelerometer, gyroscope, and magnetometer. The dataset, from 15 smokers, contains different types of activities, such as eating, drinking, and smoking. The proposed random forest model was trained with the features (speed, duration, distance, pitch, and roll) that were extracted from trajectory and position information. In 10-fold cross-validation, the HMGs were detected with an F1-score of 0.85. The model was also tested with 48 h of a free-living dataset and achieved an F1-score of 0.83.
Table 1.
Related works on smoking monitoring employing wearable sensors
| Study | Sensors | Classifier | Validation | Detection | Performance (F1-score) | Feature extraction | Participants | Study type |
|---|---|---|---|---|---|---|---|---|
| [16] | 2×9D IMU | Random forest | 10-fold | HMG, smoking | 0.85 for HMG | Handcrafted |
15 lab 4 free-living |
Lab. free-living |
| [17] | 4×3D IMU | Random forest | 5-fold | HMG, smoking |
0.70 for HMG 0.79 for smoking |
Handcrafted | 6 | Lab. |
| [18] | 6D IMU | Hierarchical | LOSO | Smoking | 0.83-0.94 | Handcrafted | 11 | Lab. |
| [15] | 4×6D IMU | SVM edge detector | NP | HMG, smoking | 0.08–0.86 for HMG | Handcrafted | 6 | Lab. |
| [19] | 6D IMU lighter | SVM | LOSO | HMG, smoking |
0.86 for HMG 0.98 for smoking 0.83 for smoking (in free-living) |
Handcrafted | 35 | Lab. free-living |
| [22] | RIP | SVM | 10-fold | Puff | 0.84 | Handcrafted | 10 | Lab. |
| [23] | 2×RIP | HMMs | LOSO | Smoking | 0.53 | Handcrafted | 20 | Lab. |
| [24] | 2×6D IMU RIP | SVM | 10-fold | HMG | 0.91 | Handcrafted | 6 | Lab. |
| This study |
6D IMU RIP |
CNN-LSTM | LOSO | HMG | 0.78 | Deep learning | 40 | Free-living |
NP not provided
In [17], four 3-axis accelerometers (at the dominant upper arm, dominant wrist, ankle, and non-dominant wrist) and a random model classifier were used to detected smoking sessions and puffs. 11,8 h of data were collected from six participants performing different activities, including drinking, reading, eating, using a computer, and a phone. A number of features (Mean, standard deviation, max, min, median, kurtosis, skewness, percentile, SNR, RMS, correlation coefficients, slope, MSE, and R-squared) were extracted from the segmented (25 s, 50% overlap) raw signal. The authors reported an F1-score of 0.7 for puff detection and F1-score of 0.79 for smoking detection in 5-fold cross-validation.
In [18], a smoking detection system using a smartwatch was presented. The evaluation involved 45 h of data from 11 smokers performing different activities such as smoking, drinking, standing, eating, walking, and talking. As features, maximum, minimum, kurtosis, and skewness were extracted from segmented accelerometer and gyroscope signals. The proposed method achieved an F1-score in the range of 0.83 to 0.94 in leave-one-subject-out (LOSO) cross-validation.
In [15], the authors utilized four 6D IMUs on the dominant arm for cigarette smoking detection. From six participants, 21 h of data were collected in a controlled laboratory setting. Standard deviation, mean, minimum, maximum, peak-to-peak, RMS, and correlations between axes were extracted over a window of 30 s. A support vector machine model reached a false positive rate between 0.07 and 0.2 for different participants.
In a recent study [19], we proposed a smoking-related HMG detection algorithm using singe IMU and an instrumented lighter. The performance of the method was evaluated on 55 h from a controlled environment and 816 h from a free-living dataset. A total of 12 features were used, including standard deviation, mean, maximum, kurtosis and correlation coefficient. The method trained a support vector machine (SVM) and achieved an F1-score of 86% for puff detection in a controlled environment and an F1-score of 85% for smoking events detection under free-living conditions.
In [20], we investigated HMG regularity as a feature for smoking event detection. The proposed method achieved F1-scores of 81% and 49% in a controlled environment and free-living conditions, respectively.
By using IMUs, some smoking metrics such as the number of cigarettes consumed over a period, the number of puffs per cigarette, and interpuff interval can be obtained. However, IMU sensors are unable to provide other potential critical metrics such as depth of inhalation, smoke holding duration, and inhalation/exhalation duration.
As wearable technology, RIP [21] measures respiration patterns from chest contractions-expansions. This measurement helps to identify characteristic breathing patterns associated with smoking in the real-life. More detailed smoking metrics can contribute to the theoretical literature on smoking behavior. However, the measurement of breathing patterns is highly sensitive to hand and body motion. Without the input of other sensor modalities, respiration signal may not provide accurate detection of puff events.
A single RIP band over the thoracic area was used in [22] to capture breathing patterns. The authors first ran a peak-valley detection algorithm to segment each respiration cycle. Then 17 distinct hand-crafted features were extracted from segmented cycles. The smoke inhalation detection model was evaluated with limited data from 10 participants over 13 individual smoking events. The proposed model reached an accuracy of 84% with SVM in a tenfold validation.
In [23], two RIP sensors (one placed on the thorax and the other on the abdomen) were utilized to capture changes in volume from the subject’s lungs. In this study, 16 features extracted from the fragmented frames (0.5-s window with 50% overlap) of the tidal volume and airflow signals (the first derivate of tidal volume) were used to train hidden Markov models (HMMs). The model was then tested with data from 20 participants, and the model reached an F1-score of 53% in LOSO validation for detection of smoking activity.
Multi-sensor approaches have been studied in an attempt to increase smoking detection accuracy. In [24], a model that used one RIP sensor (detecting deep inhalation and exhalation patterns) and two IMUs (detecting hand-to-mouth gestures) was proposed. A total of 291 puffs were collected from six daily smokers. Nineteen features from respiration signals and 12 features from IMU signals were extracted for the training of SVM. This research achieved an F1-score of 91% in tenfold cross-validation. In [25], cigarette smoke inhalations were recognized by using respiratory signals and the signal from a hand-to-mouth proximity sensor. Seventeen hand-crafted features (16 from RIP, one from the proximity sensor) were extracted to train HMMs. Using a dataset of 20 participants, the proposed method reached an F1-score of 56% in LOSO cross-validation.
In summary, all previous studies used hand-crafted features extracted from wearable sensors (IMU, RIP, and proximity) for the detection of smoking activities. However, the commonly used features such as statistics of raw signals are empirical and not smoking activity-dependent. The identification of relevant features is also time-consuming.
Recently, deep learning procedures have gained popularity in many areas [26]. Convolutional neural networks (CNNs) are a kind of deep neural network with the capability to act as feature extractors. This kind of networks can learn multiple layers of feature automatically. However, CNNs are not able to learn sequential correlations. On the other hand, Long Short Term Memory (LSTM) [27] recurrent neural networks are well suited to model temporal dynamics. The combination of CNNs and LSTMs provides a state-of-art solution for time series problems such as speech recognition and human activity detection [28, 29].
In light of the success of CNN and LSTM networks in human activity recognition, we present an algorithm for the recognition of cigarette smoking inhalations to obtain smoking behavior metrics collected under free-living conditions. To the best of our knowledge, deep learning approaches have not been used for wearable sensor-based smoking inhalation cycle detection. The proposed algorithm was evaluated with a large and challenging dataset containing 467 smoking events from 45 participants. LOSO cross-validation was performed to demonstrate the robustness of the proposed algorithm. We also investigated the impact of some hyperparameters.
Wearable system and dataset
Wearable sensors
In the study, wrist and chest modules of the Personal Automatic Cigarette Tracker v2 (PACT2.0) [30] were used. The wrist module contained a six-axial IMU interfaced with an STM32L151RD processor. The chest module contained a Respiratory Inductance Plethysmography (RIP) belt (SleepSense Inductive Plethysmography, S.L.P. Inc., St Charles, IL, USA), and an ADS1292R chip to acquire respiration signal. All sensor signals were sampled at a frequency of 100 Hz.
Portable clinical research support system (CReSSmicro™ v.2.0)
In the study, CReSSmicro™ v.2.0 smoking topography measurement device was used to obtain ground truth information. CReSSmicro™ is the portable version of the Clinical Research Support System manufactured by Plowshare Technologies, Inc. (Baltimore, MD, USA). This battery-operated hand-held device measures smoking topography metrics including puff volume, puff duration, interpuff interval, time, and date. In the study, four CReSSmicro™ devices were used with the manufacturer’s recommended default settings.
Dataset
The dataset was collected by the research group of Smoking Research Lab., at Buffalo University under free-living conditions. A total of forty smokers were recruited to the study. Participants visited the laboratory on four separate occasions, 24 h apart. At the initial visit, participants completed a series of self-reported baseline questionnaires. Participants were told the purpose of the study and instructed in the usage of the PACT2.0 and CReSSmicro™ equipment. Participants were outfitted with PACT2.0 sensor system and asked to continue smoking as usual between visits. For the two days of the experiment, participants smoked without using CReSSmicro™ device. For the other two days, they were asked to smoke through the CReSSmicro™ devices. The data from the days which the participants smoked through CReSSmicro™ device were used in the present study. This free-living dataset contained a total of 42.7 h. cigarette smoking, 497 smoking events, and 5968 smoking inhalation cycles. The dataset used in this study can be accessed at [31].
Smoking inhalation cycle detection algorithm
Network architecture
In this paper, we aimed to detect smoking inhalation cycles in a smoking event, defined as the period from lighting up a cigarette to the last smoke inhalation/exhalation cycle. Each smoking cycle can be modeled as a sequence of specific hand micro-movement and breathing pattern [15, 32]. Typically a cigarette smoking cycle starts with the raising of the hand to the mouth. It continues with holding the cigarette at the mouth, puffing, inhalation, and smoke holding. This cycle finishes with the exhalation of smoke. A downward motion of the hand from the mouth can happen before or after exhalation. In some cases, smokers hold their hand at the upper position for multiple puffs. The basic smoking cycle routine may include other dynamics such as rolling of the wrist, not holding smoke in the lungs, and multiple exhalations. The work in this study used the temporal-sequential dependency of the abstracted features micro-dynamics for smoking cycle detection, instead of hand-crafted features extracted from a specific time segment.
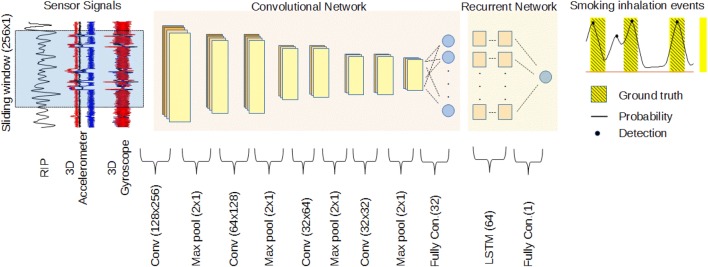
The method presented in this study has two main neural network stages. In the first stage, a CNN acted as a feature extractor. The abstracted features of the micro-dynamics that take place during fixed-size overlapping windows of raw sensor streams could be estimated by CNN layers. The second step dealt with the classification of temporal sequences as smoking inhalation cycle or not, via the LSTM network. Figure 1 shows the overall architecture of the proposed method.
Fig. 1.
Overall architecture used for smoking inhalation detection. From left to right, the windowed sensor streams of length 256 samples were processed by four convolutional layers to obtain 32 abstract features. Two LSTM layers with 64 cells and a fully connected layer yielded the probability of smoking inhalation. The number of feature maps of convolutional layers was set to 128, 64, 32 and 16, respectively. Max pooling reduced the size of input for the next layer
Preprocessing
Let, and ri with i = 1, …, N be the 6D IMU and respiration streams recorded during a smoking event, respectively. N is the length of streams defined as N = T·fs, T is duration of a smoking event in seconds, and fs is the sampling frequency of the sensors signal. A smoking event was represented by the N × 7 data matrix S which was defined as S = [ax, ay, ay, gx, gy, gz, r]. Let Z = {S1, S2, S3,…, SB} be a set of smoking events with B the number of smoking events in the dataset.
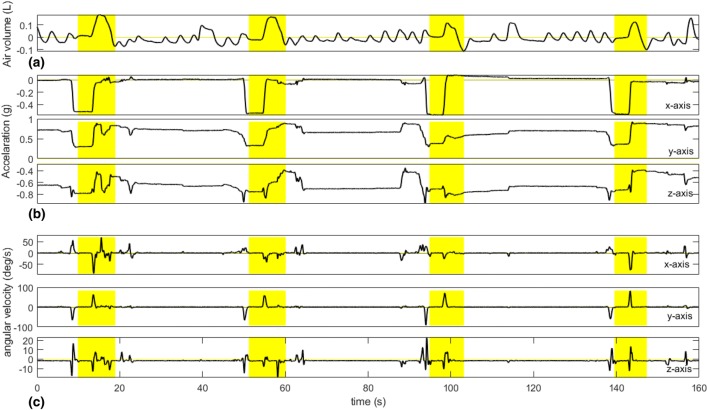
The raw IMU data were filtered by a low-pass Butterworth filter (2nd order) with the cutoff frequency of 2 Hz (empirically selected) to remove high-frequency noise. To remove the baseline component on RIP signal, wavelet-based decomposition was provided with db4 wavelet and 11 levels of decomposition. After decomposition, the approximation signal was subtracted from raw RIP signal. Finally, each column of S was normalized by subtracting the mean and dividing with its standard deviation. Figure 2 shows the characteristic sensor signals during the smoking session.
Fig. 2.
Characteristic sensor signals during a smoking session. The yellow area shows the puffing cycles. a RIP, b accelerometer, c gyroscope
Learning of abstracted features
In this step, the abstracted features of the micro-dynamics of each window of the raw data stream were estimated by a CNN. This part of the proposed model consisted of four one-dimensional convolutional layers and a fully connected layer with 32 units. Each of the convolutional layers was followed by a batch normalization layer, rectified linear units, and max-pooling operation layer with a decimation factor of two. To prevent overfitting during training, a dropout layer was used after fully connected layer with 50% dropout change. We used 128, 64, 32 and 16 filters in convolutional layers. The choice of the number of feature maps has motivated the results presented in [33]. The filter size of all convolutional layers was half of their input data size which corresponded to 1.28 s at a sampling rate of 100 Hz.
A fully connected layer was used to reduce feature dimensions before passing to the LSTM layer. At the output of the fully connected layer, a N × 7 data matrix S was transformed into a M × 32 matrix D, with M the number of overlapping signal windows. Each row of D represented the 32 abstracted features of the signal window of S. Figure 3 shows a graphical example of abstracted features for a fragment of the dataset.
Fig. 3.
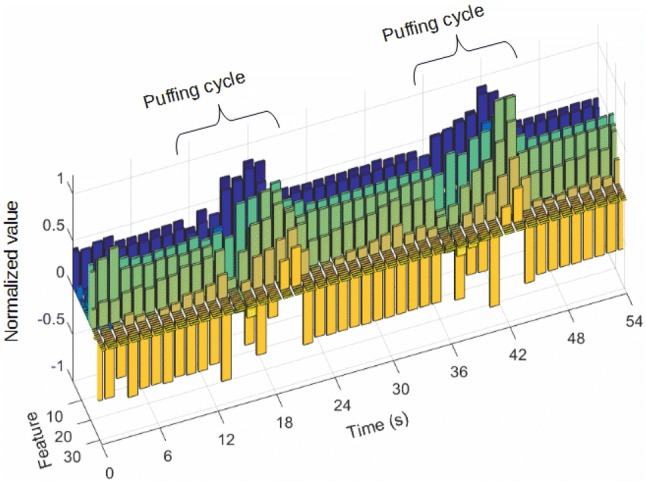
Example of abstracted features’ value for a fragment of the dataset
Modeling of temporal dynamics
An LSTM network was utilized to classify a sequence of windows as a smoking inhalation cycle. LSTM is an extended Recurrent Neural Network (RNN) with the memory cell, which can learn long-term temporal relations. The proposed recurrent network consisted of two consecutive LSTM layers with 64 hidden cells and one fully connected layer with a single neuron. The number of LSTM layers was chosen following the results in [34].
The network took as input rows of matrix D, with a sequence length of five samples and one sample step. Five samples windows length corresponded to 7.6 s. Moreover, this length approximated the average smoking inhalation cycle duration in the dataset, which was 7.2 s.
The output of the network was obtained from the fully connected layer. The output gave a probability of the input sequence as a smoking inhalation cycle. Using the LSTM network, each M × 32 distribution matrix D was transformed into the Mʹ × 1 prediction probability vector p, with M’ the number of overlapping sequences.
The network was trained from the smoking event data vector Z using a sliding window approach. The length of the window was 256 samples, with 50% overlap. Using this approach, the network was trained by segmented parts of Z, each with a size of 256 × 7, belong to smoking or non-smoking classes. In the training process, stochastic gradient descent with momentum (SGDM) optimizer was used with a learning rate of 10−3, three epochs, and a mini-batch size of 128. We investigated the impact of some hyperparameters (dropout value, learning rate, number of CNN filters, and number of abstracted features) on the model’s overall performance.
Post processing
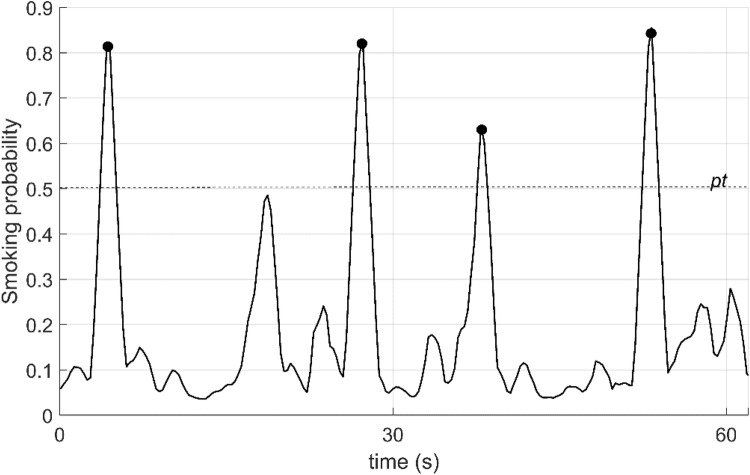
To enhance prediction performance, a moving average filter method was applied to the smoking probability vector p. The length of the filter was selected to be the same as the sequence length (five samples). Finally, a local maxima search was performed on the smoothed probability vector p’ to detect smoking inhalation cycles. The level of local maximums higher than smoking probability threshold pt was marked as smoking inhalation cycle, and moment timestamp was recorded. Figure 4 shows the sensor signals and smoothed smoking probability for a 60 s-long fragment of the dataset A. The threshold level of pt was chosen by using a Receiver Operating Curve (ROC) (Fig. 5). The optimal operating point on the ROC was selected as the threshold level (0.51).
Fig. 4.
Smoking probabilities for a 60 s-long fragment of sensor signals in the dataset. pt is threshold level. Black points show the detected puffing moments
Fig. 5.
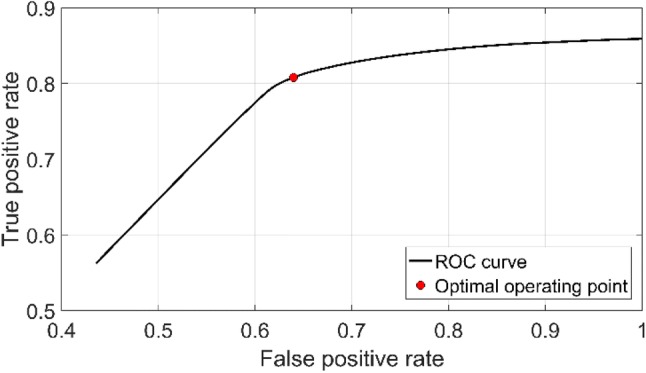
Receiver operating curve of the proposed detection method and optimal operating point
Experiment and performance measures
To perform the labeling process, as a first step, breathing segmentation was performed by using the respiration signal and running a peak-valley detection procedure to find the start and end of each respiration cycle. We used the peak-valley detection method proposed in [35, 36]. Then each breathing cycle was labeled as smoking inhalation cycle or not if it matched the puff time information obtained from CReSSmicro™ device. Finally, class labeling of each sliding windows was performed. A sliding window corresponding to any smoking inhalation cycle was labeled as a positive class.
To guarantee the person-independence of the model, LOSO cross-validation fashion was applied. In LOSO fashion, data belonging to one subject were left out from training dataset iteratively. At each iteration, the evaluation was performed on the data of the left-out subject.
The performance of the proposed method was measured by calculating the true positive (TP), false positive (FP) and false negative (FN). represented timestamps of the n detected moments in a smoking event. was the k ground truth representing smoking inhalation cycles described by their start and end timestamps. The following technique was performed for performance metrics. If a existed for any j, then the i-th detection was associated as a TP. If there was more than one detection for any j-th ground truth smoking inhalation cycle, they were counted as a single TP. If a for all j, this detection was associated as FP. Finally, a ground truth smoking inhalation cycle not associated with any detection was marked as FN. Figure 6 illustrates the metric calculation scheme.
Fig. 6.

An example of the evaluation procedure performed in the study
Results
Table 2 shows the smoking inhalation cycle detection results of the proposed algorithm as an accumulated confusion matrix over all participants and averaged performance metrics of 45 participants. Although the accuracy metric of the algorithm was presented in Table 2, it is not a suitable performance validation metric because of the true negatives were not tracked as the proposed algorithm aimed to detect smoking inhalation cycles.
Table 2.
Accumulated confusion matrix and averaged performance metrics of smoking inhalation detection algorithm
| TPS | FPS | FNS | TNS | Recall | Precision | F1-score | Accuracy |
|---|---|---|---|---|---|---|---|
| 4675 | 1289 | 1293 | N/A | 0.78 (± 0.15) | 0.78 (± 0.19) | 0.78 (± 0.16) | 0.64 (± 0.17) |
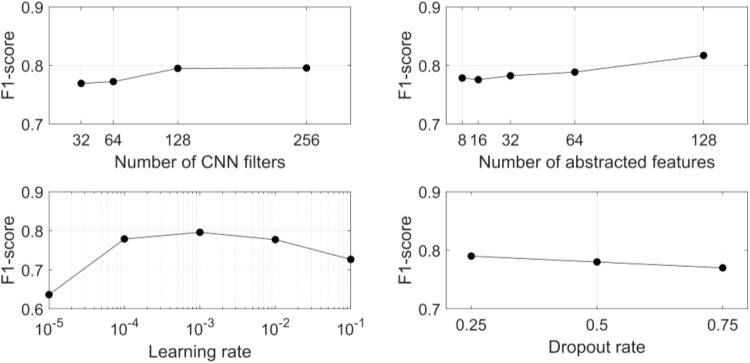
The impact of network hyperparameters (dropout value, learning rate, number of CNN filters, and number of abstracted features) on recognition performance was evaluated using a hold-out (25%) cross-validation method. The other hyperparameters were fixed (as Sect. 3.1) while a single hyperparameter was varied. Figure 7 shows the performance of the proposed network for different hyperparameters.
Fig. 7.
Classification performance (F1-score) of the proposed model as a function of four hyperparameters: number of CNN filters (top-left), number of abstracted features (top-right), learning rate (bottom-left) and dropout rate (bottom-right)
Discussion
The dataset analyzed in this study represented realistic smoking behaviors of the participants collected over multiple days. The participants reported that wearing the wrist and chest devices of PACT2.0 was not obtrusive or concerning. The results indicated that CNN-LSTM based neural network architecture was an effective tool for smoking inhalation cycle detection. The proposed approach was validated by using a large and challenging dataset to assess the performance of the method. The proposed model achieved F1-score of 78% in LOSO cross-validation.
The limitations of the current study include non-dominant hand usage, instances of multiple puffing within a single hand gesture, and use of a mouthpiece topography device to obtain ground-truth information. Non-dominant hand usage or the absence of HMGs during smoking was a possible source of false negatives. In future studies, the addition of a second wrist device would allow for the detection of smoking with the non-dominant hand. Also in the study, participants were allowed to take off the PACT wrist and chest devices when showering or bathing. Some participants may have used the system with the wrong orientation when reapplying the device or may have reattached the device too loosely. These issues would degrade the accuracy of smoking cycle detection.
Other issues need to be considered when interpreting the study. To obtain ground truth information of the dataset, participants were asked to smoke through CReSSmicro™ device. The Cress device might change the natural hand gestures or smoking-related breathing pattern of the participants, although some studies [11, 37] reported that the CReSSmicro™ did not alter the manner in which cigarettes were smoked. Other studies [38, 39], however, showed the use of this device altered the smoking behavior. The effect of using a mouthpiece topography device on smoking-related hand gestures has not been investigated. Given the possibility of behavior changes as a consequence of the portable puff device, the performance of the proposed model may be different under natural smoking conditions.
In the free-living environment, the detection of smoking episodes is still an open issue. Once the smoking episodes are detected, the proposed model could effectively identify puff cycles during a smoking event. However, this study did not offer any solution to the detection of boundaries of the smoking event. One solution might be the use of kernel smoothing methods for the predicted smoking inhalation cycles. After the prediction of smoking inhalation cycles, the kernel smoothing could be utilized to detect smoking events and their boundaries. The detail of this approach can be found in our previous work [19]. The use of a smart lighter to detect the start of smoking events might be another solution. The proposed network might also be trained for smoking event detection instead of smoking inhalation cycles. Instead of training the whole framework, only LSTM and fully connected layers could be retrained for the detection of smoking events.
The hyperparameter analysis showed that an increasing number of CNN filters slightly increased classification performance. A small increase in F1-score was observed with an increasing number of abstracted features. However, both parameters increased the model complexity and computational load. The model showed relatively stable performance for learning rate changes when the learning rate was between 10−4 and 10−2. On the other hand, there was a slight decrement in performance for a high dropout rate. Nevertheless, a low dropout rate increases overfitting risk. A limitation of the study is a fixed-size of sliding windows (256 samples). Future studies could investigate various sizes of the window for optimized performance.
Conclusions
We have described an algorithm for detecting the smoking inhalation cycles from IMU and RIP signals. To the best of our knowledge, this is the first attempt to use a CNN-LSTM network for recognition of puffing episodes. We evaluated the performance of the proposed method on a challenging dataset collected under real-world conditions. The validation process was performed with person-independent cross-validation methods. The results indicate that the proposed algorithm yielded F1-score of 78%.
Funding
This research was funded by the National Institute on Drug Abuse of the National Institutes of Health under Award Number R01DA035828.
Compliance with ethical standards
Conflict of interest
The authors declare that they have no conflict of interests.
Ethical approval
The Institutional Review Board (IRB) at University at Buffalo, State University of New York approved the study.
Informed consent
Informed consent was obtained from all individual participants included in the study.
Footnotes
Publisher's Note
Springer Nature remains neutral with regard to jurisdictional claims in published maps and institutional affiliations.
References
- 1.Organization WH. WHO global report on mortality attributable to tobacco. In: WHO global report on mortality attributable to tobacco; 2012.
- 2.Organization WH. WHO report on the global tobacco epidemic. In: 2017: monitoring tobacco use and prevention policies; 2017.
- 3.Goodchild M, Nargis N, d’Espaignet ET. Global economic cost of smoking-attributable diseases. Tobacco Control. 2018;27(1):58–64. doi: 10.1136/tobaccocontrol-2016-053305. [DOI] [PMC free article] [PubMed] [Google Scholar]
- 4.Mathers CD, Loncar D. Projections of global mortality and burden of disease from 2002 to 2030. PLOS Med. 2006;3(11):e442. doi: 10.1371/journal.pmed.0030442. [DOI] [PMC free article] [PubMed] [Google Scholar]
- 5.Babb S. Quitting smoking among adults—United States, 2000–2015. In: MMWR—Morbidity and mortality weekly report; 2017, 65. [DOI] [PubMed]
- 6.Shiffman S. Conceptualizing analyses of ecological momentary assessment data. Nicotine Tob Res. 2014;16(Suppl 2):S76–S87. doi: 10.1093/ntr/ntt195. [DOI] [PMC free article] [PubMed] [Google Scholar]
- 7.Kalkhoran S, Glantz SA. E-cigarettes and smoking cessation in real-world and clinical settings: a systematic review and meta-analysis. Lancet Respir Med. 2016;4(2):116–128. doi: 10.1016/S2213-2600(15)00521-4. [DOI] [PMC free article] [PubMed] [Google Scholar]
- 8.Stennett A, et al. Ecological momentary assessment of smoking behaviors in native and converted intermittent smokers. Am J Addict. 2018;27(2):131–138. doi: 10.1111/ajad.12690. [DOI] [PMC free article] [PubMed] [Google Scholar]
- 9.Spohr SA, et al. Efficacy of SMS text message interventions for smoking cessation: a meta-analysis. J Subst Abuse Treat. 2015;56:1–10. doi: 10.1016/j.jsat.2015.01.011. [DOI] [PubMed] [Google Scholar]
- 10.Odetallah AD, Agaian SS. Human visual system-based smoking event detection. In: Agaian SS, Jassim SA, Du EY, editors. SPIE defense, security, and sensing. Baltimore: International Society for Optics and Photonics; 2012. [Google Scholar]
- 11.Lee EM, et al. Smoking topography: reliability and validity in dependent smokers. Nicotine Tob Res. 2003;5(5):673–679. doi: 10.1080/1462220031000158645. [DOI] [PubMed] [Google Scholar]
- 12.Scholl PM, Kücükyildiz N, Laerhoven KV. When do you light a fire?: capturing tobacco use with situated, wearable sensors. In: Proceedings of the 2013 ACM conference on Pervasive and ubiquitous computing adjunct publication. ACM; 2013.
- 13.Ghofrani AA, Nakano T, Eltorai A. Lighter and method for monitoring smoking behavior. New York: Quitbit Inc; 2015. [Google Scholar]
- 14.Sazonov E, et al. RF hand gesture sensor for monitoring of cigarette smoking. In: 2011 fifth international conference on sensing technology (ICST), IEEE; 2011.
- 15.Raiff BR, et al. Laboratory validation of inertial body sensors to detect cigarette smoking arm movements. Electronics. 2014;3(1):87–110. doi: 10.3390/electronics3010087. [DOI] [PMC free article] [PubMed] [Google Scholar]
- 16.Parate A, et al. Risq: recognizing smoking gestures with inertial sensors on a wristband. In: Proceedings of the 12th annual international conference on Mobile systems, applications, and services, ACM; 2014. [DOI] [PMC free article] [PubMed]
- 17.Tang Q, et al. Automated detection of puffing and smoking with wrist accelerometers. In Proceedings of the 8th international conference on pervasive computing technologies for healthcare. ICST (Institute for Computer Sciences, Social-Informatics and Telecommunications Engineering); 2014.
- 18.Shoaib M, et al. A hierarchical lazy smoking detection algorithm using smartwatch sensors. In: 2016 IEEE 18th international conference on e-health networking, applications and services (Healthcom), IEEE; 2016.
- 19.Senyurek V, et al. Cigarette smoking detection with an inertial sensor and a smart lighter. Sensors. 2019;19(3):570. doi: 10.3390/s19030570. [DOI] [PMC free article] [PubMed] [Google Scholar]
- 20.Senyurek VY, et al. Smoking detection based on regularity analysis of hand to mouth gestures. Biomed Signal Process Control. 2019;51:106–112. doi: 10.1016/j.bspc.2019.01.026. [DOI] [PMC free article] [PubMed] [Google Scholar]
- 21.Cohn M, et al. The respiratory inductive plethysmograph: a new non-invasive monitor of respiration. Bulletin Europeen de Physiopathologie Respiratoire. 1982;18(4):643. [PubMed] [Google Scholar]
- 22.Ali AA, et al. mPuff: automated detection of cigarette smoking puffs from respiration measurements. In: 2012 ACM/IEEE 11th international conference on information processing in sensor networks (IPSN), IEEE; 2012.
- 23.Ramos-Garcia RI, Tiffany S, Sazonov E. Using respiratory signals for the recognition of human activities. In: 2016 38th annual international conference of the IEEE engineering in medicine and biology society (EMBC), 2016. [DOI] [PubMed]
- 24.Saleheen N, et al. puffMarker: a multi-sensor approach for pinpointing the timing of first lapse in smoking cessation. In: Proceedings of the 2015 ACM international joint conference on pervasive and ubiquitous computing, ACM; 2015. [PMC free article] [PubMed]
- 25.Ramos-Garcia RI, Sazonov E, Tiffany S. Recognizing cigarette smoke inhalations using hidden Markov models. In: 2017 39th annual international conference of the IEEE. Engineering in medicine and biology society (EMBC), IEEE; 2017. [DOI] [PubMed]
- 26.Deng L. A tutorial survey of architectures, algorithms, and applications for deep learning. APSIPA Trans Signal Inf Process. 2014;3:1–29. [Google Scholar]
- 27.Hochreiter S, Schmidhuber J. Long short-term memory. Neural Comput. 1997;9(8):1735–1780. doi: 10.1162/neco.1997.9.8.1735. [DOI] [PubMed] [Google Scholar]
- 28.Ordóñez FJ, Roggen D. Deep convolutional and LSTM recurrent neural networks for multimodal wearable activity recognition. Sensors. 2016;16(1):115. doi: 10.3390/s16010115. [DOI] [PMC free article] [PubMed] [Google Scholar]
- 29.Zhang Y, Chan W, Jaitly N. Very deep convolutional networks for end-to-end speech recognition. In: 2017 IEEE international conference on acoustics, speech and signal processing (ICASSP); 2017.
- 30.Imtiaz M, et al. Development of a multisensory wearable system for monitoring cigarette smoking behavior in free-living conditions. Electronics. 2017;6(4):104. doi: 10.3390/electronics6040104. [DOI] [PMC free article] [PubMed] [Google Scholar]
- 31.In-smoking respiration and hand gesture IMU signals. 2019; Available from: http://ieee-dataport.org/documents/smoking-respiration-and-hand-gesture-imu-signals.
- 32.Taylor DR, et al. Cigarette smoke inhalation patterns and bronchial reactivity. Thorax. 1988;43(1):65–70. doi: 10.1136/thx.43.1.65. [DOI] [PMC free article] [PubMed] [Google Scholar]
- 33.Ronao CA, Cho S-B. Human activity recognition with smartphone sensors using deep learning neural networks. Expert Syst Appl. 2016;59:235–244. [Google Scholar]
- 34.Karpathy A, Johnson J, Fei-Fei L. Visualizing and understanding recurrent networks; 2015. arXiv preprint arXiv:1506.02078.
- 35.Lopez-Meyer P, Sazonov E. Automatic breathing segmentation from wearable respiration sensors. In: 2011 fifth international conference on sensing technology (ICST), IEEE; 2011.
- 36.Rahman MM, et al. mConverse: inferring conversation episodes from respiratory measurements collected in the field. In: Proceedings of the 2nd conference on wireless health. San Diego: ACM; 2011; p. 1–10.
- 37.Shahab L, et al. The reliability and validity of self-reported puffing behavior: evidence from a cross-national study. Nicotine Tob Res. 2008;10(5):867–874. doi: 10.1080/14622200802027156. [DOI] [PubMed] [Google Scholar]
- 38.Blank MD, Disharoon S, Eissenberg T. Comparison of methods for measurement of smoking behavior: mouthpiece-based computerized devices versus direct observation. Nicotine Tob Res. 2009;11(7):896–903. doi: 10.1093/ntr/ntp083. [DOI] [PMC free article] [PubMed] [Google Scholar]
- 39.Höfer I, Nil R, Bättig K. Nicotine yield as determinant of smoke exposure indicators and puffing behavior. Pharmacol Biochem Behav. 1991;40(1):139–149. doi: 10.1016/0091-3057(91)90335-y. [DOI] [PubMed] [Google Scholar]


