Abstract
Brucella ovis infection results in genital damage and epididymitis in rams, placental inflammation and rare abortion in ewes, and neonatal mortality in lambs. However, the mechanism underlying B. ovis infection remains unclear. In the present study, we used prokaryotic transcriptome sequencing to identify the differentially expressed genes (DEGs) between wild-type B. ovis and intracellular B. ovis in RAW264.7 macrophages. Gene ontology (GO) term enrichment and Kyoto Encyclopedia of Genes and Genomes (KEGG) pathway analysis were performed, and quantitative reverse transcriptase PCR (qRT-PCR) was used to validate the top 10 upregulated and downregulated DEGs. The results showed that 212 genes were differentially expressed, including 68 upregulated and 144 downregulated genes, which were mainly enriched in 30 GO terms linked to biological process, cellular component, and molecular function. KEGG analysis showed that the DEGs were enriched in the hypoxia-inducible factor 1 (HIF-1) signaling pathway, mitogen-activated protein kinase (MAPK) signaling pathway, beta-alanine metabolism, and quorum sensing pathway. BME_RS01160, BME_RS04270, BME_RS08185, BME_RS12880, BME_RS25875, predicted_RNA865, and predicted_RNA953 were confirmed with the transcriptome sequencing data. Hence, our findings not only reveal the intracellular parasitism of B. ovis in the macrophage immune system, but also help to understand the mechanism of chronic B. ovis infection.
KEY WORDS: Brucella ovis, macrophage, immune system, intracellular, prokaryotic transcriptome sequencing
INTRODUCTION
Brucella is a type of gram-negative, non-motile aerobic bacteria without a capsule (smooth type with microcapsule). Further, it is oxidase-positive, reduces nitrates, functions as an intracellular parasite, and can survive in various domestic animals [1–3]. Brucellosis, caused by Brucella, is a chronic infectious disease in both humans and animals. The World Health Organization (WHO) divided Brucella into the following six species according to their host: Brucella melitensis (B. melitensis), Brucella abortus (B. abortus), Brucella suis (B. suis), Brucella neotomae (B. neotomae), Brucella canis (B. canis), and Brucella ovis (B. ovis). The Brucella species are commonly host-specific, but cross-species infections may occur [4–6]. The main sources of the disease are B. melitensis, B. abortus, and B. suis, of which B. melitensis is the most infectious species associated with high morbidity and serious damage. Brucellosis mainly damages the reproductive system and joints in humans and livestock, and has a serious negative impact on animal husbandry practice and human health [7–9].
A previous study demonstrated that after ovine oocytes were infected with B. ovis, the activity of cholinesterase increased, and the secretion of acetylcholine decreased significantly, which mediated an inflammatory response leading to oxidative stress and cell damage [10]. Carbonic anhydrase is an enzyme that catalyzes the hydration of carbon dioxide to bicarbonate. It is used for replenishment and biosynthesis of carboxylase, which results in a 5–10% CO2 necessity for the growth and reproduction of B. ovis [11]. Moreover, it has been reported that B. ovis is naturally rough and does not contain O-polysaccharide, and has characteristics similar to smooth Brucella [12]. In a previous study, B. ovis infection in sheep was linked to epididymitis, orchitis, and infertility. The ABC transporter and virB operon-encoded type IV secretion system were shown to affect B. ovis survival and reproduction in sheep macrophages [13]. B. ovis is naturally rough, and induces toxic effects in sheep. B. ovis only infects its preferred host, and there are no reports of B. ovis infecting humans in natural environment. Further, the lipopolysaccharide (LPS) core structure is crucial for the in vivo survival of not only B. ovis but also other naturally rough Brucella pathogenic species. Hence, the LPS core of B. ovis is considered as a potential target for vaccine development [14].
Several studies on how Brucella infection affects the host have been conducted in cells, mice, and other animals, but limited research on the mechanism of Brucella survival in the host immune system has been carried out. In this study, for the first time, we identified the DEGs of B. ovis present in the macrophage immune system, and predicted the biological functions of these DEGs, thus providing a foundation for further studies on the molecular mechanism of intracellular B. ovis survival.
MATERIALS AND METHODS
Cell Culture
The RAW264.7 macrophages cell line was a kind gift from Dr. Y Zhou (College of Animal Science, Southwest University, Chongqing, China). Cells were cultured in Dulbecco’s modified Eagle’s medium (DMEM; Life Technologies, USA) supplemented with 10% fetal bovine serum, 100 units/mL penicillin (Life Technologies, USA), and 100 μg/mL streptomycin (Life Technologies, USA) at 37 °C in 5% CO2.
Bacterial Culture and Infection
The B. ovis 25840™ strain (American Type Culture Collection (ATCC), USA) with biosafety level 2 was intended for research use only. It was not intended for any animal/human therapeutic or diagnostic purpose. B. ovis were evenly coated on a defibrillated blood plate (Hopebio, China) and cultured at 37 °C in a 5% CO2 incubator. Colony formation was observed after 48 h. RAW264.7 macrophages were seeded into 60 × 60 mm cell culture dishes at a density of 3 × 10⁶ cells per dish and incubated for 12 h. Next, sterile physiological saline was used to gently blow the cultured B. ovis off the dish. The blown bacterial solution was collected, placed in a 5 mL sterile centrifuge tube, and centrifuged at 600g for 3 min. The supernatant was discarded. Sterile saline was then added, gently blown, and mixed, followed by centrifugation. The supernatant was discarded. The bacterial pellet was resuspended in normal saline, and the number of bacteria was counted with a bacterial counter. The concentration of the bacterial solution was 3 × 10⁸ bacteria/mL. The multiplicity of infection (MOI) was 100:1. The bacterial solution was added to the cells according to the proportion and the cell medium was discarded after 2 h. Cells were then washed twice with DMEM containing 50 ng/mL gentamicin to kill any bacteria outside the cells. After washing, 3 mL of fresh complete medium was added and cells were cultured for 22 h at 37 °C in 5% CO2.
High-Quality Total RNA Preparation and Prokaryotic Transcriptome Sequencing
At 24 h post bacterial infection, the cell culture medium was discarded and cells were washed with phosphate buffered saline. Next, cells were treated with 1 ml of 0.25% trypsin-0.02% EDTA digestive solution for 2 min, following which complete medium was added to stop digestion. The cell suspension was then gently blown into and placed in a 5-mL centrifuge tube, followed by centrifugation at 500g for 3 min. The supernatant was discarded. The cell pellet was collected and frozen at − 80 °C in a refrigerator.
Total RNA was extracted (Life Technologies, USA) from the two B. ovis and intracellular B. ovis samples. The concentration and purity of total RNA were determined using the NanoDrop 2000 spectrophotometer. RNA integrity was evaluated by agarose gel electrophoresis and the RIN value was determined using the Agilent 2100 software. Total RNA required for a single database establishment was 2 μg (concentration ≥ 100 ng/μL, OD 260/280: 1.8–2.2). Unlike eukaryotes, which have a poly A tail at the 3’ mRNA end, prokaryotes cannot use oligo dT primers to pair with poly A (for A-T base pairing) to separate mRNA from total RNA. Therefore, ribosomal RNA (rRNA) was extracted for further transcription analysis. The Illumina platform was used for sequencing short sequence fragments. The enriched mRNA was a complete RNA sequence, and needed to be interrupted randomly. By adding fragmentation buffer, mRNA can be randomly broken into small segments of about 200 bp. Under the action of reverse transcriptase, first strand cDNA was synthesized using random primers and mRNA as a template, followed by second strand cDNA synthesis. dTTP was replaced with dUTP in the dNTP reagent to synthesize second strand cDNA containing A/U/C/G. The double-stranded cDNA had sticky ends, which were filled with an end repair mix to create blunt ends. An A was then added at the 3 ‘end to connect the Y-junction adaptor.
In this study, we used the Illumina HiSeq 4000 (Origingene, China) for the transcriptome sequencing of B. ovis. An Illumina PE library was constructed for 2 × 150 bp sequencing, quality control was carried out on the acquired sequencing data, and then bioinformatics was used to analyze the transcriptome sequencing data (Origingene, China).
Prokaryotic Transcriptome Sequencing Data Processing
The original sequencing data contained sequence tag connectors, low-quality segments, and sequences with high nitrogen (N) rate and short length, which subsequently affected the quality of sequence assembly. To ensure accurate follow-up analysis of biological information, we measured the original ordinal number by filtering the data to get high-quality sequencing data (clean data). After quality evaluation of the sequencing data, the sequencing reads were compared with the Rfam database, and the rRNA in the sequencing data was counted according to its annotation information. The high-quality sequencing data obtained after quality control was compared with the designated reference genome. This study species was mouse, and the reference genome from the Ensemble database, genome version GRCm38, gene annotation information was Ensemble 92, which realized the elimination of host genes.
Analysis of DEGs
This study aimed to annotate the transcripts of protein-coding genes for further analysis. All nucleotide sequences obtained by splicing were compared with NR, string, Swiss-Prot, KEGG, CARD, and CAZY databases using BLASTX to obtain corresponding annotation information. NCBI_NR (NCBI non-redundant protein library) is a comprehensive database, including protein databases, such as Swiss-Prot, Protein Information Resource, Protein Research Foundation, and Protein Data Bank. Non-redundant data and protein data were translated from CDS databases of GenBank and RefSeq. By comparing with the NR library, we assessed the similarity between the transcripts of this species and other similar species, as well as obtained information on homologous sequence function. After comparison with the database, the species category, E-value distribution, and sequence similarity were calculated. The reliability of the annotation results was reflected by species, E-values, and sequence similarity distribution.
The gene ontology (GO; http://www.geneontology.org) domains, biological process, molecular function, and cellular component were used for annotation classifications. There were many levels under these three branches. The higher the level number, the more meticulous is the function. The top three branches were regarded as level 1, followed by levels 2, 3, and 4. Using the GO classification map, we could roughly analyze the gene diversity of B. ovis.
The Clusters of Orthologous Groups of proteins (COGs; http://www.ncbi.nlm.nih.gov/COG/) database of lineal homologous clusters is based on the protein sequences of 66 completed genomes, which are classified and constructed according to their phylogenetic relationship, and compared with the COG database; they can be used for functional annotation, classification, and protein evolution analyses. Through string database comparison, the corresponding number of genes associated with COG can be obtained, and all transcripts can be classified into functional classifications based on COG numbers.
Kyoto Encyclopedia of Genes and Genomes (KEGG; http://www.genome.jp/kegg/) is a public database for deciphering the genome. It is used for systematic analysis of gene function. KEGG is a large knowledge base linking genomic and functional information, in which genomic information is mainly obtained from databases, such as NCBI, including complete and partially sequenced genome sequences, and stored in KEGG generation database, which contains more advanced functional information. The KEGG database provides graphical representations of cellular processes, such as metabolism, membrane transport, signal transmission, and cell cycle, as well as homologous conservative sub pathways. In addition, it also includes chemical substances, enzyme molecules, and enzymatic reactions. Related information is stored in the KEGG ligand database.
The abundance of transcripts reflects the gene expression level. The higher the abundance, the higher the level of gene expression. Using RNA-seq analysis, gene expression levels were calculated by comparing the number of clean reads in the reference genome region. Based on the two-terminal sequencing data, the Salmon algorithm can evaluate the expression of transcripts quickly and accurately by reducing the number of false positive detections. TPM was used for normalization of data.
For the identification of DEGs, we used | log2 fold-change | > 1 and false discovery rate (FDR) < 0.05 as the default screening criteria. Fold-change is calculated as the ratio of the difference in expression between the two samples (groups). It is obtained by multiple testing and correction of p values.
Identification and Analysis of sRNA
The prokaryotic transcriptome analysis software Rockhopper (http://CS. Wellesley. Edu/btjaden/rockhopper/) was used to predict non-coding RNA (ncRNA) transcripts using primary RNA sequencing data. Among these ncRNAs, bacterial small RNAs (small non-coding RNA; sRNA) account for a large proportion. About 50–500 nt in length, these non-protein-coding regulatory RNAs are located in the non-coding region between two protein-coding genes, or at the 5’ or 3’ non-coding regions of mRNA. These sRNAs are key modulators of mRNA stability, transcription, and translation, and increase mRNA degradation. Further, they play an important regulatory role in gene expression, growth, metabolism, stress response, pathogenicity of bacteria, and other biological processes. BLAST and public databases, such as sRNAMap, sRNATarBase, SIPHI, and Rfam, were used to identify sRNAs, and the annotated results were visualized using Venn diagram. The secondary structure of sRNA was predicted using RNAfold of the Vienna RNA package.
Most sRNAs work by pairing and combining with target genes. The function of sRNA is to enable study on the function of target genes. One sRNA may have multiple mRNA targets, and the same target gene may also be regulated by multiple sRNAs, including cis- and trans-encoded sRNAs. The mechanism of production and regulation is different, in which trans-encoded sRNA binds to the sequence near the 5’UTR of mRNA or activates gene expression. In this analysis, we used a common target gene prediction software to predict all known and new target genes of trans-coded sRNAs, and described the function of these target genes.
qRT-PCR Validation
We sorted the differentially expressed transcripts from the transcriptome sequencing data according to log2 fold-change, and selected the top 10 upregulated and downregulated transcripts for qRT-PCR validation. The primers used are listed in Table 1. Total RNA isolated for the high-throughput sequencing experiment was used to synthesize cDNA using PrimeScript™ RT reagent kit (TaKaRa, Japan), and qRT-PCR was performed with TB Green® Premix Ex Taq™ II (Tli RNaseH Plus; TaKaRa, Japan). Relative gene expression was calculated using the 2−ΔΔCt method, and 16S was used as an internal control. Three independent replicate experiments were performed.
Table 1.
qRT-PCR Validation of the Top 10 Upregulated and Downregulated DEGs
| Gene_name | Primer sequence (5′-3′) |
|---|---|
| 16S | F: ACTGGGCGTAAAGAGYTCGT |
| R: CGCATTTCACCGCTACAC | |
| BME_RS15875 | F: GTACAAACATGGCGAAGGGC |
| R: GGCCAGATCAATCAGGGCAT | |
| predict_RNA1071 | F: TAGCTCAGCGTAATCGCCAC |
| R: GCTTCTGGAAATTGCCGTCG | |
| predict_RNA1463 | F: ACCATCGCGCCAAAACTTTC |
| R: TACTGTTCGATATCGGCGGC | |
| predict_RNA1586 | F: CGCCAAAAGAGGGCTGAAAC |
| R: ATTCTTCGGGGTTGGCCATT | |
| predict_RNA1488 | F: GTGTCAGCGGTCGACAAAAG |
| R: ATCGTGCATGATCCCGGAAA | |
| predict_RNA865 | F: TCGACCTTACCGAACTTGCC |
| R: CGGCAAAAGAGAAGTCGCAG | |
| predict_RNA1580 | F: GCTCCGATCCAGCTTTCACT |
| R: CTCGATCTGGTTGCGCATTG | |
| BME_RS07390 | F: AGGTCGAAAACTGGGGTCTG |
| R: GAGCGTGTAATACGCCTTGC | |
| predict_RNA519 | F: TCTGAAGTTCGGCGAGTTCC |
| R: GAAGACGACAAGCCGCAATC | |
| predict_RNA1099 | F: CTTGCGTTTCGGTAGATGCG |
| R: GACGGTTGATGATTGCGAGC | |
| BME_RS12005 | F: GGATTTTGCGCCGATCTTCC |
| R: CCATGCAATTGTACGAGGCG | |
| BME_RS01965 | F: CCCGTTTGGAAGGCAACAAG |
| R: CAGATATCGGACTGCGGCTT | |
| BME_RS08185 | F: ATGAGGTCATCGACGCATCC |
| R: CAGGACGAAATCGACCACCA | |
| BME_RS14785 | F: ACGGAAGCGACAAAGGATGT |
| R: CGCCTCTATGGTCGGAAGAC | |
| BME_RS08160 | F: ACGTCACCATCGTCTATCGC |
| R: AAGAACGGCTTCGGCAAAAC | |
| predict_RNA1390 | F: GCGGGCCGGATGGATAATAA |
| R: CATGCGCTTAACTCGCAGAC | |
| predict_RNA953 | F: CGTCGAGTGTCTGATAGCCC |
| R: GAGTTTATCGCGCTTGGCTG | |
| BME_RS01160 | F: CACGCTTCTTGCCATGATCG |
| R: GCAATGCGGTTGTCGGTATC | |
| BME_RS12880 | F: CTGAAGGCTGGTTTGTTGCC |
| R: GCTGCAACCTTCGGATTGTC | |
| BME_RS04270 | F: CGATGTGCCGAAGCTTGATG |
| R: AGCGATAGTCAGGATTGGCG |
RESULTS
Visual Analysis of DEGs Between Wild-Type and Intracellular B. ovis
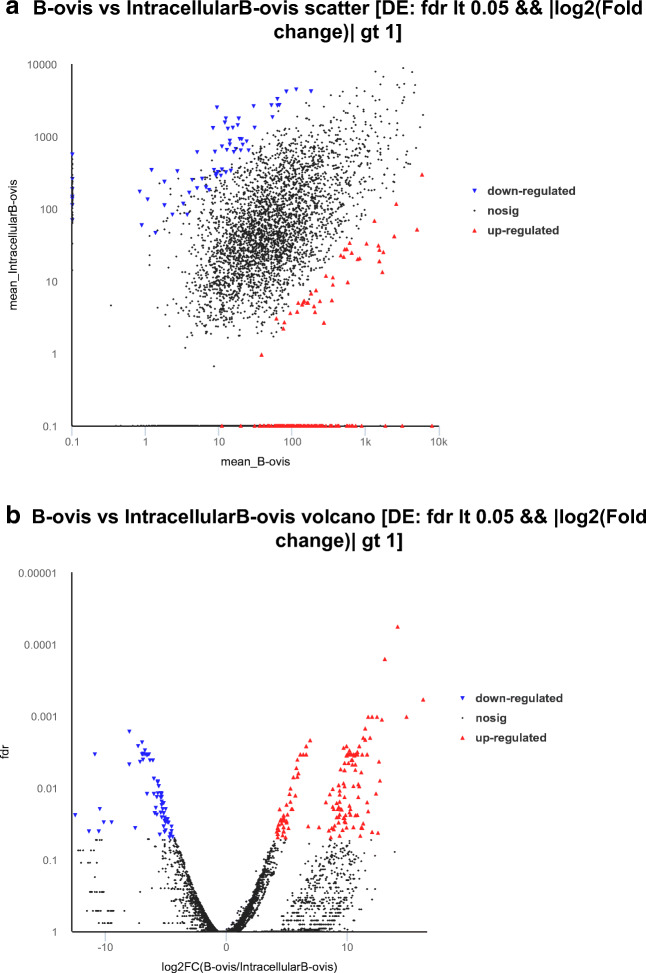
The overall distribution of DEGs was inferred by visualization of volcano and scatter plots. In the scatter diagram of DEGs with FDR < 0.05 and |log2 fold-change| > 1, the abscissa and ordinate represent the expression of genes or transcripts in B. ovis and intracellular B. ovis samples (FPKM values). The red dots indicate genes with significant upregulation, blue dots indicate genes with significant downregulation, and black dots indicate genes with no significant alteration (Fig. 1a).
Fig. 1.
Visual analysis of DEGs. a Scatter diagram of DEGs between wild-type and intracellular B. ovis. The red dots indicate genes that were significantly upregulated, blue dots indicate genes that were significantly downregulated, and black dots indicate genes that were not significantly different. b Volcano plot of DEGs between wild-type and intracellular B. ovis. The red dots represent significantly upregulated genes, blue dots represent significantly downregulated genes, and black dots represent non-significant genes.
In the volcano plot of DEGs with FDR < 0.05 and |log2 fold-change| > 1, the abscissa represents the log2 fold-change (B. ovis vs. intracellular B. ovis) and the ordinate represents the FDR value. Each dot represents a specific gene or transcript. The red dots indicate significantly upregulated genes, blue dots indicate significantly downregulated genes, and black dots represent genes with no significant alteration. The most statistically significant genes (represented by dots) were towards the top left. (Fig. 1b).
Cluster Analysis of DEGs Between Wild-Type and Intracellular B. ovis
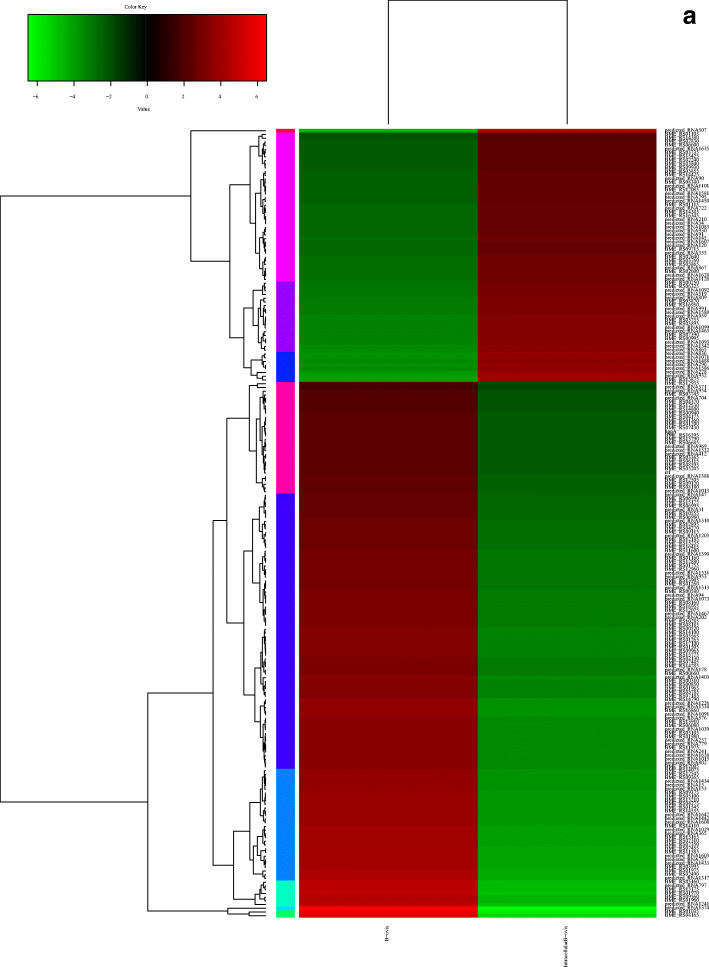
Cluster analysis was used to determine the expression patterns of different genes under different experimental conditions. The same or similar expression pattern genes were grouped together to recognize the function of unknown genes or the unknown function of known genes. They have similar functions or participate in the same metabolic process or cellular pathway. The mRNA expression patterns of DEGs were analyzed by cluster analysis, and the distance calculation algorithm was used. The samples were subjected to Spearman’s correlation coefficient, Pearson’s correlation coefficient, and hierarchical clustering (complete algorithm) analyses.
Each column in the cluster represents the wild-type and intracellular B. ovis samples. Each row represents a gene. The colors represent the size of the cluster in wild-type and intracellular B. ovis (log10 FPKM). The red color represents the upregulated genes, and green color represents the downregulated genes (Fig. 2a). In the trend line chart of differential gene module expression of each sub cluster, the abscissa represents the comparative sample of wild-type and intracellular B. ovis, and the ordinate represents the expression level of genes in wild-type and intracellular B. ovis samples. Each line represents a gene, and the blue line represents the average expression level of all genes in the sub clusters: subcluster 1, including 2 genes; subcluster 2, including 7 genes; subcluster 3, including 1 genes; subcluster 4, including 30 genes; subcluster 5, including 8 genes; subcluster 6, including 74 genes; subcluster 7, including 19 genes; subcluster 8, including 40 genes; subcluster 9, including 30 genes; and subcluster 10, including 1 gene (Fig. 2b).
Fig. 2.
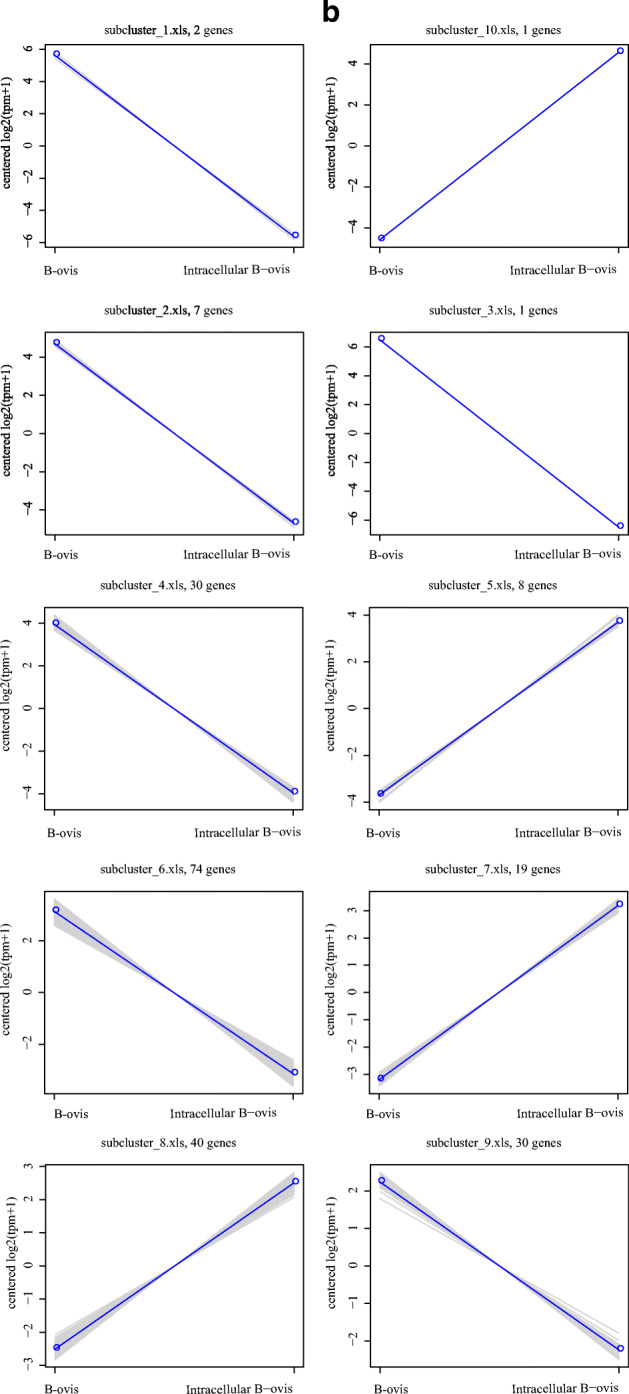
Cluster analysis of DEGs. a Cluster analysis of DEGs between wild-type and intracellular B. ovis. Red color represents the upregulated genes, and green color represents the downregulated genes. b Trend line chart of differential gene module expression. The abscissa was the comparison sample of wild-type B. ovis and intracellular B. ovis group, and the ordinate indicates the expression of genes in the wild-type and intracellular B. ovis samples.
GO and KEGG Functional Analyses of DEGs
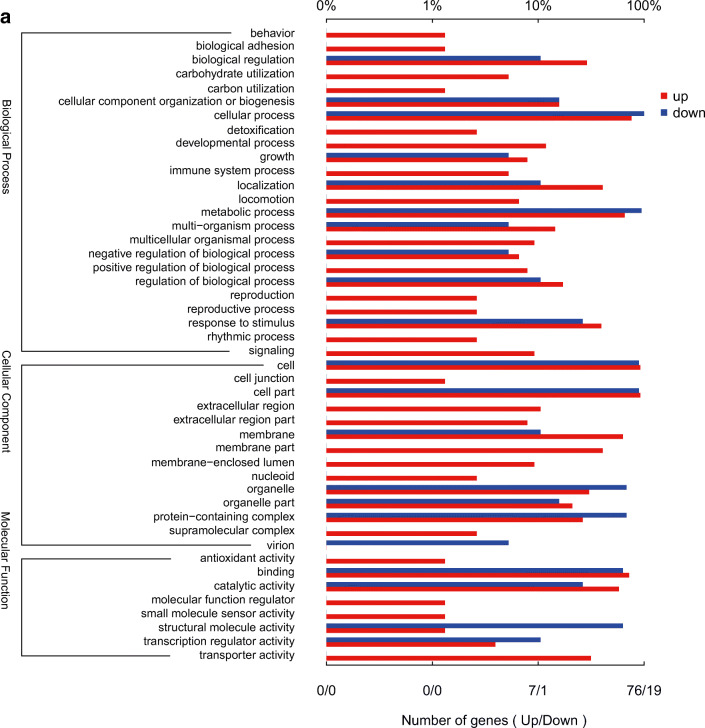
According to their GO functions, the DEGs were classified into biological process, cellular component, and molecular function. Results showed that 24 GO terms were enriched in biological process, 14 in cellular component, and 8 in molecular function (Fig. 3a).
Fig. 3.
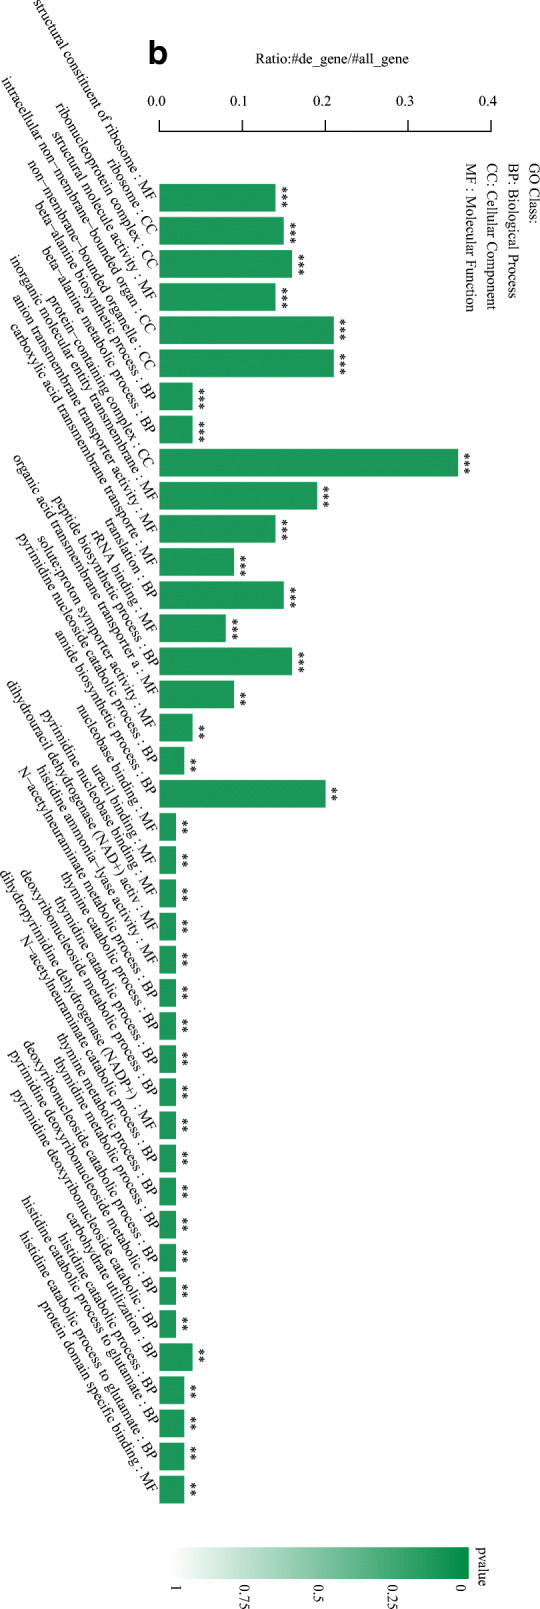
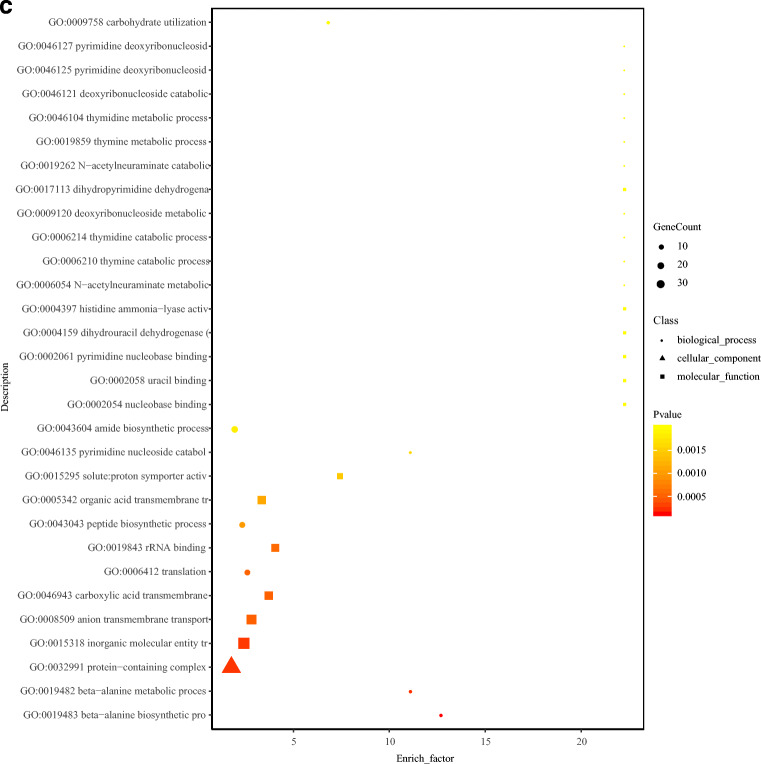
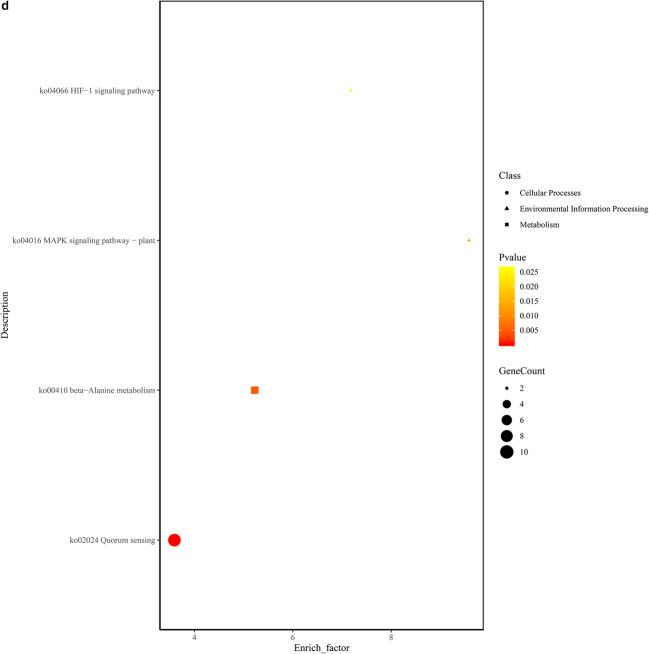
GO functional annotation of the DEGs. a Plot of GO functional annotation of upregulated and downregulated genes. The x-axis represents the number of genes (upregulated/downregulated), and the y-axis represents the GO_terms. The red column represents the upregulated genes, and blue column represents the downregulated genes. b Histogram of GO functional enrichment of DEGs. The x-axis represents the GO_terms, and the y-axis represents the enrichment ratio. c GO functional enrichment scatter plot of DEGs. The x-axis represents the rich_factor, and the y-axis represents the GO classification description. d KEGG functional enrichment analysis. The x-axis represents the enrich factor, and the y-axis represents the pathway terms. The larger the graph, the higher was the number of DEGs; the darker the color, the more significant was the enrichment of the pathway. The color gradient on the right represents the p value.
The histogram showing GO functional enrichment of DEGs directly reflects the number of DEGs enriched in the GO terms, biological process, cellular component, and molecular function. The 40 most significant GO terms were selected for the histogram. Each column represents a GO term, and the abscissa indicates the GO name and classification. A description of the GO classification is provided in the upper left corner. The height of the column corresponds to the enrichment rate (enrichment ratio = sample number/background number). The color indicates the significance of enrichment (FDR). The darker the color, the more significant was the GO term enrichment. Further, * * * indicated FDR < 0.001, * * indicated FDR < 0.01, and * indicated FDR < 0.05. The color gradient on the right indicates the FDR size (Fig. 3b).
The scatter plot shows the significantly enriched GO terms, and the ordinate indicates the GO name. A description of the GO classification is provided on the right side. The abscissa represents the enrichment ratio. The larger the graph, the higher the number of DEGs. The darker the color, the more significant was the GO term enrichment. The color gradient on the right represents the p value (Fig. 3c).
The KEGG pathway results revealed that the DEGs were significantly enriched in the biochemical metabolic pathway and signal transduction pathway. Each graph represents a KEGG pathway. The ordinate indicates the name of the KEGG pathways. A description of the KEGG classification is shown on the right, and the abscissa represents enrich_factor. The DEGs were found to be enriched in the HIF-1 signaling pathway (ko04006), MAPK signaling pathway (ko04016), beta-alanine metabolism (ko00410), and quorum sensing (ko02024) pathways (Fig. 3d).
iPath Analysis of DEGs
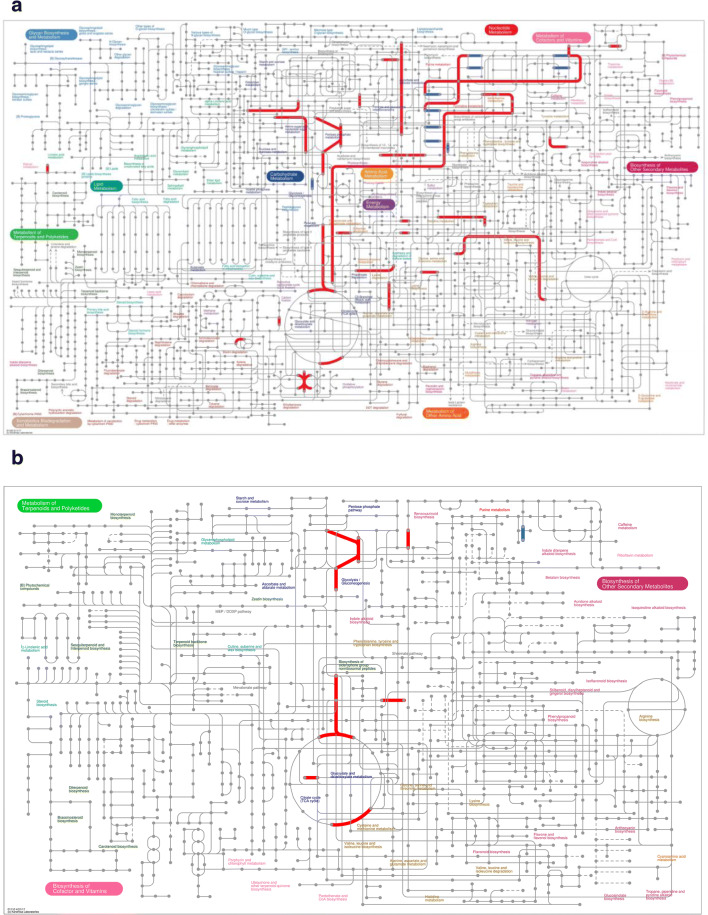
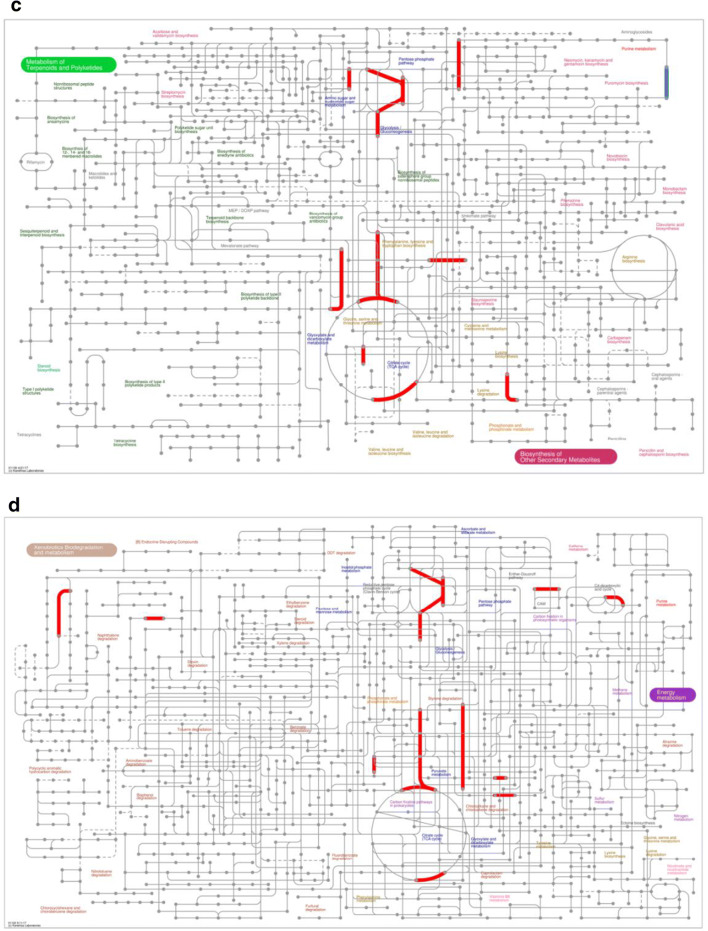
Using iPath3.0 (http://pathways.embl.de), an application for the visualization of metabolic pathways, the metabolic pathway information of the whole organism can be viewed. Here, the following metabolic information of DEGs were mapped by iPath3.0: metabolic pathways (Fig. 4a), secondary metabolite biosynthesis (Fig. 4b), multiple antibiotic synthesis (Fig. 4c), and microbial metabolic pathways in multiple environments (Fig. 4d). The red line represents the pathway affected by the upregulated genes, blue line represents the pathway affected by the downregulated genes, and green line represents the pathway affected by the upregulated and downregulated genes at the same time.
Fig. 4.
iPath analysis of DEGs. Information on (a) metabolic pathways, (b) secondary metabolite biosynthesis, (c) multiple antibiotic synthesis, and (d) microbial metabolic pathways in multiple environments of DEGs was mapped by iPath3.0. The red line represents the pathway affected by the upregulated genes, blue line represents the pathway affected by the downregulated genes, and green line represents the pathway affected by the upregulated and downregulated genes at the same time.
qRT-PCR Validation
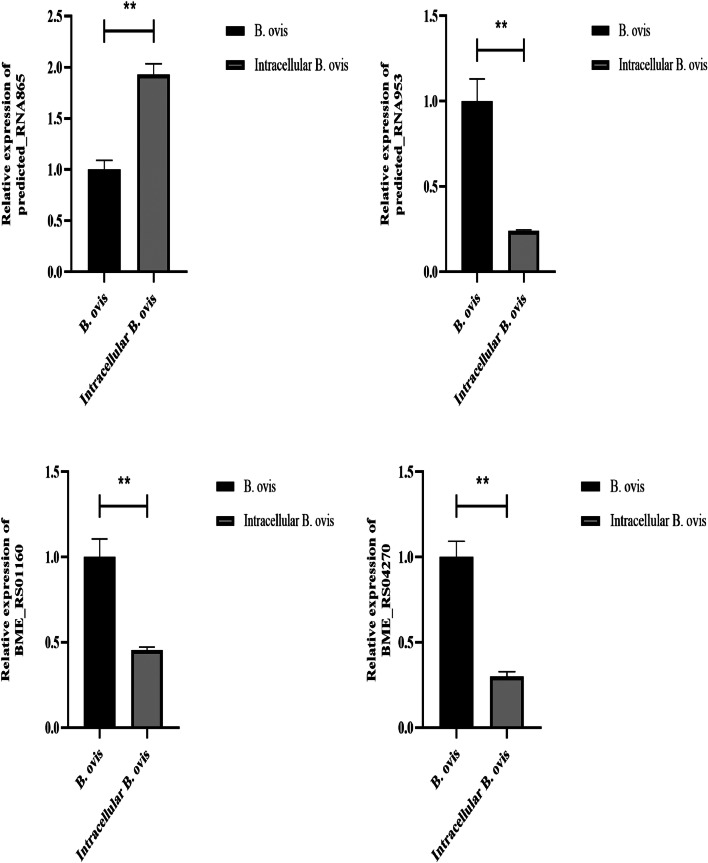
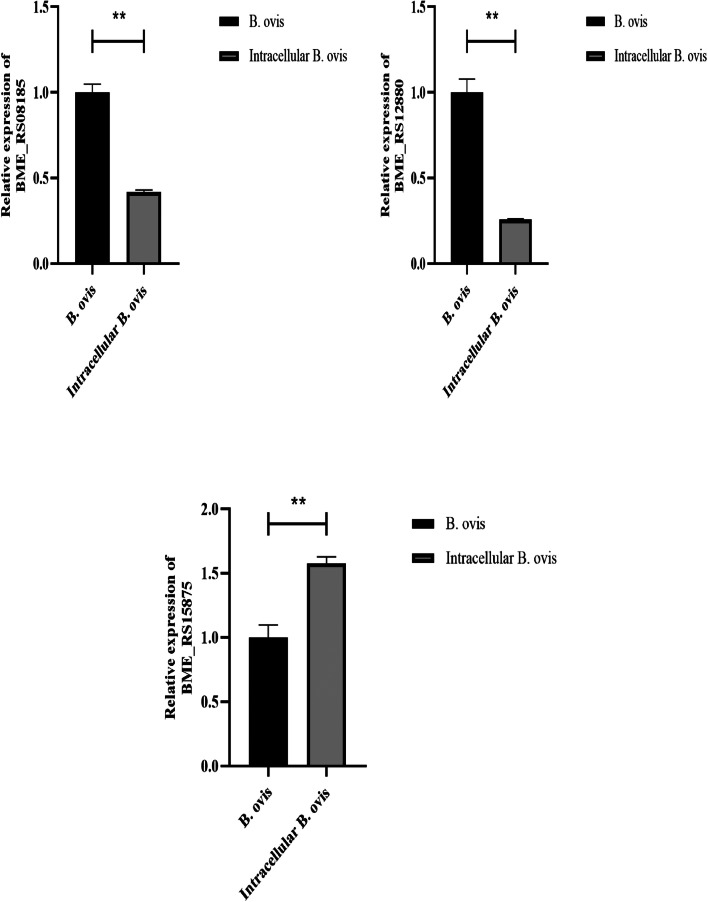
To validate the transcriptome sequencing data, we sorted the DEGs, and selected the top 10 upregulated and downregulated genes in B. ovis compared with intracellular B. ovis. qRT-PCR results showed that BME_RS01160, BME_RS04270, BME_RS08185, BME_RS12880, BME_RS25875, predicted_RNA865, and predicted_RNA953 were identified as DEGs from the sequencing data (Fig. 5).
Fig. 5.
qRT-PCR validation of the top 10 upregulated and downregulated DEGs. *p < 0.05, **p < 0.01.
DISCUSSION
Transcriptome sequencing serves as a powerful tool for genomic research. Prokaryotic mRNA sequencing is based on the Illumina HiSeq platform to sequence all mRNAs transcribed from prokaryotes during a certain period. The sequencing experiments are performed using the TruSeq RNA Sample Prep kit to construct libraries [15–17]. To facilitate analysis, release, and sharing of sequencing data, the original image data obtained by Illumina sequencing is transformed into sequence data through base calling (FASTQ format) to obtain the original sequencing data file. The FASTQ file record the base and the mass fraction of the read section [18–20]. The error rates of sequencing reads increase with the progress in sequencing due to the consumption of chemical reagents, which is a common feature of the Illumina high-throughput sequencing platform [21]. Quality control of the original sequencing data is performed as follows: removing adapter sequences from reads, removing bases containing non-AGCT at the 5′ end before shearing, trimming the ends of low-quality reads (sequencing quality value less than Q20), removing reads with N content up to 10%, and discarding small segments (length < 25 bp) after removing adapter sequences and mass pruning [22]. Using statistical methods, the quality fluctuation of reads under all sequencing cycles is statistically analyzed, which is indicative of the quality of sequencing experimental data from a macro perspective. The high-quality sequencing data obtained after quality control is then compared with the designated reference genome for subsequent analysis [23].
Macrophages and monocytes are phagocytes, which participate in non-specific (innate immunity) and specific defense responses (cellular immunity) in vertebrates. Their main function is to phagocytize (phagocytosis and digestion) cell fragments and pathogens in the form of fixed or free cells, and activate lymphocytes or other immune cells in response to pathogens. Macrophages are immune cells with diverse functions. They play important roles in phagocytosis, cellular immunity, and molecular immunology [24–26]. In the era of single-cell biology, the defense system is quite simple. Macrophages engulf and degrade foreign bodies, which are then excreted from the body as waste products. When the body is subjected to threat by viruses and heterologous proteins, the immune system is impaired. Hence, when organisms evolve to vertebrates, they form a new defense system [27–29].
The survival and replication of pathogenic Brucella in phagocytes is an important aspect for the study of brucellosis. Previously, in a model of phagocytes with B. ovis infection, the proliferation and survival of phagocytes was shown to depend on virB2 and vjbR [30]. Besides, another study showed that a mutant B. ovis strain lacking a specific ABC transporter was attenuated in mice and could not survive in macrophages, mainly due to the decrease in the abundance of virB8 and virB11 protein in type IV secretion system [31]. Furthermore, the B. ovis ΔabcAB strain was unable to survive in peritoneal macrophages, extracellular macrophages, or RAW264.7 macrophages, suggesting that ABC transporters are required for the complete virulence and survival of B. ovis [32]. Brucella establishes an intracellular replication niche in macrophages, and the immune system of macrophages uses its inherent defense mechanism to eliminate the invading bacteria. Through transcriptome analysis, it has been shown that macrophages infected with B. melitensis, B. neotomae, and B. ovis elicit a natural immune response, increase the transcription level of chemokines and defense response genes, and decrease GTPase signal transduction and cytoskeleton function, which subsequently mediate the transport of Brucella vesicles [33]. B. ovis infection has been shown to cause brucellosis in sheep, which is characterized by infertility in sheep, abortion in ewes, and increased perinatal mortality in lambs. Moreover, B. ovis infection was also shown to result in upregulation of phagocytosis-related genes and downregulation of protective host defense mechanism, which may help to explain the molecular mechanism underlying B. ovis chronic infection [34]. However, the mechanism of B. ovis infection and its persistence remain clear. The vast majority of studies focus on host changes after Brucella infection, and rarely on the survival of Brucella in the host immune system.
Here, with an aim to reveal the survival and replication mechanism of B. ovis in the macrophage immune system, RAW264.7 macrophage cells were infected with B. ovis. The total RNA of intracellular and wild-type B. ovis were then extracted and used for prokaryotic transcriptome sequencing. GO functional enrichment analysis of DEGs showed they were mainly involved in 30 GO functions. Among them, protein-containing complex (GO:0032991), inorganic molecular entity transport (GO:0015318), anion transmembrane transport (GO:0008509), carboxylic acid transmembrane (GO:0046943), and amide biosynthetic process (GO:0043604) were identified as the top 5 GO functions. KEGG pathway enrichment analysis showed that the DEGs were significantly enriched in quorum sensing (ko02024), beta-alanine metabolism (ko00410), MAPK signaling pathway (ko04016), and HIF-1 signaling pathway (ko04066).
A previous study reported that in Brucella-induced acute inflammation, the content of serum iron is reduced and the transcription of fibroblast growth factor 23 is increased by activating the HIF-1α signaling pathway [35]. Dextran sulfate sodium-induced stimulation of MAPK signaling and phosphorylation of ERK1/2 and p38α has been shown to enhance adhesion and phagocytosis of Brucella in macrophages, which may be closely related to its ability to impair the innate immune system of macrophages, thus leading to Brucella survival and chronic infection [36]. The survival of Brucella in human monocytes has been reported to be regulated by the MAPK signaling pathway, which activates inflammatory responses through TLR2 [37]. Beta-alanine is a kind of functional amino acid, which plays a key role in regulating metabolism. As an intermediate product of coenzyme A and pantothenic acid, beta-alanine affects population changes of Brucella [38–41]. Quorum sensing was speculated to play an important role in controlling the virulence of Brucella [42]. VjbR is a transcriptional regulator of the virulence gene of Brucella, and the vjbR mutant has been shown to downregulate the expression of virB operon and flagellum genes in macrophages [43]. When the microbial population reaches a certain density level, the concentration of signaling molecules reaches a threshold value. By signal transduction through related proteins, including receptor protein kinases, signals are transmitted across the cells, thus affecting the expression of specific genes and regulating the physiological characteristics of microbial populations [44–46]. Bacteria use quorum sensing for cell-to-cell communication and coordination of activities in the complex environment, which enables the entire bacterial population to survive [47–49]. As a major regulatory system of Brucella, quorum sensing may play an important role in the spatial and sequential adaptation of Brucella to host environment [50].
Compared with conventional culture of B. ovis, in this study, for the first time, we identified the DEGs in the immune system of B. ovis-challenged macrophages, and analyzed the biological functions and signaling pathways associated with them, which laid the foundation for elucidating the molecular mechanism of intracellular parasitism and persistent infection of B. ovis.
Funding Information
This study was financially supported by the National Science Foundation for Young Scientists of China (No. 31802215), the Fundamental Research Funds for the Central Universities (Nos. XDJK2020C022, XDJK2019C024), and the Chongqing Research Program of Basic Research and Frontier Technology (No. cstc2018jcyjA0807).
Compliance with Ethical Standards
Conflict of Interest
The authors declare that they have no conflict of interest.
Footnotes
Publisher’s Note
Springer Nature remains neutral with regard to jurisdictional claims in published maps and institutional affiliations.
Hanwei Jiao, Bowen Li and Zonglin Zheng contributed equally to this work.
References
- 1.Pandey A, Lin F, Cabello AL, da Costa LF, Feng X, Feng HQ, Zhang MZ, Iwawaki T, Rice-Ficht A, Ficht TA, de Figueiredo P, Qin QM. Activation of host IRE1α-dependent signaling axis contributes the intracellular parasitism of Brucella melitensis. Frontiers in Cellular and Infection Microbiology. 2018;8:103. doi: 10.3389/fcimb.2018.00103. [DOI] [PMC free article] [PubMed] [Google Scholar]
- 2.Rittig MG, Kaufmann A, Robins A, Shaw B, Sprenger H, Gemsa D, Foulongne V, Rouot B, Dornand J. Smooth and rough lipopolysaccharide phenotypes of Brucella induce different intracellular trafficking and cytokine/chemokine release in human monocytes. Journal of Leukocyte Biology. 2003;74:1045–1055. doi: 10.1189/jlb.0103015. [DOI] [PubMed] [Google Scholar]
- 3.Adams LG. The pathology of brucellosis reflects the outcome of the battle between the host genome and the Brucella genome. Veterinary Microbiology. 2002;90:553–561. doi: 10.1016/s0378-1135(02)00235-3. [DOI] [PubMed] [Google Scholar]
- 4.Li S, Liu Y, Wang Y, Chen H, Liu C, Wang Y. Lateral flow biosensor combined with loop-mediated isothermal amplification for simple, rapid, sensitive, and reliable detection of Brucella spp. Infect Drug Resist. 2019;12:2343–2353. doi: 10.2147/IDR.S211644. [DOI] [PMC free article] [PubMed] [Google Scholar]
- 5.Das A, Kumar B, Chakravarti S, Prakash C, Singh RP, Gupta V, Singh KP, Agrawal RK, Chaturvedi VK, Abhishek, Shrinet G. Rapid visual isothermal nucleic acid-based detection assay of Brucella species by polymerase spiral reaction. Journal of Applied Microbiology. 2018;125:646–654. doi: 10.1111/jam.13882. [DOI] [PubMed] [Google Scholar]
- 6.Lusk Pfefer TS, Timme R, Kase JA. Identification of Brucella genus and eight Brucella species by Luminex bead-based suspension array. Food Microbiology. 2018;70:113–119. doi: 10.1016/j.fm.2017.09.015. [DOI] [PubMed] [Google Scholar]
- 7.Abd El-Wahab EW, Hegazy YM, El-Tras WF, Mikheal A, Kabapy AF, Abdelfatah M, Bruce M, Eltholth MM. A multifaceted risk model of brucellosis at the human-animal interface in Egypt. Transboundary and Emerging Diseases. 2019;66:2383–2401. doi: 10.1111/tbed.13295. [DOI] [PubMed] [Google Scholar]
- 8.Hosein HI, Zaki HM, Safwat NM, Menshawy AMS, Rouby S, Mahrous A, Madkour BE. Evaluation of the General Organization of Veterinary Services control program of animal brucellosis in Egypt: An outbreak investigation of brucellosis in buffalo. Vet World. 2018;11:748–757. doi: 10.14202/vetworld.2018.748-757. [DOI] [PMC free article] [PubMed] [Google Scholar]
- 9.Njeru J, Wareth G, Melzer F, Henning K, Pletz MW, Heller R, Neubauer H. Systematic review of brucellosis in Kenya: Disease frequency in humans and animals and risk factors for human infection. BMC Public Health. 2016;16:853. doi: 10.1186/s12889-016-3532-9. [DOI] [PMC free article] [PubMed] [Google Scholar]
- 10.Perin G, Bottari NB, Silva AD, Jaguezeski AM, Gomes TMA, Lopes TF, Schetinger MRC, Morsch VM, Da Silva AS. Cholinesterase's activities of infected mice by Brucella ovis. Microbial Pathogenesis. 2019;132:137–140. doi: 10.1016/j.micpath.2019.04.036. [DOI] [PubMed] [Google Scholar]
- 11.Pérez-Etayo L, de Miguel MJ, Conde-Álvarez R, Muñoz PM, Khames M, Iriarte M, Moriyón I, Zúñiga-Ripa A. The CO2-dependence of Brucella ovis and Brucella abortus biovars is caused by defective carbonic anhydrases. Veterinary Research. 2018;49:85. doi: 10.1186/s13567-018-0583-1. [DOI] [PMC free article] [PubMed] [Google Scholar]
- 12.Sidhu-Muñoz RS, Sancho P, Vizcaíno N. Brucella ovis PA mutants for outer membrane proteins Omp10, Omp19, SP41, and BepC are not altered in their virulence and outer membrane properties. Veterinary Microbiology. 2016;186:59–66. doi: 10.1016/j.vetmic.2016.02.010. [DOI] [PubMed] [Google Scholar]
- 13.Macedo AA, Silva AP, Mol JP, Costa LF, Garcia LN, Araújo MS, Martins Filho OA, Paixão TA, Santos RL. The abcEDCBA-encoded ABC transporter and the virB operon-encoded type IV secretion system of Brucella ovis are critical for intracellular trafficking and survival in ovine monocyte-derived macrophages. PLoS One. 2015;10:e0138131. doi: 10.1371/journal.pone.0138131. [DOI] [PMC free article] [PubMed] [Google Scholar]
- 14.Soler-Lloréns P, Gil-Ramírez Y, Zabalza-Baranguá A, Iriarte M, Conde-Álvarez R, Zúñiga-Ripa A, San Román B, Zygmunt MS, Vizcaíno N, Cloeckaert A, Grilló MJ, Moriyón I, López-Goñi I. Mutants in the lipopolysaccharide of Brucella ovis are attenuated and protect against B. ovis infection in mice. Veterinary Research. 2014;45:72. doi: 10.1186/s13567-014-0072-0. [DOI] [PMC free article] [PubMed] [Google Scholar]
- 15.Buccheri, M.A., E. Salvo, M. Coci, G.M. Quero, L. Zoccarato, V. Privitera, and G. Rappazzo. Investigating microbial indicators of anthropogenic marine pollution by 16S and 18S high-throughput sequencing (HTS) library analysis. 2019. FEMS Microbiology Letters. 10.1093/femsle/fnz179. [DOI] [PubMed]
- 16.Wu Z, Gatesoupe FJ, Zhang Q, Wang X, Feng Y, Wang S, Feng D, Li A. High-throughput sequencing reveals the gut and lung prokaryotic community profiles of the Chinese giant salamander (Andrias davidianus) Molecular Biology Reports. 2019;46:5143–5154. doi: 10.1007/s11033-019-04972-8. [DOI] [PubMed] [Google Scholar]
- 17.Jain C, Rodriguez-R LM, Phillippy AM, Konstantinidis KT, Aluru S. High throughput ANI analysis of 90K prokaryotic genomes reveals clear species boundaries. Nature Communications. 2018;9:5114. doi: 10.1038/s41467-018-07641-9. [DOI] [PMC free article] [PubMed] [Google Scholar]
- 18.Numanagić I, Bonfield JK, Hach F, Voges J, Ostermann J, Alberti C, Mattavelli M, Sahinalp SC. Comparison of high-throughput sequencing data compression tools. Nature Methods. 2016;13:1005–1008. doi: 10.1038/nmeth.4037. [DOI] [PubMed] [Google Scholar]
- 19.Singh A, Bhatia P. Automated Sanger Analysis Pipeline (ASAP): A tool for rapidly analyzing sanger sequencing data with minimum user interference. Journal of Biomolecular Techniques. 2016;27:129–131. doi: 10.7171/jbt.16-2704-005. [DOI] [PMC free article] [PubMed] [Google Scholar]
- 20.Albayrak L, Khanipov K, Golovko G, Fofanov Y. Broom: Application for non-redundant storage of high throughput sequencing data. Bioinformatics. 2019;35:143–145. doi: 10.1093/bioinformatics/bty580. [DOI] [PubMed] [Google Scholar]
- 21.Dodds, K.G., J.C. McEwan, R. Brauning, T.C. van Stijn, S.J. Rowe, K.M. McEwan, and S.M. Clarke. 2019. G3 (Bethesda). Exclusion and genomic relatedness methods for assignment of parentage using genotyping-by-sequencing data. 9: 3239–3247. [DOI] [PMC free article] [PubMed]
- 22.Sadedin SP, Oshlack A. Bazam: A rapid method for read extraction and realignment of high-throughput sequencing data. Genome Biology. 2019;20:78. doi: 10.1186/s13059-019-1688-1. [DOI] [PMC free article] [PubMed] [Google Scholar]
- 23.Nietsch R, Haas J, Lai A, Oehler D, Mester S, Frese KS, Sedaghat-Hamedani F, Kayvanpour E, Keller A, Meder B. The role of quality control in targeted next-generation sequencing library preparation. Genom Ptoteom Bioinf. 2016;14:200–206. doi: 10.1016/j.gpb.2016.04.007. [DOI] [PMC free article] [PubMed] [Google Scholar]
- 24.Escobar A, Rodas PI, Acuña-Castillo C. Macrophage-Neisseria gonorrhoeae interactions: A better understanding of pathogen mechanisms of immunomodulation. Frontiers in Immunology. 2018;9:3044. doi: 10.3389/fimmu.2018.03044. [DOI] [PMC free article] [PubMed] [Google Scholar]
- 25.BoseDasgupta S, Pieters J. Macrophage-microbe interaction: Lessons learned from the pathogen mycobacterium tuberculosis. Seminars in Immunopathology. 2018;40:577–591. doi: 10.1007/s00281-018-0710-0. [DOI] [PubMed] [Google Scholar]
- 26.Xu, S.J., H.T. Hu, H.L. Li, and S. Chang. 2019. The role of miRNAs in immune cell development, immune cell activation, and tumor immunity: With a focus on macrophages and natural killer cells. Cells. 10.3390/cells8101140. [DOI] [PMC free article] [PubMed]
- 27.Hartenstein V, Martinez P. Phagocytosis in cellular defense and nutrition: A food-centered approach to the evolution of macrophages. Cell and Tissue Research. 2019;377:527–547. doi: 10.1007/s00441-019-03096-6. [DOI] [PMC free article] [PubMed] [Google Scholar]
- 28.Wang, Y., H. Liu, and J. Zhao. 2019, 2019. Macrophage polarization induced by probiotic bacteria: A concise review. Probiotics Antimicrob Proteins. 10.1007/s12602-019-09612-y. [DOI] [PubMed]
- 29.Ma, Y., Y. Liang, N. Wang, L. Cui, Z. Chen, H. Wu, C. Zhu, Z. Wang, S. Liu, and H. Li. Avian flavivirus infection of monocytes/macrophages by extensive subversion of host antiviral innate immune responses. 2019. Journal of Virology. 10.1128/JVI.00978-19. [DOI] [PMC free article] [PubMed]
- 30.Sidhu-Muñoz RS, Sancho P, Vizcaíno N. Evaluation of human trophoblasts and ovine testis cell lines for the study of the intracellular pathogen Brucella ovis. FEMS Microbiology Letters. 2018;365:24. doi: 10.1093/femsle/fny278. [DOI] [PubMed] [Google Scholar]
- 31.Silva TM, Mol JP, Winter MG, Atluri V, Xavier MN, Pires SF, Paixão TA, Andrade HM, Santos RL, Tsolis RM. The predicted ABC transporter AbcEDCBA is required for type IV secretion system expression and lysosomal evasion by Brucella ovis. PLoS One. 2014;9:e114532. doi: 10.1371/journal.pone.0114532. [DOI] [PMC free article] [PubMed] [Google Scholar]
- 32.Silva TM, Paixão TA, Costa EA, Xavier MN, Sá JC, Moustacas VS, den Hartigh AB, Oliveira SC, Tsolis R, Santos RL. Putative ATP-binding cassette transporter is essential for Brucella ovis pathogenesis in mice. Infection and Immunity. 2011;79:1706–1717. doi: 10.1128/IAI.01109-10. [DOI] [PMC free article] [PubMed] [Google Scholar]
- 33.Covert J, Mathison AJ, Eskra L, Banai M, Splitter G. Brucella melitensis, B. neotomae and B. ovis elicit common and distinctive macrophage defense transcriptional responses. Experimental Biology and Medicine (Maywood, N.J.) 2009;234:1450–1467. doi: 10.3181/0904-RM-124. [DOI] [PMC free article] [PubMed] [Google Scholar]
- 34.Galindo RC, Muñoz PM, de Miguel MJ, Marin CM, Blasco JM, Gortazar C, Kocan KM, de la Fuente J. Differential expression of inflammatory and immune response genes in rams experimentally infected with a rough virulent strain of Brucella ovis. Veterinary Immunology and Immunopathology. 2009;127:295–303. doi: 10.1016/j.vetimm.2008.10.326. [DOI] [PubMed] [Google Scholar]
- 35.David V, Martin A, Isakova T, Spaulding C, Qi L, Ramirez V, Zumbrennen-Bullough KB, Sun CC, Lin HY, Babitt JL, Wolf M. Inflammation and functional iron deficiency regulate fibroblast growth factor 23 production. Kidney International. 2016;89:135–146. doi: 10.1038/ki.2015.290. [DOI] [PMC free article] [PubMed] [Google Scholar]
- 36.Reyes AW, Arayan LT, Simborio HL, Hop HT, Min W, Lee HJ, Kim DH, Chang HH, Kim S. Dextran sulfate sodium upregulates MAPK signaling for the uptake and subsequent intracellular survival of Brucella abortus in murine macrophages. Microbial Pathogenesis. 2016;91:68–73. doi: 10.1016/j.micpath.2015.10.024. [DOI] [PubMed] [Google Scholar]
- 37.Dimitrakopoulos O, Liopeta K, Dimitracopoulos G, Paliogianni F. Replication of Brucella melitensis inside primary human monocytes depends on mitogen activated protein kinase signaling. Microbes and Infection. 2013;15:450–460. doi: 10.1016/j.micinf.2013.04.007. [DOI] [PubMed] [Google Scholar]
- 38.Mika LA, Braun W, Ciaccio E, Goodlow RJ. The nature of the effect of alpha-alanine on population changes of Brucella. Journal of Bacteriology. 1954;68:562–569. doi: 10.1128/jb.68.5.562-569.1954. [DOI] [PMC free article] [PubMed] [Google Scholar]
- 39.Altenbern RA, Ginoza HS, Willoams DR. Metabolism and population changes in Brucella abortus. I. Roles of alanine and pantothenate in population changes. Journal of Bacteriology. 1957;73:691–696. doi: 10.1128/jb.73.6.691-696.1957. [DOI] [PMC free article] [PubMed] [Google Scholar]
- 40.Tomita H, Yokooji Y, Ishibashi T, Imanaka T, Atomi H. An archaeal glutamate decarboxylase homolog functions as an aspartate decarboxylase and is involved in β-alanine and coenzyme a biosynthesis. Journal of Bacteriology. 2014;196:1222–1230. doi: 10.1128/JB.01327-13. [DOI] [PMC free article] [PubMed] [Google Scholar]
- 41.Yokota M, Yahagi S, Masaki H. Ethyl 2,4-dicarboethoxy pantothenate, a derivative of pantothenic acid, prevents cellular damage initiated by environmental pollutants through Nrf2 activation. Journal of Dermatological Science. 2018;92:162–171. doi: 10.1016/j.jdermsci.2018.08.012. [DOI] [PubMed] [Google Scholar]
- 42.Taminiau B, Daykin M, Swift S, Boschiroli ML, Tibor A, Lestrate P, De Bolle X, O'Callaghan D, Williams P, Letesson JJ. Identification of a quorum-sensing signal molecule in the facultative intracellular pathogen Brucella melitensis. Infection and Immunity. 2002;70:3004–3011. doi: 10.1128/IAI.70.6.3004-3011.2002. [DOI] [PMC free article] [PubMed] [Google Scholar]
- 43.Delrue RM, Deschamps C, Léonard S, Nijskens C, Danese I, Schaus JM, Bonnot S, Ferooz J, Tibor A, De Bolle X, Letesson JJ. A quorum-sensing regulator controls expression of both the type IV secretion system and the flagellar apparatus of Brucella melitensis. Cellular Microbiology. 2005;7:1151–1161. doi: 10.1111/j.1462-5822.2005.00543.x. [DOI] [PubMed] [Google Scholar]
- 44.Wu, S., J. Liu, C. Liu, A. Yang, and J. Qiao. 2020. Quorum sensing for population-level control of bacteria and potential therapeutic applications. 2019. Cellular and Molecular Life Sciences. 10.1007/s00018-019-03326-8. [DOI] [PMC free article] [PubMed]
- 45.Mahdizade-Ari M, Pourhajibagher M, Bahador A. Changes of microbial cell survival, metabolic activity, efflux capacity, and quorum sensing ability of Aggregatibacter actinomycetemcomitans due to antimicrobial photodynamic therapy-induced bystander effects. Photodiagnosis and Photodynamic Therapy. 2019;26:287–294. doi: 10.1016/j.pdpdt.2019.04.021. [DOI] [PubMed] [Google Scholar]
- 46.Gül BY, Imer DY, Park PK, Koyuncu I. Selection of quorum quenching (QQ) bacteria for membrane biofouling control: Effect of different Gram-staining QQ bacteria, Bacillus sp. T5 and Delftia sp. T6, on microbial population in membrane bioreactors. Water Science and Technology. 2018;78:358–366. doi: 10.2166/wst.2018.305. [DOI] [PubMed] [Google Scholar]
- 47.Camele I, Elshafie HS, Caputo L, De Feo V. Anti-quorum sensing and antimicrobial effect of mediterranean plant essential oils against phytopathogenic bacteria. Frontiers in Microbiology. 2019;10:2619. doi: 10.3389/fmicb.2019.02619. [DOI] [PMC free article] [PubMed] [Google Scholar]
- 48.Theodora NA, Dominika V, Waturangi DE. Screening and quantification of anti-quorum sensing and antibiofilm activities of phyllosphere bacteria against biofilm forming bacteria. BMC Research Notes. 2019;12:732. doi: 10.1186/s13104-019-4775-1. [DOI] [PMC free article] [PubMed] [Google Scholar]
- 49.Al-Shabib NA, Husain FM, Khan RA, Khan MS, Alam MZ, Ansari FA, Laeeq S, Zubair M, Shahzad SA, Khan JM, Alsalme A, Ahmad I. Interference of phosphane copper (I) complexes of β-carboline with quorum sensing regulated virulence functions and biofilm in foodborne pathogenic bacteria: A first report. Saudi Journal of Biological Sciences. 2019;26:308–316. doi: 10.1016/j.sjbs.2018.04.013. [DOI] [PMC free article] [PubMed] [Google Scholar]
- 50.Uzureau S, Lemaire J, Delaive E, Dieu M, Gaigneaux A, Raes M, De Bolle X, Letesson JJ. Global analysis of quorum sensing targets in the intracellular pathogen Brucella melitensis 16 M. Journal of Proteome Research. 2010;9:3200–3217. doi: 10.1021/pr100068p. [DOI] [PMC free article] [PubMed] [Google Scholar]


