Fig. 2.

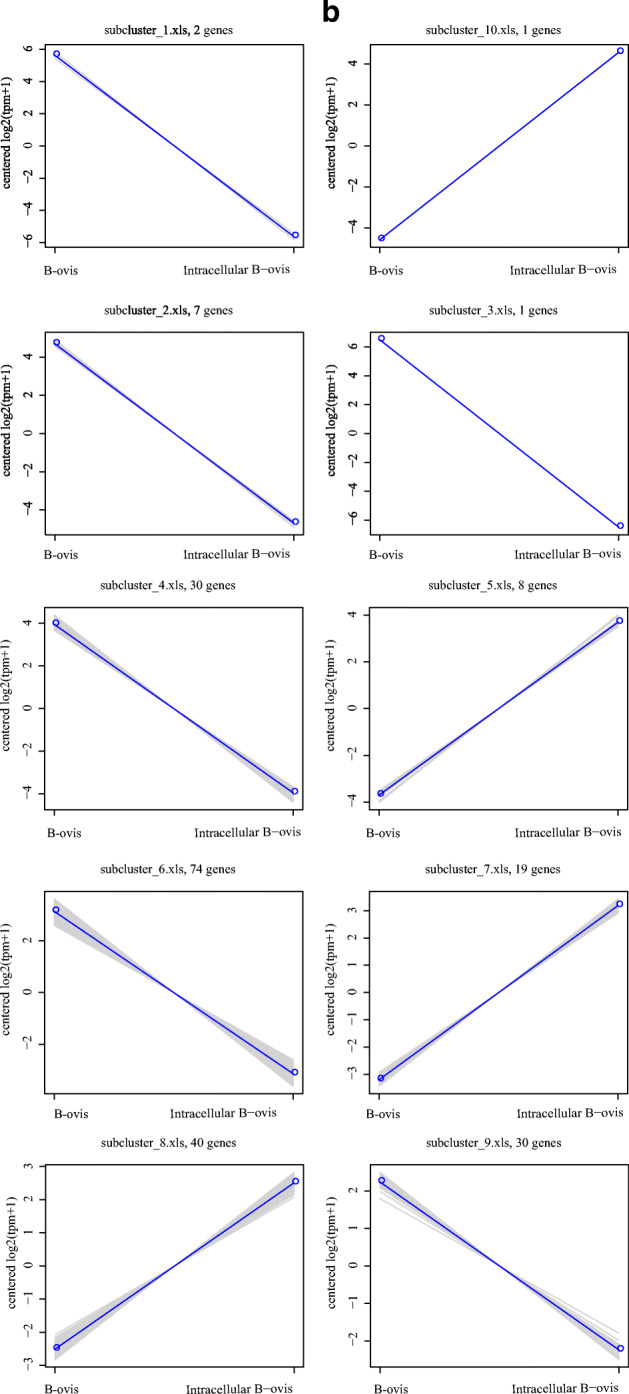
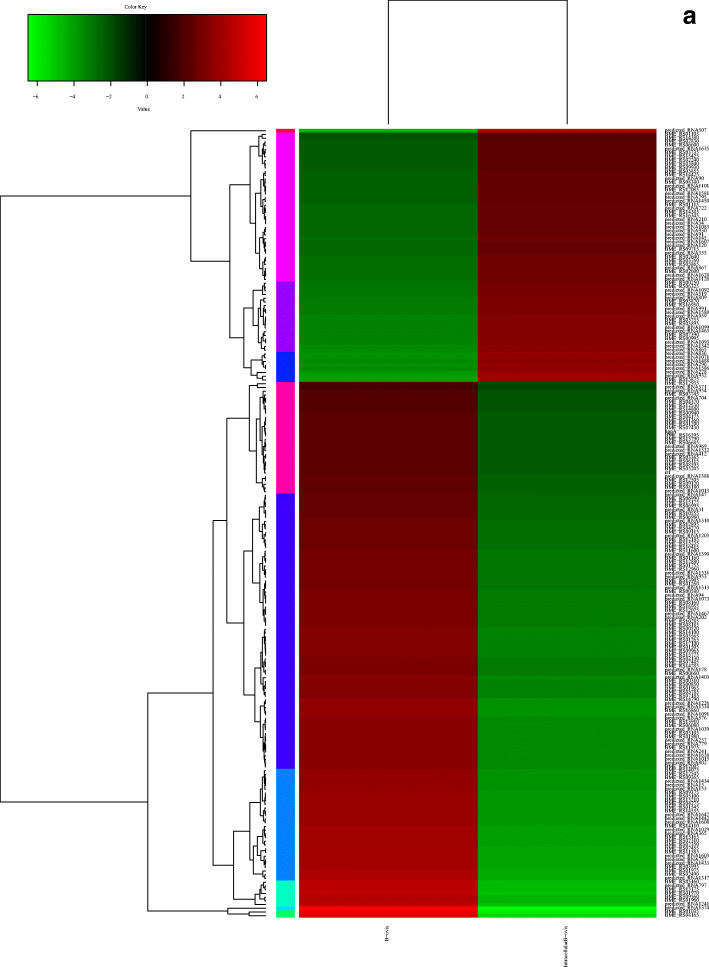
Cluster analysis of DEGs. a Cluster analysis of DEGs between wild-type and intracellular B. ovis. Red color represents the upregulated genes, and green color represents the downregulated genes. b Trend line chart of differential gene module expression. The abscissa was the comparison sample of wild-type B. ovis and intracellular B. ovis group, and the ordinate indicates the expression of genes in the wild-type and intracellular B. ovis samples.

