

Abstract
While chemical signaling during embryogenesis is readily addressed by a plethora of available techniques, the developmental functions of ionic signaling are still poorly understood. It is increasingly realized that bioelectric events in non-neural cells are critical for pattern regulation but their study has been hampered by difficulties in monitoring and manipulating them in vivo. Recent developments in visualizing electrical signaling dynamics in the field of neuroscience have facilitated functional experiments that reveal instructive developmental bioelectric signals. However, there is a pressing need for additional tools to explore time-dependent ionic signaling to understand complex endogenous dynamics. Here, we present methodological advances, including 4-D imaging and data analysis, for improved tracking of calcium flux in the Xenopus laevis embryo, lowering the barrier for in vivo physiology work in this important model system. Using these techniques, we investigated the relationship between bioelectric ion channel activity and calcium, finding that cell hyperpolarization and depolarization both induce persistent static elevation of cytoplasmic calcium levels that fade over developmental time. These calcium changes correlate with increased cell mobility in early embryos and abnormal craniofacial morphology in later embryos. We thus highlight membrane potential modulation as a tractable tool for modulation of signaling cascades that rely on calcium as a transduction mechanism. The methods we describe facilitate the study of important novel aspects of developmental physiology, are extendable to numerous classes of existing and forthcoming fluorescent physiological reporters, and establish highly accessible, inexpensive protocols for their investigation.
Keywords: Xenopus, imaging, embryo, bioelectricity, ion channel, technique
Graphical Abstract
Introduction
The field of non-neural bioelectricity [1, 2] is facing the same challenge that neuroscience struggled with three decades ago: we know that important information with profound phenotypic consequences is encoded by spatiotemporal dynamics of Vmem in patterning tissues during development, regeneration, and cancer suppression [3], but the tools to measure Vmem are not yet sufficiently robust to enable high resolution real-time mapping of information flow in developing embryos. Neuroscientists overcame this challenge through use of calcium imaging as a proxy for neural depolarization [4, 5]. Indeed, calcium imaging remains one of the best tools for measuring functional neural connectomics, playing a central role in the herculean BRAIN initiative that aims to generate a complete atlas of neuronal connectivity [6]. Moreover, calcium acts a signal transduction mechanism for many different signaling pathways [7]. By elucidating the interactions between non-neural bioelectricity and calcium signaling we intend to lay the groundwork for future work employing the well-established optogenetic and chemical toolkit of bioelectricity to modulate the wide variety of calcium dependent signal transduction pathways.
An especially important model for this work is Xenopus laevis, which provides high tractability to biophysical and molecular-genetic techniques [8–10], and also has been used to study a number of disease states and developmental channelopathies [11–18] that involve a bioelectric component [19–21]. Significant progress has been made in understanding bioelectric signaling in Xenopus development with the advent of molecular-genetic tools for regulating Vmem and electrical synapses in vivo: aspects of face, brain, eye, tail, spinal cord, and leg patterning are all regulated by the interplay of ionic and genetic processes [22–31]. Likewise, recent data underscore the importance of calcium for regulating gene expression in the Xenopus embryo downstream of biophysical events [32]. However, the study of calcium dynamics in the context of bioelectrics in Xenopus has remained a challenge. A better understanding of the interplay between membrane potential and calcium signaling will underpin a mechanistic synthesis between bioelectricity and growth factor signaling.
Dynamic calcium patterns have been described throughout early embryonic development. Voltage-Gated Calcium Channels (VGCC) have been identified as early as the 2-cell stage in zebrafish embryos [33]. Though minimal calcium signals have been detected prior the mid-blastula transition, increased transient signals emerge as the Xenopus embryo reaches gastrulation [34]. During early development calcium dynamics are necessary for proper dorsalventral patterning [35] gastrulation, [36] and convergence and extension [37], and overexpression of voltage gated calcium channels drives severe dorsalization phenotypes [37]. Calcium transients have been observed during segmentation of Xenopus [38] and Zebrafish embryos, and in the latter their manipulation functionally induces changes in somite size [39]. Dynamic calcium signals have also been observed in migrating neural crest cells [40] The best described patterns are in the forming neural tissue, where dynamic calcium transients play an instructive role in neural induction [34, 35, 41–46] and in proper folding of the neural tube [47]. Moreover, calcium signals are also involved in kidney differentiation, highlighting that such signals are not unique to neural induction [48, 49]. In this paper, we integrate the emerging physiological signaling paradigms of developmental bioelectricity and calcium in embryonic tissues.
Here, we develop several new methodologies for in vivo studies of developmental calcium signaling: well arrays for precise positioning of embryos during development and 4D imaging using an extended focus approach to handle the large sample size. We use these tools to identify novel calcium dynamics during frog embryogenesis and study the effects of depolarizing and hyperpolarizing ion channels on intracellular calcium. We demonstrate an approach to ultimately enable mapping the information flow of bioelectric signals using the same methodology that neurobiologists use to map neural information flow, as a step towards unifying neural and non-neural decoding efforts. Our methodology is readily extendable to numerous orthogonal physiological reporter systems [50–53].
Results
Multi-embryo imaging array
We have developed a novel embryo imaging array that allows for continual imaging of up to 25 Xenopus embryos in parallel from early cleavage stages through hatching and axis elongation up through face forming stages (NF 1–30) (Figure 1A). The array is cast in agarose using a machined plastic mold that can be reused indefinitely. Embryos poured over the array surface settled into individual wells with minimal manipulation. The optimized well geometry provided consistent positioning of the head region of the embryos through several days of development due to the anterior body dropping into the narrower well bottom. This permitted time-lapse imaging of the head frontal region throughout many stages of development. The vertical embryo position stemming from using gravity to hold embryos head-up required a large depth of focus to enable data acquisition.
Figure 1:

(A) Focus stacked image of mold used to produce tapered agarose wells (A’,A”) for long-term ‘anterior-up’ imaging. These wells are designed to orient the embryo with its face pointing towards the objective throughout its early development (A”’). (B) 2 separate focal planes of a single 3D sample with sample boundary being highlighted with red and blue boxes. (C) Helicon Pyramid focus and (D) Metamorph best focus stacks of the image in (B). (E’-E”’) Plotting pixel intensity over the same linear ROI of an image stacked with Helicon (E) or Metamorph (E’) shows that Helicon focus stacking produces a much sharper boundary (E”). (F) 2D focus stacks and (G) 3D anaglyphs produced with Helicon Focus using Mitotracker to produce contrast. Scale bar = 50 μm (B-E), 250 μm (F).
Focus Stacking
We employed a novel focus stacking workflow using the Helicon Focus software package to produce crisp, accurate micrographs of developing 3-dimensional embryos. Helicon Focus is a commercially available software that was designed to enable focus stacking of photographic images. Considering the orientation of commercially available image processing software towards imaging of thin, transparent samples, we looked for another solution. We reasoned that a micrograph of an opaque sample has more in common with a macroscale photograph than it does with a fluorescent Z-stack of a transparent sample, and so broadened our search to include programs designed for photography. We found Helicon Focus to be the best option, but other available programs might also improve on more standard image analysis methods. In order to compare the focus stack feature of Helicon Focus to other more commonly used methods, including imageJ and Metamorph (Molecular Devices), we analyzed the same z-stack with each technique. We found that Helicon produced much crisper edges (Figure 1B,C,E) while Metamorph failed to faithfully capture the shape of embryo boundaries (Figure 1B,D,E). Helicon Focus also can be used in coordination with a high contrast stain such as Mitotracker to produce clean focus stacks (Figure 1F) and 3D Anaglyphs of even very morphologically complex later stage embryos (Figure 1G). We compare the various focus stacking methods in greater detail in Supplemental Methods Section 1, and describe a workflow for producing 3D Anaglyphs in Supplemental Methods Section 3.
Bioelectric manipulation and calcium imaging
We manipulated electrophysiological identified potassium currents [54] using the pore-mutant dnKir6.1 channel, which has been shown to be non-conductive via rubidium flux assays [54], and the hyperpolarizing ion channel kv1.5, which has been shown to hyperpolarize early embryonic Xenopus cells [55]. Both constructs have been shown to induce ectopic eyes in Xenopus in a calcium-dependent manner [55]. Additionally, kv1.5 overexpression induces brain abnormalities, and dnKir6.1 exacerbates brain abnormalities caused by perturbation of Notch signaling [56].
We induced bioelectric modifications by microinjecting mRNA encoding these well-characterized ion channels into one blastomere of a 2-cell embryo – a technique that allows spatial specificity that is impossible to reach with channel-targeting drugs [9]. Our rationale for doing so is threefold. First, unilateral injections are a common technique for generating an internal control, as we can compare effects in injected cells with their uninjected neighbors. Second, important patterning events often occur at boundaries, creating interfaces between differentially polarized cells. Unilateral injection ensures that each embryo has a large interface between cells expressing and not expressing the exogenous ion channel. Third, effects of bioelectric manipulations have been observed at surprisingly long distances [57, 58], and unilateral injection enables testing of whether calcium dynamics may help unravel the mechanisms of this long-range action by allowing us to simultaneously look for effects in both injected and uninjected regions.
To measure calcium dynamics, we microinjected mRNA encoding the genetically encodable fluorescent calcium reporter GCAMP6S into all four blastomeres of four cell embryos that had previously been unilaterally injected with ion channel mRNA at the 2-cell stage (if applicable). [59]. GCAMP6S offers a variety of advantages over dye-based systems [60]. Soaking early embryos in dyes can generate artifacts by dye being trapped by or its binding to the vitelline envelope, and removal of the envelope potentially damages the embryo and perturbs mechanical cues provided by this extraembryonic structure [61]. Genetically encoded probes have a lower risk of differential incorporation artifacts and, perhaps most importantly for bioelectric studies, GCAMP6S does not require a permeabilizing agent like DMSO or Pluronic-127 that may disrupt the cell membrane and alter Vmem in unexpected ways.
An important factor for interpretation of in vivo sensing of physiology is differential sensor localization. Dyes can be differentially incorporated into different cell types, transgenes can be differentially expressed in different tissues and exhibit embryo to embryo and generation to generation [62] variability, and mRNA microinjection leads to mosaic expression. We take several precautions to limit artifacts stemming from injection variability: First, we unilaterally inject the bioelectric effector genes so that each embryo has an internal control for embryo-to-embryo variability. Though there may be differential GCAMP expression on the two halves of the embryo we expect it to average out over our replicates. Second, 3 separate trials were conducted in which all 3 conditions were run in parallel (see Figure 1) to limit day-to-day variability. Third, all microinjections were conducted by the same researcher to reduce technical variability. Finally, we are careful to be conservative in our interpretation of GCAMP6S data. We focus on patterns that differ between the control and experimental groups, and avoid quantification of absolute intensity, instead focusing interpretation on how patterns change in a specific location over time, as injection mosaicism should not cause these types of changes.
Effects of bioelectric manipulation on calcium signals during early development
For our first timepoint we chose to image the animal pole from which the epidermis, neural crest, and neural plate arise. We elected to study this domain as the mesodermal involution of the vegetal pole is already somewhat explored [36]. Importantly, this tissue is highly pluripotent and has the capability to differentiate into many different cell types from all three germ layers in response to different inductive factors. We chose this timepoint (approximately NF stages 7–11) because it was the earliest time at which GCAMP6S signal could reliably be detected. Given the thickness of this tissue and opaque nature of early embryonic Xenopus embryos, it was very unlikely that involuting marginal cells contributed substantially to the signals that we saw. Statistical analysis of the following data is presented in Supplemental Table 1.
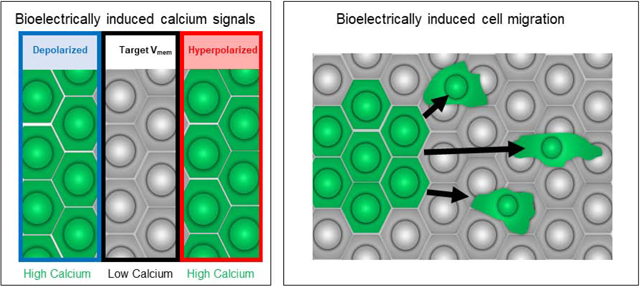
We observed the earliest bioelectrically-driven calcium signals shortly after cleavage stages. In control embryos lacking exogenous ion channels there is a faint, gradually increasing background signal as compared with embryos not expressing GCAMP6S. In contrast, most (25 of 25) embryos injected with mRNA encoding the depolarizing ion channel dnKir6.1 exhibit a bright patch of GCAMP positive cells (Figure 2A). This patch is persistent and lasts for hours, considerably longer than normal calcium transients that last on the order of seconds or minutes (Supplemental Movie 3 [7], before ultimately reducing in size and intensity. Further, in every case observed, only a subset of the cells expressing the exogenous ion channel had these persistent patches. This incomplete overlap suggests that the persistent calcium signal is not simply a direct result of depolarization (for example via opening of voltage gated calcium channels), which we would expect to cause uniform calcium signals the dnKir6.1 injected area. It is possible that this patchiness is merely an artifact of non-uniform mRNA injection, or of damage caused by the injection procedure. We did not see such patches in embryos injected with GCAMP6S only, or on the contralateral side of dnKir6.1-injected embryos, indicating that bioelectric input is at least necessary for this signal. Thus, we conclude that cellular depolarization induces long term relatively static calcium signals in very early development.
Figure 2:

(A) Embryos expressing either the depolarizing ion channel dnKir6.1 or (B) the hyperpolarizing ion channel Kv1.5 (exhibit persistent regions of highly concentrated calcium signal). (C) These regions often produce migratory high-calcium cells that individually migrate away from the high-calcium region (C). The lineage label in (A) is Tdtomato, and the lineage label in (B) is tetramethyl-rhodamine dextran. Embryos are between NF stages 7–11, though precise staging at any particular timepoint is hindered by the orientation of the embryo. Scale bar = 250 μm (A,B), 50 μm (C).
Having observed the effects of depolarization during early development, we next sought to explore the effects of hyperpolarization using the hyperpolarizing ion channel Kv1.5 (Figure 2B). This construct, unlike dnKir6.1, has a T2A- Tomato domain, allowing us to more directly see which cells are expressing the ion channel at later stages; though at the early stages described here it produces a much weaker signal than the Tetramethyl-rhodamine Dextran used with dnKir6.1. Like depolarization, hyperpolarization induces persistent patches of calcium signaling (26 out of 28 embryos). These patches also resemble the patches induced by dnKir6.1 in that they peak around the mid-blastula transition before diminishing and are restricted to a portion to the injected half of the embryo.
Effects of bioelectric manipulation on cell migration
In many kv1.5 injected embryos (19 out of 27) and dnKir6.1 injected embryos (13 out of 25), a large number of motile GCAMP6S fluorescent cells can be see migrating away from the GCAMP6S positive field (Figure 2C, Supplemental Movie 1). The blurry appearance of these cells suggests that they are below the superficial ectodermal layer. Over the course of the time-lapse we observed a shrinking of the GCAMP6S positive domain comparable in magnitude to the size of migrating cells, consistent with the interpretation that cells from this clone are migrating away from the zone of de- or hyperpolarization. Moreover, in dnKir6.1 injected embryos we observed colocalized movement of the rhodamine dextran lineage label indicating cell migration rather than transmission of calcium signals (Supplemental Figure 2, Supplemental Movie 4). Because the T2A-tomato lineage signal was not yet visible in the kv1.5 injected embryos we cannot conclusively rule out signal transmission rather than cell migration in that case, though the similarity in cell behavior We did not observe such migration in the GCAMP6S only condition, and we are unaware of any previous descriptions of cells with this level of single cell motility this early in Xenopus development.
We quantified both overall speed and velocity with respect to the centroid of the high calcium patch in both Kv1.5- and dnKir6.1-injected embryos (Supplemental Figure 2). In both cases, the median velocity of trackable cells with respect to the centroid of the high calcium patch was positive, indicating that the cells tend to move away from it, though this analysis is limited by our inability to clearly observe and thus track highly migratory cells in the high calcium patch. Notably, the depth of these cells within the tissue and resulting low contrast of the signal precluded us from tracking all but the most visible cells. We thus exercise caution in interpreting these data and do not claim that the bulk of the movement of high calcium cells is directed away from the high calcium region, but only that at least some subset of these cells do migrate away from it.
Effects of bioelectric manipulation during later development on calcium signaling
We further leveraged the power of our imaging molds to image embryos during face forming stages. Because calcium signaling during neural induction have been relatively well characterized [42, 45, 63, 64] we began imaging around neural tube closure (NF stage 18) through early tailbud stages (approximately NF stage 25). Given the orientation of the embryo and the low transparency of early Xenopus tissue we are able to image the cranial epidermis as well as the eyes, anterior forming brain and superficial neural crest cells. Statistical analysis of the following data is presented in Supplemental Table 1.
We observed a series of conserved calcium patterns during development of normal embryos during neural tube closure and axis elongation. We manually devitellinized these embryos prior to mounting to help reduce the orientation variability. In the forming face we see calcium signals in both (8 of 11 embryos) of the forming eyes (Figure 3A). These high-calcium domains are reminiscent of the patches of hyperpolarization observed in eye formation [65], and consistent with the finding that high calcium domains are a mechanistic intermediary in bioelectric control of eye formation [55].
Figure 3:

(A) Focus stacked image of GCAMP only condition demonstrating high calcium in the forming eyes. Eyes have been outlined. (B) Representative focus stacked images showing GCAMP in the forming face of embryos injected with dnKir6.1 or Kv1.5. (C) Focus stacked image showing high calcium spot in the same dnKir6.1 injected side of the embryo present during early face formation and absent during later face formation. (D) Inversion of calcium signal from strong to weak colocalization with dnKir6.1 lineage label expression in the same embryo during development. Embryos shown are between NF stage 18 and ear NF stage 25), though precise staging at any particular timepoint is hindered by the orientation of the embryo. Scale bar = 250 μm.
We observed many of the same patterns of aberrant calcium signaling during neurulation/early bud stages that we did during earlier development in unilaterally depolarized embryos (Figure 3B). We saw strong patches of highly GCAMP positive cells within the dnKir6.1-expressing domain of the forming embryonic face (13 of 20 embryos, Figure 3C). These patches quickly faded as the embryo developed and the face proceeded through morphogenesis (12 out of 13 embryos with observed patches, Figure 3C). Depolarization also disrupted the embryo’s endogenous calcium patterns, most notably in the high calcium spots of the forming eyes (Figure 3B). Eleven of 19 scored embryos have GCAMP signal in only a single eye, while only 3 of 19 have signal in both eyes. Interestingly, though the injections were unilateral we saw loss of both calcium eye signals in 5 of 19 embryos, suggesting that the disruption may not be cell-autonomous. More generally, dnKir6.1 expression demonstrates a strikingly dynamic effect on calcium levels. In 15 of 23 scoreable embryos there is dramatically increased GCAMP signal in the dnKir6.1 expressing half of the embryo compared to the contralateral half. However, in 8 of 20 scoreable embryos this pattern inverted as development progresses, with dnKir6.1 apparently inhibiting calcium signals rather than promoting them (Figure 3D). This pattern inversion between GCAMP signal and dnKir6.1 expression reinforces the conclusion that there is not a simple direct interaction between membrane potential and intracellular calcium levels, but rather that the interplay between these two regimes is complex and dynamically changes throughout development (discussed further in Figure 4).
Figure 4:

Our data suggest a ‘set point’ model in which normally developing cells are maintained within a target membrane potential window. When Vmem moves out of this set point as a result of normal biological fluctuations, calcium channels open triggering homeostatic mechanisms. Exogenously expressed ion channels clamp Vmem at a particular point, inducing static calcium signals.
Hyperpolarization had similar effects during late neurulation/face formation as it did earlier in development. Fourteen of 25 hyperpolarized embryos exhibit large GCAMP-positive patches, which like the patches seen in depolarized embryos quickly fade shortly after neural tube closure folding (11 of 14). We observed some degree of disruption of normal calcium patterns in kv1.5 expressing cells, though this disruption seemed less severe in kv1.5 injected embryos than it did in dnKir6.1 injected embryos (Figure 3D). Eight out of 19 embryos had signal in both eyes, 7 of 19 had signal in only one eye and 4 of 19 had no detectable signal in either eye. Notably, we did not see the inversion from colocalization to anti-colocalization of high calcium patches and the ion channel lineage label in hyperpolarized embryos (1 of 24) that we saw in depolarized embryos, indicating that this inversion is not simply an artifact of aging or exogenous gene expression. Thus, we conclude that both hyperpolarization and depolarization induce dynamic calcium changes at multiple different stages of development.
Discussion
We have produced a novel, efficient toolkit for multiplexed long-term analysis of complex three-dimensional developing embryos. We demonstrate that Helicon Focus is a powerful tool for focus stacking opaque embryos. We further show how Helicon Focus can be used to generate stereoscopic timelapses that enable uniquely clear representation of both normal and aberrant 3-dimensional structures in papers and presentation. We also describe a novel agarose well array for imaging embryonic development throughout the diverse morphologies of early life. We showed how to employ these tools to explore the connections between bioelectricity and calcium signaling during early development. We find that both depolarization and hyperpolarization cause long-lasting static patches of calcium from blastula stages through neurulation, which has implications for formulating models of how differences in Vmem are encoded into specific changes in cell behavior and pattern formation. We further observe that hyperpolarization, and to a lesser extent depolarization, causes some of these calcium elevated cells to become migratory. Finally, at later stages, depolarized cells undergo a transition from having higher calcium levels that their neighbors to having lower calcium levels. These data will be useful for on-going efforts to make quantitative models of developmental physiology [66, 67] and to discover interventions that exploit ion channel signaling to repair birth defects [23].
We also observe migratory high-calcium cells leaving the bioelectrically perturbed half of the embryo, especially when this half is hyperpolarized. This migration manifests from blastula stages up through neurulation. Importantly, we do not observe migratory cells in unperturbed embryos at the same early stages that we see migration in hyperpolarized cells, and to our knowledge migration in the animal pole has not been described prior to gastrulation. The induction of migration from purely bioelectric modulation in tissues where this has never previously been described is truly striking. The implications of this finding have substantial implications as a mechanism the long-range effects that have been observed as a bioelectric manipulation [57, 68]. It will also be worth investigating the implications of bioelectrically induced EMT in both normal developmental EMTs and tumor metastasis [29, 69]. Indeed, potassium channel activity has recently been implicated in regulating tumors in both fruitflies and xenografted mouse models [70].
While it may at first seem paradoxical that two opposite bioelectric manipulations could have similar outcomes on calcium signaling, this observation adds to a growing body of literature identifying functional windows of Vmem [55, 71–73]. There is a growing body of evidence for these activity set windows in both non-neural and neural signaling. Toettcher and colleagues have identified a “bandpass” filter mechanism in which intermediate levels of pulsed RAS/ERK signals have greater activity than higher levels of static input signal [74]. In neurons, regulation of membrane potential is essential for normal function. Hyperpolarization may prevent proper excitation, while depolarization may cause over excitation. Moreover, Ca2+ influx has been proposed as a mechanism for modulation of neuronal potassium channels in response to prolonged neuronal activation (reviewed in [75]). Mechanistically, the existence of voltage gated calcium channels that open at very different voltages (reviewed in [76]) provide an avenue for calcium influx in response to both depolarization and hyperpolarization.
We also observed a striking inversion of the effect of depolarization on calcium signals during neurulation. Earlier in development we see a strong correlation between our depolarizing ion channel and calcium signals, while later there is strong anti-correlation. These data indicate that around neurulation there is a fundamental shift in the regulatory interaction between depolarization and calcium influx – an interesting phenomenon to be addressed in future studies of how the bioelectric code is interpreted by second messenger systems in diverse patterning contexts. At the molecular level this may represent a shift in the complement of VGCCs being expressed, and functionally could suggest an endogenous (developmentally-driven) change in the physiological set-point for the tissue.
We propose a model in which cells have an intrinsic Vmem ‘set point’ to which the action of VGCCs helps restore them by triggering calcium influx and warning the cell that it is out of homeostatic equilibrium (see Figure 4); such setpoints have been predicted by computational models [66, 77]. In normally developing cells this warning signal will manifest as calcium flashes during either homeostatic corrections or developmental Vmem shifts. In cells that have been artificially hyper/depolarized, this signal will instead manifest as a static signal indicating that the cell is persistently at the ‘wrong’ membrane potential. Thus, our data may indicate that hyperpolarized cells remain fluorescent as they continue to be out of homeostasis in Figure 3, while depolarized cells achieve homeostasis. This model is consistent with a previous model proposing a set membrane potential from which deviation would lead to abnormalities [60]. Furthermore, there is evidence that cells regulate their membrane potential by modulating the activity of potassium channels in a calcium dependent manner [75], but by adding either highly active hyperpolarizing (Kv1.5) or dominant negative (dnKir6.1) potassium channels we prevent this homeostasis from occurring, resulting in static high levels of calcium. Notably, similar static calcium patterns have been observed using Aequorin (a calcium sensing protein that is orthologous to GCAMP6S) [34], suggesting that the patterns that we observe reflect an endogenous biological phenomenon.
We describe here for the first time a variety of dramatic and dynamic interactions between membrane potential and intracellular calcium in early embryonic tissues. These patterns in some ways reflect the interactions between Vmem and calcium in neural tissues, specifically in the induction of intracellular calcium influx in response to depolarization. However, the patterns that we describe are persistent and static, as opposed to the dynamic transient signals involved in neurogenesis. We also describe the ways in which these patterns change throughout development.
Membrane potential is a tractable biological control mechanism that can readily be manipulated either pharmaceutically [78] via well described ion channel modulating drugs, or optogenetically via expression of light gated ion channels [10, 79–81]. Here we establish a toolkit for studying the effects of membrane potential manipulation on dynamics of the secondary messenger calcium, a key node that acts at the interface between bioelectric and growth factor based signal transduction pathways [82–85]. We also establish an integrated mounting and imaging workflow to enable multiplexed imaging of dynamic signals during craniofacial development. Though optimized for mapping of calcium dynamics, this workflow is readily generalizable for studying other physiological signals during craniofacial development, such as reactive oxygen species [86] and metabolic activity [87], for which genetically encodable fluorescent sensors already exist. We anticipate that this work will provide the foundation for the use of optogenetic and chemical membrane potential modulation as a toolkit for modulating the effects of other signaling cascades that employ calcium or other dynamic physiological signals as a transduction mechanism.
Materials and Methods
Microinjection
mRNA was produced from linearized template DNA using the mMessage Sp6 in vitro transcription kit (ThermoFisher). Microinjection needles were calibrated to produce a roughly 2 nL bolus via ocular micrometer. Either dnkir6.1 [54] or kv1.5-T2A-mCherry [88] mRNA was micro-injected at a concentration of 375 ng/μl into embryos at the 2-cell stage. A single blastomere was injected twice at opposite ends of the animal pole to produce embryos with relatively uniform unilateral expression in ectodermal tissues. These embryos were again injected a second time at the 4-cell stage with 2 nl of 300 ng/ μl mRNA encoding the GCAMP6S calcium reporter. A single injection was made into the animal pole of each of the four blastomeres to maximize uniformity of expression in the embryo.
Embryo Array Culture and Imaging Setup
Embryos were mounted in agarose wells with a tapered geometry (Fig 1A–A”) produced by casting molds CNC machined from poly(methyl methacrylate). 3% Agarose (Calbiochem 2125) was dissolved in 0.1X MMR and added to a 100 mm petri dish (Fisher) near to filling. While the agarose was still liquid, the mold was slowly placed on top to prevent air bubbles from forming between the tines. Once the agarose cooled and solidified, the mold was removed, the chamber was filled with 0.1X MMR, and embryos were added. A large cover glass (43X50 No.1, Ted Pella, 3329) was placed on top of the imaging chamber, and the chamber was sealed with Valap (1 part Vaseline, 1 part lanolin, and 1 part paraffin). Valap was applied over the entirety of the agarose pad containing the imaging well to prevent drying and deformation of the agarose.
Calcium Imaging
Calcium imaging was performed on 3 separate batches of embryos, with each batch consisting of 1 uninjected embryo, 4 embryos injected with GCAMP6S only, and 10 embryos each injected with both GCAMP6S and either kv1.5-T2A-tomato or dnKir6.1. Embryos were scored for the phenotypes described in the results section with embryos that were either too unhealthy to score, or for which the phenotype was ambiguous, being discarded.
Mitotracker Staining
Mitotracker Deep Red-FM (ThermoFisher, M22426) was dissolved to a stock concentration of 1 μM in DMSO, then to a working concentration of 500 nM in 0.1X MMR. Embryos were manually devitellinized and stained for a minimum of 30 minutes prior to imaging. Embryos were imaged in the staining solution to keep the dye in dynamic equilibrium and prevent dye leakage out of cells over time.
Image processing
Images were processed with a combination of Fiji [89] and Helicon Focus. Images being compared were processed similarly, with the exception of different lineage labels in Figure 3 which were differentially brightness and contrast corrected due to differential brightness of the two fluorophores. Z-stacks were processed using MATLAB (script attached in Supplement 4) and Helicon Focus (Heliconsoft) version 6 or 7 as described in the results section. Timelapsed anaglyphs were produced using a pre-released version of Helicon 3D viewer that incorporated suggestions that we made and was provided to us by Helicon for testing purposes. One batch of images demonstrated substantial stage drift, and these images were registered using the Descriptor-based series registration plugin in ImageJ [90]. For a more thorough description of our focus stacking method and 3D anaglyph methods see Supplemental Methods 2 and 3.
Scoring
Embryos were scored manually using the metrics described in the Results section. Briefly, embryos from the early timepoint were scored for presence of absence of persistent high calcium patches and presence or absence of migratory cells. Embryos from the later timepoint were scored for presence or absence of static calcium signals during some point of development in one or both eye, and for presence or absence of persistent high calcium spots. For the later timepoint, these spots were also scored for whether they were in cells containing the lineage label or not. These embryos were also scored for whether the pattern inverted during the time window during which they were imaged. Due to movement and re-orientation of embryos during development it was not possible to score every embryo for every phenotype, and embryos deemed unscoreable were not included in the quantification. For each metric the number of embryos displaying the phenotype and the total number of embryos that could be unambiguously scored are presented. Two-tailed Fisher’s exact tests were calculated using the online calculator provided by Graphpad (https://www.graphpad.com/quickcalcs/contingency1.cfm).
Computer assisted cell tracking
Focus stacked timelapses were binarized using the Bernsen Masking Automatic Local Thresholding tool in Fiji[91, 92]. We elected to use local thresholding due to the complexity and heterogeneity of our images. We manually selected objects in the thresholded image that appeared to be migratory cells and confirmed the identity of these objects in the 8-bit image. We used the ‘Analyze Particles’ function to calculate the centroid of each object greater than 100 square pixels at successive timepoints and used this centroid value to calculate speed and velocity. Analysis was conducted on the largest consecutive measured timeseries for which there was a single unique centroid value. Speed was defined as the average change in distance with respect to the previous timepoint (Supplemental Information 2B). We also established an ‘Anchor Point’ as a reference for each image by tracing the High Calcium patch in the 8-bit image and calculating its centroid for the earliest frame that we identified a moving cell. To prevent artifacts arising from shape changes in the high calcium region over time we used the same reference point for each timepoint. Due to imaging constraints, this analysis is not intended to give a complete analysis of motion in all cells, but rather gives a limited estimate of a clear subset of migratory cells.
Supplementary Material
Supplemental Movie 1: A 4-dimensional anaglyphic movie of normal craniofacial development.
Supplemental Figure 2: (A) Still frames showing colocalization of GCAMP6S (A) and Rhodmaine Dextran (A”) in migratory cells. (B) Schematic showing definition of speed (B) and Velocity (B’). (C) Cell speed and velocity with respect to the centroid of the high calcium patch. Each data point represents a single cell. 7 total kv1.5 and 12 total dnKir6.1 injected embryos were analyzed. Bar indicates median value. Graph produced using Graphpad.
Supplemental Figure 1: A more in depth comparison of focus stacking techniques shown in Figure 1. Some images are reused from Figure 1 for comparison. (A) 3 separate focal planes of a single 3D sample. (B) Comparison of Maximum intensity (Fiji) and Best Focus (Metamorph) projections of the Z-stack represented as slices in A. (C) Comparison of 3 different focus stacking methods using Helicon Focus. Helicon Focus is also used for the images in panel F. (D-F) Zoomed-in comparison of different focus stacking methods, with sample boundary being highlighted with red and blue boxes. Scale bar = 250 μm (A-C), 50 μm (D-F).
Supplemental Movie 2: Movie showing migratory high calcium cells in late blastula/early gastrula embryos unilaterally injected with kv1.5. These movies have been brightness and contrast corrected to emphasize the migrating cells, and manual traces have been added for clarity. Each colored line represents the apparent path of a single cell. Scale bar = 50 μm.
Supplemental Table 1: Summary of statistical analysis. Two-tailed Fisher’s exact tests were calculated using the online calculator provided by Graphpad (https://www.graphpad.com/quickcalcs/contingency1.cfm). Values represent the number of scoreable embryos displaying each phenotype. Embryos which could not confidently be scored were not counted in this analysis.
Supplemental Movie 3: Timelapse of a dnKir6.1 injected embryo showing colocalization of GCAMP6S and Rhodamine Dextran signals in migrating cells. Computer assisted cell traces are shown in Cyan. Scale bar = 250 μm.
Supplemental Movie 4: Timelapse showing transient calcium signals in an embryo expressing GCAMP6S but not injected with any ion channel mRNA. Scale bar = 250 μm
Table 1:
Summary of statistical analysis
| Absence of bright static calcium patch | Presence of bright static calcium patch | p-value | Conditions being compared | |
|---|---|---|---|---|
| GCAMP only | 12 | 0 | ||
| Kv1.5 | 2 | 26 | <0.0001 | (GCAMP only vs. Kv1.5) |
| dnKir6.1 | 0 | 25 | <0.0001 | (GCAMP only vs. dnKir6.1) |
| Absence of highly motile calcium positive cells | Presence of highly motile cells | |||
| GCAMP only | 12 | 0 | ||
| Kv1.5 | 8 | 19 | <0.0001 | (GCAMP only vs. Kv1.5) |
| dnKir6.1 | 12 | 13 | <0.0023 | (GCAMP only vs. dnKir6.1) |
| Absence of high calcium spot in forming face | Presence of high calcium spot in forming face | |||
| GCAMP only | 12 | 0 | ||
| Kv1.5 | 3 | 11 | <0.0001 | (GCAMP only vs. Kv1.5) |
| dnKir6.1 | 7 | 13 | 0.0004 | (GCAMP only vs. dnKir6.1) |
| Calcium signal in both eyes | Calcium signal missing from at least one eye | |||
| GCAMP only | 8 | 3 | ||
| Kv1.5 | 8 | 11 | 0.1424 | (GCAMP only vs. Kv1.5) |
| dnKir6.1 | 3 | 19 | 0.0014 | (GCAMP only vs. dnKir6.1) |
| Presence of signal inversion | Absence of signal inversion | |||
| Kv1.5 | 8 | 12 | 0.0063 | (Kv1.5 vs dnKir6.1) |
| dnKir6.1 | 1 | 23 |
Numbers indicate # of embryos. Two-tailed Fisher’s exact tests were calculated using the online calculator provided by Graphpad (https://www.graphpad.com/quickcalcs/contingency1.cfm). Embryos which could not confidently be scored were not counted in this analysis.
It looks like we need to submit a ‘Highlights’ document as well:
Highlights are required for this journal. Specifications: include 3 to 5 bullet points (max. 85 characters per bullet point including spaces); only the core results of the paper should be covered. The first bullet point should state the background or context of the question. One to three bullet points should describe the principal results. The last bullet point should conclude on a clear description of the conceptual advance and significance of the work. Highlights should be submitted as a separate file in EES by selecting ‘Highlights’ from the drop-down list when uploading files.
Advances in physiological imaging are critical for advancing developmental biology
A novel mold design enables upright time-lapse imaging in Xenopus embryos
Imaging workflow representing 3D structures in 2D enables bioelectric profiling
Changing resting potential via ion channel mRNA induces persistent Ca++ signals
Bioelectric manipulation induces hyper migration of high-calcium cells.
Acknowledgements
We thank Cuong Nguyen for help automating the imaging procedure. The embryo mold arrays were designed with input from Dany Adams. We also thank Erin Switzer and Rakela Colon for Xenopus husbandry and general lab assistance, and Anna Kane, Vaibhav Pai, and Joan Lemire for helpful comments on the manuscript. We gratefully acknowledge support of the Allen Discovery Center program through The Paul G. Allen Frontiers Group (12171), the Templeton World Charity Foundation (TWCF0089/AB55), and the Barton Family Foundation.
Research reported in this publication was also supported by National Institute of Dental & Craniofacial Research (NIDCR) of the National Institutes of Health under award number 1F32DE027606-01A1 and by the Defense Advanced Research Projects Agency (DARPA) under Cooperative Agreement Number HR0011-18-2-0022. The content of the information does not necessarily reflect the position or the policy of the Government, and no official endorsement should be inferred. Approved for public release; distribution is unlimited.
Footnotes
Publisher's Disclaimer: This is a PDF file of an unedited manuscript that has been accepted for publication. As a service to our customers we are providing this early version of the manuscript. The manuscript will undergo copyediting, typesetting, and review of the resulting proof before it is published in its final form. Please note that during the production process errors may be discovered which could affect the content, and all legal disclaimers that apply to the journal pertain.
Declarations of interest: none
ReferencesUncategorized References
- [1].Mathews J, Levin M. The body electric 2.0: recent advances in developmental bioelectricity for regenerative and synthetic bioengineering. Curr Opin Biotechnol. 2018;52:134–44. [DOI] [PMC free article] [PubMed] [Google Scholar]
- [2].Levin M, Pezzulo G, Finkelstein JM. Endogenous Bioelectric Signaling Networks: Exploiting Voltage Gradients for Control of Growth and Form. Annu Rev Biomed Eng. 2017;19:353–87. [DOI] [PMC free article] [PubMed] [Google Scholar]
- [3].Bates E Ion Channels in Development and Cancer. Annu Rev Cell Dev Biol. 2015;31:231–47. [DOI] [PubMed] [Google Scholar]
- [4].Yuste R, Katz LC. Control of postsynaptic Ca2+ influx in developing neocortex by excitatory and inhibitory neurotransmitters. Neuron. 1991;6:333–44. [DOI] [PubMed] [Google Scholar]
- [5].Smetters D, Majewska A, Yuste R. Detecting action potentials in neuronal populations with calcium imaging. Methods (San Diego, Calif). 1999;18:215–21. [DOI] [PubMed] [Google Scholar]
- [6].Alivisatos AP, Chun M, Church GM, Greenspan RJ, Roukes ML, Yuste R. The brain activity map project and the challenge of functional connectomics. Neuron. 2012;74:970–4. [DOI] [PMC free article] [PubMed] [Google Scholar]
- [7].Brodskiy PA, Zartman JJ. Calcium as a signal integrator in developing epithelial tissues. Phys Biol. 2018;15:051001. [DOI] [PMC free article] [PubMed] [Google Scholar]
- [8].Chernet BT, Adams DS, Lobikin M, Levin M. Use of genetically encoded, light-gated ion translocators to control tumorigenesis. Oncotarget. 2016;7:19575–88. [DOI] [PMC free article] [PubMed] [Google Scholar]
- [9].Adams DS, Tseng AS, Levin M. Light-activation of the Archaerhodopsin H(+)-pump reverses age-dependent loss of vertebrate regeneration: sparking system-level controls in vivo. Biol Open. 2013;2:306–13. [DOI] [PMC free article] [PubMed] [Google Scholar]
- [10].Spencer Adams D, Lemire JM, Kramer RH, Levin M. Optogenetics in Developmental Biology: using light to control ion flux-dependent signals in Xenopus embryos. Int J Dev Biol. 2014;58:851–61. [DOI] [PMC free article] [PubMed] [Google Scholar]
- [11].Tseng AS. Seeing the future: using Xenopus to understand eye regeneration. Genesis. 2017;55. [DOI] [PubMed] [Google Scholar]
- [12].Maia LA, Velloso I, Abreu JG. Advances in the use of Xenopus for successful drug screening. Expert Opin Drug Discov. 2017;12:1153–9. [DOI] [PubMed] [Google Scholar]
- [13].Getwan M, Lienkamp SS. Toolbox in a tadpole: Xenopus for kidney research. Cell Tissue Res. 2017;369:143–57. [DOI] [PubMed] [Google Scholar]
- [14].Dubey A, Saint-Jeannet JP. Modeling human craniofacial disorders in Xenopus. Curr Pathobiol Rep. 2017;5:79–92. [DOI] [PMC free article] [PubMed] [Google Scholar]
- [15].Duncan AR, Khokha MK. Xenopus as a model organism for birth defects-Congenital heart disease and heterotaxy. Semin Cell Dev Biol. 2016;51:73–9. [DOI] [PMC free article] [PubMed] [Google Scholar]
- [16].Kaltenbrun E, Tandon P, Amin NM, Waldron L, Showell C, Conlon FL. Xenopus: An emerging model for studying congenital heart disease. Birth Defects Res A Clin Mol Teratol. 2011;91:495–510. [DOI] [PMC free article] [PubMed] [Google Scholar]
- [17].Kathiriya IS, Srivastava D. Left-right asymmetry and cardiac looping: implications for cardiac development and congenital heart disease. Am J Med Genet. 2000;97:271–9. [DOI] [PubMed] [Google Scholar]
- [18].Pratt KG, Khakhalin AS. Modeling human neurodevelopmental disorders in the Xenopus tadpole: from mechanisms to therapeutic targets. Dis Model Mech. 2013;6:1057–65. [DOI] [PMC free article] [PubMed] [Google Scholar]
- [19].Adams DS, Uzel SG, Akagi J, Wlodkowic D, Andreeva V, Yelick PC, et al. Bioelectric signalling via potassium channels: a mechanism for craniofacial dysmorphogenesis in KCNJ2-associated Andersen-Tawil Syndrome. J Physiol. 2016;594:3245–70. [DOI] [PMC free article] [PubMed] [Google Scholar]
- [20].Adams DS, Robinson KR, Fukumoto T, Yuan S, Albertson RC, Yelick P, et al. Early, H+-V-ATPase-dependent proton flux is necessary for consistent left-right patterning of non-mammalian vertebrates. Development. 2006;133:1657–71. [DOI] [PMC free article] [PubMed] [Google Scholar]
- [21].Levin M, Thorlin T, Robinson KR, Nogi T, Mercola M. Asymmetries in H+/K+-ATPase and cell membrane potentials comprise a very early step in left-right patterning. Cell. 2002;111:77–89. [DOI] [PubMed] [Google Scholar]
- [22].Sullivan KG, Levin M. Inverse Drug Screening of Bioelectric Signaling and Neurotransmitter Roles: Illustrated Using a Xenopus Tail Regeneration Assay. Cold Spring Harb Protoc. 2018;2018:pdb prot099937. [DOI] [PubMed] [Google Scholar]
- [23].Pai VP, Pietak A, Willocq V, Ye B, Shi NQ, Levin M. HCN2 Rescues brain defects by enforcing endogenous voltage pre-patterns. Nat Commun. 2018;9:998. [DOI] [PMC free article] [PubMed] [Google Scholar]
- [24].Pitcairn E, Harris H, Epiney J, Pai VP, Lemire JM, Ye B, et al. Coordinating heart morphogenesis: A novel role for hyperpolarization-activated cyclic nucleotide-gated (HCN) channels during cardiogenesis in Xenopus laevis. Commun Integr Biol. 2017;10:e1309488. [DOI] [PMC free article] [PubMed] [Google Scholar]
- [25].Pare JF, Martyniuk CJ, Levin M. Bioelectric regulation of innate immune system function in regenerating and intact Xenopus laevis. Npj Regen Med. 2017;2:15. [DOI] [PMC free article] [PubMed] [Google Scholar]
- [26].Herrera-Rincon C, Pai VP, Moran KM, Lemire JM, Levin M. The brain is required for normal muscle and nerve patterning during early Xenopus development. Nat Commun. 2017;8:587. [DOI] [PMC free article] [PubMed] [Google Scholar]
- [27].Blackiston DJ, Vien K, Levin M. Serotonergic stimulation induces nerve growth and promotes visual learning via posterior eye grafts in a vertebrate model of induced sensory plasticity. Npj Regen Med. 2017;2:8. [DOI] [PMC free article] [PubMed] [Google Scholar]
- [28].Chernet BT, Levin M. Transmembrane voltage potential of somatic cells controls oncogene-mediated tumorigenesis at long-range. Oncotarget. 2014;5:3287–306. [DOI] [PMC free article] [PubMed] [Google Scholar]
- [29].Blackiston D, Adams DS, Lemire JM, Lobikin M, Levin M. Transmembrane potential of GlyCl-expressing instructor cells induces a neoplastic-like conversion of melanocytes via a serotonergic pathway. Dis Model Mech. 2011;4:67–85. [DOI] [PMC free article] [PubMed] [Google Scholar]
- [30].Ribera AB. Homogeneous development of electrical excitability via heterogeneous ion channel expression. J Neurosci. 1996;16:1123–30. [DOI] [PMC free article] [PubMed] [Google Scholar]
- [31].Ribera AB. Ion channel activity drives ion channel expression. J Physiol. 1998;511(Pt 3):645. [DOI] [PMC free article] [PubMed] [Google Scholar]
- [32].Tu MK, Borodinsky LN. Spontaneous calcium transients manifest in the regenerating muscle and are necessary for skeletal muscle replenishment. Cell calcium. 2014;56:34–41. [DOI] [PMC free article] [PubMed] [Google Scholar]
- [33].Sanhueza D, Montoya A, Sierralta J, Kukuljan M. Expression of voltage-activated calcium channels in the early zebrafish embryo. Zygote (Cambridge, England). 2009;17:131–5. [DOI] [PubMed] [Google Scholar]
- [34].Leclerc C, Webb SE, Daguzan C, Moreau M, Miller AL. Imaging patterns of calcium transients during neural induction in Xenopus laevis embryos. Journal of cell science. 2000;113 Pt 19:3519–29. [DOI] [PubMed] [Google Scholar]
- [35].Palma V, Kukuljan M, Mayor R. Calcium mediates dorsoventral patterning of mesoderm in Xenopus. Curr Biol. 2001;11:1606–10. [DOI] [PubMed] [Google Scholar]
- [36].Hayashi K, Yamamoto TS, Ueno N. Intracellular calcium signal at the leading edge regulates mesodermal sheet migration during Xenopus gastrulation. Scientific reports. 2018;8:2433. [DOI] [PMC free article] [PubMed] [Google Scholar]
- [37].Wallingford JB, Ewald AJ, Harland RM, Fraser SE. Calcium signaling during convergent extension in Xenopus. Curr Biol. 2001;11:652–61. [DOI] [PubMed] [Google Scholar]
- [38].Ferrari MB, Spitzer NC. Calcium signaling in the developing Xenopus myotome. Developmental biology. 1999;213:269–82. [DOI] [PubMed] [Google Scholar]
- [39].Leung CF, Miller AL, Korzh V, Chong SW, Sleptsova-Freidrich I, Webb SE. Visualization of stochastic Ca2+ signals in the formed somites during the early segmentation period in intact, normally developing zebrafish embryos. Development, growth & differentiation. 2009;51:617–37. [DOI] [PubMed] [Google Scholar]
- [40].McKinney MC, Kulesa PM. In vivo calcium dynamics during neural crest cell migration and patterning using GCaMP3. Developmental biology. 2011;358:309–17. [DOI] [PMC free article] [PubMed] [Google Scholar]
- [41].Drean G, Leclerc C, Duprat AM, Moreau M. Expression of L-type Ca2+ channel during early embryogenesis in Xenopus laevis. Int J Dev Biol. 1995;39:1027–32. [PubMed] [Google Scholar]
- [42].Leclerc C, Daguzan C, Nicolas MT, Chabret C, Duprat AM, Moreau M. L-type calcium channel activation controls the in vivo transduction of the neuralizing signal in the amphibian embryos. Mechanisms of development. 1997;64:105–10. [DOI] [PubMed] [Google Scholar]
- [43].Leclerc C, Neant I, Webb SE, Miller AL, Moreau M. Calcium transients and calcium signalling during early neurogenesis in the amphibian embryo Xenopus laevis. Biochimica et biophysica acta. 2006;1763:1184–91. [DOI] [PubMed] [Google Scholar]
- [44].Neant I, Mellstrom B, Gonzalez P, Naranjo JR, Moreau M, Leclerc C. Kcnip1 a Ca(2)(+)-dependent transcriptional repressor regulates the size of the neural plate in Xenopus. Biochimica et biophysica acta. 2015;1853:2077–85. [DOI] [PubMed] [Google Scholar]
- [45].Moreau M, Leclerc C. The choice between epidermal and neural fate: a matter of calcium. Int J Dev Biol. 2004;48:75–84. [DOI] [PubMed] [Google Scholar]
- [46].Moreau M, Neant I, Webb SE, Miller AL, Leclerc C. Calcium signalling during neural induction in Xenopus laevis embryos. Philosophical transactions of the Royal Society of London Series B, Biological sciences. 2008;363:1371–5. [DOI] [PMC free article] [PubMed] [Google Scholar]
- [47].Sequerra EB, Goyal R, Castro PA, Levin JB, Borodinsky LN. NMDA Receptor Signaling Is Important for Neural Tube Formation and for Preventing Antiepileptic Drug-Induced Neural Tube Defects. J Neurosci. 2018;38:4762–73. [DOI] [PMC free article] [PubMed] [Google Scholar]
- [48].Leclerc C, Webb SE, Miller AL, Moreau M. An increase in intracellular Ca2+ is involved in pronephric tubule differentiation in the amphibian Xenopus laevis. Developmental biology. 2008;321:357–67. [DOI] [PubMed] [Google Scholar]
- [49].Futel M, Leclerc C, Le Bouffant R, Buisson I, Neant I, Umbhauer M, et al. TRPP2-dependent Ca2+ signaling in dorso-lateral mesoderm is required for kidney field establishment in Xenopus. Journal of cell science. 2015;128:888–99. [DOI] [PubMed] [Google Scholar]
- [50].Cohen AE, Venkatachalam V. Bringing bioelectricity to light. Annu Rev Biophys. 2014;43:211–32. [DOI] [PubMed] [Google Scholar]
- [51].Baker BJ, Mutoh H, Dimitrov D, Akemann W, Perron A, Iwamoto Y, et al. Genetically encoded fluorescent sensors of membrane potential. Brain cell biology. 2008;36:53–67. [DOI] [PMC free article] [PubMed] [Google Scholar]
- [52].Bencina M Illumination of the spatial order of intracellular pH by genetically encoded pH-sensitive sensors. Sensors (Basel). 2013;13:16736–58. [DOI] [PMC free article] [PubMed] [Google Scholar]
- [53].Germond A, Fujita H, Ichimura T, Watanabe TM. Design and development of genetically encoded fluorescent sensors to monitor intracellular chemical and physical parameters. Biophys Rev. 2016;8:121–38. [DOI] [PMC free article] [PubMed] [Google Scholar]
- [54].Aw S, Koster JC, Pearson W, Nichols CG, Shi NQ, Carneiro K, et al. The ATP-sensitive K(+)-channel (K(ATP)) controls early left-right patterning in Xenopus and chick embryos. Developmental biology. 2010;346:39–53. [DOI] [PMC free article] [PubMed] [Google Scholar]
- [55].Pai VP, Aw S, Shomrat T, Lemire JM, Levin M. Transmembrane voltage potential controls embryonic eye patterning in Xenopus laevis. Development. 2012;139:313–23. [DOI] [PMC free article] [PubMed] [Google Scholar]
- [56].Pai VP, Lemire JM, Pare JF, Lin G, Chen Y, Levin M. Endogenous gradients of resting potential instructively pattern embryonic neural tissue via Notch signaling and regulation of proliferation. J Neurosci. 2015;35:4366–85. [DOI] [PMC free article] [PubMed] [Google Scholar]
- [57].Chernet BT, Fields C, Levin M. Long-range gap junctional signaling controls oncogene-mediated tumorigenesis in Xenopus laevis embryos. Front Physiol. 2014;5:519. [DOI] [PMC free article] [PubMed] [Google Scholar]
- [58].Busse SM, McMillen PT, Levin M. Cross-limb communication during Xenopus hindlimb regenerative response: non-local bioelectric injury signals. Development. 2018;145. [DOI] [PubMed] [Google Scholar]
- [59].Chen TW, Wardill TJ, Sun Y, Pulver SR, Renninger SL, Baohan A, et al. Ultrasensitive fluorescent proteins for imaging neuronal activity. Nature. 2013;499:295–300. [DOI] [PMC free article] [PubMed] [Google Scholar]
- [60].Adams DS, Levin M. Measuring resting membrane potential using the fluorescent voltage reporters DiBAC4(3) and CC2-DMPE. Cold Spring Harb Protoc. 2012;2012:459–64. [DOI] [PMC free article] [PubMed] [Google Scholar]
- [61].Farge E Mechanical induction of Twist in the Drosophila foregut/stomodeal primordium. Curr Biol. 2003;13:1365–77. [DOI] [PubMed] [Google Scholar]
- [62].Akitake CM, Macurak M, Halpern ME, Goll MG. Transgenerational analysis of transcriptional silencing in zebrafish. Developmental biology. 2011;352:191–201. [DOI] [PMC free article] [PubMed] [Google Scholar]
- [63].Adams DS, Levin M. General principles for measuring resting membrane potential and ion concentration using fluorescent bioelectricity reporters. Cold Spring Harb Protoc. 2012;2012:385–97. [DOI] [PMC free article] [PubMed] [Google Scholar]
- [64].Suzuki M, Sato M, Koyama H, Hara Y, Hayashi K, Yasue N, et al. Distinct intracellular Ca(2+) dynamics regulate apical constriction and differentially contribute to neural tube closure. Development. 2017;144:1307–16. [DOI] [PubMed] [Google Scholar]
- [65].Vandenberg LN, Adams DS, Levin M. Normalized shape and location of perturbed craniofacial structures in the Xenopus tadpole reveal an innate ability to achieve correct morphology. Dev Dyn. 2012;241:863–78. [DOI] [PMC free article] [PubMed] [Google Scholar]
- [66].Pietak A, Levin M. Bioelectric gene and reaction networks: computational modelling of genetic, biochemical and bioelectrical dynamics in pattern regulation. J R Soc Interface. 2017;14. [DOI] [PMC free article] [PubMed] [Google Scholar]
- [67].Pietak A, Levin M. Exploring Instructive Physiological Signaling with the Bioelectric Tissue Simulation Engine (BETSE). Frontiers in Bioengineering and Biotechnology. 2016;4. [DOI] [PMC free article] [PubMed] [Google Scholar]
- [68].Pai VP, Lemire JM, Chen Y, Lin G, Levin M. Local and long-range endogenous resting potential gradients antagonistically regulate apoptosis and proliferation in the embryonic CNS. Int J Dev Biol. 2015;59:327–40. [DOI] [PMC free article] [PubMed] [Google Scholar]
- [69].Lobikin M, Lobo D, Blackiston DJ, Martyniuk CJ, Tkachenko E, Levin M. Serotonergic regulation of melanocyte conversion: A bioelectrically regulated network for stochastic all-or-none hyperpigmentation. Sci Signal. 2015;8:ra99. [DOI] [PubMed] [Google Scholar]
- [70].Fukushiro-Lopes DF, Hegel AD, Rao V, Wyatt D, Baker A, Breuer EK, et al. Preclinical study of a Kv11.1 potassium channel activator as antineoplastic approach for breast cancer. Oncotarget. 2018;9:3321–37. [DOI] [PMC free article] [PubMed] [Google Scholar]
- [71].McDonald TF, Sachs HG, Orr CW, Ebert JD. External potassium and baby hamster kidney cells: intracellular ions, ATP, growth, DNA synthesis and membrane potential. Developmental biology. 1972;28:290–303. [DOI] [PubMed] [Google Scholar]
- [72].Gruler H, Nuccitelli R. Neural crest cell galvanotaxis: new data and a novel approach to the analysis of both galvanotaxis and chemotaxis. Cell motility and the cytoskeleton. 1991;19:121–33. [DOI] [PubMed] [Google Scholar]
- [73].Jurkat-Rott K, Weber MA, Fauler M, Guo XH, Holzherr BD, Paczulla A, et al. K+-dependent paradoxical membrane depolarization and Na+ overload, major and reversible contributors to weakness by ion channel leaks. Proc Natl Acad Sci U S A. 2009;106:4036–41. [DOI] [PMC free article] [PubMed] [Google Scholar]
- [74].Wilson MZ, Ravindran PT, Lim WA, Toettcher JE. Tracing Information Flow from Erk to Target Gene Induction Reveals Mechanisms of Dynamic and Combinatorial Control. Molecular cell. 2017;67:757–69 e5. [DOI] [PMC free article] [PubMed] [Google Scholar]
- [75].Misonou H Homeostatic regulation of neuronal excitability by K(+) channels in normal and diseased brains. The Neuroscientist : a review journal bringing neurobiology, neurology and psychiatry. 2010;16:51–64. [DOI] [PubMed] [Google Scholar]
- [76].Catterall WA. Voltage-gated calcium channels. Cold Spring Harbor perspectives in biology. 2011;3:a003947. [DOI] [PMC free article] [PubMed] [Google Scholar]
- [77].Cervera J, Pietak A, Levin M, Mafe S. Bioelectrical coupling in multicellular domains regulated by gap junctions: A conceptual approach. Bioelectrochemistry. 2018;123:45–61. [DOI] [PubMed] [Google Scholar]
- [78].Tuszynski J, Tilli TM, Levin M. Ion Channel and Neurotransmitter Modulators as Electroceutical Approaches to the Control of Cancer. Current pharmaceutical design. 2017;23:4827–41. [DOI] [PMC free article] [PubMed] [Google Scholar]
- [79].McNamara HM, Dodson S, Huang YL, Miller EW, Sandstede B, Cohen AE. Geometry-Dependent Arrhythmias in Electrically Excitable Tissues. Cell Syst. 2018;7:359–70 e6. [DOI] [PMC free article] [PubMed] [Google Scholar]
- [80].McNamara HM, Zhang H, Werley CA, Cohen AE. Optically Controlled Oscillators in an Engineered Bioelectric Tissue. Physical Review X. 2016;6:031001. [Google Scholar]
- [81].Brinks D, Adam Y, Kheifets S, Cohen AE. Painting with Rainbows: Patterning Light in Space, Time, and Wavelength for Multiphoton Optogenetic Sensing and Control. Acc Chem Res. 2016;49:2518–26. [DOI] [PubMed] [Google Scholar]
- [82].Belgacem YH, Borodinsky LN. Inversion of Sonic hedgehog action on its canonical pathway by electrical activity. Proc Natl Acad Sci U S A. 2015;112:4140–5. [DOI] [PMC free article] [PubMed] [Google Scholar]
- [83].Spitzer NC, Borodinsky LN, Root CM. Imaging and manipulating calcium transients in developing Xenopus spinal neurons. Cold Spring Harb Protoc. 2013;2013:653–64. [DOI] [PubMed] [Google Scholar]
- [84].Swapna I, Borodinsky LN. Interplay between electrical activity and bone morphogenetic protein signaling regulates spinal neuron differentiation. Proceedings of the National Academy of Sciences of the United States of America. 2012. [DOI] [PMC free article] [PubMed] [Google Scholar]
- [85].Belgacem YH, Borodinsky LN. Sonic hedgehog signaling is decoded by calcium spike activity in the developing spinal cord. Proc Natl Acad Sci U S A. 2011;108:4482–7. [DOI] [PMC free article] [PubMed] [Google Scholar]
- [86].Love NR, Chen Y, Ishibashi S, Kritsiligkou P, Lea R, Koh Y, et al. Amputation-induced reactive oxygen species are required for successful Xenopus tadpole tail regeneration. Nature cell biology. 2013;15:222–8. [DOI] [PMC free article] [PubMed] [Google Scholar]
- [87].Tantama M, Martinez-Francois JR, Mongeon R, Yellen G. Imaging energy status in live cells with a fluorescent biosensor of the intracellular ATP-to-ADP ratio. Nat Commun. 2013;4:2550. [DOI] [PMC free article] [PubMed] [Google Scholar]
- [88].Pai VP, Martyniuk CJ, Echeverri K, Sundelacruz S, Kaplan DL, Levin M. Genome-wide analysis reveals conserved transcriptional responses downstream of resting potential change in Xenopus embryos, axolotl regeneration, and human mesenchymal cell differentiation. Regeneration (Oxf). 2016;3:3–25. [DOI] [PMC free article] [PubMed] [Google Scholar]
- [89].Schindelin J, Arganda-Carreras I, Frise E, Kaynig V, Longair M, Pietzsch T, et al. Fiji: an open-source platform for biological-image analysis. Nature methods. 2012;9:676–82. [DOI] [PMC free article] [PubMed] [Google Scholar]
- [90].Preibisch S Stephan Preibisch. https://github.com/fiji/Descriptor_based_registration/2011. [Google Scholar]
- [91].Bernsen J Dynamic Thresholding of Grey-Level Images. Proc of the 8th Int Conf on Pattern Recognition. 1986. [Google Scholar]
- [92].Sezgin M, Sankur B. Survey over Image Thresholding Techniques and Quantiative Performance Evaluation. Journal of Electronic Imaging. 2004;13:146–65. [Google Scholar]
Associated Data
This section collects any data citations, data availability statements, or supplementary materials included in this article.
Supplementary Materials
Supplemental Movie 1: A 4-dimensional anaglyphic movie of normal craniofacial development.
Supplemental Figure 2: (A) Still frames showing colocalization of GCAMP6S (A) and Rhodmaine Dextran (A”) in migratory cells. (B) Schematic showing definition of speed (B) and Velocity (B’). (C) Cell speed and velocity with respect to the centroid of the high calcium patch. Each data point represents a single cell. 7 total kv1.5 and 12 total dnKir6.1 injected embryos were analyzed. Bar indicates median value. Graph produced using Graphpad.
Supplemental Figure 1: A more in depth comparison of focus stacking techniques shown in Figure 1. Some images are reused from Figure 1 for comparison. (A) 3 separate focal planes of a single 3D sample. (B) Comparison of Maximum intensity (Fiji) and Best Focus (Metamorph) projections of the Z-stack represented as slices in A. (C) Comparison of 3 different focus stacking methods using Helicon Focus. Helicon Focus is also used for the images in panel F. (D-F) Zoomed-in comparison of different focus stacking methods, with sample boundary being highlighted with red and blue boxes. Scale bar = 250 μm (A-C), 50 μm (D-F).
Supplemental Movie 2: Movie showing migratory high calcium cells in late blastula/early gastrula embryos unilaterally injected with kv1.5. These movies have been brightness and contrast corrected to emphasize the migrating cells, and manual traces have been added for clarity. Each colored line represents the apparent path of a single cell. Scale bar = 50 μm.
Supplemental Table 1: Summary of statistical analysis. Two-tailed Fisher’s exact tests were calculated using the online calculator provided by Graphpad (https://www.graphpad.com/quickcalcs/contingency1.cfm). Values represent the number of scoreable embryos displaying each phenotype. Embryos which could not confidently be scored were not counted in this analysis.
Supplemental Movie 3: Timelapse of a dnKir6.1 injected embryo showing colocalization of GCAMP6S and Rhodamine Dextran signals in migrating cells. Computer assisted cell traces are shown in Cyan. Scale bar = 250 μm.
Supplemental Movie 4: Timelapse showing transient calcium signals in an embryo expressing GCAMP6S but not injected with any ion channel mRNA. Scale bar = 250 μm