

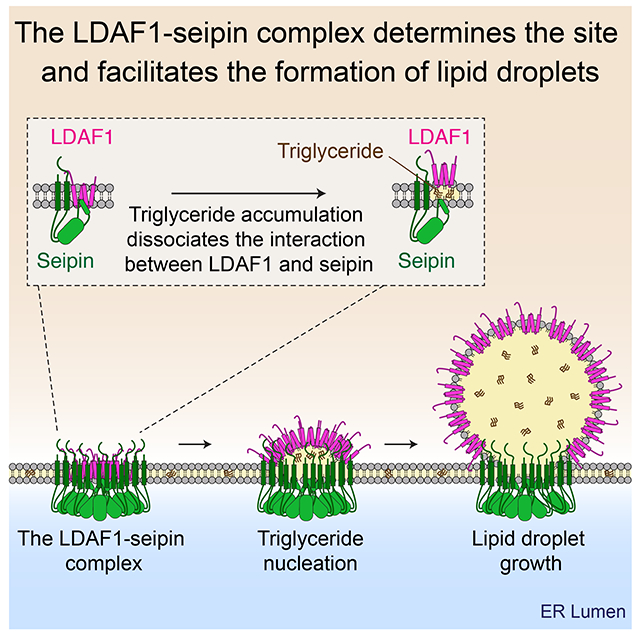
SUMMARY
Lipid droplets (LDs) originate from the endoplasmic reticulum (ER) to store triacylglycerol (TG) and cholesterol esters. The ER protein seipin was shown to localize to ER-LD contacts soon after LDs form, but what determines the sites of initial LD biogenesis in the ER is unknown. Here we identify TMEM159, now re-named lipid droplet-assembly factor 1 (LDAF1), as an interaction partner of seipin. Together, LDAF1 and seipin form a ~600kDa oligomeric complex that copurifies with TG. LDs form at LDAF1-seipin complexes, and re-localization of LDAF1 to the plasma membrane co-recruits seipin and redirects LD formation to these sites. Once LDs form, LDAF1 dissociates from seipin and moves to the LD surface. In the absence of LDAF1, LDs form only at significantly higher cellular TG concentrations. Our data suggest that the LDAF1-seipin complex is the core protein machinery that facilitates LD biogenesis and determines the sites of their formation in the ER.
Keywords: Lipid droplets, triacylglycerol, fat, organelle biogenesis, endoplasmic reticulum, lipodystrophy, Berardinelli-Seip congenital lipodystrophy type 2, TMEM159, Promethin
Graphical Abstract
eTOC Blurb:
Chung et al. identify and characterize an oligomeric LDAF1-seipin protein complex in the endoplasmic reticulum that determines the sites of lipid droplet formation. This complex appears to promote phase separation of triglyceride neutral lipids within the complex, thus defining the sites of lipid droplet formation.
INTRODUCTION
Lipid droplets (LDs) store lipids as precursors of membrane synthesis and as reservoirs of metabolic energy (Henne et al., 2018; Olzmann and Carvalho, 2018; Walther et al., 2017). The chief molecules for energy storage are triacylglycerols (TGs), which provide a sink for highly reduced carbons (Yen et al., 2008). LD formation is linked to the pathogenesis of common metabolic diseases, such as obesity associated metabolic syndrome and atherosclerosis (Krahmer et al., 2013). Knowledge of LD formation also has important implications for industrial applications, such as production of seed oils or biofuels, which require the biogenesis of LDs in the production organism (Farese and Walther, 2009; Liu et al., 2013; Murphy, 2012).
As cellular organelles, LDs are unusual inasmuch as their neutral lipid core forms an oil phase, separated from the aqueous cytosol by a monolayer of phospholipids containing specific proteins (Fujimoto and Parton, 2011; Olzmann and Carvalho, 2018; Walther et al., 2017). LDs form from the endoplasmic reticulum (ER) (Ben M’barek et al., 2017; Choudhary et al., 2015), where neutral lipids, such as TGs, are synthesized (Weiss et al., 1960). Current models of LD formation posit a step-wise process in which TG synthesis is followed by phase separation of TG within the ER bilayer to form TG lenses, with eventual growth of nascent LDs via ripening (Thiam and Forêt, 2016; Walther et al., 2017). How these steps are orchestrated is unknown but presumably requires protein machinery to ensure consistent composition of nascent LDs and to prevent disorganized LD formation. Prior evidence suggested that specific sites in the ER mediate LD formation (Kassan et al., 2013). However, neither identity of the protein(s) involved in determining initial LD formation sites nor how they work is currently known.
The ER protein seipin has emerged as a likely key factor for LD formation. BSCL2, the gene that encodes seipin, was identified by a mutation in Berardinelli-Seip congenital lipodystrophy type 2 in humans (Magré et al., 2001). In the ER, seipin forms an oligomer containing 10–12 subunits, depending on species (Binns et al., 2010; Sui et al., 2018; Yan et al., 2018). Analysis of fluorescently tagged seipin shows that it forms mobile foci in the ER and localizes to sites where LDs associate with the ER to facilitate LD growth (Salo et al., 2016; Wang et al., 2016). Absence of seipin leads to abnormal LDs (Fei et al., 2008; Grippa et al., 2015; Salo et al., 2016; Szymanski et al., 2007; Wang et al., 2016). Notably, at early time points of LD formation, seipin-deficient cells have increased numbers of small LDs that likely coalesce to form the characteristic seipin-deficient phenotype of very large LDs (Fei et al., 2008; Szymanski et al., 2007; Wang et al., 2016). However, these insights into seipin function have not elucidated the molecular machinery involved in initiating LD formation. In particular, where initial TG lenses form relative to seipin oligomers, and how LD formation is generally orchestrated at specific sites in the ER is unclear.
In the current study, we discover that seipin forms a large complex with TMEM159 in the ER. We provide biochemical and cell biological evidence that this complex acts as the machinery that determines where LDs form and defines the sites of initial LD formation. We also uncover evidence that this complex may facilitate the phase transition of TG from membrane-soluble to a droplet, thereby ensuring that LDs form in an organized manner.
RESULTS
TMEM159/LDAF1 forms a complex with seipin in the ER
Models of the seipin structure position a hydrophobic helix of each subunit of the oligomeric ring in the luminal leaflet of the ER (Sui et al., 2018; Yan et al., 2018). The hydrophobic helix is part of the highly conserved luminal domain of seipin (Szymanski et al., 2007) and shows particularly strong sequence conservation among species (Figure 1A and Figure S1). We hypothesized that the high sequence conservation could be due to evolutionary constraints resulting from interaction with a partner protein. To investigate this possibility, we screened for proteins that might interact with seipin via these helices within the ER bilayer. We constructed GFP-tagged variants of seipin lacking either the hydrophobic helix (seipin-ΔHH) or with its transmembrane domains replaced with those from another ER protein, FIT2 (seipin-TM(FIT2)), as a control (Gross et al., 2010; Kadereit et al., 2008). Each of these proteins was stably expressed in SUM159 seipin knockout cells, and each localized to the ER membrane, similar to wild-type seipin (Figures S2A–S2C). Analysis of proteins co-immunoprecipitating with seipin identified a protein, annotated as TMEM159 or promethin (Yu et al., 2004), as highly enriched in purifications of wild-type seipin or seipin-TM(FIT2), but missing when seipin-ΔHH was immunoprecipitated from cells (Figure 1B and Figure S2D). In addition, western blot analyses detected TMEM159 in pull-downs of wildtype seipin or seipin-TM(FIT2), but not of seipin-ΔHH, confirming an interaction between seipin and TMEM159 and suggesting that the hydrophobic helix is required for seipin to interact with TMEM159 (Figure 1C). TMEM159 encodes a 161-amino acid protein with four, evolutionarily conserved, putative membrane-spanning helices in the middle of the protein (Rosetta and TOPCONS servers). TMEM159 has not been extensively studied, but the murine transcript was identified as upregulated more than 70-fold in fatty liver caused by PPARγ overexpression (Yu et al., 2004).
Figure 1. TMEM159/LDAF1 forms a complex with seipin in the ER.
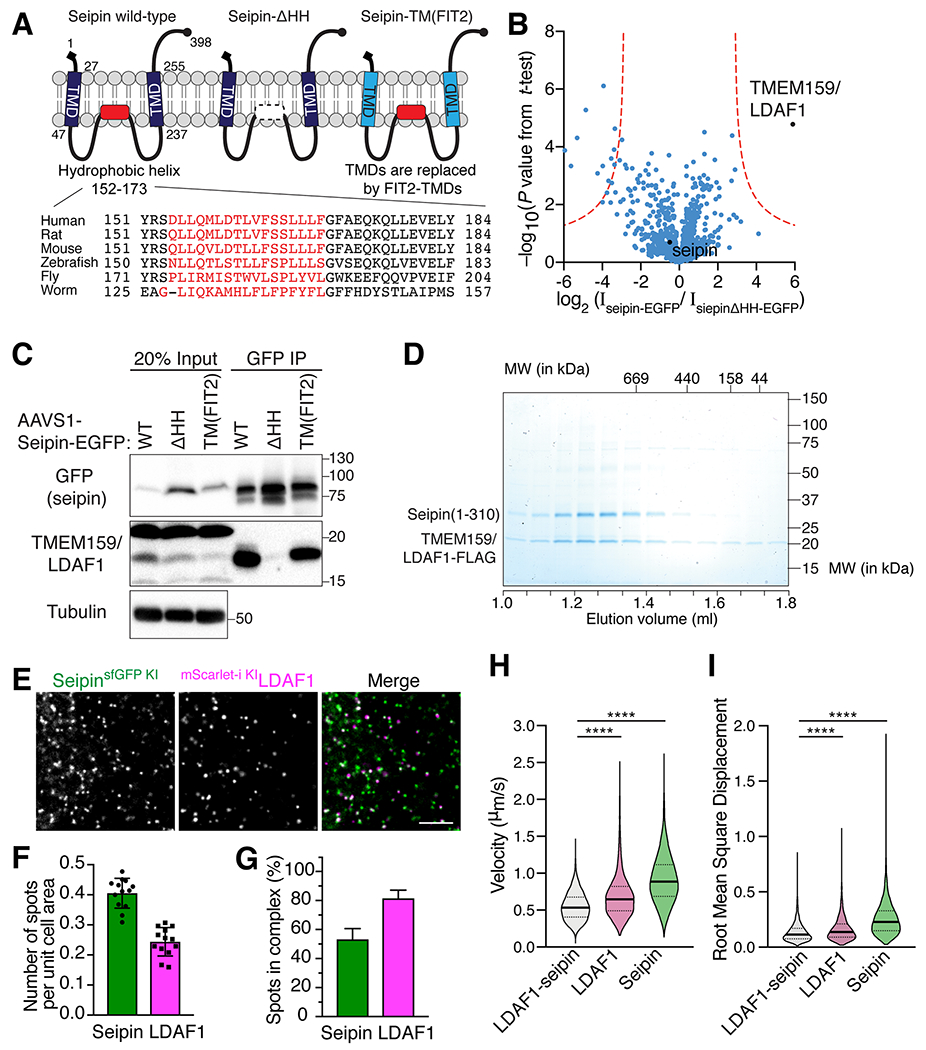
(A) Domain structure of seipin and mutant versions used for the experiment in (B) and (C). Lower panel shows the evolutionary conservation of a hydrophobic helix portion of seipin (red). TMD, transmembrane domain. (B) Volcano plots of proteins associating with seipin-EGFP versus seipin-ΔHH-EGFP; data are from a label-free proteomics analysis of anti-GFP immunoprecipitates from SUM159 seipin KO cells stably expressing seipin-EGFP or seipin-ΔHH-EGFP. Logarithmic ratios of protein intensities are plotted against negative logarithmic P values of two-tailed Student’s t-test, equal variance, performed from n = 3 independent experiments. (C) Immunoblot analysis of the LDAF1-seipin complex in anti-GFP immunoprecipitates from SUM159 cells used for mass-spec analysis shown in (B). (D) Seipin co-purifies and co-migrates with LDAF1-FLAG as a complex on a size fractionation column (Superose 6), as shown by SDS-PAGE analysis of elution fractions. Proteins were visualized by Coomassie blue staining. (E) HILO imaging of live SUM159 cells expressing endogenously fluorescent-tagged seipin (with superfolder GFP) and LDAF1 (with mScarlet-i) at their gene loci. Scale bar, 5 μm. (F) Quantification of number of protein foci shown in (E). (mean ± SD, n = 13 fields of view). (G) Bar graph showing relative fractions analyzed in (F) of seipin or LDAF1 colocalizing with LDAF1 or seipin, respectively. Mean ± SD, n = 13 fields of view. (H and I) Violin plots showing velocity (H) and root mean square distance (I) of seipin and LDAF1 foci analyzed from HILO imaging of live SUM159 cells as in (E), but with simultaneous time-lapse of green and red channels (frame interval = ~ 0.15 sec). Movement of seipin and LDAF1 foci were tracked with FIJI plugin “TrackMate” and analyzed as described in Materials and Methods. Median with interquartile range, p < 0.0001 calculated by an unpaired t-test with Welch’s correction (for non-equal variance).
The recombinantly produced and purified TMEM159-seipin complex (isolated by affinity purification of TMEM159) appeared to contain stochiometric amounts of each protein (Figure 1D). Negative-stain electron microscopy images showed 11 subunits of these complexes, similar to what was reported for the human seipin oligomeric structure (Yan et al., 2018), indicating that the seipin oligomer remains intact with TMEM159 present (Figure S2E). Based on our findings described below, we rename TMEM159 as lipid droplet assembly protein-1 (LDAF1).
When we fluorescently tagged seipin and LDAF1 by genome engineering of their endogenous genomic loci in SUM159 cells (Ran et al., 2013) (Figure S3A), we found both proteins form foci in the ER with extensive colocalization (Figure 1E and Figure S3A). Cells contained more seipin foci than LDAF1 foci (Figure 1F). Roughly half of the seipin foci colocalized with LDAF1, whereas more than 80% of LDAF1 foci overlapped with those of seipin (Figure 1G). Their colocalization was not affected by inhibition of TG synthesis [using inhibitors of acyl CoA:diacylglycerol acyltransferase 1 (DGAT1) and DGAT2], suggesting that the LDAF1-seipin association is not mediated by TG-binding of each protein (Figures S3B–S3D). To analyze dynamics of endogenously fluorescent protein-tagged LDAF1 and seipin, we used highly inclined and laminated optical sheet (HILO) microscopy (Tokunaga et al., 2008). Illumination by a highly inclined and thin light beam increases image intensity and decreases background intensity, yielding a signal/background ratio roughly eightfold greater than that of epi-illumination, enabling us to track LDAF1 and seipin with high temporal resolution without photobleaching. The simultaneous, multi-color, live HILO imaging showed that protein foci containing seipin, LDAF1, or both proteins moved rapidly within the ER (Video S1). The protein foci containing only seipin moved faster than those containing only LDAF1 or both proteins (Figures 1H and 1I). Previous studies showed that seipin foci become less mobile when associated with LD (Salo et al., 2016; Wang et al., 2016), suggesting that this population of seipin may reflect the complex with LDAF1.
The LDAF1-seipin complex defines LD formation sites
To explore the possibility of LDAF1 involvement in LD formation, we next analyzed the localization of LDAF1 in relationship to seipin during LD formation and maturation. For this, we further introduced a marker of initial LD formation by tagging endogenous PLIN3 with a HaloTag in SUM159 cells harboring endogenously tagged seipin and LDAF1 (Figure S3A). We chose PLIN3 as a marker for nascent LD formation because comparison of endogenously HaloTag-tagged PLIN3 with other markers, including BODIPY493/503, BODIPY-labeled fatty acids, or GFP-LiveDrop (Wang et al., 2016), showed HaloTag-PLIN3 as the earliest and most sensitive marker of LD formation (Figures S4A–S4C). Further, PLIN3 can be engineered as an endogenously tagged protein, minimizing interference of added components to the system.
Previously, the kinetics and dynamics of LD biogenesis in the ER bilayer were examined by live cell imaging (Kassan et al., 2013; Salo et al., 2016; Wang et al., 2016), however, the temporal resolution and sensitivity of LD markers were not sufficient to detect the moment of LD formation with respect to the timing of seipin recruitment to nascent LDs (Salo et al., 2016; Wang et al., 2016). To overcome these problems and to image the earliest stages of LD formation, we performed HILO microscopy of cells expressing endogenously HaloTag-tagged PLIN3. We found that the vast majority of LDs formed at spots containing both seipin and LDAF1 (~80%; Figures 2A and 2B). In contrast, only ~ 5% of newly formed LDs localized to foci in which we detected seipin alone, ~10% to foci with LDAF1 alone, and ~4% of foci had neither protein (Figure 2B). It is unclear if the latter LDs lacked one or both of the proteins, or if proteins were simply undetected in the plane of imaging. Following LDAF1-seipin foci over time showed that their occupancy with forming LDs steadily increased during early LD formation (Figure 2C and Figures S4D–S4E).
Figure 2. The LDAF1-seipin complex defines LD formation sites.
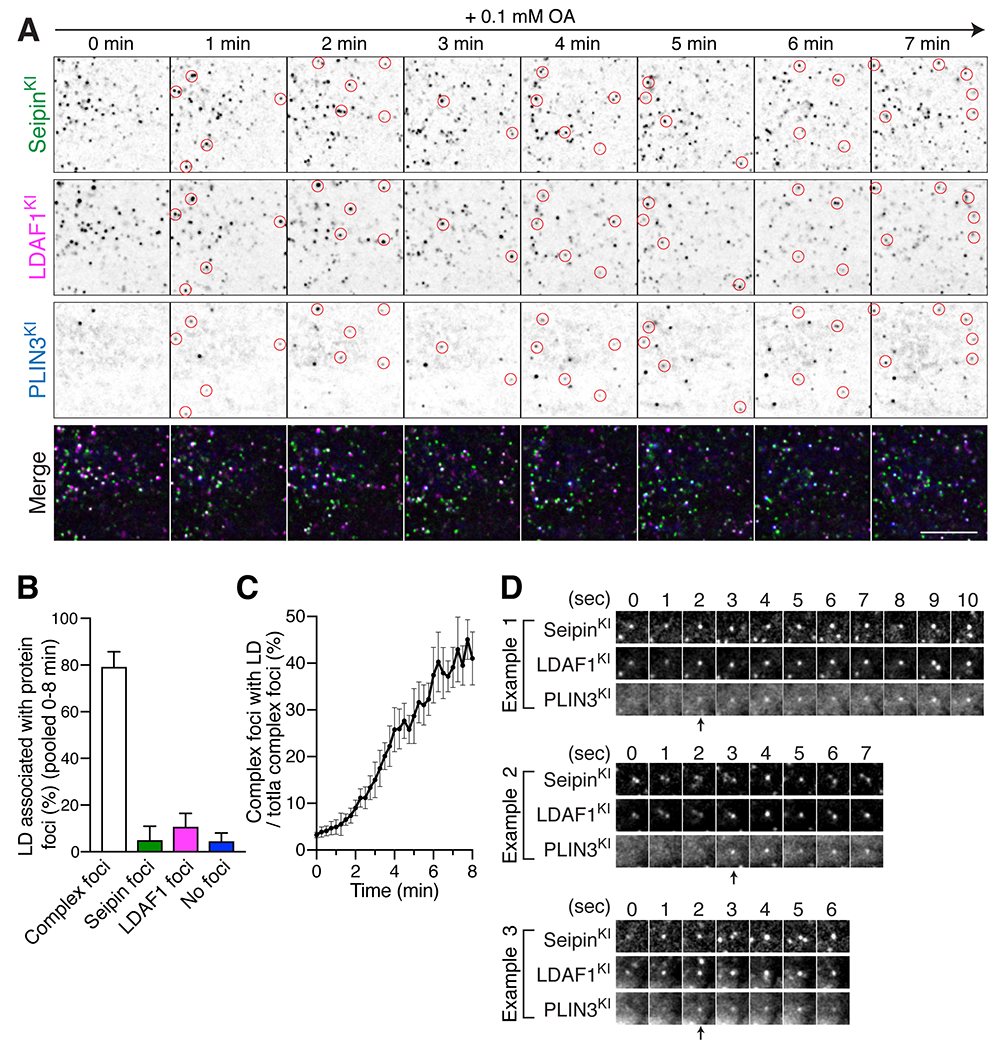
HILO imaging of live SUM159 cells with fluorescent proteins tagged at the seipin locus (sfGFP), LDAF1 locus (mScarlet-i), and PLIN3 locus (HaloTag). Cells were treated with 0.1 mM oleic acid for 3 mins prior to image acquisition shown in (A to D). (A) A representative image shows the localization pattern of endogenous seipin, LDAF1, and PLIN3 every minute after oleate incubation. Red circles indicate newly formed PLIN3-positive LDs and their corresponding positions of seipin and LDAF1 in each frame. Scale bar; 10 μm. (B) A bar graph showing relative fractions of LDs that co-localize with protein foci of seipin and/or LDAF1, as assessed with a TIRF microscope with HILO illumination during LD formation. The LD populations were analyzed at 15-sec intervals for 8 mins. Each timepoint was analyzed and pooled together. Shown are 40 timepoints of individual time-lapse, n = 4 cells, mean ± SD. (C) A graph showing the relative fraction of protein foci composed of seipin and LDAF1 that co-localized with PLIN3 (LD marker) in same time-lapses analyzed in (B). n = 4 cells, mean ± SD. (D) A representative gallery of images showing LD formation at foci where seipin and LDAF1 co-localized.
These findings suggest that the LDAF1-seipin complex determines where LDs form. To further test this possibility, and to determine if we could observe LDs forming at LDAF1-seipin complexes, we analyzed LD formation using HILO microscopy with higher temporal resolution, one-second time intervals. We found that instances of LD formation, as assayed by PLIN3 detection at sites of LD formation, occurred in each case at a pre-existing LDAF1-seipin complexes (Figure 2D and Figure S5). Specifically, when we analyzed LDAF1-seipin complexes over time, we found abundant cases of continued colocalization of PLIN3 during the entire time of acquisition, as well as ~10% instances where LDs, marked by PLIN3, formed at the LDAF1-seipin complex during the recorded time period (Figure 2D and Figure S5). In contrast, we never observed PLIN3 appearing at a seipin focus that did not have LDAF1 in these experiments.
The hypothesis that the LDAF1-seipin complex defines LD formation sites predicts that relocalizing this complex to a region of the cell where they are normally not found will result in LDs forming at these sites. To test this, we acutely recruited LDAF1 to ER-plasma membrane (PM) contact sites using inducible heterodimerization of FK506-binding protein (FKBP) and FKBP12 rapamycin-binding protein (FRB) (Muthuswamy et al., 1999) and monitored LD formation at ER-PM contact sites by total internal reflection microscopy (TIRF). For this, we co-expressed FKBP-fused LDAF1-mScarlet-i (LDAF1-mScarlet-i-FKBP) and a PM membrane bait (PM-FRB-TagBFP) containing the palmitoylation sequence of human GAP43 protein (Varnai et al., 2006) in cells with endogenously tagged seipin and PLIN3 (Figure 3A). Upon the addition of a hetero-dimerizer (rapalog), a population of LDAF1 foci was rapidly recruited to the PM (Figure 3B). In most cases, endogenous seipin was also co-recruited to the LDAF1 foci at the PM (Figures 3B and 3C), consistent with the model that these proteins form a macromolecular complex.
Figure 3. Recruitment of LDAF1 to the ER-PM contacts results in LD formation at LDAF1-seipin complex sites.
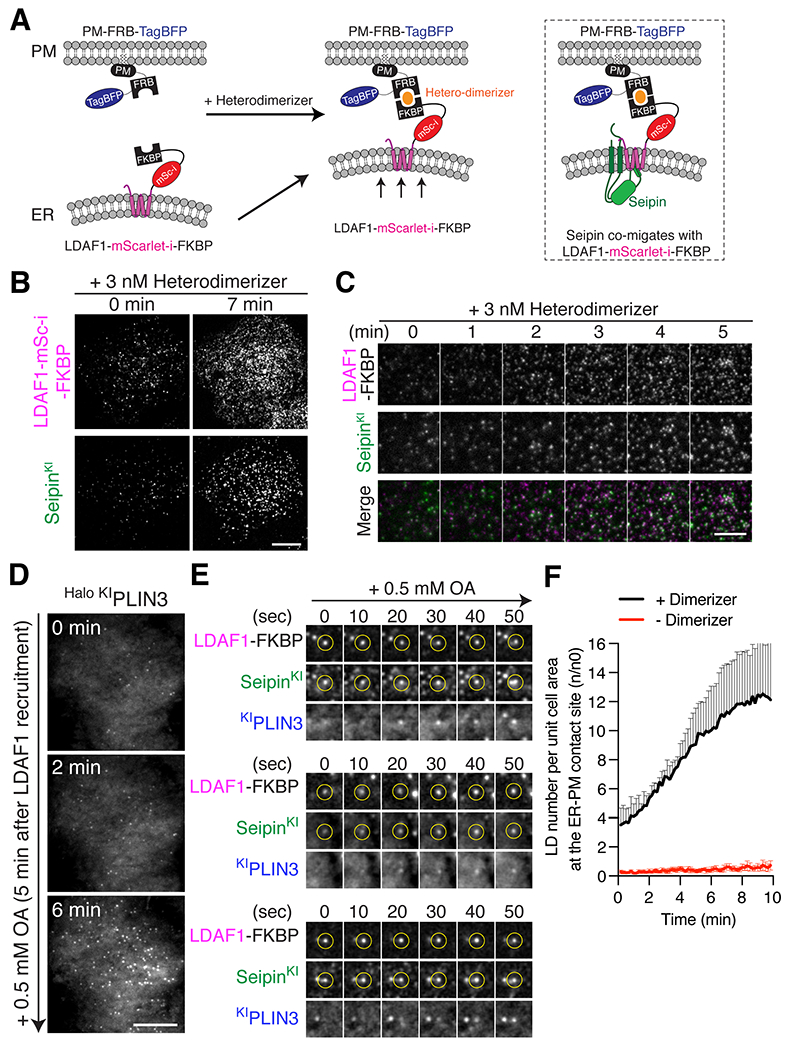
(A) Cartoon depicting the constructs used for the heterodimerizer-dependent acute LDAF1 recruitment assay. Rapalog triggers dimerization of LDAF1-mScarlet-i-FKBP with PM-FRB-TagBFP and thus induces formation of ER-PM tethers. Right panel depicts co-migration of seipin to ER-PM contacts as a complex with LDAF1-mScarlet-i-FKBP. (B and C) TIRF live microscopy showing that recruitment of LDAF1-mScarlet-i-FKBP to the PM with 3 nM heterodimerizer induces co-migration of endogenous seipin to ER-PM contacts. Scale bars, 10 μm (B) and 5 μm (C). (D to F) TIRF live microscopy showing formation of PLIN3-positive LDs at ER-PM contacts after LDAF1 recruitment to the PM. The cells were co-transfected with LDAF1-mScarlet-i-FKBP and PM-FRB-TagBFP and pre-incubated with 3 nM heterodimerizer for 10 mins to induce LDAF1 recruitment to the PM. To induce LD formation, the cells were incubated with 0.5 mM oleic acid. Representative image showing LD formation at ER-PM contact sites (D). Representative time-lapse galleries show formation of LDs at the pre-existing LDAF1-seipin-positive foci (E). Scale bar, 10 μm. (F) Quantification of PLIN3-postiive LD numbers in the TIRF fields after addition of 0.5 mM OA. Cells were either pre-incubated with heterodimerizer (black line) or without heterodimerizer (red line). Mean ± SEM.
The recruitment of LDAF1-seipin complexes to the plasma membrane facilitated tracking of initial LD formation by TIRF microscopy. Upon oleate incubation, LDs formed mostly at sites of the LDAF1-seipin complex, but not at foci of either LDAF1 or seipin alone (Figures 3D and 3E, Video S2). In contrast, expression of the LDAF1-dimerization module without the heterodimerizer treatment was unable to induce LD formation at ER-PM contact sites, indicating a requirement of LDAF1-seipin complex in initial LD formation (Figure 3F).
Triglycerides copurify with the LDAF1-seipin complex
The hypothesis that LDs form in or at the LDAF1-seipin complex predicts that TGs accumulate at this site during LD formation. To test this, we examined the LDAF1-seipin complex [purified to apparent homogeneity from mammalian cells by immunoprecipitating LDAF1 (Figure 1D)] by cryo-electron microscopy (cryo-EM). Remarkably, we found that most LDAF1-seipin particles had micelles with high curvature, compared with the flat micelles containing only seipin (Yan et al., 2018) (Figures 4A and 4B). To test whether the LDAF1-seipin particles contain TG, we extracted lipids from the purified complexes and analyzed them by thin-layer chromatography. Purified LDAF1-seipin complexes contained TG that was reduced or increased by addition of DGAT inhibitors or oleic acid to the cell culture medium, respectively (Figure 4C). In contrast, seipin complexes purified without LDAF1 did not contain TG (Figure 4C), indicating that that TG accumulation occurs only in the LDAF1-seipin complex. Our cryo-EM data was sufficient to resolve the luminal domain of seipin to an average resolution of 4.2 Å (Figures S6A–S6D), but LDAF1 was not seen, likely because LDAF1 was unordered in the extended micelle. Fitting the previously published model of human seipin (Yan et al., 2018) into the well resolved luminal domain of our LDAF1-seipin structure showed excellent agreement (Figure S6E).
Figure 4. Triglycerides accumulate at LDAF1-seipin complexes.
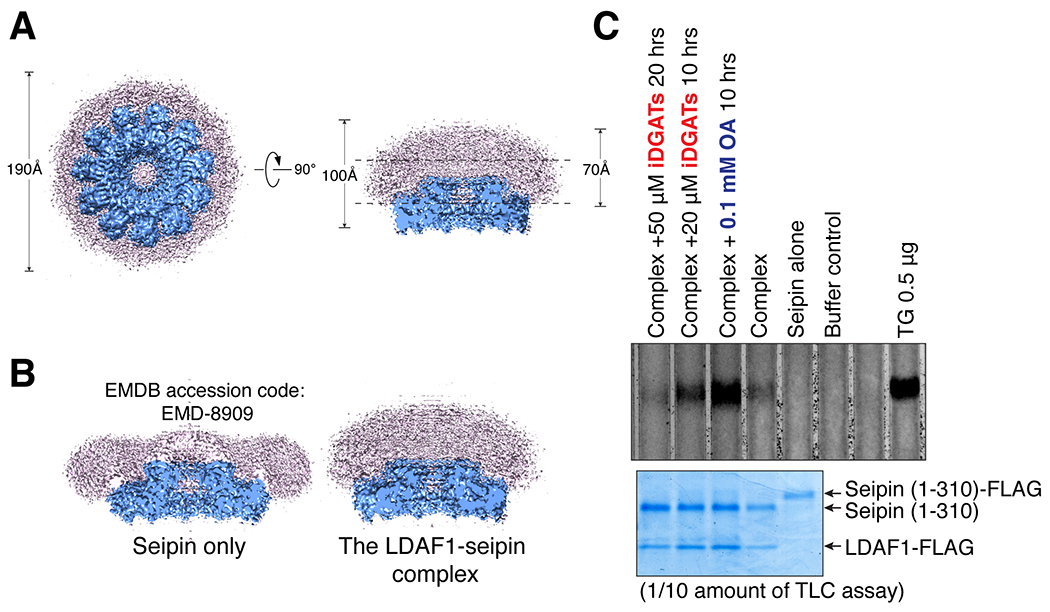
(A) Unsharpened (pink) and sharpened (blue) cryo-EM density maps of a LDAF1-seipin complex. The dotted lines in the side view indicate a normal ER bilayer thickness (upper right panel) and its approximate location. (B) A comparison of cryo-EM density maps of human seipin only ((Yan et al., 2018) and LDAF1-seipin complex (this study) showing that the associated micelle has higher degree of curvature when purified with LDAF1. (C) Thin-layer chromatography (upper panel) showing TGs in purified seipin only or the LDAF1-seipin complex co-purified in Expi239F cells with LDAF1-FLAG. Where noted, cells were pre-incubated with inhibitors of DGAT1 and DGAT2 (iDGATs) or 0.1 mM oleic acid prior to protein purification. Coomassie blue staining (lower panel) showing protein loading controls used in the chromatography in upper panel. Triolein is used as a TG standard.
LDAF1 dissociates from seipin upon LD formation and coats the surface of nascent LDs
The features of the micelle with high curvature in the cryo-EM analysis suggests the presence of TGs in the complex, with LDAF1 possibly dissociating from seipin to reside in the nascent LD monolayer. We therefore examined how seipin and LDAF1 behave during LD maturation. Confocal microscopy of endogenously fluorescent protein-tagged seipin and LDAF1 showed that they co-localized during the initial stage of LD formation, but LDAF1 dissociated from seipin and relocalized to LD surfaces during LD maturation (Figure 5A). By 18h of LD formation, the ER pool of LDAF1 was depleted, and most LDAF1 had relocalized to LD surfaces (Figure 5B). As assessed by confocal microscopy, this pool of LDAF1 co-localized with the LD protein PLIN3 but not with the ER protein Sec61β, clarifying its translocation to LD monolayer (Figures 5C and 5D). In agreement with localization of most LDAF1 on mature LDs, LDAF1 was recently identified as an LD protein in proximity biotinylation experiments with LD-targeted APEX2 (Bersuker et al., 2018). In contrast, seipin remained localized to the contact site between the LD and the ER as accessed by its co-localization with an ER marker protein, ERoxBFP (Figure 5E). Dissociation of seipin and LDAF1 during LD maturation was supported by biochemical experiments: seipin efficiently precipitated LDAF1 in cells without LDs, but the interaction was lost when LD formation was induced by incubating cells with oleate-containing culture medium (Figure 5F). In addition, during LD formation, cellular LDAF1 levels increased (Figure 5F), possibly due to its stabilization on the LD surface, as has been reported for other LD proteins, such as PLIN3 (Bulankina et al., 2009). To determine which portion of LDAF1 is required for its subcellular localization to LDs, we generated truncation constructs of LDAF1 consisting of the N-terminal region, the putative membrane-spanning helices, or the C-terminal region of the protein (Figure 5G). Within the ~20-kDa LDAF1 protein, a segment comprising four possible membrane-spanning helices, which is evolutionarily conserved, was sufficient for colocalizing LDAF1 with seipin and for its translocation to the LD surface (Figures 5H and 5I).
Figure 5. LDAF1 dissociates from seipin and coats the surface of forming LDs.
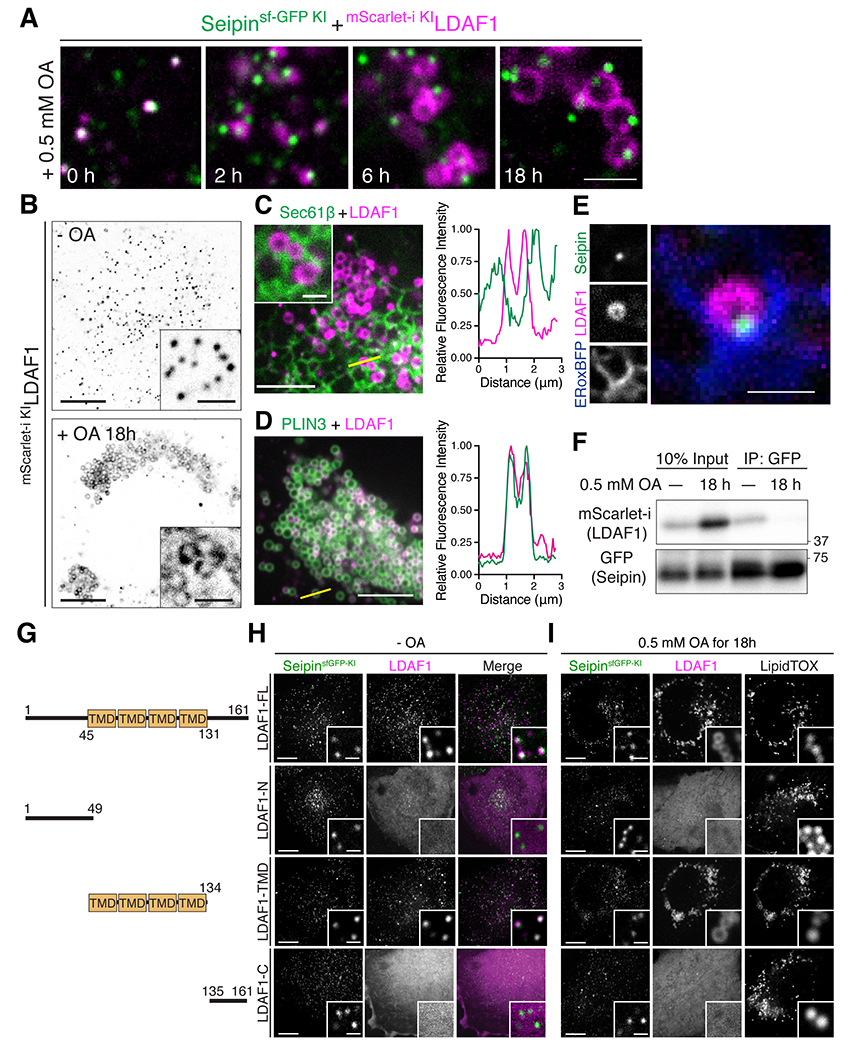
(A) Confocal imaging of fixed SUM159 cells with endogenously fluorescent proteins tagged at seipin (with sfGFP) and LDAF1 (with mScarlet-i) loci. Cells were pre-incubated with 0.5 mM oleic acid as indicated. Scale bar, 2 μm. (B) Confocal imaging of live SUIM159 cells as in (A), but presented in a view of whole cell to show translocation of LDAF1 from the ER to LDs at LD maturation. Scale bars: full-size, 10 μm; insets, 2 μm. (C and D) Confocal imaging of fixed SUM159 cells transiently transfected LDAF1-mScarlet-i together with EGFP-Sec61β (C) or EGFP-PLIN3 (D). Right panel shows line scan profiles of the yellow line drew on in the left panel. Cells were pre-incubated with 0.5 mM oleic acid for 18 h before fixation. Scale bar: 5 μm. (E) Confocal imaging of fixed SUM159 cells in (A) but transfected with ERoxBFP showing seipin foci at the ER membrane while LDAF1 coats LDs. The cell was pre-incubated with 0.5 mM oleic acid for 18 h before fixation. Scale bar, 1 μm. (F) Immunoblot analysis of SUM159 cell as in (A) showing dissociation of LDAF1 from LDAF1-seipin complex during LD formation. To induce LD formation, cells were pre-incubated with 0.5 mM oleic acid for 18 hrs. To avoid false-positive detection of protein interactions caused by co-migration of proteins on LDs, the immunoprecipitated samples were extensively washed (100-folds bead volume). (G-I) Confocal live imaging of SUM159 cells endogenously sfGFP-tagged in seipin locus transiently expressing the truncation constructs depicted in (G). Images reveal that the membrane-spanning segments of LDAF1 are required for its co-localization with seipin (in the absence of LDs) (H) and its translocation onto the LD surface (in the presence of LDs, LDs were stained with LipidTOX) (I). Scale bars: full-size, 10 μm; insets, 1 μm.
To determine the membrane topology of LDAF1, we performed fluorescence protease protection assays with LDAF1 fused to EGFP either at the N- or C terminus (Lorenz et al., 2006) . While the luminal ER marker mCherry-ER3 was protected from proteinase K treatment after selective permeabilization of the plasma membrane by digitonin (applied in a low concentration, a treatment that does not permeabilize the ER membrane), EGFP signals of both EGFP-LDAF1 and LDAF-EGFP were rapidly depleted (Figure S7A–S7C). This indicates that both N- and C- terminus of LADF1 reside on the cytoplasmic side of the ER membrane. Since LDAF1 overwise contains mainly highly hydrophobic, membrane-embedded domains that lack hydrophilic residues, we suspect that LDAF1 forms a double hairpin-type molecule as shown in Figure S7D. An alignment of numerous species with obvious orthologues is consistent with high conservation of hydrophobic residues in the potential double hairpin region and also reveals a conserved glutamic acid residue that may localize to the cytosolic side of the membrane (Figure S7D).
Inspection of these putative transmembrane segments of LDAF1 revealed that their length is compatible with formation of two hairpins that penetrate but do not cross entirely the bilayer, as shown for the hydrophobic membrane stretches of several other ER proteins, such as the reticulons (Voeltz et al., 2006) and the membrane-embedded hairpin of GPAT4 (Wilfling et al., 2013). Therefore, these results suggest that LDAF1 interacts with the hydrophobic helix of seipin in the ER bilayer and dissociation of the complex during LD formation triggers translocation of LDAF1 onto the LD monolayer via its membrane-embedded hairpin topology.
LD formation is impaired with LDAF1 depletion
To further analyze the function of LDAF1 in LD formation, we generated SUM159 cells that lack either seipin or LDAF1, the latter in cells with endogenously fluorescent protein-tagged seipin or in cells lacking seipin (Wang et al., 2016). In seipin-deficient cells, we found LDAF1 to be absent, effectively rendering them seipin and LDAF1 double-knockout cells (Figure 6A). Thus, previous studies of seipin deficiency (Salo et al., 2016; Wang et al., 2016) likely reflect a situation in which both proteins are missing. In contrast, deletion of LDAF1 led to increased seipin levels (Figure 6B), reflected as an increase of number of seipin foci (Figure 6C).
Figure 6. LD formation is impaired with LDAF1 depletion.
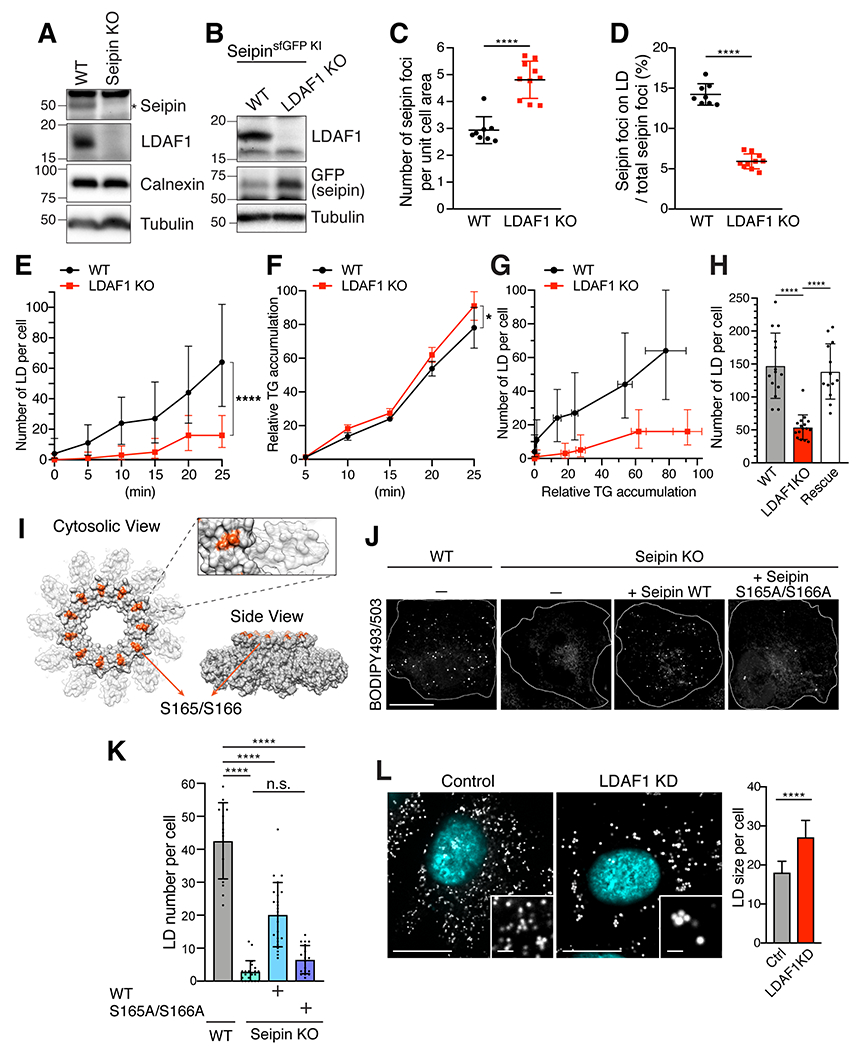
(A) Immunoblot analysis of seipin and LDAF1 in wild-type (WT) and seipin KO SUM159 cells. (B) Immunoblot analysis of seipin and LDAF1 in WT and LDAF1 KO SUM159 cells. Both cells were endogenously sfGFP-tagged at seipin locus. (C and D) Analysis from confocal imaging of fixed SUM159 cells used in (B). Mean ± SD, n ≥ 8 field-of-view; p < 0.0001 was calculated with an unpaired t-test. Quantification of seipin foci (sfGFP) (C) and seipin foci co-localized with LDs (stained with AUTOdot). The cells were pre-incubated with 0.5 mM oleic acid for 20 mins before fixation. (E) Quantification of number of LDs per cell in wild-type and LDAF1 KO SUM159 cells. LDs were stained with BODIPY493/503. The cells were pre-incubated with 0.5 mM oleic acid for specific times indicated in the graph. The images were taken on high-throughput confocal microscope. n > 500 cells, median with interquartile range. p < 0.0001 was calculated by two-way ANOVA with repeated measurements (F) WT and LDAF1 KO SUM 159 cells were pulse-labeled with [14C]-OA, and incorporation into triacylglycerol (TG) was measured over time after 0.5 mM oleate loading by thin-layer chromatography. Values were calculated relative to LDAF1 KO cells highest value at 25 min (mean ± SD, n = 3 independent experiments, p < 0.05 was calculated by two-way ANOVA with repeated measurements). (G) LDAF1 KO cells show a delay in LD formation compared to WT for a similar amount of accumulated TG. Average LD number per cell measured in (E) was normalized by TG amount calculated in (F). (H) Bar graph showing an average number of LDs per cells in wild-type, LDAF1 KO, and LDAF1 KO with transient expression of mScarlet-i-LDAF1 (Rescue). Mean ±, n ≥ 13 cells, p < 0.0001 calculated by unpaired t-test. The cells were incubated for 30 mins with 0.5 mM oleic acids. (I) Cryo-EM density map of seipin showing the position of serine 165 and serine 166 (shown in red). (J) Confocal imaging of fixed WT and seipin KO SUM159 cells transiently transfected with seipin WT-Halo or seipin S165A/S166A-Halo. LDs were stained with BODIPY493/503. The cells were pre-incubated with 0.05 mM OA for 20 mins. (K) Quantification of number of LDs per cell used in (J) (mean ±, n ≥ 14 cells, ****p < 0.0001 calculated by unpaired t-test). (L) Confocal imaging of LDs in fixed Control and LDAF1 siRNA-treated SUM159 cells. The cells were treated with 20 nM siRNA for 72 h. The cells were pre-incubated with 0.5 mM OA for 2 h before fixation. The images were taken on high-throughput confocal microscope. Scale bar; full-size, 20 μm; insets, 2 μm. A panel in the right shows quantification of average size of LD per cell as shown in images in the left (n > 500 cells, median with interquartile range, p < 0.0001 calculated by an unpaired Welch’s t-test).
Markedly fewer seipin foci productively formed LDs when LDAF1 knockout cells were incubated with oleate-containing medium (Figure 6D). Moreover, quantitative analyses of LD formation revealed a striking defect in early LD formation. LDAF1 knockout cells exhibited delayed LD formation, with 80% reduced numbers of LDs formed 25 mins after addition of oleic acid compared with wild-type cells (Figure 6E). During this time period, LDAF1 knockout cells had similar levels of TG accumulation (Figure 6F). Notably, for a given amount of cellular TG, the number of LDs formed was markedly reduced in LDAF1 knockout cells (Figure 6G), consistent with the hypothesis that the LDAF1-seipin complex catalyzes formation of a droplet from membrane soluble TG. The LD formation phenotype was efficiently rescued when wildtype LDAF1 was re-introduced into knockout cells by transfection (Figure 6H and Figure S7E). Moreover, conserved serine residues in the seipin hydrophobic helix oriented towards the likely position of LDAF1 were required for normal LD biogenesis, further arguing that both proteins cooperate in initial LD formation (Figures 6I–6K). The phenotype of LDAF1 deficiency on early LDs propagated to later time points of LD biogenesis, as cells depleted (Figure S7F) or deleted for LDAF1 showed fewer and larger LDs after 2 hrs of LD formation (Figure 6L and Figures S7G–S7K).
DISCUSSION
The formation of LDs is a biophysical process that entails the formation of an organic oil phase within the ER bilayer. Prior studies provided evidence that LD formation occurs at defined sites in the ER, possibly to minimize disruption of other ER functions (Kassan et al., 2013). However, how the sites of LD formation are determined has remained unclear. Seipin was shown to be crucial for normal LD formation (Fei et al., 2008; Grippa et al., 2015; Salo et al., 2016; Szymanski et al., 2007; Wang et al., 2016), but its relationship to sites of initial LD formation and its mechanistic action has remained enigmatic. Previous studies found that seipin oligomers capture LiveDrop foci (Wang et al., 2016), which was interpreted as seipin binding to pre-formed lenses and facilitating their growth. Data from the current study change our view of LD formation. Capitalizing on highly sensitive HILO microscopy, we now show that a protein complex containing LDAF1 and seipin determines sites of LD formation from the ER. We discover that LDAF1 is a crucial activator of seipin in the ER, catalyzing TG accumulation and normal LD formation. Consistent with this hypothesis, we show that LD formation is impaired when LDAF1 is absent. Further, we find that seipin deficiency represents a situation in which the entire LDAF1-seipin complex is absent, as seipin deficiency apparently destabilizes LDAF1. The differences in phenotypes of seipin and LDAF1 knockouts suggest that the two proteins may have distinct biochemical functions, or that in the case of expression of seipin alone (in the LDAF1 knockout), there is an indirect effect on LD formation.
There has been little known previously about LDAF1. The murine gene encoding LDAF1, Tmem159, was originally identified as a gene that was upregulated in hepatic steatosis caused by peroxisome-proliferator activated receptor-gamma (PPARγ) overexpression in PPARα knockout mice (Yu et al., 2004). Inasmuch as PPARγ is a key regulator of adipogenesis and lipid metabolism, particularly in adipocytes, this is consistent with a function of LDAF1 in LD biogenesis. The human LDAF1 gene, TMEM159 encodes a 161-amino acid protein with numerous membrane-spanning domains that is expressed in many tissues (Yu et al., 2004). Our data suggest that the protein may encode a membrane-embedded, double-hairpin protein, with both the N- and C-terminus in the cytosol, that localizes within the seipin toroid structure (Sui et al., 2018; Yan et al., 2018). If LDAF1 and seipin have 1:1 stoichiometry, the LDAF1-seipin complex in humans, containing 11 copies of each protein, would be predicted to contain a remarkable 66 membrane-spanning hydrophobic domains within a toroid complex of ~16-nm diameter. Such a densely packed complex of hydrophobic membrane-spanning helices could serve as an ideal platform for nucleation of TG molecules. We note that this machinery and LDAF1 are expressed widely in mammalian tissues (Yu et al., 2004) and are conserved in many species (Table S2). In S. cerevisiae, LD organization (Ldo) proteins were identified in a screen for LD phenotypes (Eisenberg-Bord et al., 2018) and as interactors of yeast seipin (Fld1) (Pagac et al., 2016; Teixeira et al., 2018; Castro et al., 2019). These proteins were reported to have remote homology with LDAF1 (Eisenberg-Bord et al., 2018; Castro et al., 2019), although we did not find this in our structure-based homology searches (https://toolkit.tuebingen.mpg.de/#/tools/hhpred) (Söding et al., 2005), BLAST searches, or sequence alignments (Table S2). Nevertheless, it is conceivable that Ldo proteins function analogously to catalyze LD formation in yeast.
Based on these findings, we propose a model for LD formation at LDAF1-seipin complexes (Figure 7). This model contrasts with a previous model in which seipin oligomers capture TG lenses after they form (Wang et al., 2016) and shares similarity to what was previously suggested as the “vent hypothesis” (Binns et al., 2010; Cartwright and Goodman, 2012). In this model, the LDAF1-seipin complex determines the sites of and catalyzes LD formation. How might it do this? One possibly is by facilitating the TG phase transition within the ER bilayer, for instance providing a space in the core of the complex that excludes phospholipids and thus allows for TG molecules to interact with each other, rather than with the sidechains of membrane phospholipids. As the nascent LD grows within the complex, it would push apart seipin from LDAF1, resulting in a structure similar to the curved micelles observed by cryo-EM (see Figure 4A). Thus, if a membrane normally can hold up to ~2.8% TG before becoming saturated (Hamilton and Small, 1981), TG oil-phase formation may occur at a lower membrane TG concentration in the presence of the LDAF1-seipin complex. This could prevent LD formation from occurring randomly within the ER, as it appears to happen with seipin (i.e., LDAF-seipin complex) deficiency (Salo et al., 2016; Wang et al., 2016). Supporting this, we found that LD formation did not occur as efficiently in the absence of LDAF1; fewer LDs formed for a given amount of TG. Thus, LDAF1 appears to lower the energy barrier for LD formation, allowing it to occur at lower TG concentration, which is a hallmark of catalysis.
Figure 7. Model LD formation at LDAF1-seipin complex sites.
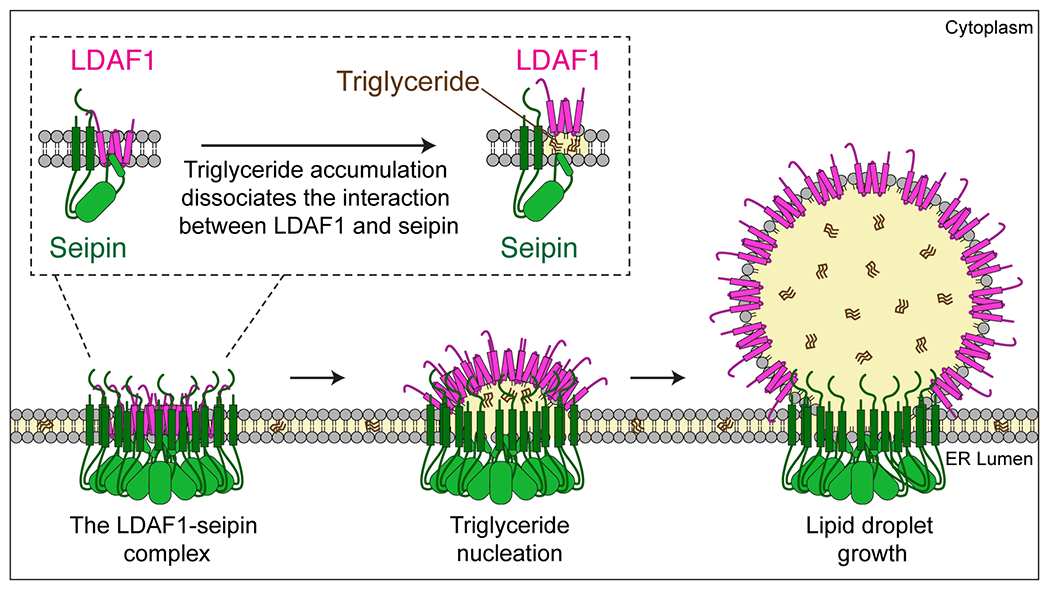
Schematic representation of a model of how the LDAF1-seipin complex functions in LD formation in the ER. Oligomers of LDAF1 and seipin form a very large complex (~600 kDa) with as many as 66 transmembrane domains [11-mer of seipin (2x TMDs) + LDAF1 (2x double hairpins = 4 TMDs)] and 11 seipin hydrophobic helices in the ER bilayer. This assembly of hydrophobic helices may serve to promote nucleation and TG lens formation. TG accumulation in the complex causes dissociation of the complex and redistribution and translocation of LDAF1 to the growing LD surface as LDs grow. LDAF1 redistribution to LD surfaces may lower LD surface tension, aiding efficient budding and growth of LDs.
Another possibility is that the LDAF1-seipin complex defines the sites of LD formation through local changes in the membrane lipid environment. Because the structure of seipin shares similarities to the NPC2 lipid-binding proteins (Yan et al., 2018; Sui et al., 2018) and has been reported to bind negatively charged lipids (Yan et al., 2018), it is possible that the LDAF1-seipin complex modulates localized lipid synthesis or transport at these sites during LD formation. In such a model, the 44 transmembrane domains provided by LDAF1 to the complex could form a type of membrane channel for lipid (e.g., TG or phospholipid) transfer to nascent LDs. Such a model is not exclusive of the idea that the complex catalyzes TG droplet nucleation and needs further testing.
Finally, as nascent LDs bud from the ER membrane toward the cytosol, LDAF1 dissociates from seipin and re-localizes to the LD surface, where it may have surface modulating properties (Thiam and Forêt, 2016). Further, it appears that a pool of LDAF1 in the ER but not initially complexed with seipin may localize to LDs, as we found that the (non-LD) ER pool of LDAF1 becomes increasingly depleted during LD formation. An attractive possibility consistent with previous data on LD formation (Kassan et al., 2013; Wang et al., 2016) is that the sequestering of LDAF1 on LDs prevents the formation of new LDs once an initial wave of biogenesis occurs that consumes the ER pool of LDAF1. Thus, LDAF1 levels might correlate with cellular LD numbers.
Collectively, our data identify the LDAF1-seipin complex as an evolutionarily conserved core machinery that generates LDs from the ER and suggest a model for the function of ER-localized proteins in initiating and governing this fundamental process.
STAR METHODS
Lead contact and materials availability
Further information and requests for resources and reagents should be directed to and will be fulfilled by the Lead Contact, Robert V. Farese Jr. (robert@hsph.harvard.edu). Requests will be handled according to the Harvard T. H. Chan School of Public Health policies regarding MTA and related matters.
Experimental model and subject details
Cell culture
SUM159 breast cancer cells were obtained from the laboratory of Tomas Kirchhausen (Harvard Medical School) and were maintained in DMEM/F-12 GlutaMAX (Life Technologies, #10565042) supplemented with 5 μg/ml insulin (Cell Applications), 1 μg/ml hydrocortisone (Sigma), 5% FBS (Life Technologies 10082147; Thermo Fisher), 50 μg/ml streptomycin, and 50 U/ml penicillin. Where noted, cells were incubated with media containing 100–500 μM oleic acid complexed with essentially fatty acid–free BSA. For protein purification and cryo-EM analysis, Expi293 suspension culture cells (Life Technologies) were used. Expi293 cells were cultured in Expi293 Expression Medium (#A1435102, Gibco) at 37°C under 8% CO2 and 80% humidity in Multitron-Pro shaker at 125 rpm. To block TG synthesis, DGAT1 (Liu et al., 2013) and DGAT2 inhibitors (Imbriglio et al., 2015) from Merck & Co. were dissolved in DMSO (D2650, Sigma-Aldrich) and used at a final concentration as noted in the figure legends.
Method details
Special reagents and antibodies
Janelia Fluor® dyes with HaloTag® (JF549 and JF646) (Grimm et al., 2015) were kind gifts from Luke Lavis (Janelia Research Campus). DGAT1 and DGAT2 inhibitors were gifts from Merck & Co. BODIPY493/503 (#D3922), HCS Lipid TOX Deep Red Neutral Lipid Stain (#H34477), and puromycin (#A1113803) were purchased from Thermo Fisher Scientific. AUTOdot (#SM1000b) was purchased from Abgent. Oleic acid (#O1008) was purchased from Sigma-Aldrich. Oleic acid [1-14C] (#ARC 0297) was purchased from American Radiolabeled Chemicals. The chemical derivative of rapamycin, A/C heterodimerizer (#635056), that was used for LDAF1 recruitment experiments was purchased from Clontech.
Primary antibodies used in this study were: polyclonal anti-BSCL2 (Abnova, #H00026580-A02), polyclonal anti-GFP (Abcam, #ab290), polyclonal anti-mCherry for detection of mScarlet-I (Abcam, #ab167453), monoclonal anti-α-tubulin (Sigma Aldrich, #T5168), monoclonal anti-Calnexin (Santa Cruz Biotechnology, #sc-46669), and affinity-purified polyclonal anti-LDAF1 (GenScript, custom-made in this study). HRP-conjugated secondary antibodies against mouse (sc-516102) and rabbit (sc-2357) were from Santa Cruz Biotechnology. For immunoprecipitation, GFP- and RFP-Trap_MA beads (gtma-10 and rtma-10, respectively) were purchased from ChromoTek.
A 10 mM oleic acid stock solution was made in 3 mM fatty acid–free BSA (Sigma-Aldrich, #A6003)-PBS. The solution was incubated in 37°C shaking incubator for an hour to completely dissolve oleic acid in the 3 mM BSA-PBS. The stock solution was filtered and stored in −20°C.
Generation of anti-TMEM159/LDAF1 antibody
A peptide consisting of the C-terminal 18 amino acids of TMEM159/LDAF1 (CDFLPAMKSAEFEGLYQE) with an additional cysteine at the N-terminus of the peptide was synthesized by GenScript. Keyhole limpet hemocyanin (KLH) was conjugated to the cysteine residue and rabbits were immunized with the peptide. Serum was collected, and polyclonal antibodies were affinity purified on the peptide used for immunization with SulfoLink Immobilization Kit for Proteins (Thermo Scientific).
Plasmid construction
The following plasmids were kind gifts: ERoxBFP (Addgene plasmid #68126) from Erik Snapp, mEmerald-Sec61β (Addgene plasmid #54249) from Michael Davidson, hCas9 (Addgene plasmid #41815) and gRNA-AAVS1-T2 (Addgene plasmid #41818) from George Church, AAVS1_Puro_PGK1_3xFLAG_Twin_Strep (Addgene plasmid #68375) from Yannick Doyon, pSpCas9(BB)-2A-Puro (PX459) V2.0 (Addgene plasmid #62988) from Feng Zhang, and pmScarlet-i_C1 (Addgene plasmids #85044) from Dorus Gadella. pEGFP-N1 and pEGFP-C1 plasmids were purchased from Clontech Laboratories, pSMART-HC-Amp plasmid was purchased from Lucigen. pCAG-LNK vector was modified from pCAGEN (Addgene plasmid #11160) as described (Scheich et al., 2007).
For plasmid construction, all PCRs were performed using PfuUltra II Fusion HotStart DNA Polymerase (#600672, Agilent Technologies) and restriction enzymes were from New England Biolabs. The synthetic DNAs (gBlock, Integrated DNA Technologies) that were used in this study and cloning strategies of the other plasmids (including primer information) were summarized in Table S3 and S4, respectively.
For expression of the LDAF1-FLAG-seipin(1-310) complex, pCAG-LDAF1-FLAG-Seipin(1-310) plasmid was generated by pCAG-LNK-LDAF1-FLAG and pCAG-LNK-Seipin(1-310) using approach described in Scheich et al.(Scheich et al., 2007). The detailed cloning strategies were summarized in Table S3 and S4.
Generation of KI and KO cells with CRISPR/Cas9-mediated genome editing
LDAF1-knockout (KO) SUM159 cell line in wild-type background and superfolderGFP knock-in (KI) seipin background were generated by CRISPR/Cas9 gene editing method (Ran et al., 2013). The sequence 5′-GTCATGTCGGCCGTTCCTGT-3′ was used as a gRNA to direct Cas9 into the exon 3 of the LDAF1 locus. Cells were selected with 1.5 μg/ml puromycin for 48 hrs. Genomic DNA of clones showing depletion of LDAF1 protein by western blot analysis with custom-made LDAF1 antibody were extracted (DNeasy Blood and Tissue Kit, Quiagen), and the genomic DNA sequence surrounding the target exon of LDAF1 was amplified by PCR (sense: 5′-GCCACTGCACCCGGCCTGTAGTG-3′, antisense: 5′-GCCGACGTGGGAGGATCACTTGA G-3′). PCR products were subcloned into a plasmid (Zero Blunt TOPO PCR Cloning Kit, Thermo Fisher Scientific) to validate the edited region of positive KO clones by sequencing.
To generate C-terminally superfolderGFP-tagged seipin, N-terminally HaloTag-tagged PLIN3, and N-terminally mScarlet-i-tagged LDAF1, SUM159 cells were simultaneously transfected by FuGENE HD transfection reagent (#E2311, Promega Corporation) with an individual donor plasmid containing arms with ~ 800-nucleotide-long homology upstream and downstream of the target site and a gRNA targeting upstream of stop codon (for seipin, 5′-TTTTCTTCAGGAACTAGAGC-3′), downstream of start codon (for PLIN3, 5′-AGAGACCATGTCTGCCGACG-3′), and upstream of start codon (for LDAF1, 5′-GACATGAGAGATTGGAC C GC-3′), respectively. The homology arm sequence information of individual donor plasmid (pSMART-seipin-sfGFP, pSMART-Halo-PLIN3, and pSMART-mScarlet-i-LDAF1) is described in Table S3 and S4. Cells were selected with 1.5 μg/ml puromycin for 48 hrs, and single-cell FACS sorting was performed by fluorescent proteins [seipin with 488 nm, PLIN3 with 633 nm (HaloTag was pre-labeled with JF646), LDAF1 with 561nm] at the flow cytometry core facility (Harvard, Division of Immunology). To validate the insertion of tags, target regions were amplified by PCR and sequenced.
Double KI SUM159 cell line (seipin-sfGFP KI and mScarlet-i-KI-LDAF1) was generated by sequential clonal generation. Seipin-sfGFP were initially generated and used for the generation of double KI cell line. Triple KI SUM159 cell line (seipin-sfGFP KI, mScarlet-i-KI-LDAF1, and Halo-PLIN3) were generated in double KI cell line of seipin-sfGFP KI and mScarlet-i-KI-LDAF1.
Stable cell line generation
To generate SUM159 cell line stably expressing seipin-EGFP, seipin ΔHH-EGFP, or seipin TM(FIT2)-EGFP, we adopted AAVS1 Safe Harbor targeting method (System Biosciences). In brief, donor plasmids of AAVS1-TK-Seipin-EGFP, AAVS1-TK-Seipin ΔHH-EGFP, or AAVS1-TK-Seipin TM(FIT2)-EGFP were simultaneously transfected with hCas9 plasmid (Addgene plasmid #41815) and gRNA-AAVS1-T2 plasmid (Addgene plasmid #41818) to seipin KO SUM159 cell line we previously generated (Wang et al., 2016) using Lipofectamine 3000 (Thermo Fisher Scientific), according to manufacturer’s instructions. Cells were selected with 1.5 μg/ml puromycin for 48 hrs, and single-cell FACS sorting was performed with 488 nm excitation at the flow cytometry core facility (Harvard, Division of Immunology). Positive clones were confirmed by fluorescence microscopy and by western blot with anti-GFP antibody.
Transfection and RNA interference
Transfection of plasmids into SUM159 cells was performed with FuGENE HD transfection reagent (#E2311, Promega Corporation) ~ 24 hrs before imaging.
Specific knockdown of LDAF1 in SUM159 cells was performed by transfection of small interfering RNA (siRNA) duplexes by Lipofectamine RNAiMAX (Life Technologies, #13778030). The siRNA for Negative Control (#D-001220-01) and LDAF1 (#M-018724-00-0005) were purchased from Dharmacon.
Immunoprecipitation and immunoblotting
For protein-level analyses (Figures 6a and 6a), cells were lysed in 1% SDS lysis buffer (50 mM Tris, pH 8.0, 150 mM NaCl, 1% SDS, and cOmplete Protease Inhibitor Cocktail tablet, EDTA-Free (Roche)) with ~100 units of Benzonase® Nuclease (#E1014, MilliporeSigma). After protein concentrations were determined using Pierce™ BCA Protein Assay Kit (ThermoFisher Scientific), cell lysates were mixed with Laemmli sample buffer and heated for 5 min at 70 °C prior to SDS-PAGE.
For immunoprecipitation in Figures 1c and 5e, cells were lysed in lysis buffer (50 mM Tris, pH 8.0, 150 mM NaCl, 1% digitonin, and cOmplete Protease Inhibitor Cocktail tablet, and EDTA-Free (Roche)). After solubilization of membrane in the cold room for 2 hrs with lysate rocking, the cell lysates were centrifuged at 16,000 g for 10 min at 4 °C, and the supernatants were collected. The 3 mg of protein lysates were incubated with 60 μg of GFP-trap (for EGFP or superfolderGFP) or RFP-trap (for mScarlet-i) magnetic agarose beads (ChromoTek) in cold room for 2 hours. The bead-bound materials were washed with 600 μl of washing buffer (50 mM Tris, pH 8.0, 150 mM NaCl, 0.1% digitonin) for five times and were eluted with Laemmli sample buffer for 5 min at 70 °C prior to SDS-PAGE.
For western blot analysis, all gels were transferred to Immun-Blot PVDF membranes (#1620177, Bio-Rad) with 1X Tris/glycine transfer buffer (#161-0771, Bio-Rad) with SDS for 2 hrs at 70 V in a cold room. The membranes were incubated in TMS-T supplemented with 5% non-fat dry milk (#sc-2325, Santa Cruz Biotechnology) at room temperature for 60 mins and subsequently incubated with primary antibodies for overnight in a cold room with gentle shaking. Membranes were washed three times in TBS-T for 5 mins and incubated at room temperature for 60 mins with appropriate HRP-conjugated secondary antibodies (Santa Cruz Biotechnology) prior to analysis by chemiluminescence with the SuperSignal West Pico or Dura reagents (Thermo Fisher Scientific).
For Coomassie staining, SDS-PAGE gels were washed with Milli-Q water for 20 mins to get rids of residual SDS, then the gels were incubated with colloidal Coomassie staining buffer (10% ethanol, 0.02% Coomassie brilliant blue G-250, 5% aluminum sulfate-(14-18)-hydrate, 2% ortho-phosphoric acid, 85%) for more than 3 hrs.
Mass spectrometry analysis of seipin interactome
Immunoprecipitation.
SUM159 cells stably expressing seipin WT-EGFP, seipin ΔHH-EGFP, or seipin TMD(FIT2)-EGFP (at a safe-harbor locus) from 3 × 15 cm dishes at 90% confluence were harvested in lysis buffer without detergent (50 mM Tris-HCl/pH 8.0, 150 mM NaCl) supplemented with protease inhibitor cocktail (Roche) and homogenized with a Dounce homogenizer ~ 30 times on ice. The lysates were solubilized at 4°C for 30 mins with 1% final concentration of digitonin, and then whole-cell extracts were clarified by centrifugation (16000xg for 10 mins/4°C). A total of 1 mg of lysates was immunoprecipitated with GFP-TRAP resin for 2 hrs at 4°C and subsequently washed with lysis buffer four times.
LC-MS/MS proteomic analysis.
Resin containing purified immunoprecipitates was incubated in 200 mM HEPES (4-(hydroxyethyl)-1-piperazineethanesulfonic acid), pH 7.5 containing 5 mM dithiothreitol (Sigma-Aldrich) at 37°C for 1 hr, followed by alkylation of cysteine residues using 15 mM iodoacetamide (Sigma-Aldrich) in the dark at room temperature for 1 hour. Alkylated proteins were diluted in 1:6 ratio (v/v) in ultrapure water prior to digestion using sequencing-grade trypsin (Worthington Biochemical Corp) at 37°C for 16 hrs. Digested peptides were subsequently desalted using self-packed C18 Stage Tips (3M Empore™) (Rappsilber et al., 2003) for LC-MS/MS analysis. Desalted peptides were resuspended in 0.1% (v/v) formic acid and analyzed on an Easy-nLC 1000 (Thermo Fisher Scientific) coupled to Orbitrap Q-Exactive HF (Thermo Fisher Scientific) mass spectrometer. Chromatography for peptide separation was performed using increasing organic proportion of acetonitrile (5–40 % (v/v)) on a self-packed analytical column using PicoTip™ emitter (New Objective, Woburn, MA) containing Reprosil Gold 120 C18, 1.9 um particle size resin (Dr. Maisch, Ammerbuch-Entringen, Germany) over a 120-min gradient at a flow rate of 300 nl/min. The mass spectrometry analyzer was operated in data dependent acquisition mode with a top ten method at a mass range of 300 – 2000 Da.
Lipid extraction and thin layer chromatography
For Figure 6j, cells were pulse-labeled with 500 μM [14C]-oleic acid (50 μCi/μmol) for designated time. Cells were washed with PBS for three times, then lipids were extracted directly from 6-well cell-culture plates by adding hexane: isopropanol mixture (3:2) and gentle shaking for 10 min. The process is repeated a second time for efficient extraction of all lipids. After lipid extraction from the 6-well plates, 400 mL of lysis buffer (0.3 N NaOH and 0.1% SDS) was added to each well and kept for shaking for 1 hr to lyse the cells for protein measurement by Pierce™ BCA Protein Assay Kit (Thermo Fisher Scientific). Lipids were dried under nitrogen stream, normalized by protein concentration, and separated by TLC with hexane: diethyl ether: acetic acid (80:20:1) solvent system. TLC plate were exposed to phosphor imaging cassette overnight and revealed by Typhoon FLA 7000 phosphor imager. Standard lipids on TLC plate were stained with iodine vapors afterwards.
For Figure 4C, lipids were extracted from proteins purified from HEK293 suspension cells. 6 μg of purified proteins were mixed with 3.75 volumes of a chloroform: methanol mixture (1:2) and vortexed for 1 min, followed by mixing with 1.25 volumes of chloroform. After vortexing, 1.25 volumes of Milli-Q water were added and vortexed, followed by centrifugation at 700 g for 20 min to make a phase separation. The lipid phases were collected and dried under an air stream. The lipids were resuspended in chloroform and separated by TLC using hexane: diethyl ether: acetic acid (80:20:1) solvent system. The TLC plate were sprayed with primuline solution [5 mg in 100 ml of acetone/water (80/20, v/v)] and lipid bands were visualized under UV light.
Fluorescence microscopy
Cells were plated on 35 mm glass-bottom dishes (MatTek Corp). Imaging was carried out at 37 °C approximately 24 hrs after transfection. Before imaging, cells were transferred to pre-warmed FluoroBrite™ DMEM supplemented with 2 mM GlutaMAX (#35050061, Thermo Fisher Scientific), 5 μg/mL insulin (Cell Applications), 1 μg/mL hydrocortisone (Sigma Aldrich), 5% FBS (Life Technologies 10082147; Thermo Fisher), 50 μg/mL streptomycin, and 50 U/mL penicillin. For fixed samples, cells were washed with ice-cold PBS twice, followed by incubation with 4% formaldehyde (Polysciences)-PBS for 20 mins at room temperature. After fixation, cells were washed three times with PBS for 5 mins. Where noted, cells were stained with HCS LipidTOX™ Deep Red Neutral Lipid Stain (H34477, ThermoFisher Scientific) at a 1:2000 dilution and 1 μg/mL Hoechst 33342 (H3570, Thermo Fisher Scientific) approximately 20 mins before imaging.
Spinning-disc confocal microscopy was performed using a Nikon Eclipse Ti inverted microscope equipped with Perfect Focus, a CSU-X1 spinning disk confocal head (Yokogawa), Zyla 4.2 Plus scientific complementary metal-oxide semiconductor (sCMOS) cameras (Andor, Belfast, UK), and controlled by NIS-Elements software (Nikon). To maintain 85% humidity, 37 °C and 5% CO2 levels, a stage top chamber was used (Okolab). Images were acquired through a 60× Plan Apo 1.40 NA objective or 100x Plan Apo 1.40 NA objective (Nikon). Image pixel sizes were 0.107 and 0.065 μm, respectively. Blue, green, red, and far-red fluorescence was excited by 405, 488, 560, or 637 nm (solid state; Andor, Andor, Cobolt, Coherent, respectively) lasers. All laser lines shared a quad-pass dichroic beamsplitter (Di01-T405/488/568/647, Semrock). Blue, green, red, and far-red emission was selected with FF01-452/45, FF03-525/50, FF01-607/36, or FF02-685/40 filters (Semrock) respectively, mounted in an external filter wheel. Multicolor images were acquired sequentially.
TIRF and HILO microscopy (Tokunaga et al., 2008) was performed using a Nikon Ti-E motorized inverted microscope equipped with ImagEM EM-CCD camera (Hamamatsu) fitted with a 100×, NA 1.49 Apo TIRF objective lens (Nikon) with a 1.5X tube lens (image pixel size 0.107 μm) and controlled by MetaMorph software (Molecular Devices). For HILO imaging, the angle of illumination was adjusted to illuminate the full depth-of-focus of the objective lens, erring on the side of reduced contrast rather than shallow illumination. To maintain 85% humidity, 37 °C and 5% CO2 levels, a full environmental enclosure was used (Okolab). Green, red, and far-red fluorescence was excited by 491-, 561- (solid state; Cobolt), and 642-nm (diode; Vortran) lasers, respectively, selected with an AOTF. All laser lines shared a quad-pass TIRF cube (ZET405/488/561/635X, ZT405/488/561/635rpc, ZET405/488/561/635M). Green, red, and far-red emissions were selected with ET525/50m, ET600/50m, or ET700/75m filters (Chroma) respectively, mounted in an external filter wheel. Multicolor images were acquired sequentially.
For protein-tracking analysis in Figures 1h and 1i, green and red fluorescence was excited simultaneously with 488- and 561-nm solid state lasers, selected with AOTF and a quad-pass TIRF cube (ZET405/488/561/635X, ZT405/488/561/635rpc, ZET405/488/561/635M). Simultaneous 2-channel images were acquired every 150 ms using a DualView image splitter (Photometrics) equipped with a 570lp dichromatic mirror and ET525/50m and ET600/50m (Chroma) emission filters.
All microscope configurations used in the data presented here are available at FPbase (Lambert, 2019): https://www.fpbase.org/microscope/H6ZDiVQWDNZTYzPYEMMnDj/
High-throughput imaging in Figures 6e and 6i was performed on an IN CELL Analyzer 6000 microscope (GE Healthcare Life Sciences) using a 60 × 0.95 NA objective lens. Cells were prepared in 96-well glass-bottom plates and fixed in 4% formaldehyde-PBS at room temperature for 20 mins, washed three times with PBS, and stained with BODIPY493/503 for LDs and Hoechst 33342 (Thermo Fisher) for nuclei. 20 images were acquired per well. LD areas and numbers from high-throughput microscopic images were quantified using CellProfiler software (Carpenter et al., 2006).
All acquired images were processed and prepared for figures using Fiji (Schindelin et al., 2012).
Protein expression and purification
The complex of LDAF1-FLAG and seipin(1-310) or seipin(1-310)-FLAG, were expressed in suspension cultures of Expi293F cells (Life Technologies) which were cultured in Expi293 Expression Medium (#A1435102, Gibco) at 37°C under 8% CO2 and 80% humidity in Multitron-Pro shaker at 125 rpm. When cell density reached 2.5 X 10^6 cells per ml, the pCAG-LNK plasmids were transfected into the cells. For 2 liters of cell culture, 2 mg of plasmids were pre-mixed with 6 mg of 25-kDa linear polyethyleneimine (Polysciences) in 200 ml of Opti-MEM medium for 30 mins at room temperature before transfection. At16 hrs after transfection, 10 mM Sodium Butyrate were added to boost protein expression. At 48 hours after transfection, cells were collected, and cell pellets were snap-frozen by liquid nitrogen and stored at −80 °C. Where noted, cells were treated with 20 or 50 μM DGAT1 and DGAT2 inhibitors after 36 hours of transfection, and cells were harvested 10 or 20 hours later. To induce LD formation, 0.1 mM oleic acid was treated to cells after 36 hours of transfection and cells were harvested 12 hrs later.
All purification procedures were performed at 4°C. Cell pellet was thawed and resuspended in the Buffer A (50 mM Tris-HCl pH 8.0, 150 mM NaCl, 5 mM MgCl2, 10 % v/v glycerol) supplemented with cOmplete Protease Inhibitor Cocktail tablet, EDTA-Free (Roche). Cells were lysed by sonication. The cell debris were removed by centrifugation at 5000 g for 15 min. To get membrane fractions, the supernatant was subjected to centrifugation in a Ti45 rotor (Beckman) at 43,000 rpm for 1 hr. The membrane pellet was collected and homogenized with a Dounce homogenizer in Buffer A supplemented with 1% LMNG, and cOmplete Protease Inhibitor Cocktail tablet, EDTA-Free, and membranes were solubilized with gentle rocking for 1.5 hrs. Insoluble material was then removed by centrifugation at 43,000 rpm for 35 mins. The supernatant was incubated with 1.2 ml of anti-FLAG M2 resin (Sigma) for 1.5 hrs. The resins were then collected and washed with 12 ml of buffer A with 0.05% digitonin and the proteins were eluted with 3 ml of washing buffer containing 0.2 mg/ml of 3xFLAG peptide (Sigma). The eluted protein was concentrated and further purified by size-exclusion chromatography on a Superose 6 3.2/300 Increase column, equilibrated with buffer containing 25 mM HEPES, pH 7.4, 150 mM NaCl, 0.05% digitonin). Peak fractions were pooled and concentrated to 6 mg/ml for cryo-EM analysis or in vitro assay.
Electron microscopy sample preparation and data acquisition
Negatively stained specimens were prepared by an established protocol with minor modifications (Booth et al., 2011). Specifically, 2.5 μL purified LDAF1-seipin complex in digitonin at 0.02–0.03 mg/ml was applied to glow-discharged copper EM grids covered with a thin layer of continuous carbon film, and the grids were stained with 0.75% (w/v) uranyl formate for 30 s. These grids were imaged on a Tecnai T12 microscope (Thermo Fisher Scientific) operated at 120 kV and equipped with a 4,000 × 4,000 charge-coupled device camera (UltraScan 4000; Gatan). A nominal magnification of 52,000× corresponding with a pixel size of 2.13 Å on the specimen and a defocus of ∼1.5 μm was used to record the images.
For cryo-EM analysis, the concentrated sample was incubated with MS(PEG)12 methyl-PEG-NHS-ester (Thermo Fisher) at a 1:10 molar ratio for 2 hrs on ice to reduce aggregation of particles on the grids. PEGylated sample (3 μL) was applied to a glow-discharged quantifoil grid (1.2/1.3, 400 mesh). The grids were blotted for 2.5 s at ~90% humidity and plunge-frozen in liquid ethane using a Cryoplunge 3 System (Gatan).
Cryo-EM data were collected on a Talos-Arctica operated at 200 kV and equipped with a K2 Summit direct electron detector (Gatan) at UMass Medical School. All cryo-EM movies were recorded in super-resolution counting mode using SerialEM. The nominal magnification of 28,000x corresponds to a calibrated physical pixel size of 1.48 Å and 0.74 Å in the super-resolution mode. The dose rate was 4.62 electrons/Å2 x s. The total exposure time was 8 s, resulting a total dose of 37 electrons/Å2 fractionated into 50 frames (200 ms per frame). The defocus range for the sample was between 1.1 and 2.7 μm
Image Processing
A total of 1000 dose-fractionated super-resolution movies were subjected to motion correction, using the program MotionCor2 (Zheng et al., 2017) with a 2x binning, yielding a pixel size of 1.48 Å. A sum of all frames of each image stack (50 total) was calculated by following a dose-weighting scheme and used for all image-processing steps except for defocus determination. The program Gctf (Zhang, 2016) was used to estimate defocus values of the summed images from all movie frames without dose weighting. Particles were autopicked by Gautomatch (http://www.mrc-lmb.cam.ac.uk/kzhang/). After manual inspection and sorting to discard poor images, classifications were done in Relion 3.0 (Zivanov et al., 2018). A total of 150,816 particles were extracted and subjected to one round of reference-free 2D classification to remove false picks and obvious junk classes. The resulting 121,422 particles were subjected to one round of global 3D classification without symmetry applied. 50,814 Particles with features of Seipin’s luminal domain was selected for further classification. Auto-refinement with C11 symmetry was done on this particle set followed by focused refinement using a mask encompassing seipin’s luminal domain. Using the angle assignments obtained after the focused refinement, a 3D classification (T10) without alignment, but with a mask around Seipin’s luminal domain, was used to sort out particles with better luminal domain density. After selection of 42,927 particles, a final round of auto-refinement followed by focused refinement using the adaptive mask yielded a map at 4.2 Å. All reported resolutions are based on gold-standard refinement procedures and the FSC=0.143 criterion. All software is supported by SBGrid.
Quantification and statistical analysis
Statistics
Unless otherwise stated, results are presented as mean ± standard deviation. Statistical analyses of results were performed using GraphPad Prism 8 (for statistical details of each experiment, see figure legends and below). Statistically significant differences are denoted as follows: *p < 0.05, **p < 0.01, ***p < 0.001, ****p < 0.0001.
Processing of mass spectrometry data
Mass spectrometry data were processed using MaxQuant software version 1.5.2.8 (Cox and Mann, 2008) at the following settings: oxidized methionine residues and protein N-terminal acetylation as variable modification, cysteine carbamidomethylation as fixed modification, first search peptide tolerance 20 ppm, and main search peptide tolerance 4.5 ppm. Protease specificity was set to trypsin with up to two missed cleavages were allowed. Only peptides longer than six amino acids were analyzed, and the minimal ratio count to quantify a protein was 2. The false discovery rate (FDR) was set to 5% for peptide and protein identification. Database searches were performed using the Andromeda search engine integrated into the MaxQuant software (Cox et al., 2011) against the UniProt human database containing 71,579 (November 2017) entries. “Matching between runs” algorithm with a time window of 0.7 min was employed to transfer identifications between samples proceed using the same nanospray conditions. Protein tables were filtered to eliminate identifications from the decoy database and also common contaminants. Mass spectrometry source files generated were deposited to the ProteomeXchange Consortium via the PRIDE (Vizcaíno et al., 2016) partner repository with the dataset identifier
Image Quantification
Protein spot analysis (Figures 1f, 1g and 6c) was done with a custom MATLAB script: channel mis-registration was measured (imregtform) with images of 0.1 μm TetraSpeck beads (ThermoFisher) and experimental data was registered with the imwarp function. Diffraction-limited objects were detected via local maxima detection after Laplacian of Gaussian filtering (sigma adjusted to PSF). Sub-pixel particle positions were calculated by Gaussian fitting. A seipin particle was defined as being in a complex with LDAF1 if an LDAF1 localized within 200 nm (~ one PSF sigma), and vice-versa for LDAF1. The correlation of LD and seipin foci in Figure 6d was quantified with a similar MATLAB script: after channel registration, diffraction-limited objects were detected and localized as described above, but the fitted Gaussian sigma was allowed to vary for the LD channel to provide an estimate of the LD radius (which was slightly larger than the diffraction limit). Seipin foci were defined as colocalized with an LD if they were within 1.5x of the fitted Gaussian sigma of the nearest LD. The Fiji plugin “Find Maxima” was used to quantify LD number in Figures 6f and 6n.
To quantify the colocalization of seipin, LDAF1, and PLIN3 as in Figures 2b and 2c, we first used the Fiji plugin “TrackMate” (Tinevez et al., 2017) to detect spots in each channel and frame of the dataset (no tracking was performed here). The 3-channel spot position data were further processed with a python script: scipy.spatial.KDTree was used to identify, for each detected spot in every frame, the nearest neighbor in the other two channels. LDs were identified as positive for seipin or LDAF1 if the nearest neighboring respective spot was within 0.5 μm (the average LD FWHM was ~400 nm, and an additional 100 nm was allowed for particle motion between channel acquisition; however, results were not significantly different with “colocalization” thresholds ± 200nm). For quantification of LD number in Figure 3f, the Fiji plugin “TrackMate” (Tinevez et al., 2017) was used to detect PLIN3-positive spots.
For motion analysis in Figures 1h and 1i, seipin and LDAF1 particles were tracked in Fiji using TrackMate (LoG spot detection with radius 0.25 μm & quality > 300; simple LAP tracker max linking distance = 0.8, gap closing 1.0 μm ≤ 3 frames). Data were then further analyzed in python as follows: scipy.spatial.KDTree was used to identify, for each detected spot in every frame, the nearest neighbor in the other channel, “track pairs” (seipin tracks co-traveling with a LDAF1 track) were defined as seipin track segments for which a unique LDAF1 track was within 200 nm of the seipin particle. The “joint track” lasts only as long as the two tracks are within 200 nm and stops if the particles separate (or bleach), with an allowance of one missed frame. “Solo tracks” were defined as seipin or LDAF1 track segments in which there was no neighboring particle from the other channel within 1 μm for the duration of the track. Joint/solo tracks shorter than eight consecutive frames usually corresponded to aberrant spot detections and were rejected. To decrease false identification of “solo tracks” due to bleaching of one of the particles, all solo track with track identifications that were identified in a “joint track” in a previous timepoint were rejected (though, this filter did not significantly alter the distribution or significance of the data). Velocity of a track segment was quantified as the total distance traveled, divided by total time. The 2D root mean squared distance was calculated for a measure of particle motion/activity as:
Where (xi,yi) is the point coordinate at time i, and their (average position) is ().
Data and code availability
This study did not generate any unique datasets or code.
Supplementary Material
Table S1 (related to Figure 1). Mass spectrometry analysis for seipin-EGFP immunoprecipitation.
Shown are the label free quantitation (LFQ) of average peptide intensities for each protein detected in the different replicates (seipin WT-EGFP, seipin ΔHH-EGFP, and seipin TM(FIT2)-EGFP), the number of total peptides, unique peptides, and the log2 transformation of protein abundance. Data shown are from three independent experiments.
Table S4 (Related to the STAR Methods). Cloning strategies used in this paper.
Table S3 (Related to the STAR Methods). Synthetic double-stranded DNA fragments used in this paper.
Table S2 (related to Figure S7). Sequence alignment and homology search for LDAF1 protein using EVfold server. The full-length protein sequence of LDAF1 (Q96B96-1) was used for homology search in EVfold (http://evfold.org/evfold-web/status.do?job_id=af2efe51-6618-4374-8f23-88de2be516df).
Video S1 (related to Figure 1). Dynamic behaviors of endogenous LDAF1 and seipin in cells.
HILO time-lapse of live LDAF1 KO SUM159 cell with endogenously fluorescent proteins tagged at LDAF1 (mScarlet-i) and seipin (sfGFP) loci.
Video S2 (related to Figure 3). LD formation at the LDAF1 foci after LDAF1 recruitment to the ER-PM contact site.
TIRF time-lapse of live LDAF1 KO SUM159 cell with endogenously fluorescent proteins tagged at seipin (sfGFP) and PLIN3 (HaloTag) loci. The cell was co-transfected with PM-FRB-TagBFP and LDAF1-mScarlet-i-FKBP and pre-stained with 500 nM of Janelia Fluor 646 for 1 hr. LDAF1 is recruited to the ER-PM contact sites by 3 nM of heterodimerizer treatment. 0.5 mM oleic acid was added at the beginning of image acquisition.
KEY RESOURCES TABLE
| REAGENT or RESOURCE | SOURCE | IDENTIFIER |
|---|---|---|
| Antibodies | ||
| Mouse polyclonal anti-BSCL2 | Abnova | Cat# H00026580-A02 |
| Rabbit polyclonal anti-GFP | Abcam | Cat# ab290 |
| Rabbit polyclonal anti-mCherry | Abcam | Cat# ab167453 |
| Mouse monoclonal anti-α-tubulin | Sigma-Aldrich | Cat# T5168 |
| Mouse monoclonal anti-Calnexin | Santa Cruz Biotechnology | Cat# sc-46669 |
| Rabbit polyclonal anti-LDAF1 | This study | N/A |
| Mouse anti-IgG kappa binding protein-HRP | Santa Cruz Biotechnology | Cat# sc-516102 |
| Mouse monoclonal anti-rabbit IgG-HRP | Santa Cruz Biotechnology | Cat# sc-2357 |
| GFP-Trap Magnetic Agarose | ChromoTek | Cat# gtma-10 |
| RFP-Trap Magnetic Agarose | ChromoTek | Cat# rtma-10 |
| Bacterial and Virus Strains | ||
| Subcloning Efficiency™ DH5α™ Competent Cells | Thermo Fisher Scientific | Cat#18265017 |
| Chemicals, Peptides, and Recombinant Proteins | ||
| BODIPY493/503 | Thermo Fisher Scientific | Cat# D3922 |
| HCS LipidTOX™ Deep Red Neutral Lipid Stain | Thermo Fisher Scientific | Cat# H34477 |
| Puromycin | Thermo Fisher Scientific | Cat# A1113803 |
| AUTOdot Autophagy Visualization Dye | Abgent | Cat# SM1000b |
| Oleic acid | Sigma-Aldrich | Cat# O1008 |
| Oleic acid [1-14C] | American Radiolabeled Chemicals | Cat# ARC 0297 |
| A/C Heterodimerizer | Clontech | Cat# 635056 |
| Bovine Serum Albumin (essentially fatty-acid free) | Sigma-Aldrich | Cat# A6003 |
| PfuUltra II Fusion HotStart DNA Polymerase | Agilent Technologies | Cat# 600672 |
| FuGENE HD Transfection Reagent | Promega Corporation | Cat# E2311 |
| Lipofectamine™ 3000 Transfection Reagent | Thermo Fisher Scientific | Cat# L3000008 |
| DGAT1 inhibitor | Merck & Co | Liu et al., 2013 |
| DGAT2 inhibitor | Merck & Co | Imbriglio et al., 2015 |
| Lipofectamine RNAiMAX | Thermo Fisher Scientific | Cat# 13778150 |
| Benzonase® Nuclease | Millipore | Cat# E1014 |
| Sequencing grade Trypsin | Worthington Biochemical | Cat# LS02120 |
| Polyethylenimine | Polysciences | Cat# 23966-1 |
| Critical Commercial Assays | ||
| NucleoSpin® Gel and PCR Clean-up Kit | Macherey-Nagel | Cat# 740609.250 |
| Zero Blunt™ TOPO™ PCR Cloning Kit | Invitrogen | Cat# 450245 |
| Pierce™ BCA Protein Assay Kit | Thermo Fisher Scientific | Cat# 23225 |
| SuperSignal West Pico | Thermo Fisher Scientific | Cat# 34580 |
| SuperSignal West Dura | Thermo Fisher Scientific | Cat# 34076 |
| Experimental Models: Cell Lines | ||
| Human Expi293F cells | Thermo Fisher Scientific | Cat# A14527 |
| Human SUM159 breast cancer cell line | Dr. Tomas Kirchhausen (Harvard Medical School) | N/A |
| Oligonucleotides | ||
| siGENOME duplexes targeting TMEM159 | Dharmacon | Cat# L-051611-01-0005 |
| siGENOME RISC-Free Control | Dharmacon | Cat# D-001220-01-05 |
| Guide RNA for TMEM159/LDAF1 KO and KI: GACATGAGAGATTGGACCGC | This paper | N/A |
| Guide RNA for Seipin KI: TTTTCTTCAGGAACTAGAGC | This paper | N/A |
| Guide RNA for PLIN3 KI: AGAGACCATGTCTGCCGACG | This paper | N/A |
| Synthetic double-stranded DNA fragment used in this paper, see Table S3 | This paper | N/A |
| Primers used in this paper, see Table S4 | This paper | N/A |
| Recombinant DNA | ||
| Plasmid: ERoxBFP | Costantini et al., 2015 | Addgene Plasmid# 68126 |
| Plasmid: mEmerald-Sec61β | A gift from Michael Davidson | Addgene Plasmid# 54249 |
| Plasmid: pSpCas9(BB)-2A-Puro (PX459) V2.0 | Ran et al., 2013 | Addgene Plasmid# 62988 |
| Plasmid: gRNA_AAVS1-T2 | Mali et al., 2013 | Addgene Plasmid# 41818 |
| Plasmid: AAVS1_Puro_PGK1_3xFLAG_Twin_Strep | Dalvai et al., 2015 | Addgene Plasmid# 68375 |
| Plasmid: hCas9 | Mali et al., 2013 | Addgene Plasmid# 41815 |
| Plasmid: pmScarlet-i_C1 | Bindels et al., 2016 | Addgene Plasmid# 85044 |
| Software and Algorithms | ||
| EVcouplings | Marks et al., 2011 | http://evfold.org/evfold-web/evfold.do |
| NIS-Elements | NiKon | N/A |
| Fiji | Schindelin et al., 2012 | https://fiji.sc/ |
| GraphPad Prism 8 | GraphPad | www.graphpad.com |
| CellProfiler | Carpenter et al., 2006 | https://cellprofiler.org/ |
| MaxQuant | Cox and Mann, 2008 | https://www.maxquant.org/ |
Highlights:
LDAF1 and seipin form a ~600kDa oligomeric complex in the ER bilayer
The LDAF1-seipin complex determines the sites of lipid droplet formation in the ER
LDAF1 dissociates from seipin and moves to the growing lipid droplet surface
LDAF1 facilitates lipid droplet formation at low ER triglyceride concentration
ACKNOWLEDGMENTS
We thank members of Farese & Walther laboratory for helpful discussions, Dr. T.A. Rapoport for helpful discussion and experimental support, Dr. M. Liao for consultations on cryo-EM, Dr. C. Chitraju for experimental guidance, the Nikon Imaging Center at Harvard Medical School for imaging support, Drs. C. Xu and K. Song for cryo-EM microscope operation at the University of Massachusetts, Harvard Chan Advanced Multi-omics Platform for mass-spec support, and G. Howard for editorial assistance. We thank Merck & Co. for a gift of DGAT inhibitors. Other generous gifts of reagents are acknowledged in the Materials and Methods section. This work was supported by the grants from NIH to R.V.F. (5R01GM124348), to T.C.W. (R01GM097194). J.C is a fellow of the Damon Runyon Cancer Research Foundation. X.W is a fellow of the Jane Coffin Child Fellowship. T.C.W. is a Howard Hughes Medical Institute Investigator.
Footnotes
DECLALATION OF INTERESTS
The authors declare no competing interests.
REFERENCES
- Ben M’barek K, Ajjaji D, Chorlay A, Vanni S, Forêt L, and Thiam A-R (2017). ER Membrane Phospholipids and Surface Tension Control Cellular Lipid Droplet Formation. Developmental Cell 41, 591–604. e597. [DOI] [PubMed] [Google Scholar]
- Bersuker K, Peterson CWH, To M, Sahl SJ, Savikhin V, Grossman EA, Nomura DK, and Olzmann JA (2018). A Proximity Labeling Strategy Provides Insights into the Composition and Dynamics of Lipid Droplet Proteomes. Developmental Cell 44, 97–112. e97. [DOI] [PMC free article] [PubMed] [Google Scholar]
- Bindels DS, Haarbosch L, van Weeren L, Postma M, Wiese KE, Mastop M, Aumonier S, Gotthard G, Royant A, Hink MA, Gadella TWJ, 2016. mScarlet: a bright monomeric red fluorescent protein for cellular imaging. Nat. Methods [DOI] [PubMed] [Google Scholar]
- Binns D, Lee S, Hilton CL, Jiang Q-X, and Goodman JM (2010). Seipin is a discrete homooligomer. Biochemistry 49, 10747–10755. [DOI] [PMC free article] [PubMed] [Google Scholar]
- Bulankina AV, Deggerich A, Wenzel D, Mutenda K, Wittmann JG, Rudolph MG, Burger KNJ, and Höning S (2009). TIP47 functions in the biogenesis of lipid droplets. The Journal of Cell Biology 185, 641–655. [DOI] [PMC free article] [PubMed] [Google Scholar]
- Cartwright BR, and Goodman JM (2012). Seipin: from human disease to molecular mechanism. J. Lipid Res 53, 1042–1055. [DOI] [PMC free article] [PubMed] [Google Scholar]
- Choudhary V, Ojha N, Golden A, and Prinz WA (2015). A conserved family of proteins facilitates nascent lipid droplet budding from the ER. The Journal of Cell Biology 211, 261–271. [DOI] [PMC free article] [PubMed] [Google Scholar]
- Costantini LM, Baloban M, Markwardt ML, Rizzo M, Guo F, Verkhusha VV, Snapp EL, 2015. A palette of fluorescent proteins optimized for diverse cellular environments. Nat Comms 6, 7670. [DOI] [PMC free article] [PubMed] [Google Scholar]
- Dalvai M, Loehr J, Jacquet K, Huard CC, Roques C, Herst P, Côté J, Doyon Y, 2015. A Scalable Genome-Editing-Based Approach for Mapping Multiprotein Complexes in Human Cells. Cell Rep 13, 621–633. [DOI] [PubMed] [Google Scholar]
- Eisenberg-Bord M, Mari M, Weill U, Rosenfeld-Gur E, Moldavski O, Castro IG, Soni KG, Harpaz N, Levine TP, Futerman AH, et al. (2018). Identification of seipin-linked factors that act as determinants of a lipid droplet subpopulation. The Journal of Cell Biology 217, 269–282. [DOI] [PMC free article] [PubMed] [Google Scholar]
- Farese RV, and Walther TC (2009). Lipid droplets finally get a little R-E-S-P-E-C-T. Cell 139, 855–860. [DOI] [PMC free article] [PubMed] [Google Scholar]
- Fei W, Shui G, Gaeta B, Du X, Kuerschner L, Li P, Brown AJ, Wenk MR, Parton RG, and Yang H (2008). Fld1p, a functional homologue of human seipin, regulates the size of lipid droplets in yeast. The Journal of Cell Biology 180, 473–482. [DOI] [PMC free article] [PubMed] [Google Scholar]
- Fujimoto T, and Parton RG (2011). Not just fat: the structure and function of the lipid droplet. Cold Spring Harb Perspect Biol 3, a004838–a004838. [DOI] [PMC free article] [PubMed] [Google Scholar]
- Grippa A, Buxó L, Mora G, Funaya C, Idrissi F-Z, Mancuso F, Gomez R, Muntanyà J, Sabidó E, and Carvalho P (2015). The seipin complex Fld1/Ldb16 stabilizes ER-lipid droplet contact sites. The Journal of Cell Biology 211, 829–844. [DOI] [PMC free article] [PubMed] [Google Scholar]
- Gross DA, Snapp EL, and Silver DL (2010). Structural insights into triglyceride storage mediated by fat storage-inducing transmembrane (FIT) protein 2. PLoS ONE 5, e10796. [DOI] [PMC free article] [PubMed] [Google Scholar]
- Hamilton JA, and Small DM (1981). Solubilization and localization of triolein in phosphatidylcholine bilayers: a 13C NMR study. Proc Natl Acad Sci USA 78, 6878–6882. [DOI] [PMC free article] [PubMed] [Google Scholar]
- Henne WM, Reese ML, and Goodman JM (2018). The assembly of lipid droplets and their roles in challenged cells. Embo J 37, e98947. [DOI] [PMC free article] [PubMed] [Google Scholar]
- Imbriglio JE, Shen D-M, Liang R, Marby K, You M, Youm HW, Feng Z, London C, Xiong Y, Tata J, Verras A, Garcia-Calvo M, Song X, Addona GH, McLaren DG, He T, Murphy B, Metzger DE, Salituro G, Deckman D, Chen Q, Jin X, Stout SJ, Wang S-P, Wilsie L, Palyha O, Han S, Hubbard BK, Previs SF, Pinto S, Taggart A, 2015. Discovery and Pharmacology of a Novel Class of Diacylglycerol Acyltransferase 2 Inhibitors. J. Med. Chem 58, 9345–9353. [DOI] [PubMed] [Google Scholar]
- Kadereit B, Kumar P, Wang W-J, Miranda D, Snapp EL, Severina N, Torregroza I, Evans T, and Silver DL (2008). Evolutionarily conserved gene family important for fat storage. Proc Natl Acad Sci USA 105, 94–99. [DOI] [PMC free article] [PubMed] [Google Scholar]
- Kassan A, Herms A, Fernández-Vidal A, Bosch M, Schieber NL, Reddy BJN, Fajardo A, Gelabert-Baldrich M, Tebar F, Enrich C, et al. (2013). Acyl-CoA synthetase 3 promotes lipid droplet biogenesis in ER microdomains. The Journal of Cell Biology 203, 985–1001. [DOI] [PMC free article] [PubMed] [Google Scholar]
- Krahmer N, Farese RV, and Walther TC (2013). Balancing the fat: lipid droplets and human disease. EMBO Mol Med 5, 905–915. [DOI] [PMC free article] [PubMed] [Google Scholar]
- Liu Y, Zhang C, Shen X, Zhang X, Cichello S, Guan H, and Liu P (2013). Microorganism lipid droplets and biofuel development. BMB Rep 46, 575–581. [DOI] [PMC free article] [PubMed] [Google Scholar]
- Liu J, Gorski JN, Gold SJ, Chen D, Chen S, Forrest G, Itoh Y, Marsh DJ, McLaren DG, Shen Z, Sonatore L, Carballo-Jane E, Craw S, Guan X, Karanam B, Sakaki J, Szeto D, Tong X, Xiao J, Yoshimoto R, Yu H, Roddy TP, Balkovec J, Pinto S, 2013. Pharmacological inhibition of diacylglycerol acyltransferase 1 reduces body weight and modulates gut peptide release-Potential insight into mechanism of action. Obesity 21, 1406–1415. [DOI] [PubMed] [Google Scholar]
- Lorenz H, Hailey DW, Wunder C, and Lippincott-Schwartz J (2006). The fluorescence protease protection (FPP) assay to determine protein localization and membrane topology. Nat Protoc 1, 276–279. [DOI] [PubMed] [Google Scholar]
- Magré J, Delépine M, Khallouf E, Gedde-Dahl T, Van Maldergem L, Sobel E, Papp J, Meier M, Mégarbané A, Bachy A, et al. (2001). Identification of the gene altered in Berardinelli-Seip congenital lipodystrophy on chromosome 11q13. Nat. Genet 28, 365–370. [DOI] [PubMed] [Google Scholar]
- Mali P, Yang L, Esvelt KM, Aach J, Guell M, DiCarlo JE, Norville JE, Church GM, 2013. RNA-guided human genome engineering via Cas9. Science 339, 823–826. [DOI] [PMC free article] [PubMed] [Google Scholar]
- Marks DS, Colwell LJ, Sheridan R, Hopf TA, Pagnani A, Zecchina R, Sander C, 2011. Protein 3D structure computed from evolutionary sequence variation. PLoS ONE 6, e28766. [DOI] [PMC free article] [PubMed] [Google Scholar]
- Murphy DJ (2012). The dynamic roles of intracellular lipid droplets: from archaea to mammals. Protoplasma 249, 541–585. [DOI] [PubMed] [Google Scholar]
- Muthuswamy SK, Gilman M, and Brugge JS (1999). Controlled dimerization of ErbB receptors provides evidence for differential signaling by homo- and heterodimers. Mol. Cell. Biol 19, 6845–6857. [DOI] [PMC free article] [PubMed] [Google Scholar]
- Olzmann JA, and Carvalho P (2018). Dynamics and functions of lipid droplets. Nat. Rev. Mol. Cell Biol 14, 281. [DOI] [PMC free article] [PubMed] [Google Scholar]
- Pagac M, Cooper DE, Qi Y, Lukmantara IE, Mak HY, Wu Z, Tian Y, Liu Z, Lei M, Du X, et al. (2016). SEIPIN Regulates Lipid Droplet Expansion and Adipocyte Development by Modulating the Activity of Glycerol-3-phosphate Acyltransferase. Cell Rep 17, 1546–1559. [DOI] [PMC free article] [PubMed] [Google Scholar]
- Ran FA, Hsu PD, Wright J, Agarwala V, Scott DA, and Zhang F (2013). Genome engineering using the CRISPR-Cas9 system. Nat Protoc 8, 2281–2308. [DOI] [PMC free article] [PubMed] [Google Scholar]
- Salo VT, Belevich I, Li S, Karhinen L, Vihinen H, Vigouroux C, Magré J, Thiele C, Hölttä-Vuori M, Jokitalo E, et al. (2016). Seipin regulates ER-lipid droplet contacts and cargo delivery. Embo J 35, 2699–2716. [DOI] [PMC free article] [PubMed] [Google Scholar]
- Söding J, Biegert A, and Lupas AN (2005). The HHpred interactive server for protein homology detection and structure prediction. Nucleic Acids Res. 33, W244–W248. [DOI] [PMC free article] [PubMed] [Google Scholar]
- Sui X, Arlt H, Brock KP, Lai ZW, DiMaio F, Marks DS, Liao M, Farese RV, and Walther TC (2018). Cryo-electron microscopy structure of the lipid droplet-formation protein seipin. The Journal of Cell Biology 217, 4080–4091. [DOI] [PMC free article] [PubMed] [Google Scholar]
- Szymanski KM, Binns D, Bartz R, Grishin NV, Li W-P, Agarwal AK, Garg A, Anderson RGW, and Goodman JM (2007). The lipodystrophy protein seipin is found at endoplasmic reticulum lipid droplet junctions and is important for droplet morphology. Proc Natl Acad Sci USA 104, 20890–20895. [DOI] [PMC free article] [PubMed] [Google Scholar]
- Teixeira V, Johnsen L, Martínez-Montañés F, Grippa A, Buxó L, Idrissi F-Z, Ejsing CS, and Carvalho P (2018). Regulation of lipid droplets by metabolically controlled Ldo isoforms. The Journal of Cell Biology 217, 127–138. [DOI] [PMC free article] [PubMed] [Google Scholar]
- Thiam A-R, and Forêt L (2016). The physics of lipid droplet nucleation, growth and budding. Biochim. Biophys. Acta 1861, 715–722. [DOI] [PubMed] [Google Scholar]
- Tokunaga M, Imamoto N, and Sakata-Sogawa K (2008). Highly inclined thin illumination enables clear single-molecule imaging in cells. Nat. Methods 5, 159–161. [DOI] [PubMed] [Google Scholar]
- Voeltz GK, Prinz WA, Shibata Y, Rist JM, and Rapoport TA (2006). A Class of Membrane Proteins Shaping the Tubular Endoplasmic Reticulum. Cell 124, 573–586. [DOI] [PubMed] [Google Scholar]
- Walther TC, Chung J, and Farese RV (2017). Lipid Droplet Biogenesis. Annu. Rev. Cell Dev. Biol 33, 491–510. [DOI] [PMC free article] [PubMed] [Google Scholar]
- Wang H, Becuwe M, Housden BE, Chitraju C, Porras AJ, Graham MM, Liu XN, Thiam A-R, Savage DB, Agarwal AK, et al. (2016). Seipin is required for converting nascent to mature lipid droplets. Elife 5, 440. [DOI] [PMC free article] [PubMed] [Google Scholar]
- Varnai P, Thyagarajan B, Rohacs T, and Balla T (2006). Rapidly inducible changes in phosphatidylinositol 4,5-bisphosphate levels influence multiple regulatory functions of the lipid in intact living cells. The Journal of Cell Biology 175, 377–382. [DOI] [PMC free article] [PubMed] [Google Scholar]
- Weiss SB, Kennedy EP, and Kiyasu JY (1960). The enzymatic synthesis of triglycerides. J. Biol. Chem 235, 40–44. [PubMed] [Google Scholar]
- Wilfling F, Wang H, Haas JT, Krahmer N, Gould TJ, Uchida A, Cheng J-X, Graham M, Christiano R, Fröhlich F, et al. (2013). Triacylglycerol synthesis enzymes mediate lipid droplet growth by relocalizing from the ER to lipid droplets. Developmental Cell 24, 384–399. [DOI] [PMC free article] [PubMed] [Google Scholar]
- Yan R, Qian H, Lukmantara I, Gao M, Du X, Yan N, and Yang H (2018). Human SEIPIN Binds Anionic Phospholipids. Developmental Cell 47, 248–256. e4. [DOI] [PubMed] [Google Scholar]
- Yen C-LE, Stone SJ, Koliwad S, Harris C, and Farese RV (2008). Thematic review series: glycerolipids. DGAT enzymes and triacylglycerol biosynthesis. J. Lipid Res 49, 2283–2301. [DOI] [PMC free article] [PubMed] [Google Scholar]
- Yu S, Viswakarma N, Batra SK, Sambasiva Rao M, and Reddy JK (2004). Identification of promethin and PGLP as two novel up-regulated genes in PPARgamma1-induced adipogenic mouse liver. Biochimie 86, 743–761. [DOI] [PubMed] [Google Scholar]
Associated Data
This section collects any data citations, data availability statements, or supplementary materials included in this article.
Supplementary Materials
Table S1 (related to Figure 1). Mass spectrometry analysis for seipin-EGFP immunoprecipitation.
Shown are the label free quantitation (LFQ) of average peptide intensities for each protein detected in the different replicates (seipin WT-EGFP, seipin ΔHH-EGFP, and seipin TM(FIT2)-EGFP), the number of total peptides, unique peptides, and the log2 transformation of protein abundance. Data shown are from three independent experiments.
Table S4 (Related to the STAR Methods). Cloning strategies used in this paper.
Table S3 (Related to the STAR Methods). Synthetic double-stranded DNA fragments used in this paper.
Table S2 (related to Figure S7). Sequence alignment and homology search for LDAF1 protein using EVfold server. The full-length protein sequence of LDAF1 (Q96B96-1) was used for homology search in EVfold (http://evfold.org/evfold-web/status.do?job_id=af2efe51-6618-4374-8f23-88de2be516df).
Video S1 (related to Figure 1). Dynamic behaviors of endogenous LDAF1 and seipin in cells.
HILO time-lapse of live LDAF1 KO SUM159 cell with endogenously fluorescent proteins tagged at LDAF1 (mScarlet-i) and seipin (sfGFP) loci.
Video S2 (related to Figure 3). LD formation at the LDAF1 foci after LDAF1 recruitment to the ER-PM contact site.
TIRF time-lapse of live LDAF1 KO SUM159 cell with endogenously fluorescent proteins tagged at seipin (sfGFP) and PLIN3 (HaloTag) loci. The cell was co-transfected with PM-FRB-TagBFP and LDAF1-mScarlet-i-FKBP and pre-stained with 500 nM of Janelia Fluor 646 for 1 hr. LDAF1 is recruited to the ER-PM contact sites by 3 nM of heterodimerizer treatment. 0.5 mM oleic acid was added at the beginning of image acquisition.
Data Availability Statement
This study did not generate any unique datasets or code.