

Abstract
Dysregulation of the immune response to bacterial infection can lead to sepsis, a condition with high mortality. Multiple whole-blood gene expression studies have defined sepsis-associated molecular signatures but did not resolve changes in transcriptional states of specific cell types. Here, we used single-cell RNA sequencing to profile the blood of patients with sepsis (n = 29) across three clinical cohorts with corresponding controls (n =36). We profiled total peripheral blood mononuclear cells (PBMCs, 106,545 cells) and dendritic cells (19,806 cells) across all patients and, based on clustering of their gene expression profiles, defined 16 immune cell states. We identified a unique CD14+ monocyte state that is expanded in septic patients and validated its power in discriminating septic patients from controls using public transcriptomic data from patients of different disease etiologies and multiple geographic locations (18 cohorts, n = 1,213 patients). We identified a panel of surface markers for isolation and quantification of the monocyte state, characterized its epigenomic and functional phenotypes, and propose a model for its induction from human bone marrow. This study demonstrates the utility of single cell genomics in discovering disease-associated cytologic signatures and provides insight into the cellular basis of immune dysregulation in bacterial sepsis.
Introduction
Sepsis is a prevalent disease with high mortality that contributes to a large fraction of healthcare spending worldwide1. To date, no diagnostic biomarker nor targeted therapeutic agent for sepsis has proven useful or effective. This is likely attributable to substantial heterogeneity of disease due to multiple potential pathogens, sites of infection, individualized host immune responses and manifestations of organ dysfunction2–4. Equally, there is limited insight into the cellular and molecular basis of sepsis-induced systemic immune dysregulation5–8. Prior host gene expression profiling studies relied on whole blood to characterize diagnostic or prognostic gene signatures9–12, an approach that aggregates transcriptomic signals from many different cell types, but may not detect signatures from rarer cells and does not identify cell type-specific disease signatures13. To overcome these limitations, we characterized the spectrum of immune cell states in the blood of septic patients using single-cell-resolved gene expression profiling.
scRNA-seq defines immune cell states in sepsis patients across multiple clinical cohorts
We performed scRNA-seq on PBMCs from septic patients and controls to define the range of cell states present in these patients, identify differences in cell state composition between groups, and detect immune signatures that distinguish sepsis from the normal immune response to bacterial infection (Figure 1). Our primary cohorts targeted patients with urinary tract infection (UTI) early in their disease course, within 12 hours of presentation to the Emergency Department (ED) (Figure 1b–e, Supplementary Table 1). UTI was selected to minimize heterogeneity introduced by different infectious sites and maximize diagnostic clarity, since UTI can be reliably confirmed post hoc by urine culture. We included patients with UTI (clinical urinalysis with >20 WBCs per high-power field) as the primary infection both with and without signs of sepsis, and subsequently adjudicated the enrolled patients into UTI with leukocytosis (blood WBC ≥ 12,000 per mm3) but no organ dysfunction (Leuk-UTI), UTI with mild or transient organ dysfunction (Int-URO), and UTI with clear or persistent Methods); organ dysfunction (Urosepsis, URO) (patients with simple UTI without leukocytosis or signs of organ dysfunction were not enrolled. Our schema distinguishes transient versus sustained sepsis-related organ dysfunction, although both meet established criteria (Sepsis-2 criteria) for sepsis14.
Figure 1. Cohort definition and analysis strategy.
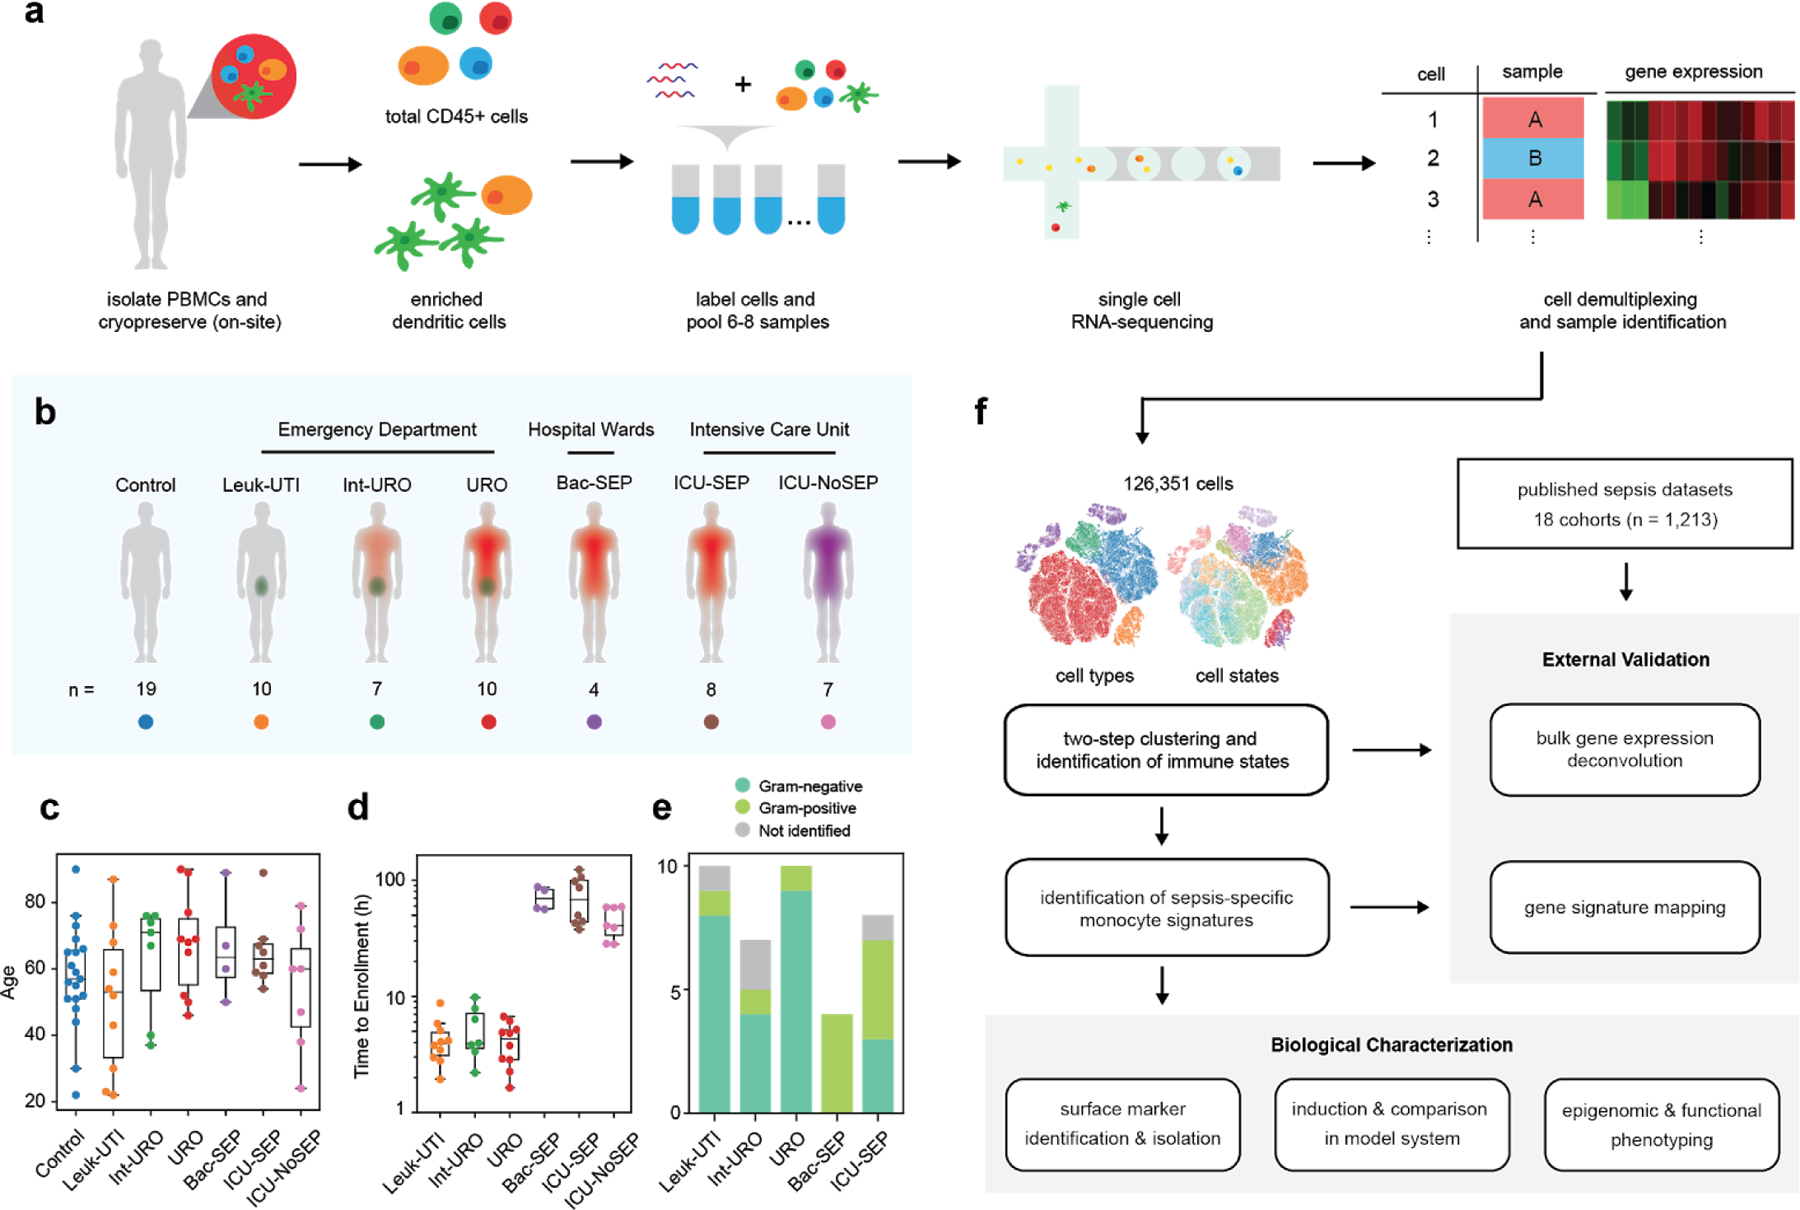
(a) Processing pipeline for blood samples used in this study. Total CD45+ PBMCs and enriched dendritic cells for groups of patients were labelled with cell hashing antibodies and loaded on a droplet-based scRNA-seq platform. Cells were demultiplexed and multiplets were removed based on calls for each barcoding antibody. (b) Schematic and number of patients for each cohort profiled in this study. (c) Age distribution of patients and controls analyzed in this study. (d) Time to enrollment from hospital presentation for each patient across all cohorts. Boxes show the mean and interquartile range (IQR) for each patient cohort, with whiskers extending to 1.5 IQR in either direction from the top or bottom quartile. (e) Barplots showing fractions of Gram-positive and Gram-negative pathogens for each cohort. (f) Analysis pipeline: cell states were identified via two-step clustering, and fractional abundances thereof were compared to find sepsis-specific states. Further signatures were derived from these states using differential gene expression and gene module analysis. These signatures were validated in external sepsis datasets via a combination of bulk gene expression deconvolution, direct mapping of gene signatures, and meta-analysis. Experiments were performed to identify surface markers, develop a model system for induction, analyze the epigenomic profile, and characterize the functional phenotype of the identified cell state.
We also profiled patients from two secondary cohorts from a different hospital: bacteremic patients with sepsis in hospital wards (Bac-SEP) and patients admitted to the medical intensive care unit (ICU) either with sepsis (ICU-SEP) or without sepsis (ICU-NoSEP). Inclusion criteria were the same for primary and secondary cohorts. These secondary cohorts included patients later in their disease course, enrolled at least 24 hours after initial hospital presentation and receipt of intravenous antibiotics. For comparison, we analyzed specimens from uninfected, healthy controls (Control). Our multi-cohort approach, spanning two hospitals and several clinical phenotypes, supports the generalizability of our results across different clinical contexts.
We profiled total CD45+ PBMCs (1,000–1,500 cells per patient) and LIN-, CD14-, HLA-DR+ dendritic cells (300–500 cells per patient) using a 3’ RNA tag sequencing approach. We multiplexed 6–8 samples per experiment using cell hashing, observing no major batch effects in our data (Methods, Extended Data Fig. 1).We identified immune cell states by clustering the cells in two steps: low-resolution clustering to identify the major immune cell types (Figure 1f, Extended Data Fig. 2a–b, Extended Data Fig. 3), then sub-clustering each major cell type separately in a robust manner (Extended Data Fig. 2c–d, Methods). This approach identified 16 cell states that are found across numerous patients (n=31–69 per state) in different cohorts and processing batches (Figure 2a, Extended Data Fig. 2e–f). Among these are transcriptional states of T, B, NK, and dendritic cells15–17, and importantly, four monocyte states (Extended Data Fig. 4,5). We found four distinct monocyte groups: MS1, CD14+ cells characterized by high expression of RETN, ALOX5AP, and IL1R2 (Figure 2b); MS2, characterized by high expression of class II MHC; MS3, similar to non-classical CD16hi monocytes; and MS4, which is composed of the remaining CD14+ cells that express low levels of both class II MHC and inflammatory cytokines. We noted that some marker genes characterizing the MS1 state (Supplementary Table 2) had been previously associated with sepsis in studies measuring either serum protein or whole blood mRNA levels18–21.
Figure 2. scRNA-seq identifies sepsis-specific immune cell states and gene signatures.
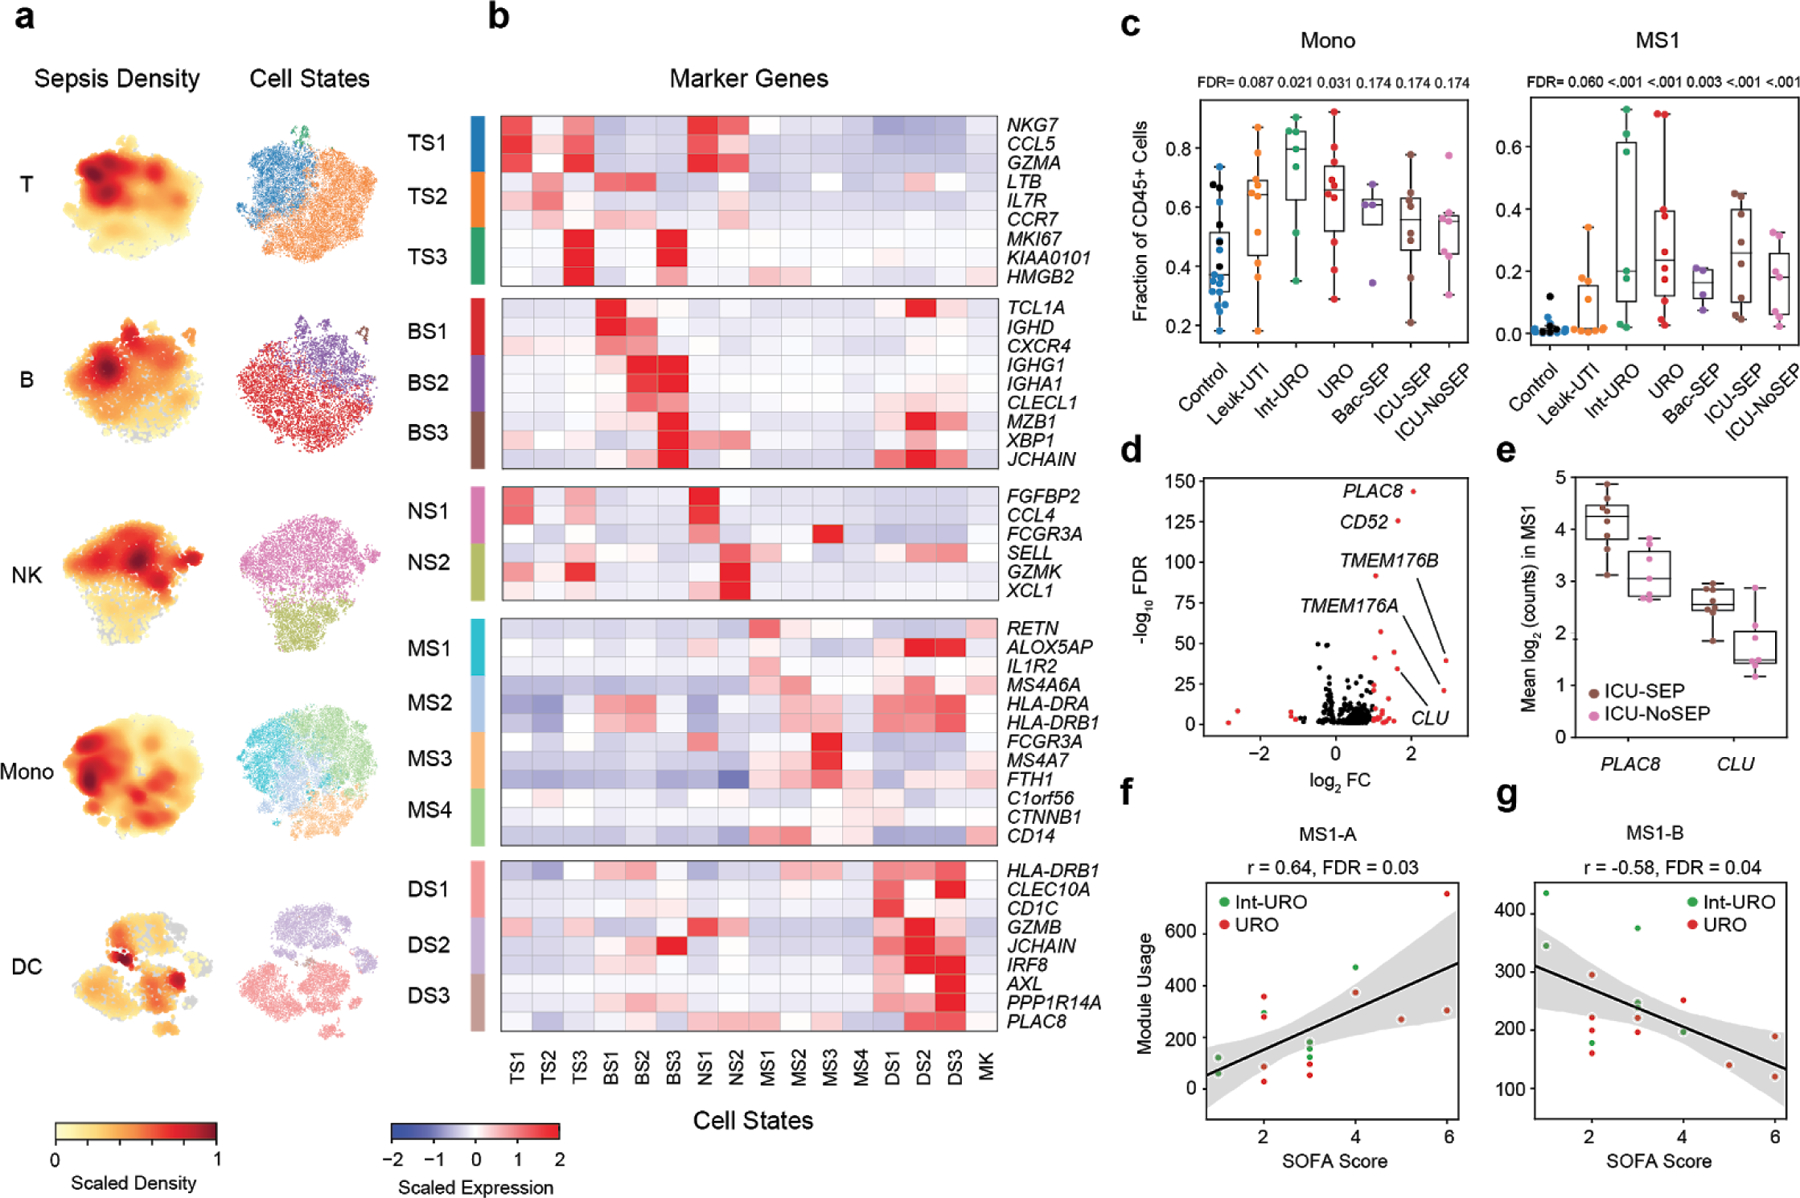
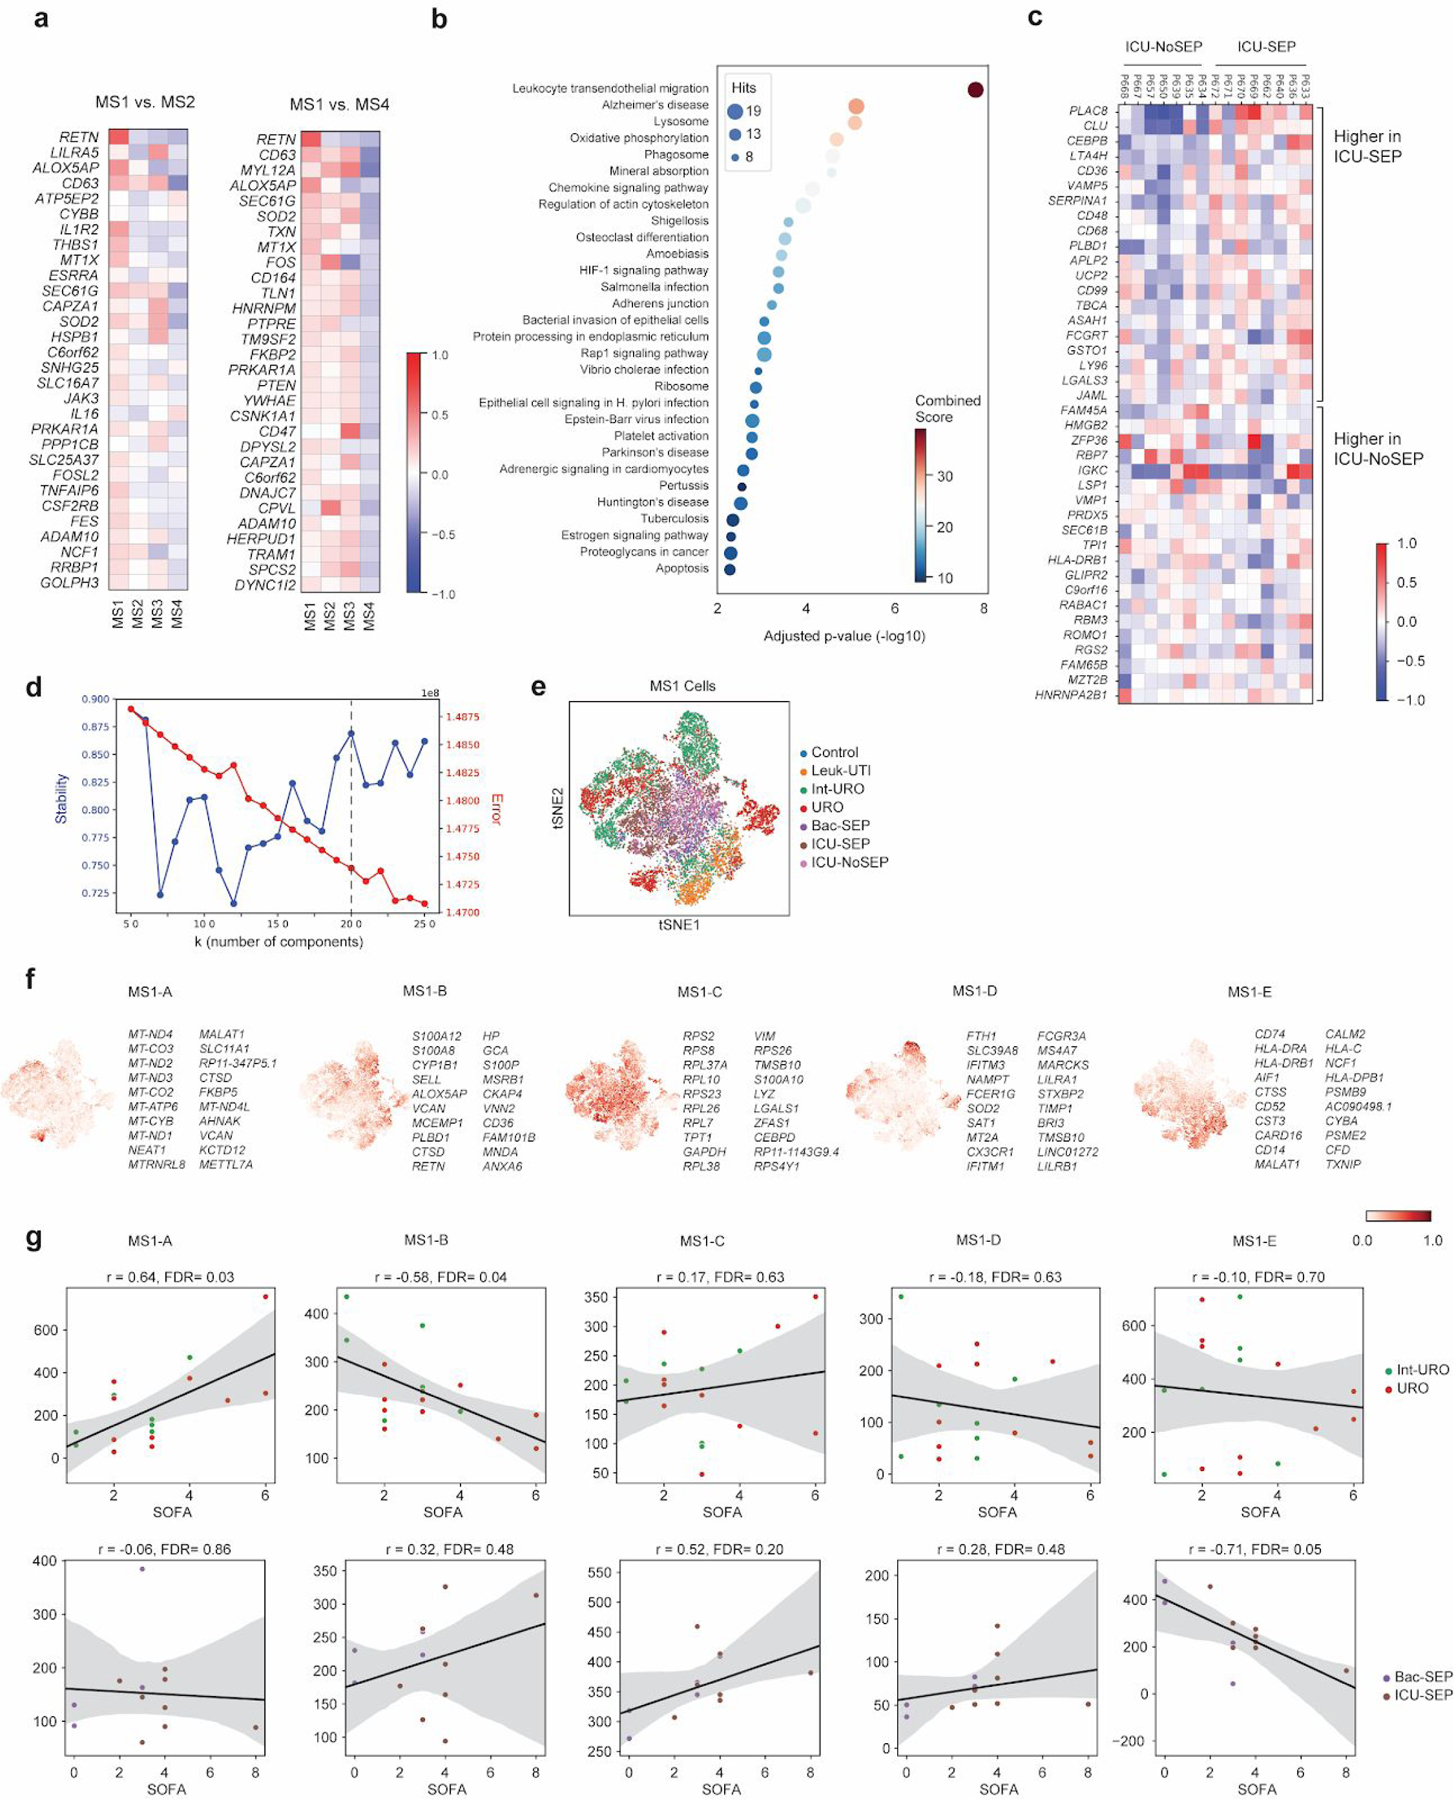
(a) t-distributed stochastic neighbor embedding (tSNE) plots for each cell type (n = 32341, 7970, 9390, 58557, and 14299, cells for T, B, NK, Mono, and DC, respectively) colored by embedding density of cells from sepsis patients (Int-URO, URO, Bac-SEP and ICU-SEP; left) and cell state (right). (b) Select marker genes that are differentially expressed (false discovery rate [FDR] < 0.05, two-tailed Wilcoxon rank-sum test) in each cell state, when compared with other cell states within the same cell type. Color scale corresponds to z-scored, log-transformed mean gene expression counts for each cell state. TS, T cell states; BS, B cell states; NS, NK cell states; MS, monocyte states; DS, dendritic cell states; MK, megakaryocytes. (c) Fraction of total CD45+ cells across each patient type for total monocytes (left) and MS1 cells (right). In Control group, points for healthy controls that were follow-up samples from enrolled Leuk-UTI, Int-URO, and URO patients are indicated as black symbols and those for matched healthy control samples from an outside source are indicated as aqua symbols. FDR values are shown when comparing each disease state with healthy controls (two-tailed Wilcoxon rank-sum test, corrected for testing of multiple states). Boxes show the median and IQR for each patient cohort, with whiskers extending to 1.5 IQR in either direction from the top or bottom quartile. Sample size (n) for each cohort is indicated in Figure 1b. (d) Volcano plot showing differential expression analysis results (two-sided Wilcoxon rank-sum test) between MS1 cells from ICU-SEP and MS1 cells from ICU-NoSEP patients. Genes with log2 FC (fold-change) > 1 are highlighted in red, and the top 5 genes with the highest positive fold-changes are labeled. n = 2,153 and 1,442 cells from the 8 ICU-SEP and 7 ICU-NoSEP patients, respectively. (e) Box and swarm plots showing the mean expression (log2 unique molecular identifier [UMI] counts) of PLAC8 and CLU in MS1 cells for each patient from the ICU-SEP and ICU-NoSEP cohorts. Boxes show the median and IQR for each patient cohort, with whiskers extending to 1.5 IQR in either direction from the top or bottom quartile. (f-g) Scatterplots showing correlation between mean gene module usage in MS1 cells and SOFA scores for Int-URO and URO patients. Line and shadow indicate linear regression fit and 95% confidence interval, respectively. Significance of the correlations (Pearson r) were calculated with a two-sided permutation test, corrected for testing of multiple modules. SOFA, sequential organ failure assessment.
Expansion of a monocyte state, MS1, in the blood of sepsis patients
We analyzed the differences in abundances of these cell states across different patient phenotypes (Figure 1f). We found that the fractional abundances of cell states in the blood are strongly associated with the disease status of an individual (Extended Data Fig. 6a–b), whereas absolute abundances are less so (Extended Data Fig. 6c). The fractions of classical cell types vary significantly among the Control, Leuk-UTI, and sepsis (Int-URO, URO, Bac-SEP, and ICU-SEP) cohorts; however, this variation is less pronounced than that of cell states derived from our clustering (e.g., monocytes versus MS1, Figure 2c). Of note, MS1 cells constitute a significantly larger fraction of CD45+ cells in Int-URO and URO patients than in Control or Leuk-UTI patients and are also enriched in septic patients in our secondary cohorts (Bac-SEP and ICU-SEP vs. Control, FDR < 0.001). MS1 cells are also present at a slightly higher fraction in septic patients (Int-URO, URO, Bac-SEP, and ICU-SEP) than severely ill patients without infection (ICU-NoSEP, FDR = 0.27).
Given the expansion of MS1 in septic patients, we reasoned that analysis of gene expression signatures within MS1 cells may reveal useful clinical markers for sepsis and further insight into biological mechanisms. To find signatures that discriminate sepsis from critical illness without bacterial infection not distinguished by cell state abundance alone, we performed differential expression analysis specifically on MS1 cells from ICU-SEP and ICU-NoSEP patients (Figure 2d) and found two genes, PLAC8 and CLU, that discriminate these two patient populations (Figure 2e, Extended Data Fig. 7c). Whereas PLAC8 expression has been associated with sepsis in studies analyzing the bulk expression of blood cells22, CLU expression has not, perhaps due to its specific up-regulation in MS1 cells.
We analyzed co-varying genes among MS1 cells using non-negative matrix factorization and found five gene modules that are detected in more than half of our sepsis patients (Extended Data Fig. 7d–f, Supplementary Table 3). Of note, the module in MS1 cells corresponding to mitochondrial respiration (MS1-A; MT-ND4, MT-CO3, MT-ATP6) correlated significantly with disease severity in sepsis patients from our primary cohort (Int-URO and URO, FDR = 0.03; Figure 2f), supporting the link between alterations in energy metabolism and immunoparalysis in sepsis23. In addition, a module of genes in MS1 related to anti-inflammatory and pro-resolving responses (MS1-B; S100A8, RETN, ALOX5AP, FPR2)24–26 correlates negatively with severity (FDR = 0.04) (Figure 2g, Extended Data Fig. 7g), consistent with a current model of sepsis wherein patients early in their disease have a heightened inflammatory state, but subsequently switch to an immunosuppressive state27.
Validation of MS1 signatures as markers for sepsis
To compare the performance of our signatures against previously reported classifiers, we quantified the classification accuracy of the MS1 fraction, PLAC8 +CLU expression in MS1 cells, and published gene-based signatures22,28 in our cohort (Figure 3a). When classifying all patients with sepsis (Int-URO, URO, Bac-SEP, and ICU-SEP) against Control and Leuk-UTI patients, the MS1 fraction outperforms two published gene set signatures (AUC: MS1 Fraction = 0.92, FAIM3-to-PLAC8 = 0.81, and SeptiCyte Lab = 0.74). In addition, PLAC8 + CLU expression in MS1 cells has higher classification accuracy when comparing ICU-SEP to ICU-NoSEP patients (AUC: MS1 PLAC8+CLU = 0.85, FAIM3-to-PLAC8 = 0.74, and SeptiCyte Lab = 0.82). These external gene signatures were derived from whole blood profiling in varying clinical contexts, which could impact their performance when applied to our PBMC-derived expression data. In addition, the performance of MS1 PLAC8+CLU may be inflated when applied to a subset of patients from which MS1 was derived. Nevertheless, our approach provides biological context for these previously derived signature genes, as their expression in our data was specific to certain cell states (Extended Data Fig. 8).
Figure 3. Analysis of the MS1 cell state as a sepsis marker.
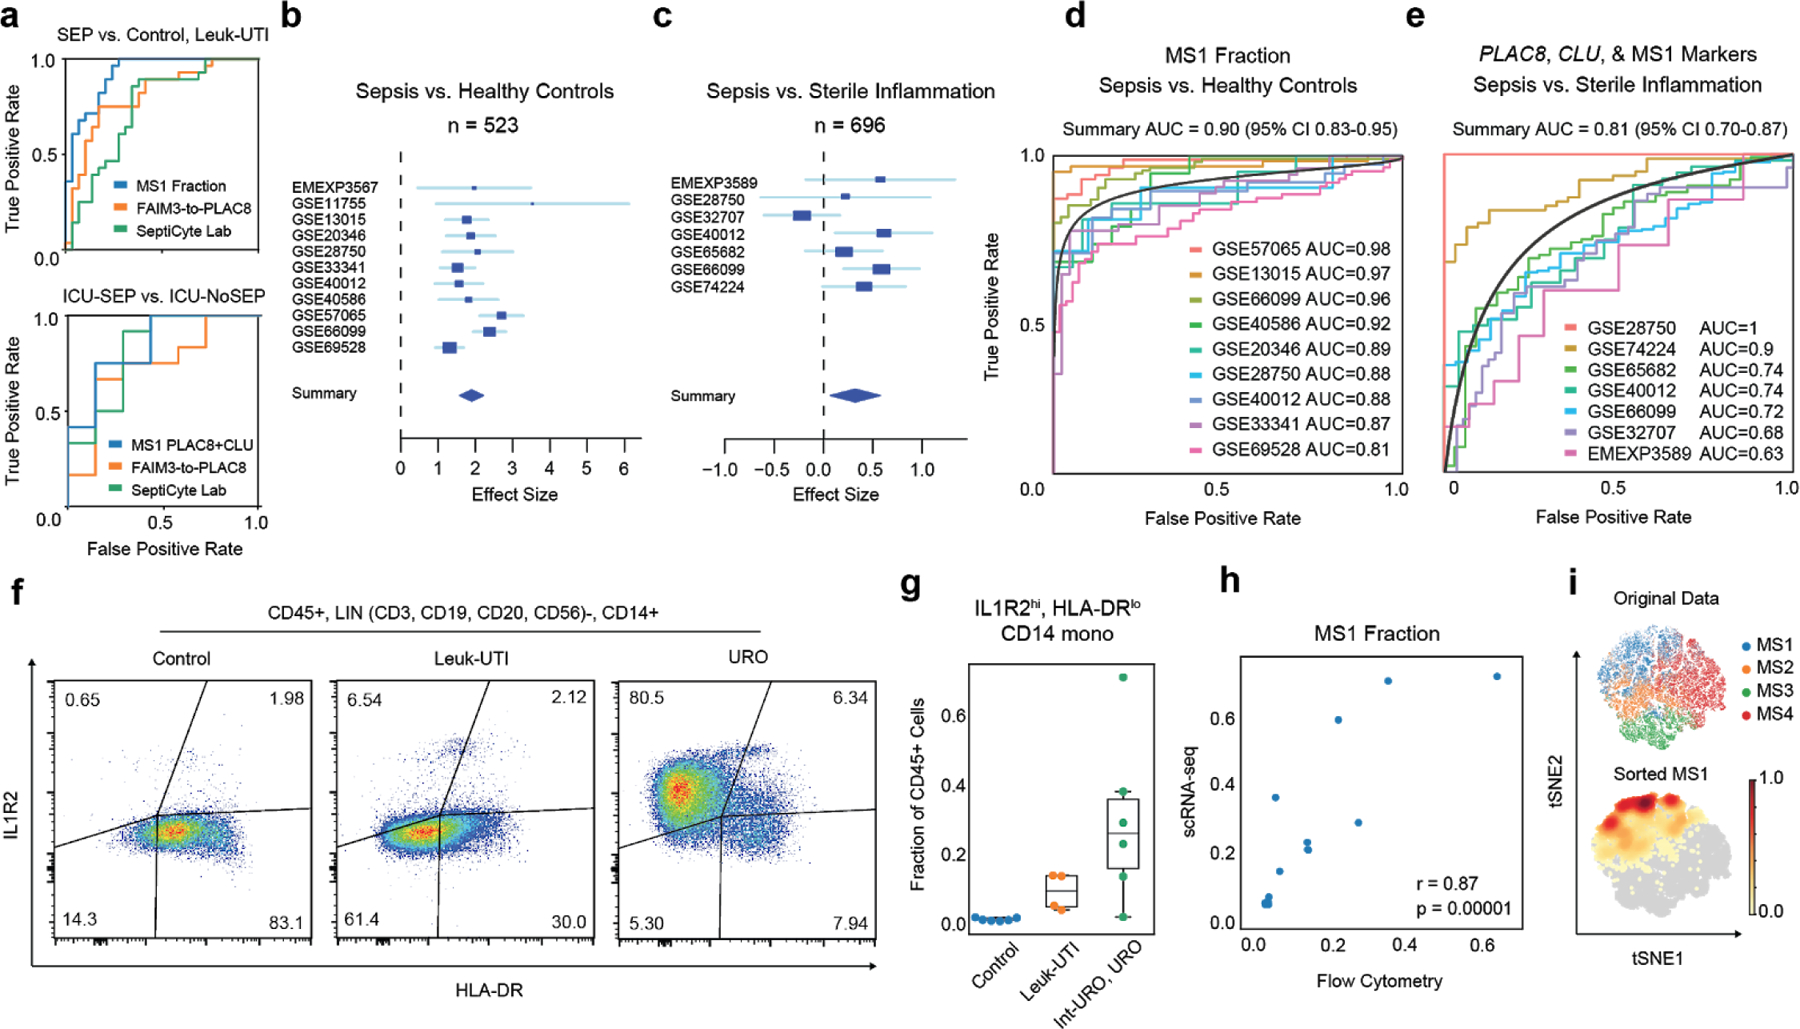
(a) Receiver-operating characteristic (ROC) curve for sepsis patient classification based on MS1 abundance (top) or mean PLAC8 and CLU expression in MS1 cells (bottom), and gene expression score-based classifiers (FAIM3-to-PLAC8, SeptiCyte Lab). MS1 is taken as the fraction of total CD45+ cells per patient as defined by scRNA-seq. Gene-set scores were calculated, as detailed in each corresponding publication, on the pseudo-bulk gene expression matrix obtained by summing read counts from all cells of each patient. SEP indicates all sepsis patients analyzed in this study (Int-URO, URO, Bac-SEP, ICU-SEP). (b-c) Forest plots showing the effect size (log2 standardized mean difference between indicated patient phenotypes) of inferred MS1 abundance in each dataset from bulk gene expression deconvolution. Accession numbers of the data from each study are listed on the left. Boxes indicate the effect size in an individual study, with whiskers extending to the 95% confidence interval. Size of the box is proportional to the relative sample size of the study. Diamonds represent the summary effect size among the patient groups, determined by integrating the standardized mean differences across all studies. The width of the diamond corresponds to its 95% confidence interval. (d) Individual ROC curves for sepsis vs. uninfected healthy controls; analysis includes each study in (b) for which the number of sepsis patients and controls were both greater than 5 (n = 751 total patients from 9 cohorts). (e) ROC curves for classifying sepsis vs. sterile inflammation (n = 696 total patients from 7 cohorts) based on the mean expression of PLAC8 , CLU, and the top 6 MS1 marker genes (RETN, CD63, ALOX5AP, SEC61G, TXN, MT1X). Black curves in (d, e) indicate the summary ROCs. (f) Flow cytometry density plots of LIN-, CD14+ monocytes gated on surface expression of IL1R2 and HLA-DR. Percentage of the population over total CD14+ monocytes in each quadrant is indicated. Each density plot shows PBMCs from a single patient analyzed in one experiment. (g) Fractional abundance of CD14+, HLA-DRlo, IL1R2hi monocytes by flow cytometry in Control, Leuk-UTI, Int-URO, and URO patients (n = 6, 4, and 6, respectively). Samples used for this analysis were from the primary cohort (Control, Leuk-UTI, Int-URO, URO). Boxes show the median and IQR for each patient cohort, with whiskers extending to 1.5 IQR in either direction from the top or bottom quartile. (h) Correlation of MS1 fractions defined by scRNA-seq (y-axis) and CD14+, HLA-DRlo, IL1R2hi monocyte fractions of CD45+ cells (x-axis) from n = 4 Leuk-UTI and n = 6 patients from (g). Significance of the correlation (Pearson r) was calculated with a two-sided permutation test. (i) scRNA-seq of sorted CD14+, HLA-DRlo, IL1R2hi, monocytes and original MS1 cells visualized with tSNE projection. Top scatterplot (n = 15,021 cells) shows original classification of cells from the patient cohorts, bottom shows embedding density of sorted cells in the same projection.
To validate our signatures in external datasets, we analyzed independent cohorts of patients with bacterial sepsis from published bulk expression studies of sepsis. First, we validated the use of bulk gene expression deconvolution29,30 on our data to infer the relative fraction of MS1 cells and cells in other states in the blood (Extended Data Fig. 9a–c, Methods). Upon extending this approach to bulk transcriptional data from 11 sepsis cohorts included in a recent meta-analysis4, we found the inferred abundance of the MS1 state higher in septic patients than in controls in each study, with a summary effect size of 1.9 across all cohorts (FDR = 1.75 × 10⁻³⁰, Figure 3b, Supplementary Table 4). Furthermore, the inferred MS1 fraction alone for each patient can be used as a classifier for sepsis in the same datasets with a summary AUC of 0.90 (range of 0.81–0.98) across all studies (Figure 3d), performing similarly to reported classifiers that were derived from bulk gene expression signatures9 (Extended Data Fig. 9e). In a similar analysis of 7 datasets comparing septic patients with ICU controls (patients with non-infectious systemic inflammatory response syndrome)9 (Figure 3c), MS1 is expanded in sepsis albeit with a lower but notable effect size of 0.32 (FDR = 0.08), consistent with observations in our own cohorts. Whereas the MS1 fraction alone cannot be used as a sepsis lassifier in this context, analyzing the co-expression of PLAC8, CLU, and MS1 marker genes (RETN, CD63, ALOX5AP, SEC61G, TXN, MT1X) in these datasets performs well in classifying sepsis patients against sterile inflammation (Figure 3e), with a summary AUC of 0.81 (range of 0.63–1.00), performing similarly to published signatures (Extended Data Fig. 9d,f). This analysis of published transcriptional data implies that MS1 cells are present in septic patients across several geographic locations, genetic backgrounds, and clinical contexts, and demonstrates the potential utility of MS1-specific gene signatures for the discrimination of sepsis from sterile inflammation.
Surface markers for isolation of MS1 cells
To improve its utility as a cytologic marker, we identified a panel of surface proteins that can be used to define the MS1 cell state by flow cytometry. Among the differentially expressed genes that distinguish it from other CD14+ monocytes, low HLA-DR and high IL1R2 expression can be used to quantify the fraction of MS1 cells (Figure 3f). Previous studies31,32 have shown that CD14+ monocytes from patients with sepsis have decreased HLA-DR expression; however, we found that monocytes from Leuk-UTI patients also have this phenotype, signifying that decreased HLA-DR expression alone is insufficient to distinguish patients with sepsis from those with uncomplicated infection. By contrast, HLA-DRlo, IL1R2hi CD14+ monocytes were at higher frequencies in Int-URO and URO patients than in Control or Leuk-UTI patients (Figure 3g), and their fractions measured by flow cytometry correlated significantly with fractions determined by scRNA-seq (Pearson r = 0.87) (Figure 3h). Cells sorted with this phenotype (7,098 cells from 5 URO patients) co-localize by expression profile with MS1 cells in our original dataset when analyzed together and projected on the same t-distributed stochastic neighbor embedding (tSNE) plot (Figure 3i). This combination of cell surface markers could be used to purify the cell state for further molecular and functional characterization or could potentially be employed as a routine tool for rapid quantification of the MS1 fraction in patients at risk of developing sepsis.
Generation of MS1-like cells from human bone marrow
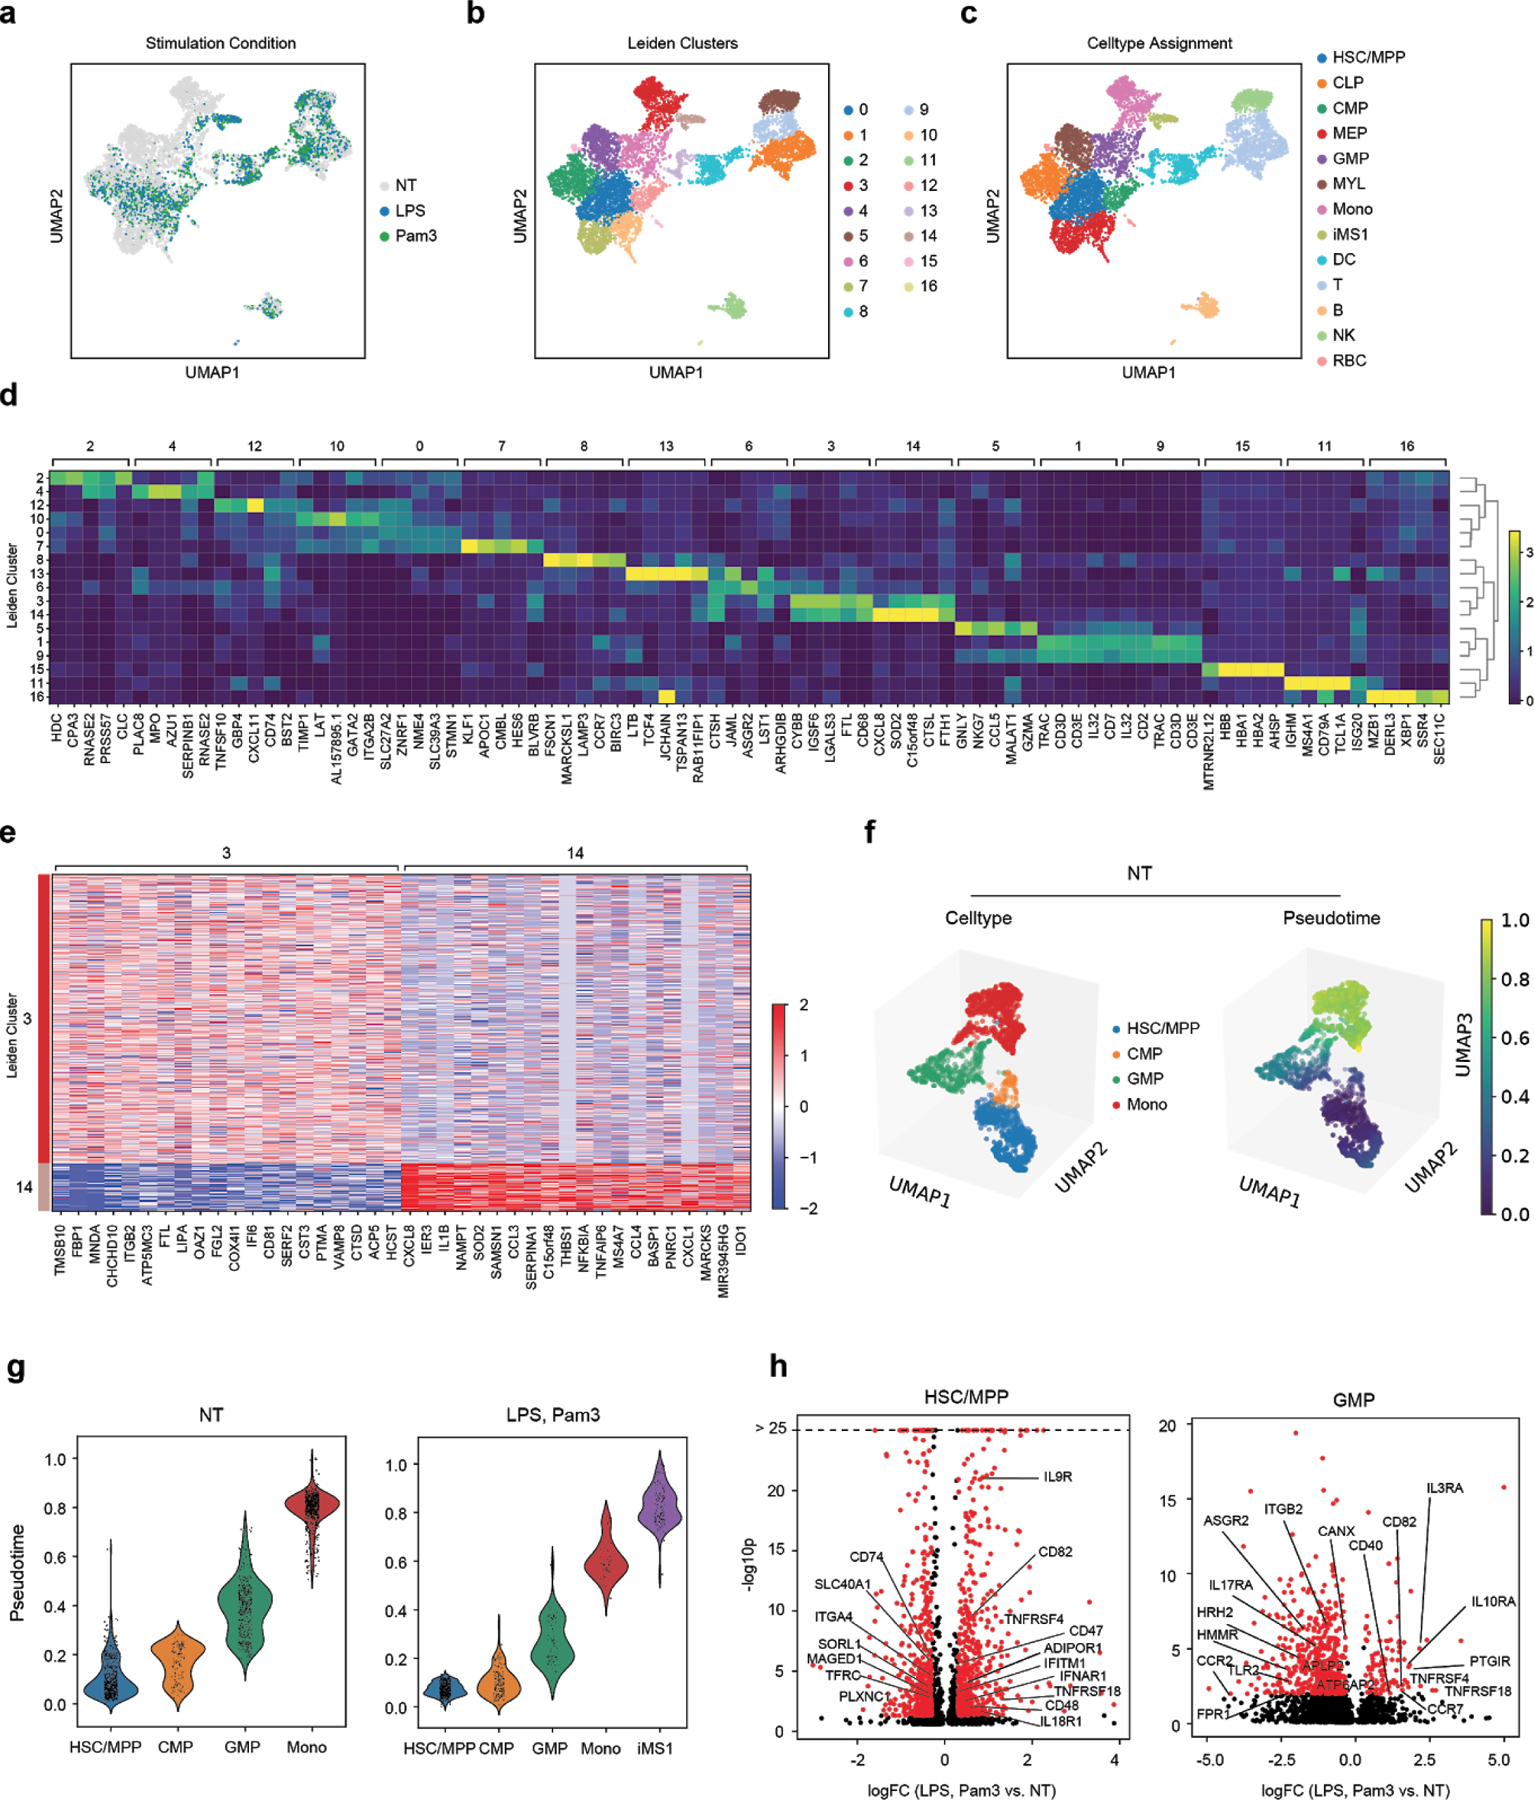
Low HLA-DR expression is associated with monocyte immaturity, resulting in decreased responsiveness to stimuli33,34. We hypothesized that MS1 cells might be derived from bone marrow mononuclear cells (BMMCs), which include hematopoietic precursors, rather than from mature immune cells in peripheral blood. We found that chronic stimulation of BMMCs with Pam3CSK4 (Pam3) or lipopolysaccharide (LPS) results in the emergence of a CD14+, HLA-DRlo, IL1R2hi population (Figure 4a). The abundance of this population, as a fraction of total CD14+ cells, increased significantly over time in treated BMMCs, but not in treated PBMCs (Figure 4b). Furthermore, scRNA-seq profiling of BMMCs treated with LPS or Pam3CSK4 revealed a cluster of cells scoring highly for MS1 signature genes that are absent in the untreated condition (Figure 4c–d, Extended Data Fig. 10a–e). Trajectory analysis of the myeloid populations suggests that the MS1-like induced population (iMS1, Leiden cluster 14) proceeds initially through a differentiation pathway similar to that of cells from the non-stimulated condition but that it subsequently deviates from this fate (Figure 4e, Extended Data Fig. 10f–g). Progenitor populations in the stimulated condition display several differentially expressed genes (Extended Data Fig. 10h); stimulated progenitor cells up-regulate several receptors previously associated with inflammation-induced myelopoiesis (e.g. IL3R, IL10R, IFNAR1)35, suggesting that an MS1-like population may emerge in the bloodstream as a result of sepsis-induced myelopoiesis. These results demonstrate the potential of human bone marrow cells as a model for the expansion of the MS1 state in sepsis, and support the hypothesis that the emergence of reprogrammed myeloid cells in the blood stems from dysregulated differentiation of hematopoietic precursors36,37.
Figure 4. Induction and characterization of MS1 monocytes.
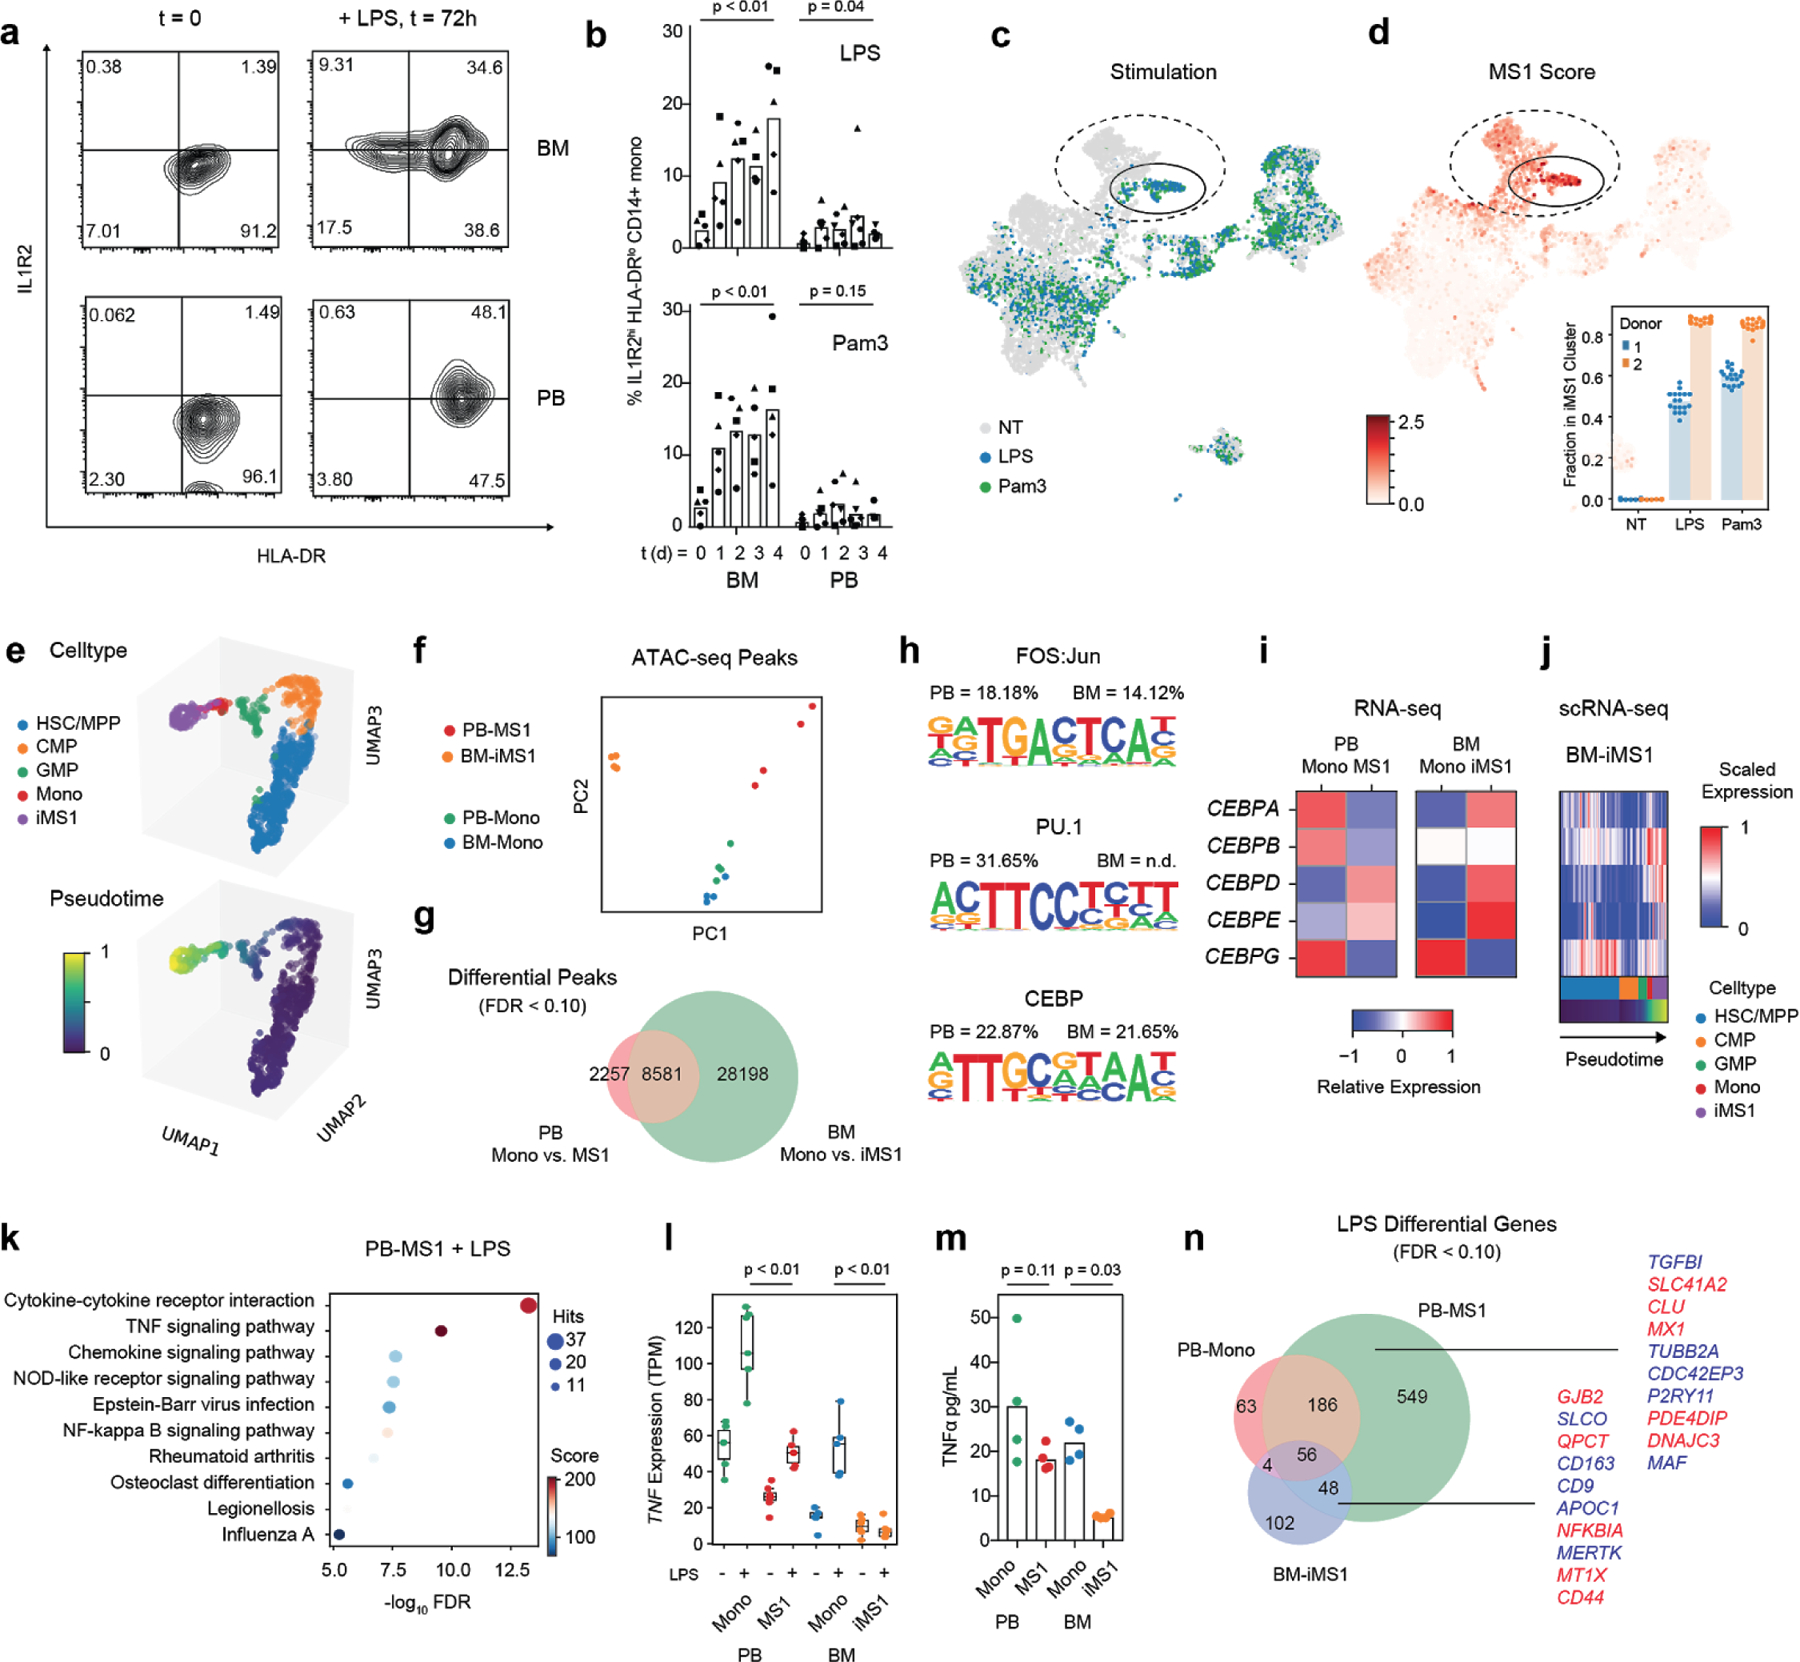
(a) Flow cytometry contour plots showing IL1R2 and HLA-DR of cells gated on the CD14+ fraction from either bone marrow (BM, top row) or peripheral blood (PB, bottom row) mononuclear cells. Cells are either freshly thawed (left column) or stimulated with 100 ng/mL LPS for 3 days in Hematopoietic Stem Cell (HSC) cytokine-rich media (right column). Each density plot shows cells from a single donor analyzed in one experiment. (b) Fractional abundance of HLA-DRlo, IL1R2hi cells among CD14+ monocytes in PB or BM mononuclear cells stimulated with either 100 ng/mL LPS (top) or Pam3CSK4 (bottom) over time (0 to 4 days). Different symbols indicate cells obtained from different healthy donors. P-values are calculated from a two-sided Wilcoxon rank-sum test between day 0 and day 4. (c-d) scRNA-seq of BM mononuclear cells (n = 8,702 cells) incubated in HSC cytokine-rich media with no treatment or 100 ng/mL LPS or Pam3CSK4 for 4 days. Cells are visualized on uniform manifold approximation and projection (UMAP) plots colored by treatment (c) or MS1 score (d). MS1 scores are given as the ratio of the average expression of the top 15 MS1 marker genes to the average expression of a randomly sampled set of 50 reference genes. In each plot, the cluster with the highest MS1 score is circled. Dotted circles indicate monocyte clusters. Inset in (d) shows the mean fractional abundance of the iMS1 cluster among monocytes across each donor and treatment condition; each individual point is calculated by randomly sampling the data and clustering the subsampled dataset (n = 20 iterations). (e) UMAP projections (n = 901 cells) of Pam3CSK4 and LPS stimulated BM myeloid and progenitor cells (HSC/MPP, CMP, GMP, Mono, and iMS1) colored by celltype (top) and diffusion pseudotime (bottom). (f) Principal component analysis (PCA) plots of assay for transposase-accessible chromatin using sequencing (ATAC-seq) peak accessibility profiles for four different sorted monocyte populations: PB-Mono, PB-MS1, BM-Mono (CD14+ monocytes from freshly thawed BM cells), and BM-iMS1 (CD14+ monocytes from BM cells stimulated for 4 days with 100 ng/mL LPS in HSC cytokine-rich media). Experiments were performed on two donors with two technical replicates each. (g) Venn diagram showing overlap of differentially accessible peaks (FDR < 0.1, edgeR exact test) from monocyte populations in PB and BM. (h) Sequence logos showing the top 3 enriched motifs in the differentially accessible peaks when comparing PB-Mono and PB-MS1. Percentages indicate the number of differential peaks that contain the motif for PB and BM (n.d. indicates that motif was not detected in the enrichment analysis). (i) Relative expression (normalized log2 transcripts per kilobase million [TPM]) of the CEBP family of transcription factors across the four monocyte populations. (j) Scaled expression (normalized log counts) of the CEBP family of transcription factors along the pseudotime trajectory in (e). (k) Top 10 enriched pathways in the differentially accessible genes (FDR < 0.1, edgeR exact test) when PB-MS1 cells are rested for 24 h and subsequently stimulated with 100 ng/mL LPS. RNA-seq experiments were performed on 2 donors with 3 technical replicates each. Sizes of circles are proportional to the number of gene hits in a set, whereas color represents the enrichment score of each gene set. (l) TNF expression and (m) TNFα protein levels in the supernatant of the indicated four sorted monocyte populations after LPS stimulation. P-values are calculated from a two-sided Wilcoxon rank-sum test between LPS-stimulated Mono and iMS1 cells. Protein measurements were performed on 2 donors with 2 technical replicates each. (n) Venn diagram showing overlap of differentially accessible genes (FDR < 0.1, edgeR exact test) from the indicated sorted monocyte populations after LPS stimulation. Top 10 genes with highest significance are indicated in red for the PB-MS1-exclusive set of genes and the overlap between BM-iMS1 and PB-MS1. HSC/MPP, hematopoietic stem cells and multipotent progenitors; CMP, common myeloid progenitors; GMP, granulocyte-macrophage progenitor.
Epigenomic landscape and transcriptional regulators of MS1 cells
Principal components analysis of genome-wide ATAC-seq profiles of monocyte populations showed that chromatin accessibility landscapes of monocytes from the peripheral blood of healthy controls (PB-Mono) and monocytes from healthy bone marrow (BM-Mono) co-localize, whereas MS1 cells sorted from sepsis patients (PB-MS1) and monocytes from BMMCs stimulated with LPS (BM-iMS1) form distinct clusters yet share similar loadings on PC2 (Figure 4f). Motif enrichment analysis on the differential peaks between PB-Mono and PB-MS1 demonstrates enrichment of the FOS:Jun, PU.1, and CEBP motifs, all of which are families of transcription factors critical to monocyte development38 (Figure 4g–h, Supplementary Table 5). Given their important role in inflammation-induced myelopoiesis38,39, we analyzed the expression of the CEBP transcription factors. Bulk RNA-seq showed an increase in CEBPD and CEBPE and a decrease in CEBPG expression in PB-MS1 compared with PB-Mono, and similarly in BM-iMS1 compared with BM-Mono (Figure 4i). Analysis of the differentiation trajectory of iMS1 cells from bone marrow progenitors also showed an increase in CEBPD expression after the transition from a GMP state (Figure 4j). Interestingly, CEBPD was among the top genes of the module comprised of transcription-related and housekeeping genes from our analysis of MS1 cells from sepsis patients (MS1-C, Extended Data Fig. 7e, Supplementary Table 3), suggesting its potential importance in the maintenance of the MS1 program. Altogether, these analyses show that MS1 cells have an epigenomic profile markedly different from normal CD14+ blood monocytes and that these differences are associated with transcription factors involved in monocyte differentiation. Although in vitro generated BM-iMS1 do not fully recapitulate the epigenomic landscape of MS1 cells, the two populations show significant overlap in accessible peaks and share the upregulation of similar transcriptional regulators.
Functional response of MS1 cells to restimulation
To compare the functional responses of MS1 cells to those of other CD14+ monocytes, we sorted the four monocyte populations and stimulated the cells with 100 ng/mL LPS after resting for 24 h. As expected, LPS stimulation results in upregulation of genes related to cytokine secretion and activation of the NF κ B signalling pathway (Figure 4k, Supplementary Table 6). However, the magnitude of response is decreased in PB-MS1 cells relative to PB-Mono, and in BM-iMS1 relative to BM-Mono, as evidenced by lower basal and induced expression of the TNF gene, and less secretion of the TNFα protein (Figure 4l–m). Analyzing the overlap in differentially expressed genes upon stimulation reveals a large number of genes that are uniquely up-regulated in PB-MS1 (Figure 4n). This includes CLU, one of the genes we propose as a marker for discriminating sepsis from non-infectious inflammation. BM-iMS1 also up-regulated a subset of the genes (12.4%) induced in PB-MS1. Of note, NFKBIA, a known inhibitor of inflammatory responses, was up-regulated in both PB-MS1 and BM-iMS1, perhaps explaining the blunted response in both populations. This analysis demonstrates that MS1 cells from sepsis patients and those induced from human bone marrow both have a dysregulated response to further bacterial stimulation, recapitulating known phenotypes of monocytes in sepsis patients.
Discussion
Our work identified a specific monocyte state in the blood, MS1, as a signature of sepsis in patients with bacterial infection in multiple cohorts. This state is also expanded in ICU patients with sterile inflammation, but particular gene signatures within the MS1 cell state further distinguish these two patient populations. Associated surface markers can be used to purify the cell state, enabling routine monitoring in settings where patients are at risk for sepsis. Additional profiling of the granulocyte compartment, which we were not able to capture using the approach employed here, will be needed to comprehensively survey the host immune landscape in sepsis. Nevertheless, these findings highlight the utility of patient phenotyping based on underlying immune responses and provide a new level of resolution for patient stratification and therapeutic development in sepsis.
By characterizing the epigenomic and functional phenotype of the MS1 state, our findings provide insight into its biology and support a model in which MS1-like cells can be induced from bone marrow precursors. Whereas the α and β members of the CEBP family of transcription factors are associated with steady-state and, we identified a different paralog, CEBPδ, that may drive the MS1 state. These sepsis-induced myelopoiesis39,40 data suggest a novel mechanism through which hematopoietic adaptation plays a role in the pathophysiology of sepsis, although more studies are needed in hematopoietic precursors from septic patients. In addition, studies in vitro and in model organisms are needed to test whether MS1 cells and their transcriptional regulators play a direct role in the induction of sepsis and to determine their potential utility as targets for therapeutic manipulation.
METHODS
Study samples and clinical adjudication
Primary cohorts comprised subjects with UTI and urosepsis presenting to the Emergency Department at the Massachusetts General Hospital (MGH) and secondary cohorts were hospitalized subjects with and without sepsis on inpatient services at the Brigham and Women’s Hospital (BWH); both hospitals are located in Boston, MA, USA. Informed consent was obtained from patients or their surrogates. Blood samples from patients and healthy controls were drawn with EDTA Vacutainer tubes (BD Biosciences) and processed within 3 h of collection. De-identified bone marrow mononuclear cell samples were purchased from AllCells or Stemcell Technologies. This study was approved by the Institutional Review Boards at the Broad Institute of MIT and Harvard and at Partners HealthCare (MA, USA), under protocols 2017P001681/PHS, 2008P000495/PHS, and 2017P000367/PHS.
The primary cohorts were enrolled in the Emergency Department (ED) at the Massachusetts General Hospital (MGH) from 12/2017 to 11/2018. They consisted of patients with urinary tract infection (UTI), defined by urine WBC >20 per high-power field on clinical urinalysis. Study samples were collected within 12 hours of arrival to the Emergency Department. Initial enrollment of these patients with UTI was into two categories: 1) those with leukocytosis (blood WBC >=12,000 per mm3) without another cause, indicating systemic inflammation from the UTI, but without organ dysfunction (cohort Leuk-UTI), and 2) those with organ dysfunction, which defines urosepsis. For the urosepsis group, we recruited patients meeting UTI criteria in the presence of organ dysfunction as specified in national quality measure definitions41 that are adapted from Sepsis-2 consensus definitions14, specifically systolic blood pressure <90 mmHg, lactate >2.0 mg/dL, requirement for vasopressor medication, new Glascow Coma Score (GCS) <15 denoting altered mental status, new creatinine >2.0 mg/dL, or need for mechanical ventilation. Whereas SOFA scores were calculated, they were not a specific criterion for enrollment or adjudication.
Once the results of initial diagnostics sent in the course of routine clinical care, including cultures, were available and the subsequent clinical course during hospitalization was known (i.e., at least 48 hours after initial presentation), clinical adjudication of each enrolled patient was independently performed by three investigators (M.R.F, R.P.B, M.B.G.), blinded to research analysis outcomes. Each enrolled patient that was found to meet criteria for the study was adjudicated to one of three clinical categories: Leuk-UTI, intermediate urosepsis (Int-URO), and urosepsis (URO). Given the spectrum of organ dysfunction severity amongst enrolled patients, we differentiated mild or transient organ dysfunction (intermediate urosepsis, or Int-URO) from sustained infection-related organ dysfunction (urosepsis, or URO). Int-URO includes patients with physiologic perturbations that qualify as sepsis in the setting of infection per national quality measure and Sepsis-2 consensus definitions14,41, but where observed organ dysfunction was isolated, relatively mild, and resolved quickly with initial therapies; examples include hypotension that resolved with fluid resuscitation, isolated mild elevation in creatinine that normalized within 24 hours, or elevated initial lactate or alteration in mental status that improved within 4–6 hours. Urosepsis (URO) includes patients with organ dysfunction that persisted or worsened despite initial therapy; examples include refractory hypotension requiring vasopressor support, persistent renal dysfunction >24 hours after enrollment, lactate increasing despite adequate volume resuscitation, or multiple organ system dysfunction. Discrepancies in adjudication among the three clinicians were resolved as a group.
For the category Leuk-UTI, we specifically targeted enrollment of patients with UTI with systemic response but without sepsis so as to provide the most appropriate comparison for our urosepsis cohorts, as a comparison to patients with simple UTI without evidence of a systemic response might highlight host signature differences attributable to a systemic response to localized infection rather than being specific to sepsis. To obtain as pure an immune signature for infection as possible, we excluded patients with immunodeficiencies, including HIV, concurrent immunomodulatory drug therapy (including prednisone or steroid equivalent, chemotherapy, or biologic immunomodulators), bone marrow or solid organ transplantation recipients, and individuals with autoimmune disease. Of note, two patients in the Leuk-UTI cohort were asplenic. For all these primary cohorts (Leuk-UTI, Int-URO, and URO), we excluded patients who had received their first intravenous antibiotic >12 hours prior to enrollment. Of the 27 patients enrolled in these cohorts, 7 were enrolled prior to antibiotic initiation, and 20 were enrolled within 7 hours of antibiotic initiation, with the median time to enrollment from antibiotic initiation for all enrolled patients 1.1 hours (IQR: 0.2–2.4 hours).
Uninfected control samples for the primary cohorts were obtained from two sources. First, follow-up blood samples were obtained from four primary cohort patients at 2–3 months after index enrollment (2 Leuk-UTI and 2 URO patients). For all other primary cohort patients, uninfected control samples consisted of blood samples from age, gender, and ethnicity-matched healthy controls obtained from Research Blood Components (MA, USA).
Secondary cohorts consisted of hospitalized patients identified as having bacteremia and sepsis but not requiring ICU admission (Bac-SEP), patients with sepsis requiring ICU care (ICU-Sep), and patients in the ICU for conditions other than sepsis (ICU-NoSEP). These cohorts were enrolled in the Brigham and Women’s Hospital (BWH) as part of the Registry of Critical Illness; the criteria for patient recruitment for this cohort are described elsewhere42,43. The Bac-SEP patients were recruited between 12/2017 and 9/2018 from hospital inpatient floors (not ICU) and had positive blood cultures within 24 h of sample collection (excluding those blood cultures that grew coagulase-negative Staphylococcus species, which was considered likely to be a contaminant). The ICU-SEP and ICU-NoSEP patients were enrolled in the BWH ICU between 11/2017 and 10/2018.
In contrast to the primary cohorts enrolled in the MGH ED, most patients in the secondary cohorts were enrolled 2–3 days after initial presentation of disease and initiation of therapy, with all patients enrolled >24 hours from hospital presentation; most had therefore received antibiotics for >24 hrs prior to enrollment (median 70 hrs for Bac-SEP, IQR 61–79 hrs; median 49 hrs for ICU-SEP, IQR 44–65 hrs). The sources of infection for secondary cohort patients included pulmonary, urinary, intraabdominal, and endovascular sites. To ensure consistency of adjudication among cohorts, secondary cohorts were adjudicated for the presence of sepsis by the three adjudicators who adjudicated the primary cohort (M.R.F, R.P.B, M.B.G.) and employing the same methods used for the primary cohorts.
During the index illnesses and/or hospitalizations, there were no deaths among patients in the Leuk-UTI, Int-URO, BAC-SEP, and ICU-NoSEP cohorts and one death each among patients in the URO and ICU-SEP cohorts. Given the small numbers of deaths, we did not specifically analyze their potential significance.
Isolation and cryopreservation of PBMCs from whole blood
Cells were isolated from whole blood samples using density gradient centrifugation, as described in a previous study13. Briefly, whole blood was diluted 1:1 with 1X PBS, layered on top of Ficoll-Paque Plus (GE Healthcare), and centrifuged at 1200 g for 20 min. The PBMC layer was resuspended in 10 mL RPMI-1640 (Gibco), and centrifuged again at 300 g for 10 min. The cells were counted, resuspended in Cryostor CS10 (StemCell Technologies), and aliquoted in 1.5 mL cryopreservation tubes at a concentration of 2x10⁶ cells/mL. The tubes were kept at −80°C overnight, then transferred to liquid nitrogen for long-term storage. The plasma layer from density gradient separation was also collected, aliquoted in 1 mL tubes, and stored at −80°C.
Staining, flow cytometry, and dendritic cell enrichment
Samples were processed in batches of 6 or 8 for pooling in single-cell RNA sequencing runs. All cells were stained with a general panel: DAPI, CD3-APC (HIT3a), CD19-APC (HIB19), CD20-APC (2H7), CD56-APC (5.1H11), CD14-FITC (M5E2), CD16-AF700 (B73.1), CD45-PE-Cy7 (HI30), HLA-DR-PE (L243) (BioLegend). At the same time, 1 uL of cell hashing antibody (HTO) was added to each sample (BioLegend). Samples were run on a SH800 cell sorter (Sony) to obtain flow cytometry data and sort both live CD45+ cells and dendritic cells. For samples from subjects enrolled in the MGH ED, dendritic cells were enriched separately with a MACS human pan-DC enrichment kit (Miltenyi Biotec). For sorting MS1 cells, the following panel was used: DAPI, CD3-APC (HIT3a), CD19-APC (HIB19), CD20-APC (2H7), CD56-APC (5.1H11), CD14-FITC (M5E2), CD45-AF700 (HI30), HLA-DR-PE-Cy7 (L243) (BioLegend) and IL1R2-PE (34141, ThermoFisher Scientific).
Single-cell RNA sequencing and analysis
Single-cell RNA sequencing was performed on the Chromium platform, using the single cell expression 3’ v2 profiling chemistry (10X Genomics) combined with cell hashing44. HTO-labelled cells from 6–8 donors were pooled equally then washed twice with RPMI-1640 immediately before loading on the 10X controller. cDNAamplification and library construction were conducted following the manufacturer’s protocol, with additional steps for the amplification of HTO barcodes. Libraries were sequenced to a depth of ~50,000 reads per cell on a Novaseq S2 (Illumina). The data were aligned to the GRCh38 reference genome using cellranger v2.1 (10X Genomics), and the hashed cells were demultiplexed using the CITE-seq count tool (https://github.com/Hoohm/CITE-seq-Count).
Single cell data analysis was performed using scanpy45. Count matrices from the cellranger output were pre-processed by filtering for cells and genes (minimum cells per gene = 10; minimum unique molecular identifiers [UMI] per cell = 100). Before clustering, the full dataset or a subset thereof was filtered for highly variable genes (minimum mean = 0.0125 and dispersion = 0.5 per gene) and scaled. Clustering was performed on the top 50 principal components of the data using the Leiden algorithm with varying resolution. To quantify the robustness of each clustering solution, the data were subsampled without replacement (90% of cells, 20 iterations), re-clustered, and an adjusted Rand index was then computed between the solutions for the original and subsampled data. The highest resolution at which the robustness began to decrease was chosen for further analysis. To ensure that no patient- or batch-specific clusters were included in the data, small clusters (< 500 cells) were combined with the next closest cluster based on their similarity in gene expression profiles. Differentially expressed genes were determined for each state by a Wilcoxon rank-sum test, with an FDR cutoff of 0.01. For visualization, tSNE projections were computed on the top 10 PCs of the dataset or subsets thereof. To specifically find genes that discriminate ICU-SEP and ICU-NoSEP populations, differentially expressed genes were filtered for those that have an in-group fraction >0.4 and out-group fraction <0.6. Consensus non-negative matrix factorization analysis was performed as detailed in a previous publication46. To ensure that no patient- or batch-specific modules were analyzed, only gene programs with mean usage >50 across all patients were included for further analysis.
Patient classification and comparison with published predictors
All comparison of abundances were tested for significance by a Wilcoxon rank-sum test. Benjamini-Hochberg FDR correction was applied to the calculated p-values for multiple testing of either cell types or states. To compare against published gene-based predictors, we summed UMI counts for each gene from all cells for each patient, scaled to the total number of UMI counts per patient, and calculated the FAIM-to-PLAC8 ratio28, SeptiCyte Lab22, and Sepsis Metascore12, as published. Receiver operating characteristic (ROC) curves were plotted based on these absolute scores, as well as the fraction of MS1 for each patient. To examine the effect of monocyte-specific analysis of bulk signatures, we conducted the same calculations on 1,000 subsampled cells (either total PBMC or monocytes only) from each individual 30 times. These were then used to plot a distribution of the area under the ROC curves (AUROCs) for each condition.
Bulk data deconvolution, gene signature mapping, and meta-analysis
We constructed a reference signature matrix for our cell states by generating bulk profiles from single cell references, and ranking the genes based on effect size47. We first optimized the number of genes in the signature matrix by finding the minimum number of genes where the reduction in prediction error is saturated. We found this value to be at >50 genes and selected 100 genes per state and lineage (1,201 total, union of all genes) in the final matrix. To construct the signature matrix, we summed UMI counts for each state, normalized to the number of total UMIs per state, and quantile-normalized the resulting matrix.
Datasets comparing sepsis and healthy controls were obtained as outlined in two published studies4,9. Datasets whose gene expression matrices were not publicly available were not included in our analysis. Gene expression deconvolution was performed using CIBERSORT29. Noting that our state signatures only capture PBMC states and exclude high-density cells in whole blood, the data were deconvolved with a no-sum-to-one constraint and absolute scoring. The resulting score matrix was then used as an input to MetaIntegrator48. The effect size of each state was visualized using forest plots, and the classification performance of MS1 cells (or combinations with other cell types) was quantified by generating a summary ROC plot. Scores for combinations of states were calculated by taking the geometric mean of scores for positive states minus the geometric mean of scores for negative states.
Bone marrow and peripheral blood cell stimulation
For MS1-induction experiments, bone marrow or peripheral mononuclear cells were cultured in SFEM II supplemented with 1X CC110 (StemCell Technologies) with or without the presence of 100 ng/mL LPS or Pam3CSK4 (Invivogen) for up to 4 days. For re-stimulation experiments, sorted monocytes were rested for 24 hours in RPMI-1640 supplemented with 10% heat-inactivated FBS and 1X Pen-Strep (Gibco), before adding 100 ng/mL LPS (Invivogen).
ATAC-seq processing and data analysis
Assay for transposase-accessible chromatin using sequencing (ATAC-seq) was performed on 25,000 sorted cells as described in a published protocol49. Libraries were sequenced on a NextSeq (Illumina) with 38 × 38 paired-end reads and at least 10 million reads per sample. Sequencing data were aligned using the ENCODE Project ATAC-seq pipeline (https://www.encodeproject.org/pages/pipelines/), and further analyzed using custom scripts. To generate a peak count matrix, we first identified a consensus peak set using the multiinter function, and then analyzed the number of counts for each sample using the function coverageBed from bedtools v2. Differential peak analysis was performed using edgeR, using the peak count matrix as input. Peak motifs were analyzed using the findMotifsGenome function in Homer v4.1 with a window size of 200 bp.
Bulk RNA-seq processing and data analysis
Bulk RNA-seq was performed using Smart-Seq250 with minor modifications, as described in a previous study13. Briefly, 5,000 sorted or cultured cells were resuspended in 15 μl of TCL (Qiagen), and their RNA was purified by a 2.2x SPRI cleanup with RNAClean XP magnetic beads (Agencourt). After reverse transcription, amplification and cleanup, libraries were quantified using a Qubit fluorometer (Invitrogen), and their size distributions were determined using an Agilent Bioanalyzer 2100. Amplicon concentrations to 0.1 ng/ml and sequencing libraries were constructed using a Nextera XT DNA Library Prep Kit (Illumina), following the manufacturer’s protocol. All RNA-seq libraries were sequenced with 38 × 38 paired-end reads using a NextSeq (Illumina). RNA-seq libraries were sequenced to a depth of >2 million reads per sample. STAR was used to align sequencing reads to the UCSC hg19 transcriptome and RSEM was used to generate an expression matrix for all samples. Both raw count and transcripts per million data were analyzed using edgeR and custom python scripts. The list of identified receptor-ligand pairs were obtained from a previous publication51.
Cytokine measurements
Culture supernatants were diluted 2x in PBS and frozen at −80°C before processing. Samples from multiple experiments were thawed and analyzed in parallel using the Legendplex Human Inflammation Panel, TNFα (BioLegend). Flow cytometry data were acquired on a Cytoflex LX (Beckman Coulter) and analyzed using FlowJo v10.1.
Reporting summary
Further information on research design is available in the Nature Research Reporting Summary accompanying this article.
Extended Data
Extended Data Figure 1. scRNA-seq demultiplexing and quality assessment.
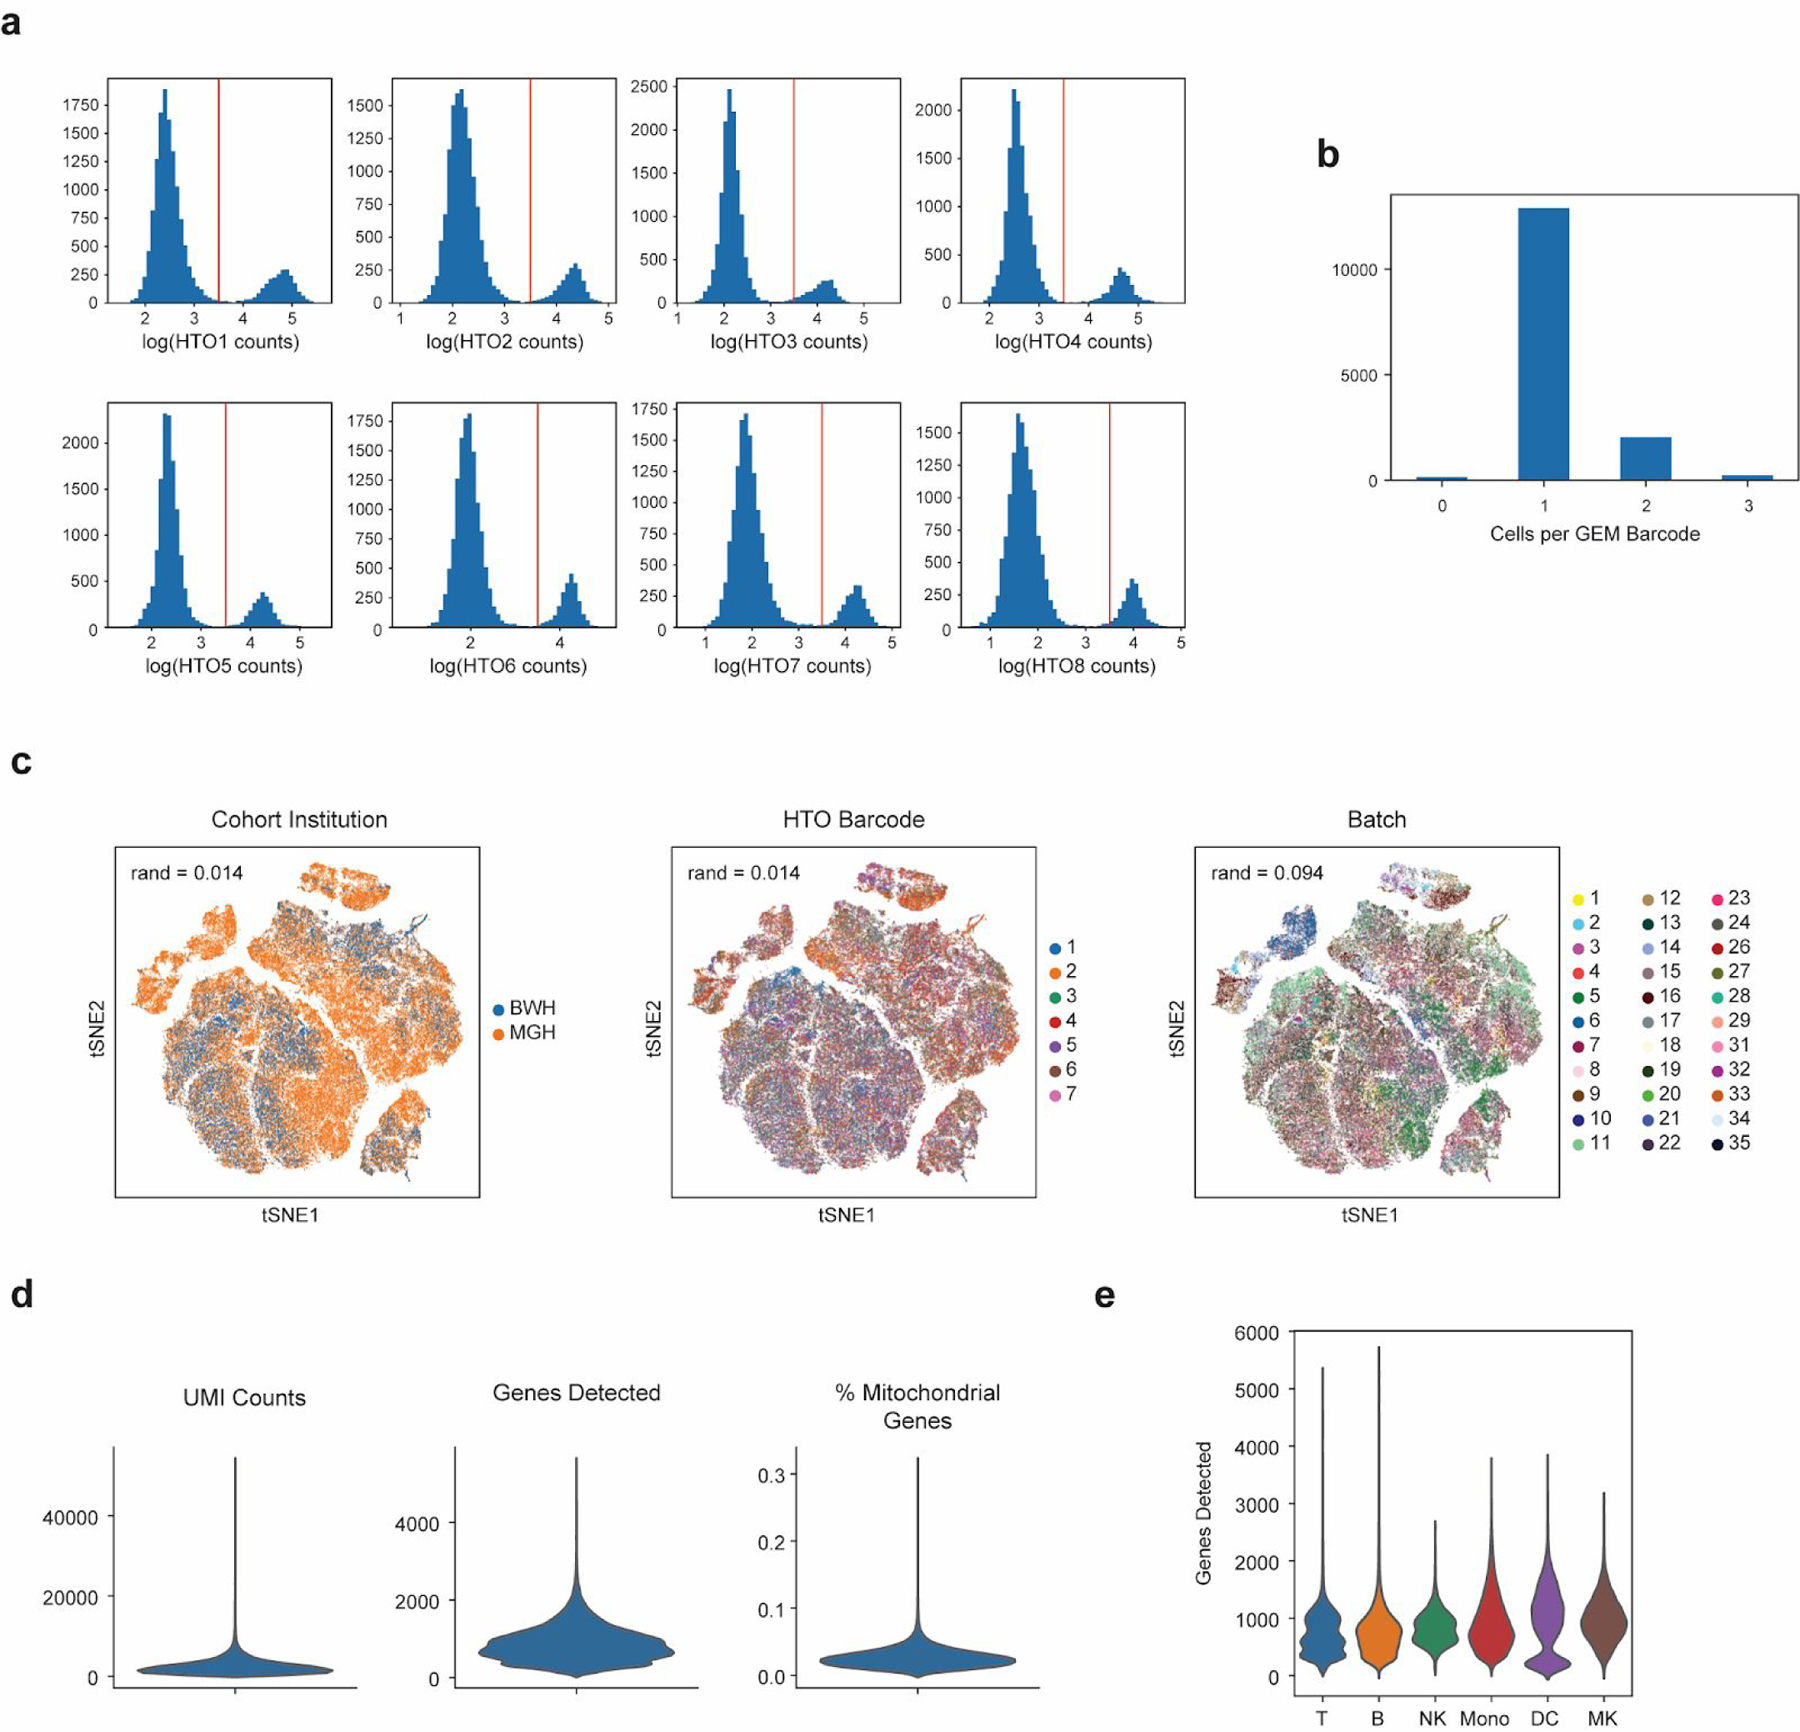
(a) Sample strategy for gating for hashtag oligo (HTO) positive cells based on UMI tag counts of each barcode. (b) Histogram of cells per 10X gel beads in emulsion (GEM) barcode for one representative channel. Data are shown for one channel with n = 15,304 detected GEMs. (c) tSNE plots of all cells (n = 126,351 cells total from 65 individuals) in the study colored by institution of origin of the cohort, hashtag barcode, and processing batch. Adjusted Rand index is shown for each when compared with cell state assignments. (d) Violin plots (n = 126,351 cells total from 65 individuals) of various quality control metrics for the full scRNA-seq dataset generated in this study. (e) Violin plots of genes detected across different cell-types (n = 32341, 7970, 9390, 58557, 14299, 3794 cells for T, B, NK, Mono, DC, and MK, respectively). Violin plots show a kernel density estimate of the data, using Scott’s rule to calculate the appropriate kernel bandwidth. The violin extends to 2x the bandwidth in both directions.
Extended Data Figure 2. Robust identification of cell states with two-step clustering.
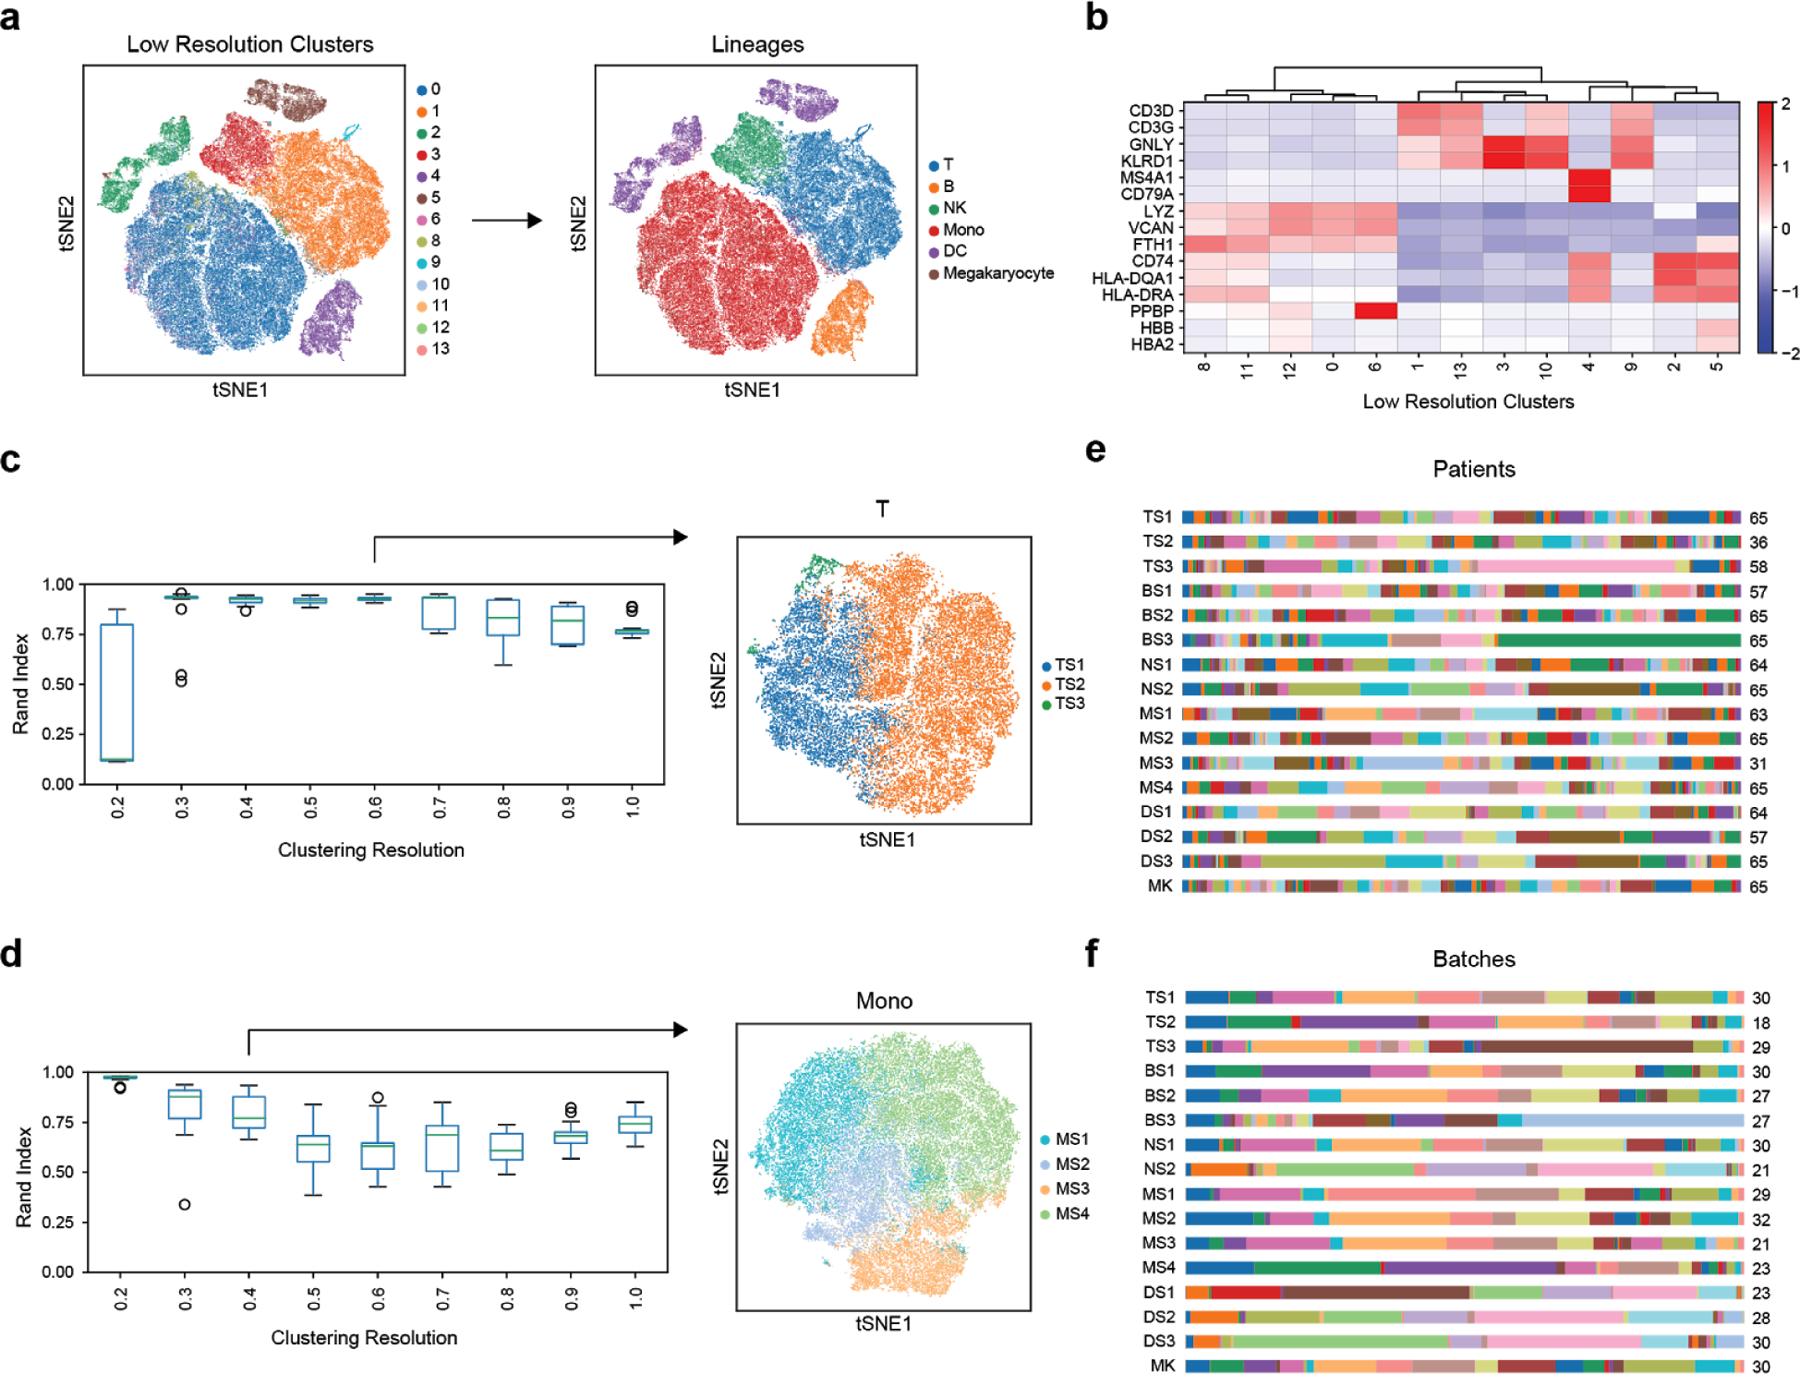
(a-b) Identification of immune cell types based on marker genes of low-resolution clusters. Color scale in (b) corresponds to z-scored, log2-transformed mean gene expression counts across all cells (n = 126,351 cells total from 65 individuals). (c-d) Assessment of cluster robustness for T-cells (T) (c) and monocytes (Mono) (d) (n = 32341 and 58557 cells for T and Mono, respectively). Boxplots show distributions of Rand indices when comparing clustering solutions with subsampled data (20 iterations). Boxes show the median and IQR for each resolution, with whiskers extending to 1.5 IQR in either direction from the top or bottom quartile. tSNE plots show final assigned states for each cell type. (e-f) Barplots showing the fraction of each patient (e) and batch (f) in each of the 16 cell states (number of patients or batches with each state is indicated).
Extended Data Figure 3. Flow cytometry abundances of classical myeloid cell states.
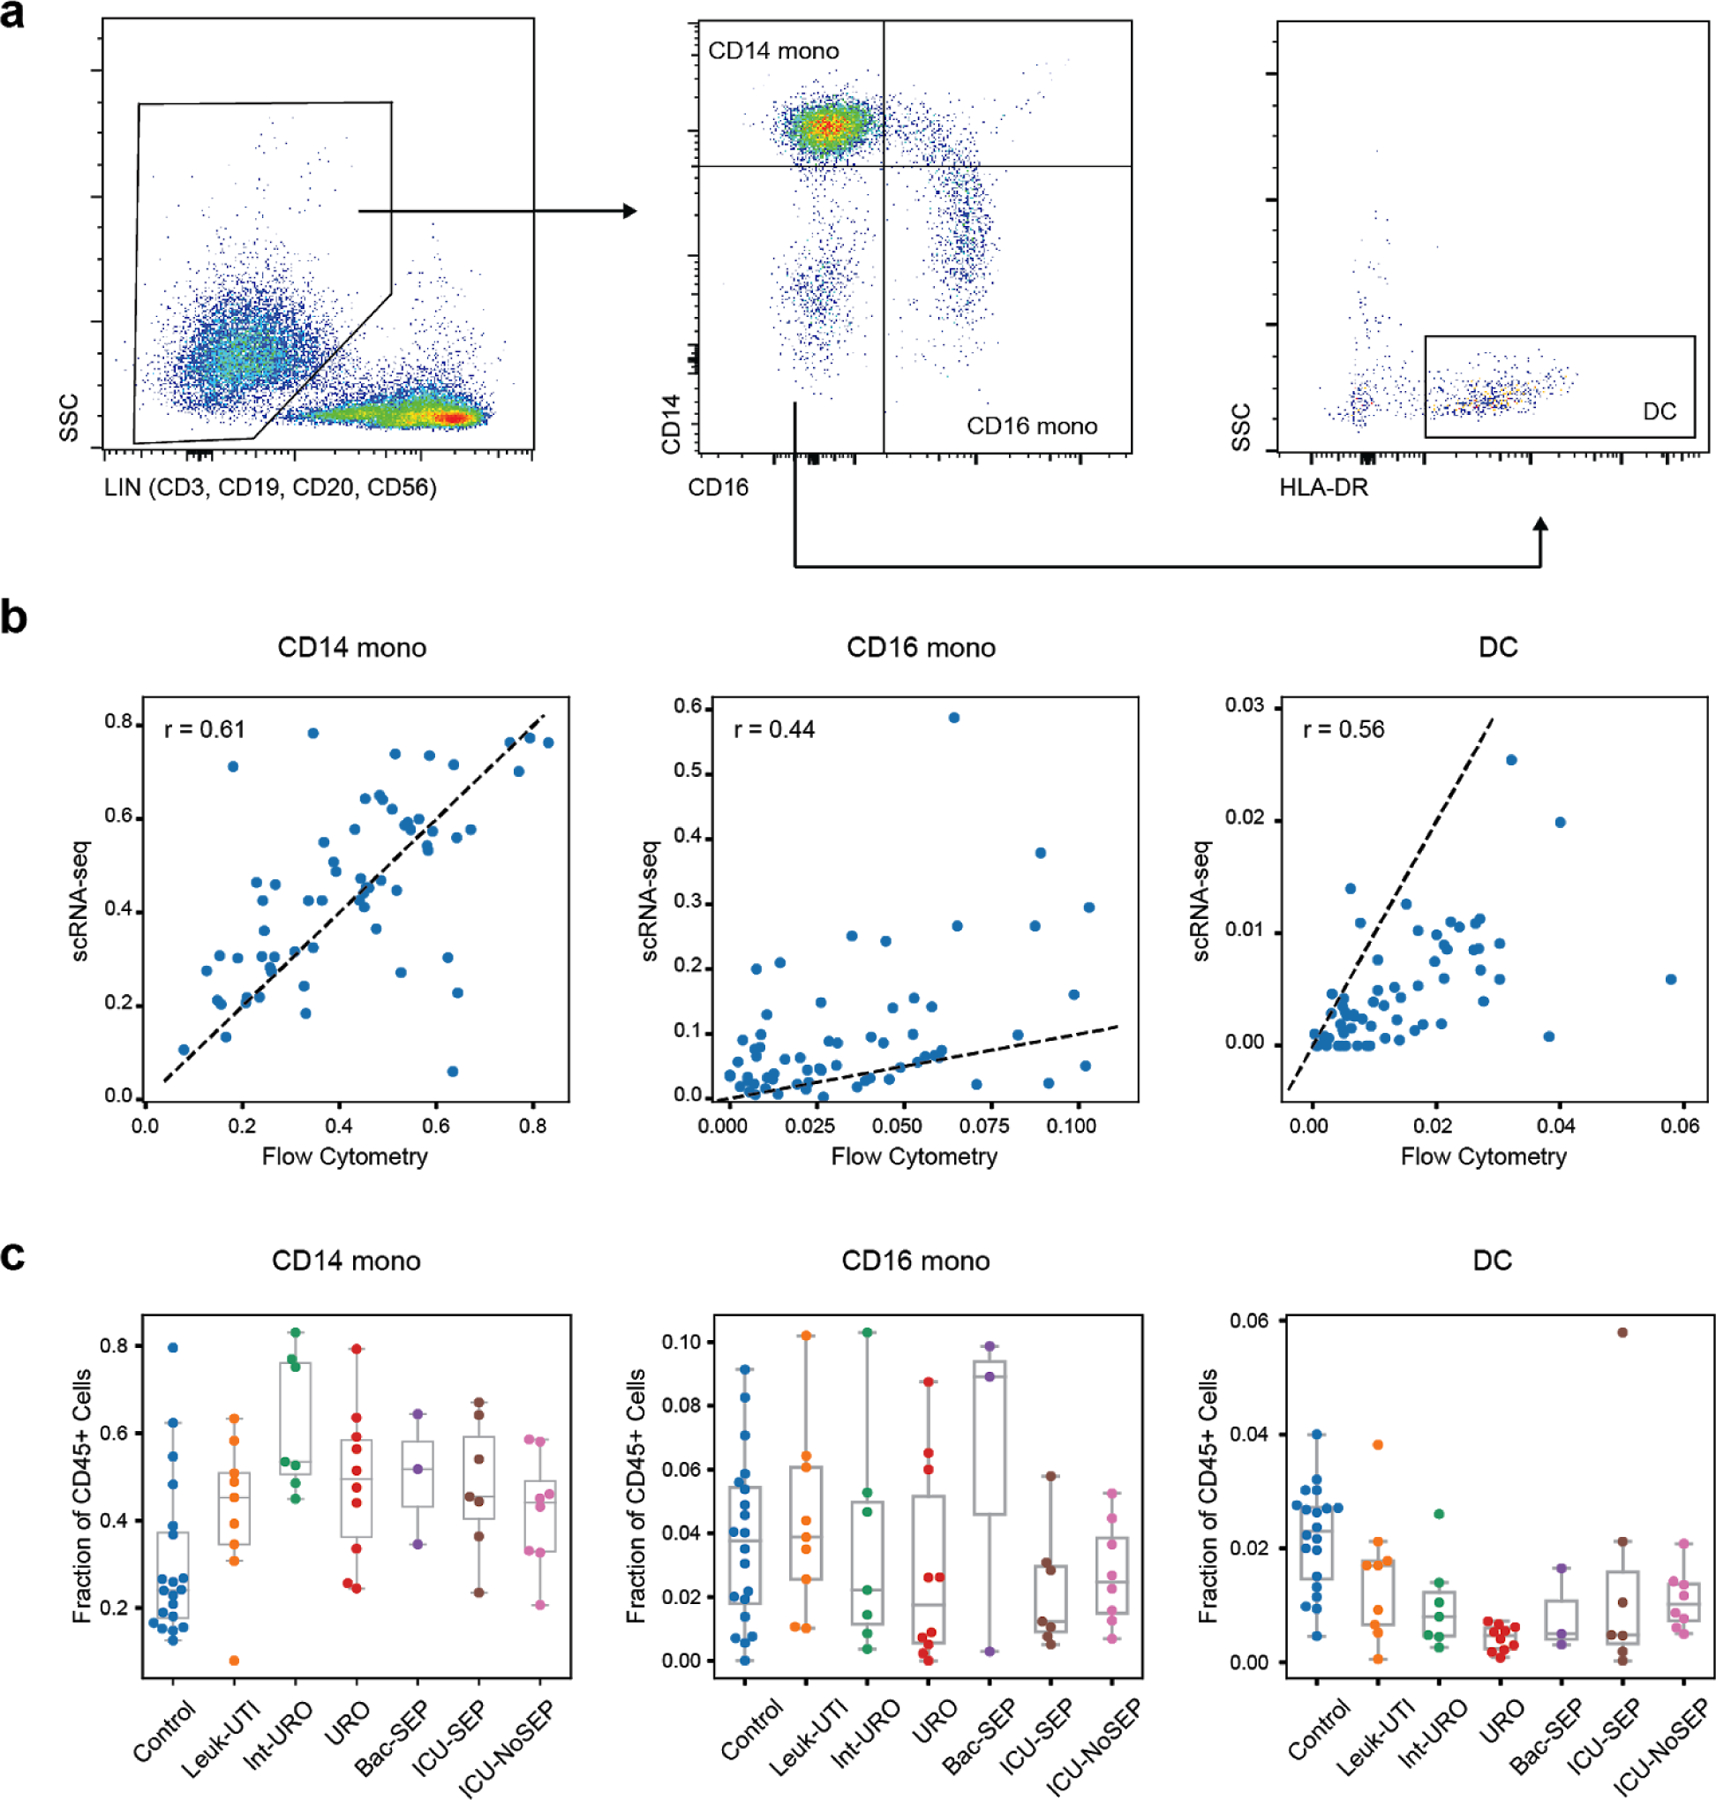
(a) Gating strategy for determination of CD14+ mono, CD16+ mono, and dendritic cell abundance. (b) Correlation of fractional abundances defined by flow cytometry and scRNA-seq for each patient (n = 65 individuals). (c) Fractional abundance of the three cell types based on flow cytometry, grouped by disease state. Sample size (n) for each cohort is indicated in Figure 1b. Boxes show the median and IQR for each patient cohort, with whiskers extending to 1.5 IQR in either direction from the top or bottom quartile.
Extended Data Figure 4. Differentially expressed genes in immune cell states.
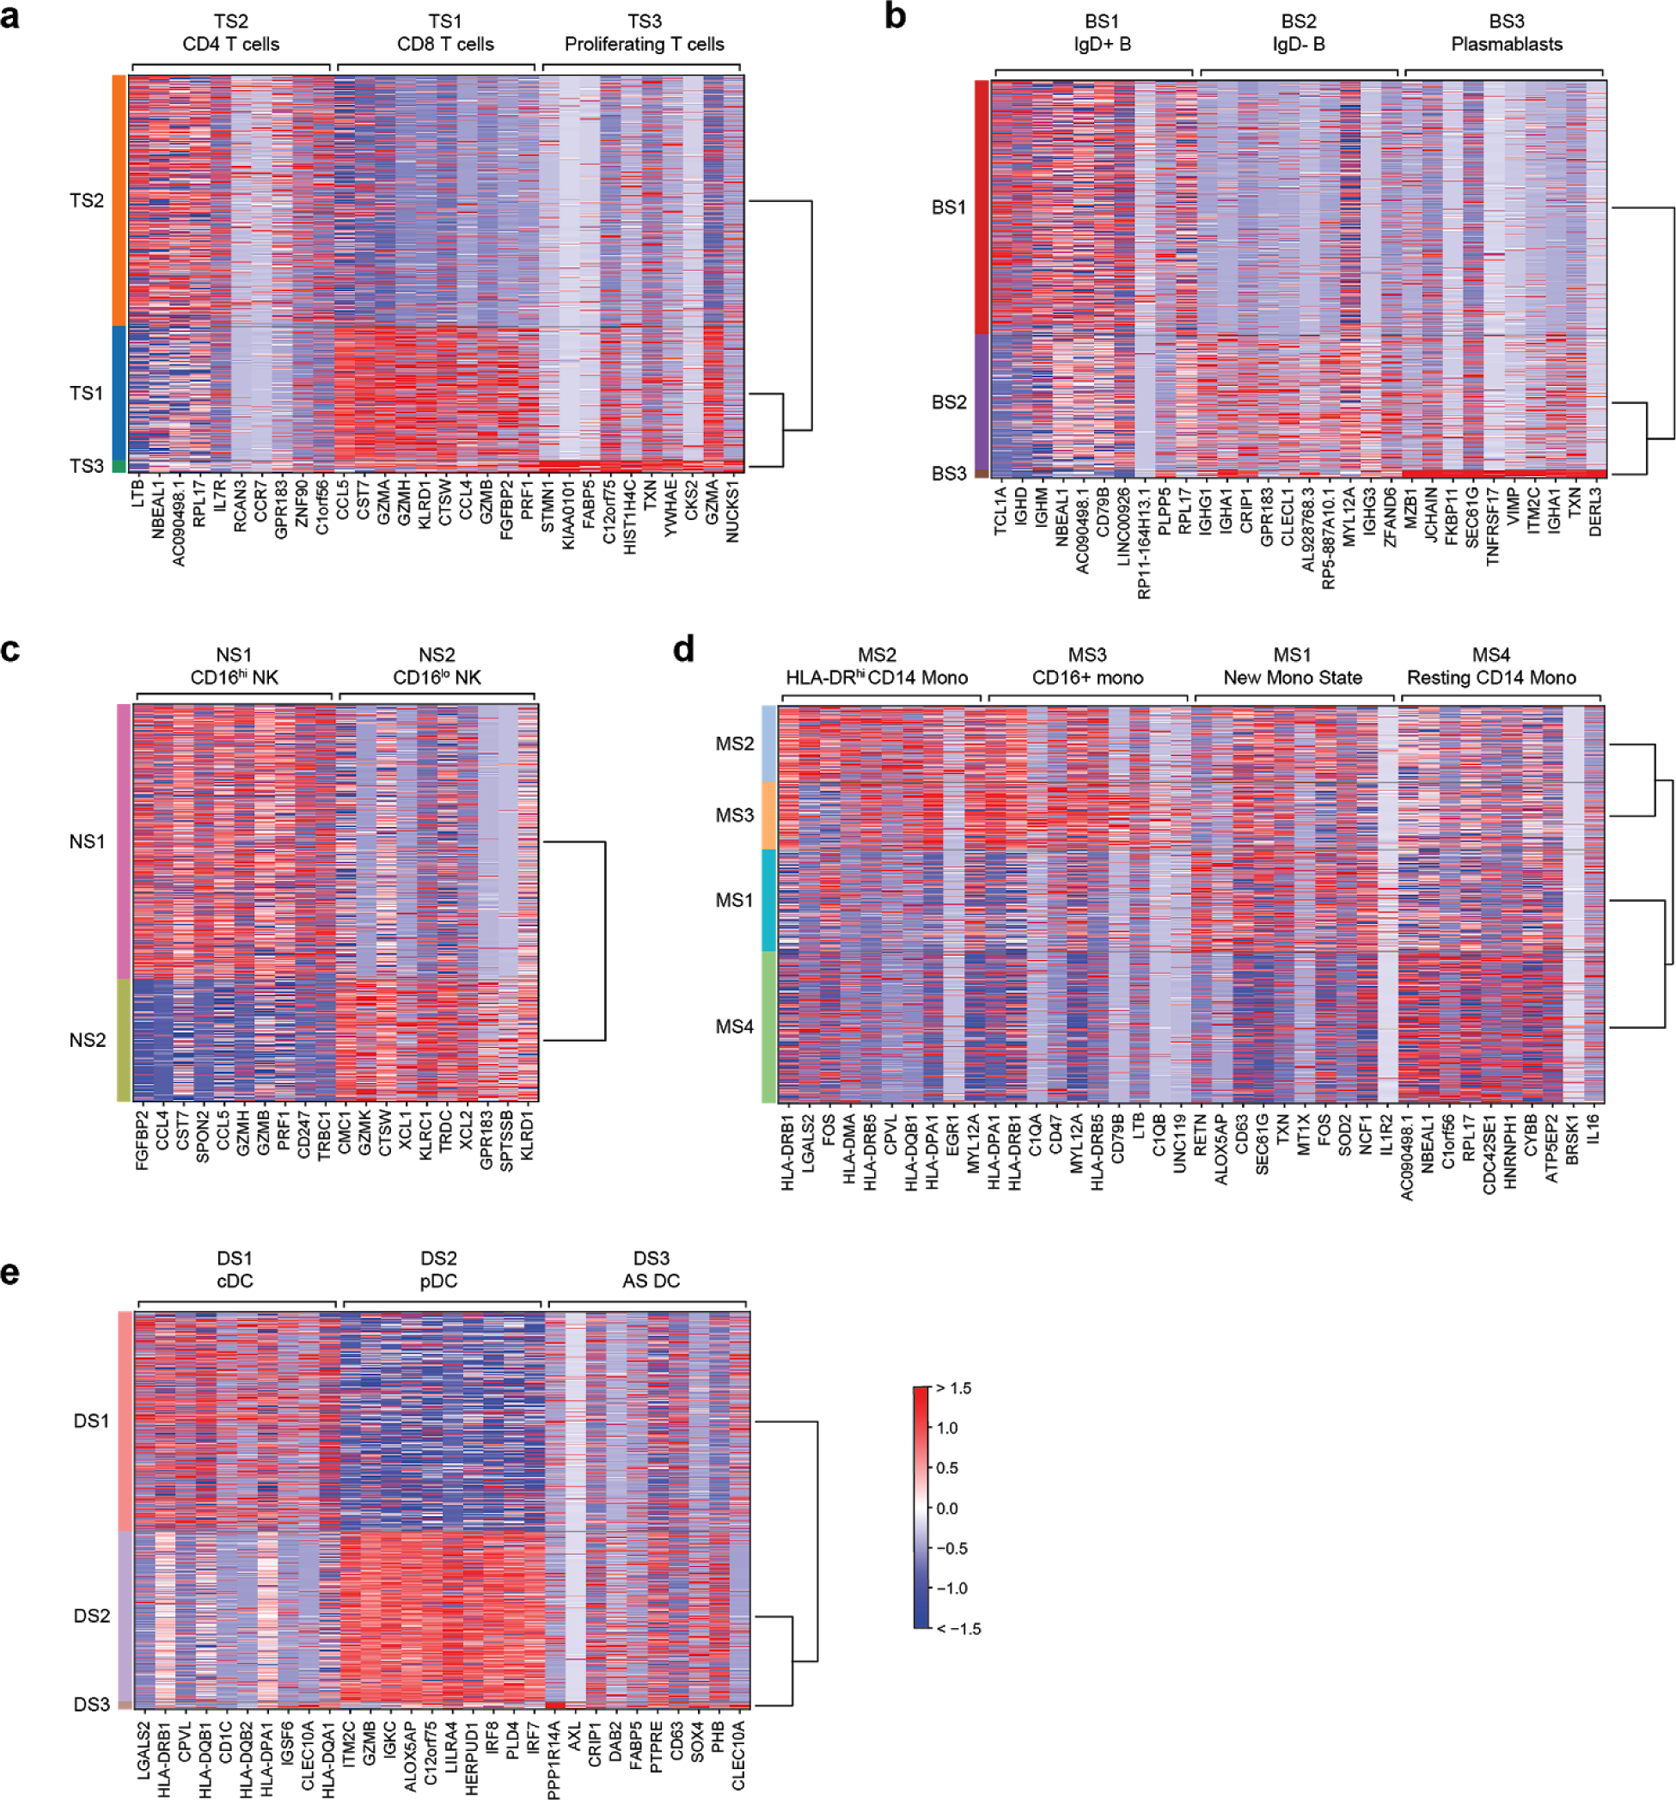
Top 10 differentially expressed genes (FDR < 0.05, two-tailed Wilcoxon rank-sum test) for each cell state when compared with other cells within the same cell type. Heatmaps are grouped according to the parent cell type of the different states: (a) T cells, (b) B cells, (c) NK cells, (d) monocytes, and (e) dendritic cells. n = 32341, 7970, 9390, 58557, 14299, 3794 cells for T, B, NK, Mono, DC, and MK, respectively. cDC, conventional dendritic cells; pDC, plasmacytoid dendritic cells; AS DC, AXL-SIGLEC6 dendritic cells.
Extended Data Figure 5. Fractional abundance of states defined by scRNA-seq.
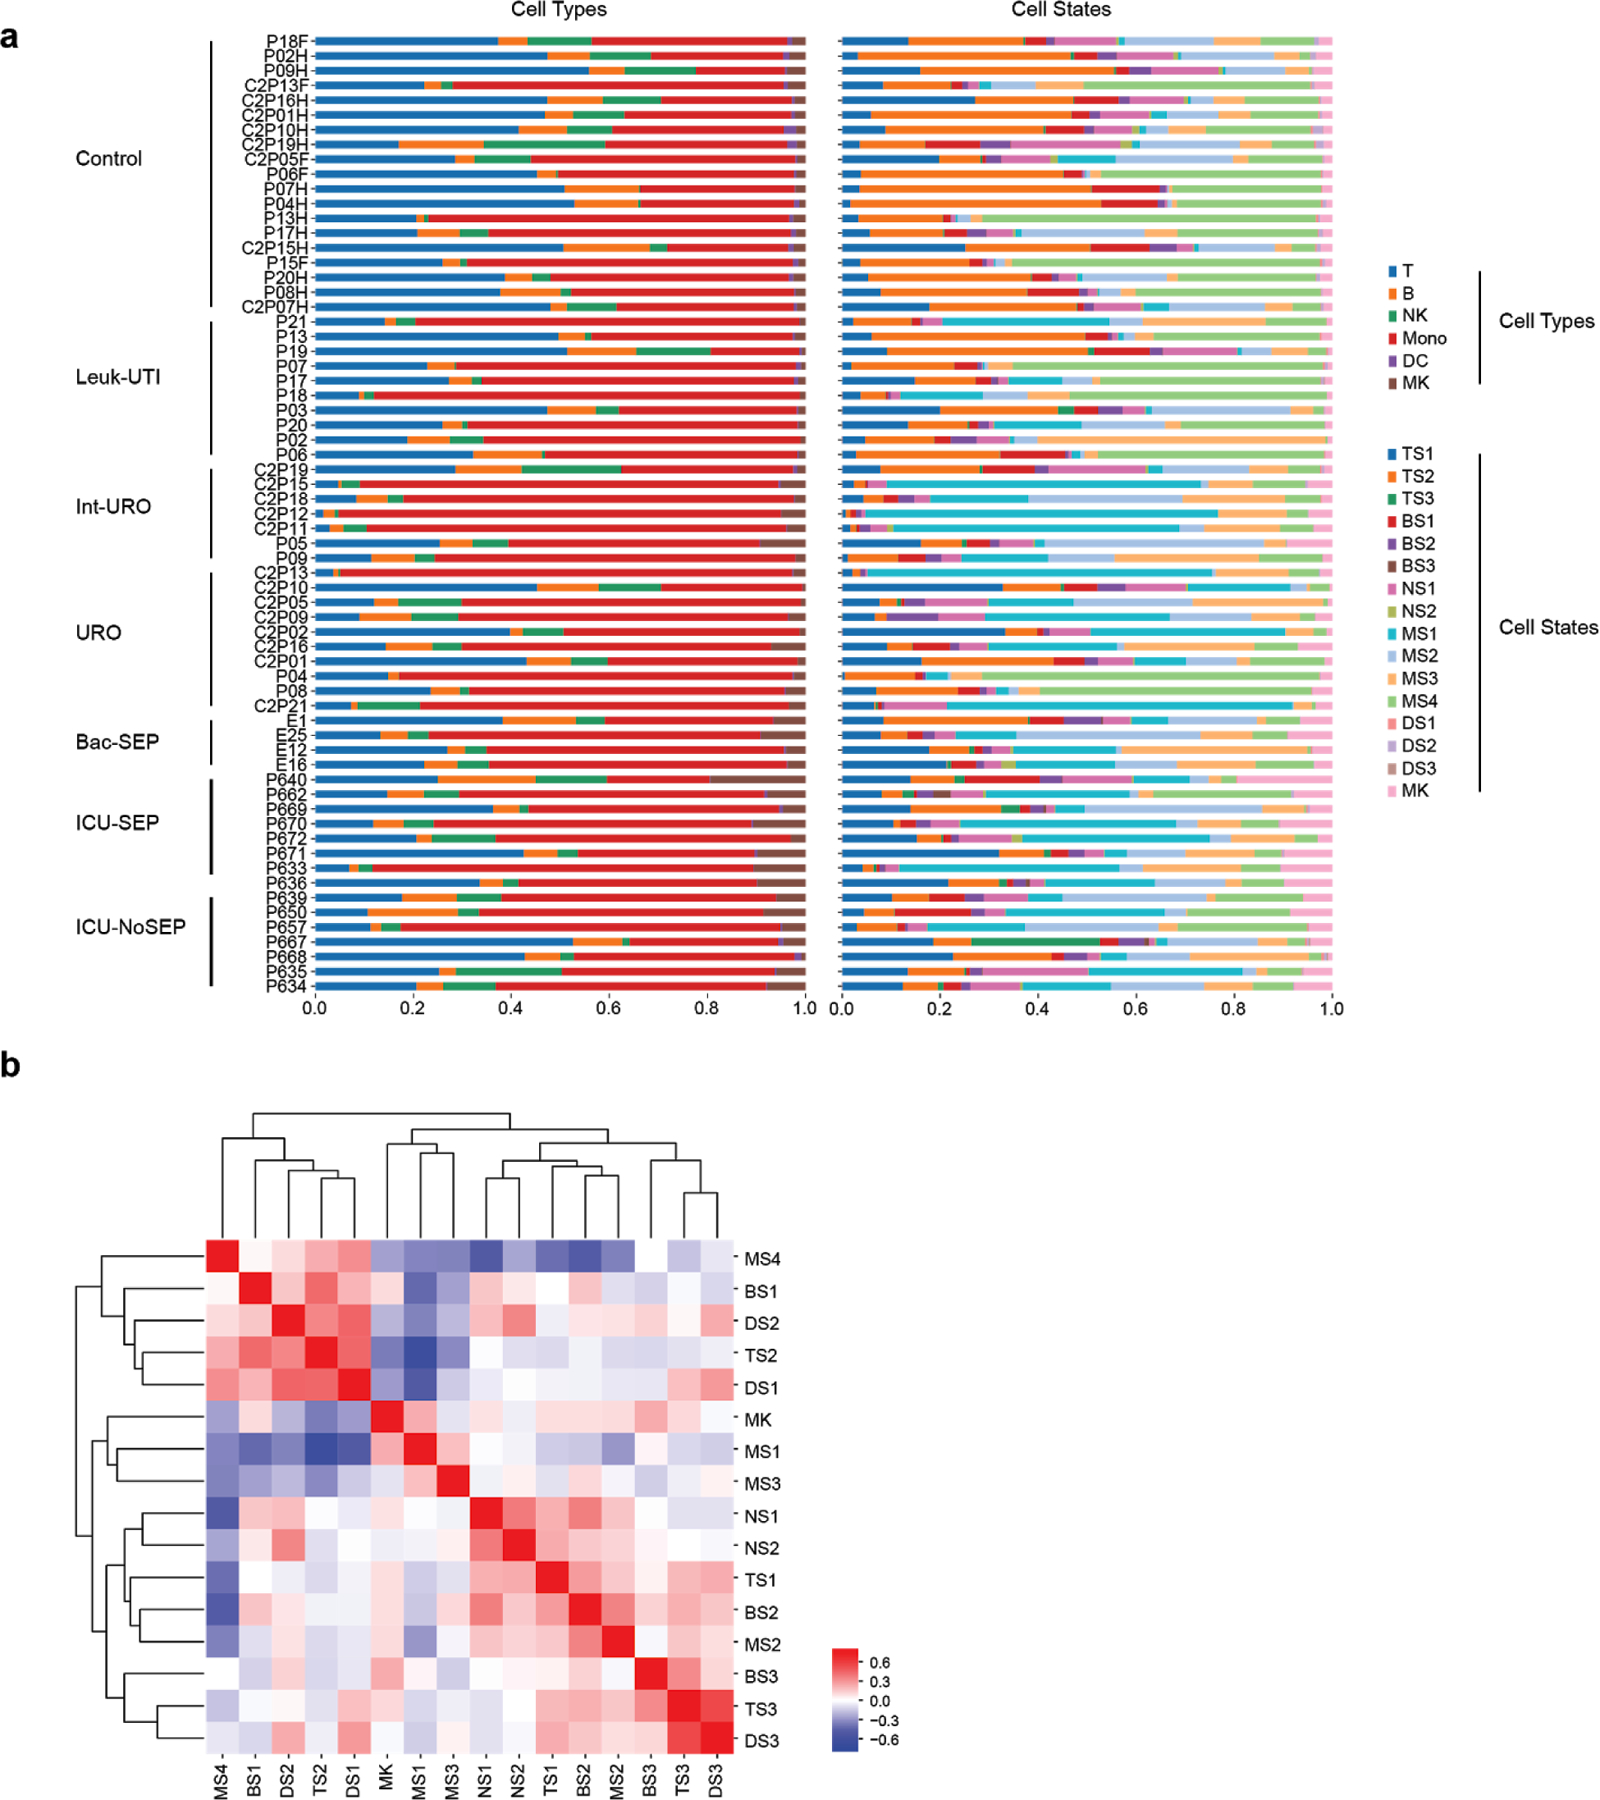
(a) Cell type and state composition for each patient in each cohort. (b) Pearson correlation matrix of cell states across all patients (n = 65 patients).
Extended Data Figure 6. Disease-specific abundance of cell types and states.
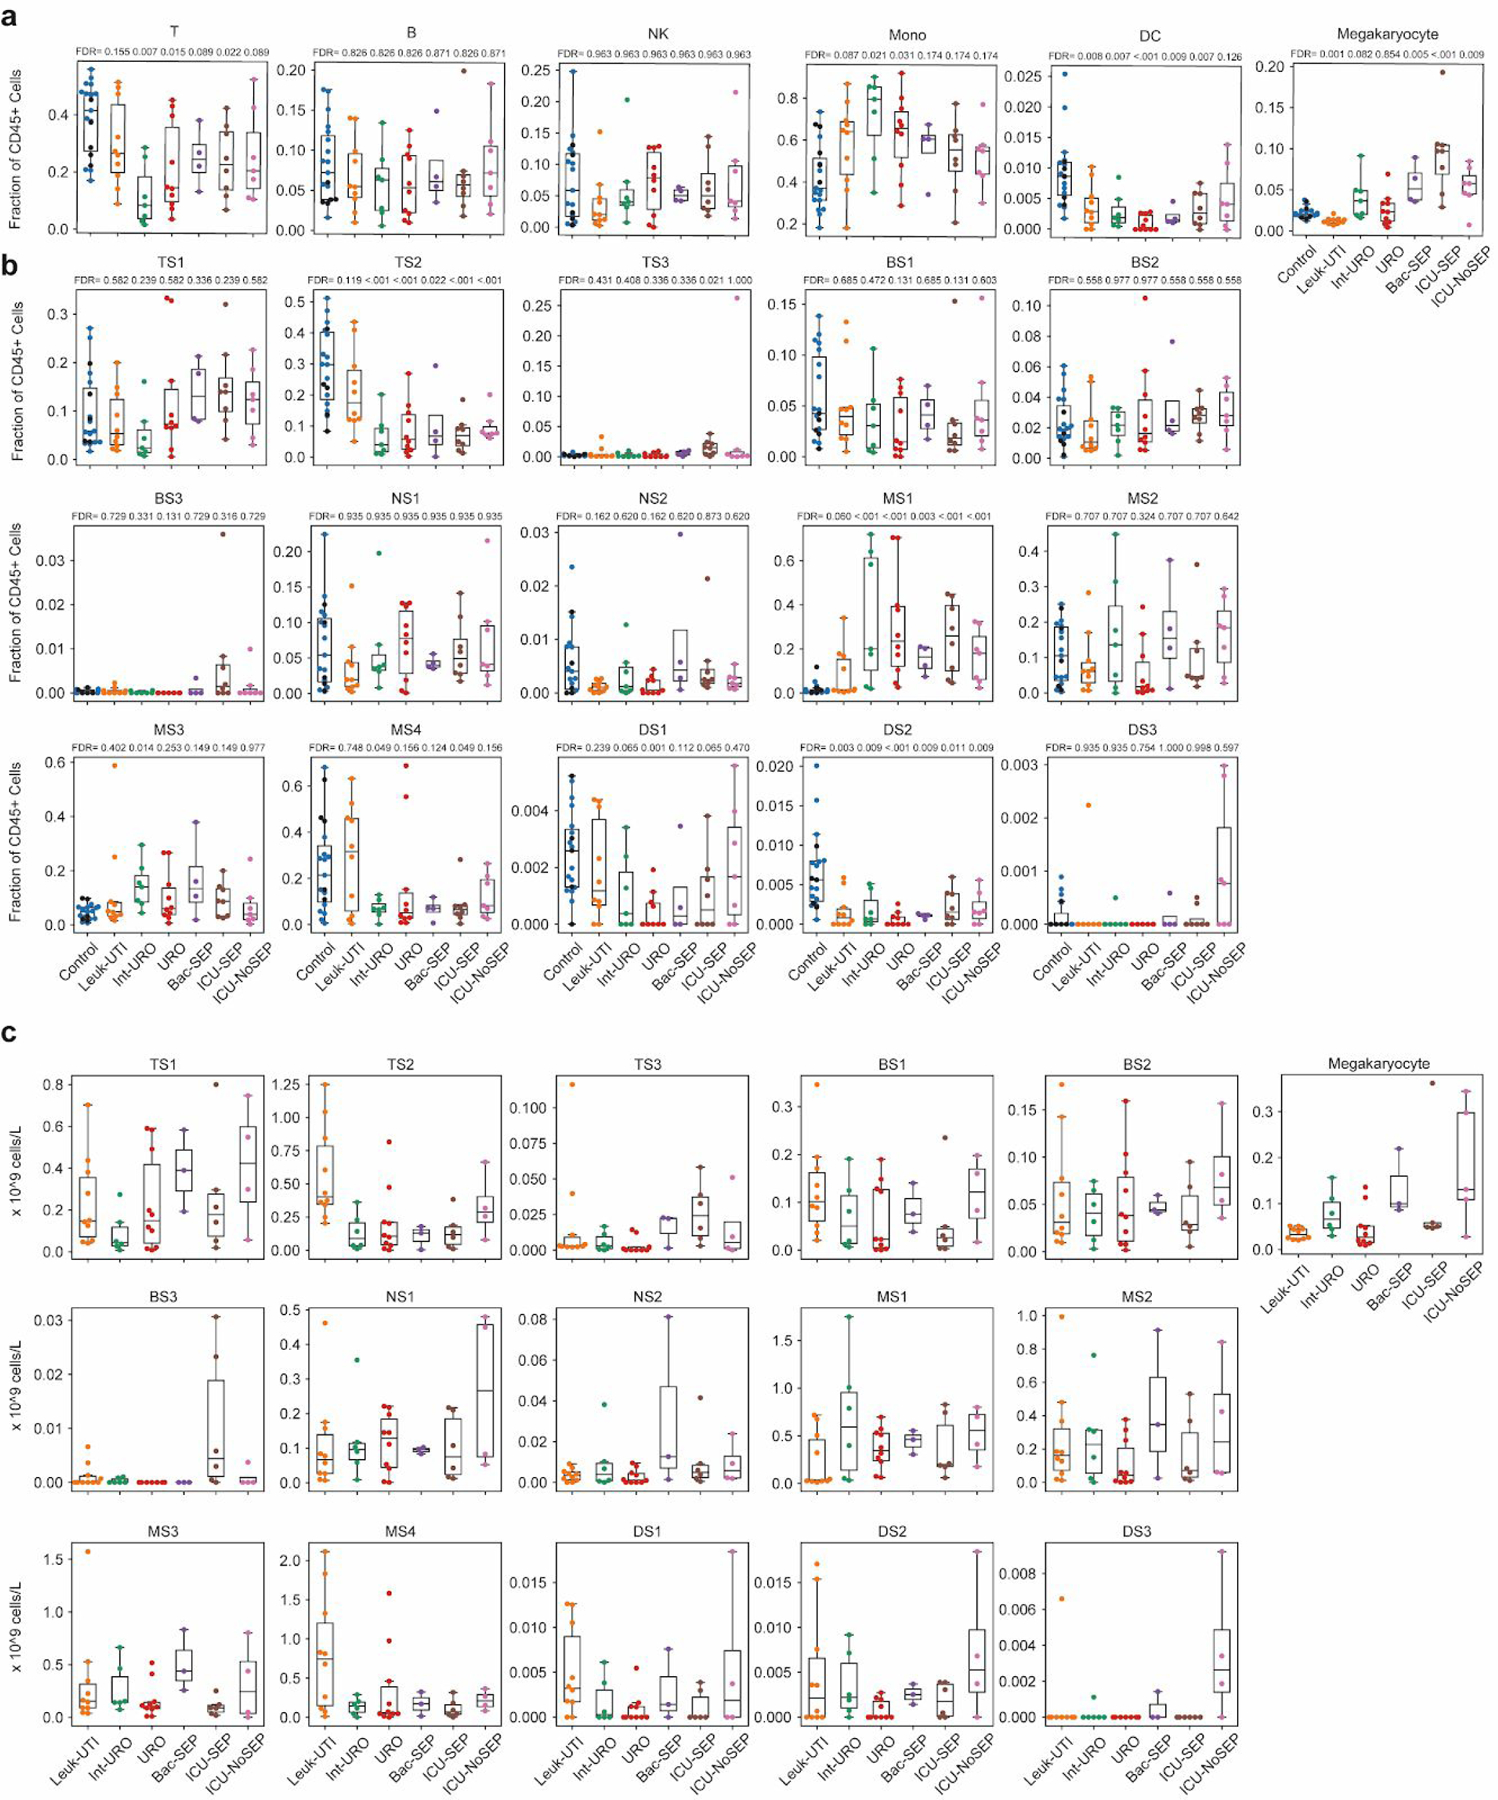
Boxplots showing fractional abundances of (a) cell types and (b) states among patients grouped by patient cohort. FDR values are shown when comparing each disease state with healthy controls (two-tailed Wilcoxon rank-sum test, corrected for multiple testing of states). Sample size (n) for each cohort is indicated in Figure 1b. (c) Boxplots showing absolute abundances of cell states among patients (for which leukocyte counts were available), grouped by patient cohort. Boxes show the median and IQR for each patient cohort, with whiskers extending to 1.5 IQR in either direction from the top or bottom quartile. n = 10, 6, 10, 3, 6, and 4 patients, for Leuk-UTI, Int-URO, URO, BAC-SEP, ICU-SEP and ICU-NoSEP, respectively.
Extended Data Figure 7. In-depth analysis of the gene expression profile of MS1.
(a) Top 30 differentially expressed genes (among highly variable genes) when comparing MS1 against other CD14+ monocyte states (MS4 and MS2). (b) Dotplot showing enrichment of pathways (KEGG database) for upregulated genes in MS1 vs. MS2 (FDR < 0.1, edgeR exact test). n = 15021 and 11439 cells for MS1 and MS2, respectively. Sizes of circles are proportional to the number of gene hits in a set, whereas color represents the enrichment score of each gene set. (c) Heatmap showing the average expression of genes that are differentially expressed (FDR <0.1, two-sided Wilcoxon rank-sum test) between all MS1 cells from each patient in the ICU-SEP cohort and all MS1 cells from each patient in the ICU-NoSEP cohort (n = 2,153 and 1,442 cells from 8 and 7 ICU-SEP and ICU-NoSEP patients, respectively). To specifically identify genes that discriminate the two patient populations, genes are filtered for expression in-group fraction >0.4 and out-group fraction <0.6. (d) k-selection plot to determine the number of components for non-negative matrix factorization (NMF). Dotted line indicates selected number of components for further analysis. (e) tSNE plot of MS1 cells (n = 15021 cells) colored by patient cohort of origin. (f) Scaled usage values of each gene module derived from NMF analysis. The top 20 genes in each module are shown. (g) Scatterplots showing correlation between mean gene module usage in MS1 cells and sequential organ failure assessment (SOFA) scores for Int-URO and URO patients (top row), and Bac-SEP and ICU-SEP patients (bottom row). Sample size (n) for each cohort is indicated in Figure 1b. Significance of the correlation (Pearson r) was calculated with a two-sided permutation test. Line and shadow indicate linear regression fit and 95% confidence interval, respectively.
Extended Data Figure 8. State-specific expression of sepsis signature genes.
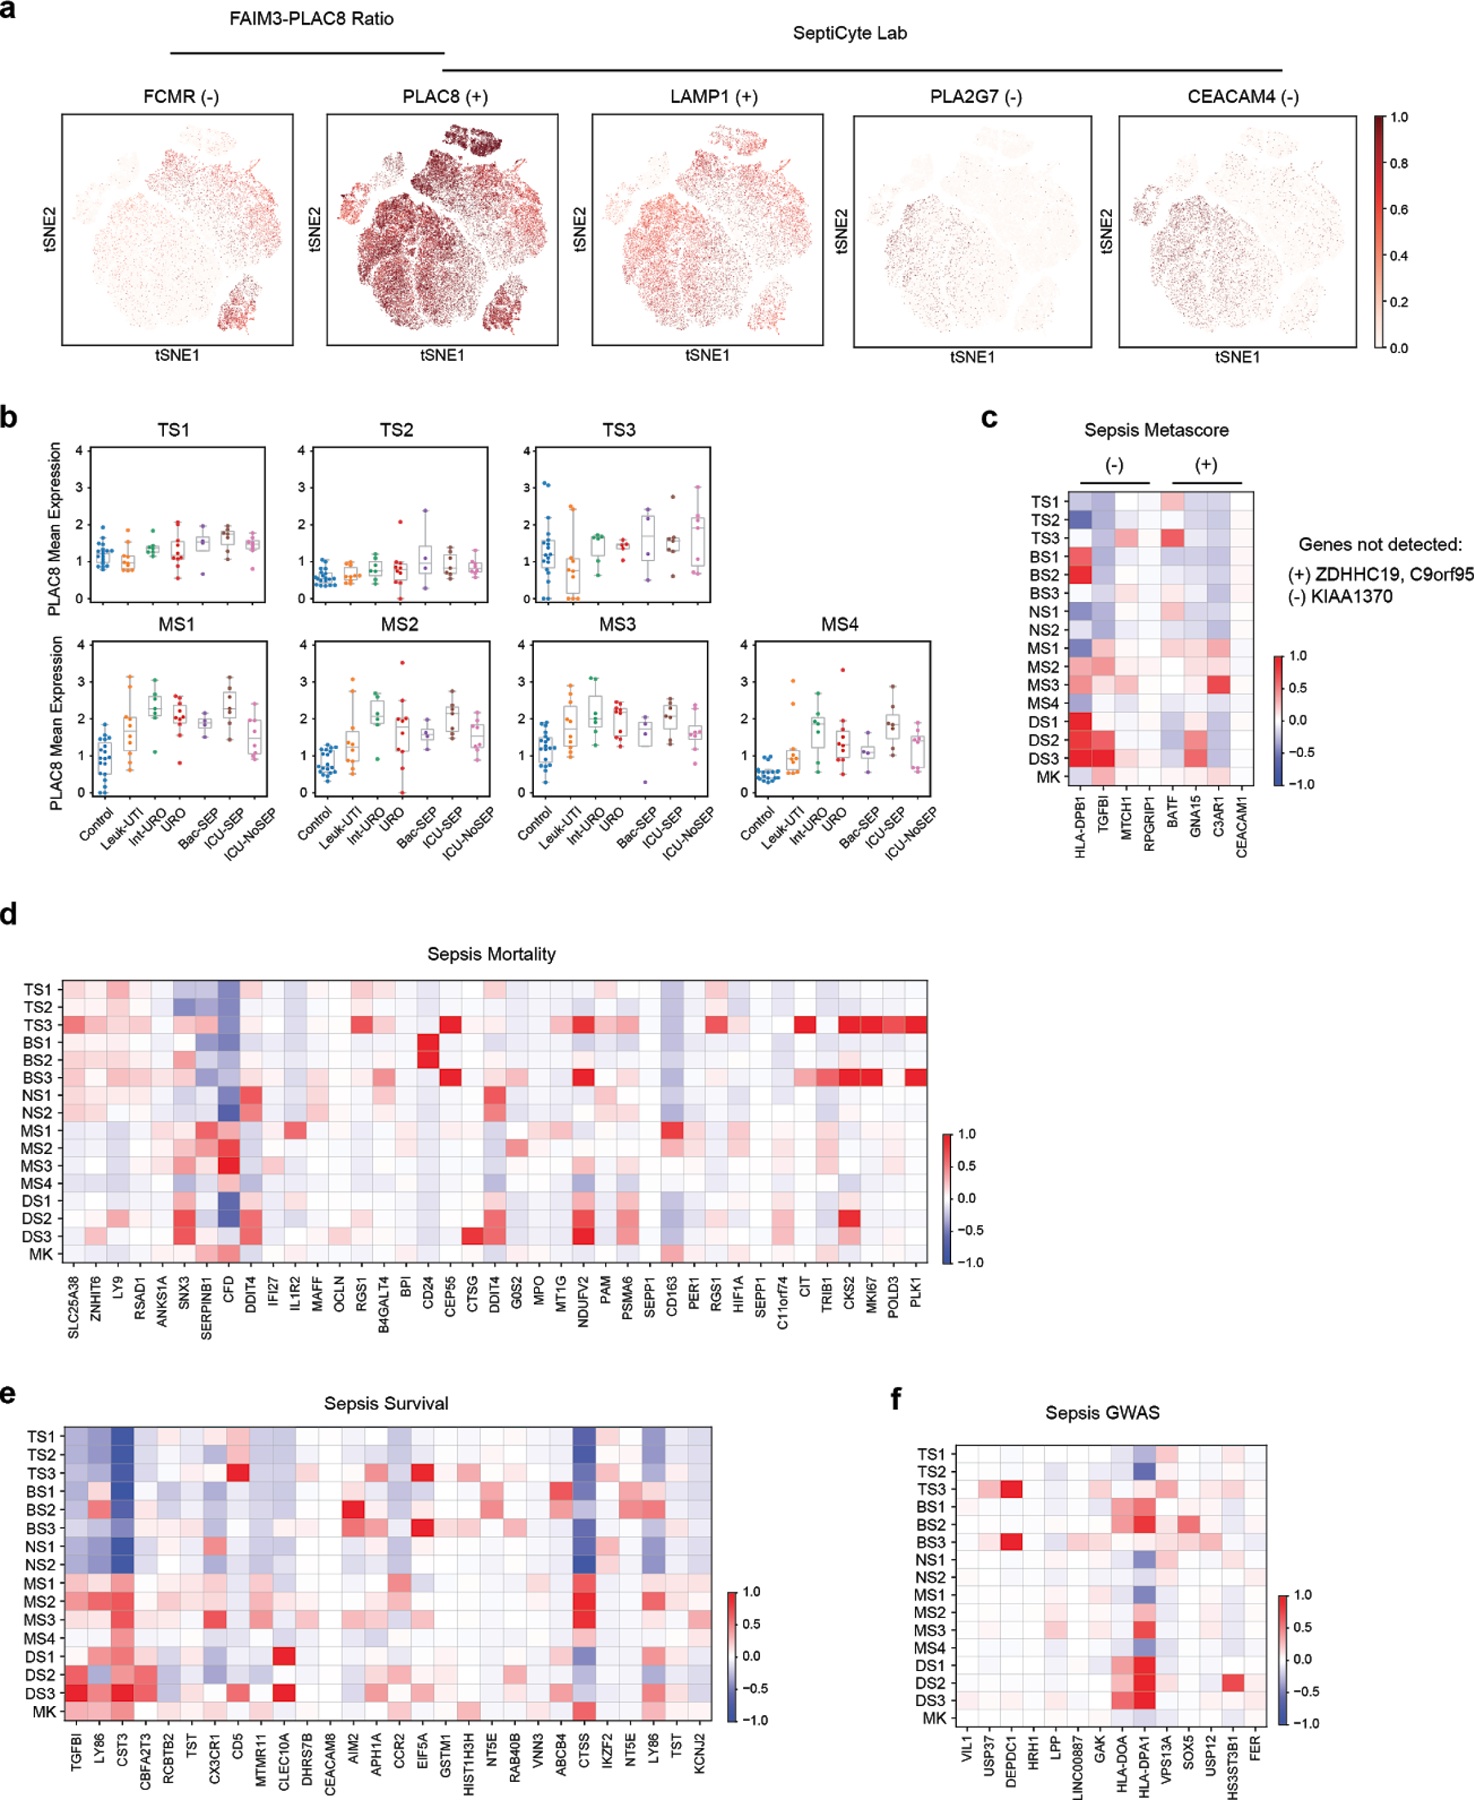
(a) tSNE plots showing scaled gene expression counts across all cells (n = 126,351 total from 65 individuals) for FAIM3-PLAC828 and SeptiCyte Lab23 genes (+ or − indicates that a gene is up- or down-regulated, respectively, in sepsis). (b) Mean expression of PLAC8 in T cell (top row) and monocyte (bottom row) states across patients grouped by cohort. Sample size (n) for each cohort is indicated in Figure 1b. (c-f) Heatmaps show state-specific expression of Sepsis Metascore12 genes (c), genes previously associated with sepsis mortality (d) or survival10,11 (e), and sepsis-linked GWAS genes (f). Color scale corresponds to z-scored, log2-transformed mean gene expression counts for cell state.
Extended Data Figure 9. State matrix generation and performance comparison of gene-based signatures.
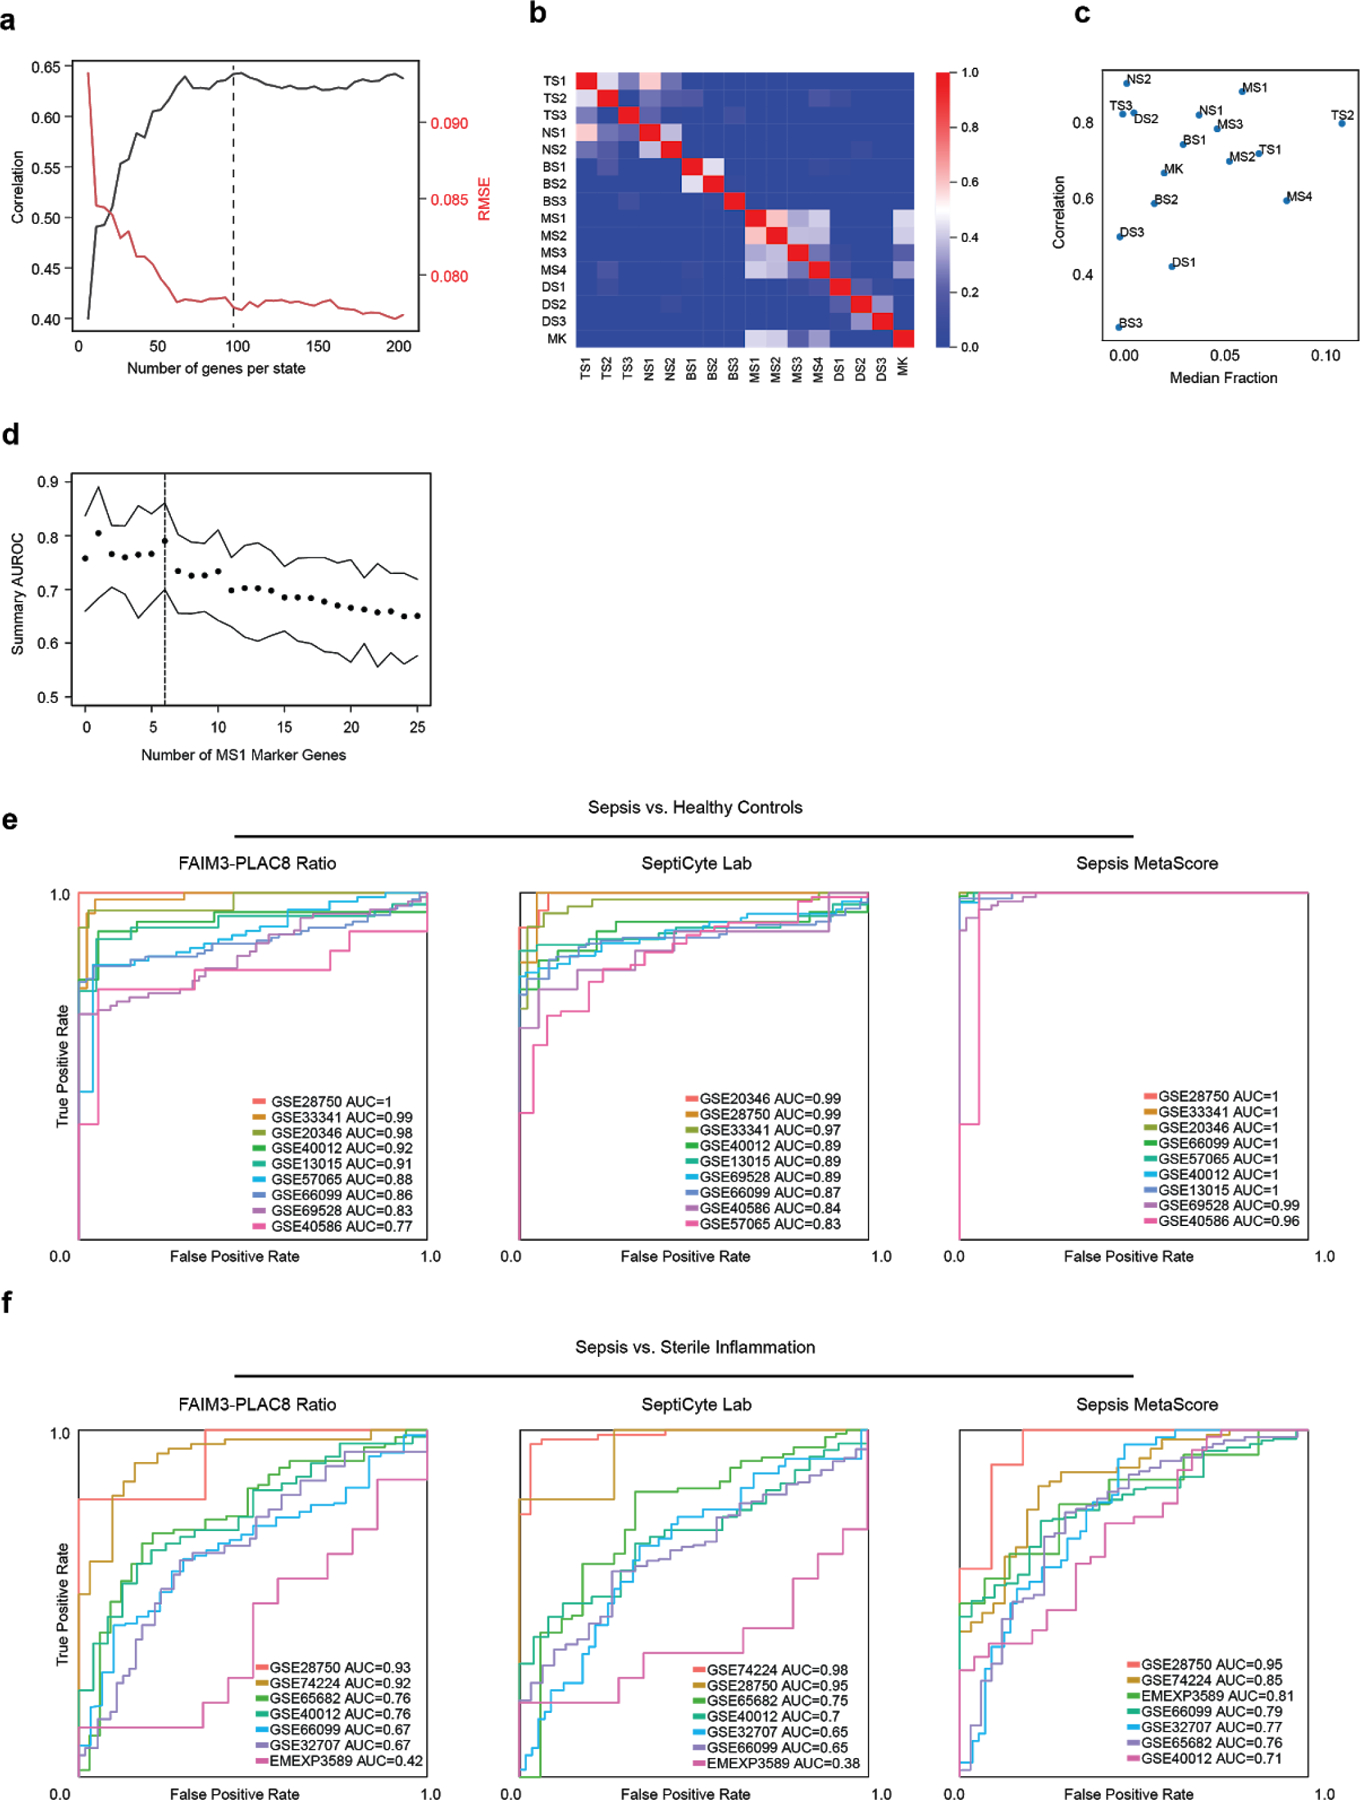
(a) Optimization of the number of marker genes per cell state in the basis matrix for deconvolution. Mean deconvolution accuracy is shown for pseudo-bulk gene expression data generated for each patient in our study (n = 65 patients). Accuracy is measured as high correlation or low root mean-squared error (RMSE) between predicted and true values. Dotted line indicates number of genes used for downstream analysis. (b) Gene expression correlation of all states using the signature matrix with 100 genes per cell state (1201 total, union of all genes). (c) Scatterplot showing deconvolution accuracy (measured by Pearson correlation between true and inferred fractions) increases with median fractional abundance of cell states. (d) Summary area under the receiver operating characteristic curve (AUROCs) of the mean expression of PLAC8, CLU, and the indicated number of MS1 marker genes when classifying sepsis patients against sterile inflammation in published datasets. Top and bottom lines indicate the 95% confidence interval of the summary AUROC. Dotted line indicates number of MS1 marker genes used for downstream analysis. (e-f) Individual ROC curves of FAIM3-PLAC8 Ratio, SeptiCyte Lab, and Sepsis MetaScore on published datasets comparing sepsis vs. healthy controls (e; n = 751 total patients from 9 cohorts) or sepsis vs. sterile inflammation (f; n = 696 total patients from 7 cohorts).
Extended Data Figure 10. scRNA-seq characterization of stimulated bone-marrow mononuclear cells.
BM mononuclear cells incubated in HSC cytokine-rich media with no treatment (NT) or 100 ng/mL LPS or Pam3CSK4 for 4 days. Cells (n = 8,702) are visualized on a UMAP projection and colored by (a) treatment, (b) Leiden clusters, and (c) cell-type annotations. (d) Matrixplot showing the top 5 differentially expressed genes (FDR < 0.01, two-tailed Wilcoxon rank-sum test) for each cluster in (b). (e) Heatmap showing differentially expressed genes (FDR < 0.01, two-tailed Wilcoxon rank-sum test) between clusters 3 (CD14 monocytes, n = 786 cells) and 14 (iMS1 cluster, n = 130 cells). (f) UMAP projections of non-stimulated BM myeloid and progenitor cells (HSC/MPP, CMP, GMP, Mono; n = 1976 cells total) colored by cell type (top) and diffusion pseudotime (bottom). (g) Violin plots showing pseudotime values for each cell type in each stimulation condition. n = 1976 and 901 cells for NT and LPS or Pam3 treatments, respectively. Violin plots show a kernel density estimate of the data, using Scott’s rule to calculate the appropriate kernel bandwidth. The violin extends to 2x the bandwidth in both directions. (h) Volcano plots showing differentially expressed genes between LPS or Pam3CSK4 and untreated cells for the HSC/MPP (n = 1168 cells) and GMP populations (n = 519 cells). Differentially expressed genes (logFC > 0.3, p < 0.05; edgeR exact test) are shown in red. Known receptors (based on a previously published database11) that are differentially expressed are labelled.
Supplementary Material
ACKNOWLEDGEMENTS
We thank the subjects in our clinical cohorts for participating and donating blood for our study. We are also grateful to the clinical research coordinators and fellows who conducted patient enrollment and performed blood collections: Blair Parry, Katherine Gohres, Jeannie Lee, Jamie Hwang, and Kyle Richards (MGH); Kaelyn Cummins, Angelica Higuera-Moreno, Mayra Pinilla-Vera, and Maura Benson (BWH). We thank Alexandra-Chloe Villani, Arnon Arazi, Jonathan Wenger, and other members of the Blainey and Hacohen Labs (Broad Institute) for helpful discussions. We also thank the Broad Flow Cytometry core for assistance in cell sorting experiments and the Broad Genomics Platform for assistance in sequencing.
This work was supported by a SPARC award from the Broad Institute (M.B.G.), awards from the Ellison Foundation and the Allergan Foundation (M.B.G.), BARDA 1DSEP160030-01-00 (D.T.H.) and NIH NIAID U24 AI118668 (N.H. and P.C.B.). N.H. was supported by the David P. Ryan, MD Endowed Chair in Cancer Research, R.P.B. was supported by a Mentored Clinical Scientist Research Career Development Award from the NIH (1K08AI119157-04), and P.C.B. was supported by a Career Award at the Scientific Interface from the Burroughs Wellcome Fund.
Footnotes
COMPETING FINANCIAL INTERESTS
The Broad Institute and MIT may seek to commercialize aspects of this work, and related applications for intellectual property have been filed. In addition, P.C.B. is a consultant to and equity holder in a company, 10X Genomics, whose products were used in this study.
DATA AVAILABILITY
scRNA-seq data is available for visualization and secondary analysis through the Broad Institute Single Cell Portal (SCP): SCP548 (patients PBMCs) and SCP550 (bone marrow stimulation). Expression matrices are also deposited in SCP. Raw sequencing data are available for download from the controlled-access data repository, Broad DUOS.
CODE AVAILABILITY
Code used for data analysis are available at https://github.com/reyes-m/sepsis_signature.
REFERENCES
- 1.Rudd KE et al. The global burden of sepsis: barriers and potential solutions. Crit. Care 22, 232 (2018). [DOI] [PMC free article] [PubMed] [Google Scholar]
- 2.Filbin MR et al. Presenting Symptoms Independently Predict Mortality in Septic Shock: Importance of a Previously Unmeasured Confounder. Crit. Care Med 46, 1592–1599 (2018). [DOI] [PubMed] [Google Scholar]
- 3.Seymour CW et al. Derivation, Validation, and Potential Treatment Implications of Novel Clinical Phenotypes for Sepsis. JAMA (2019) doi: 10.1001/jama.2019.5791. [DOI] [PMC free article] [PubMed] [Google Scholar]
- 4.Sweeney TE et al. Unsupervised Analysis of Transcriptomics in Bacterial Sepsis Across Multiple Datasets Reveals Three Robust Clusters. Crit. Care Med 46, 915–925 (2018). [DOI] [PMC free article] [PubMed] [Google Scholar]
- 5.Opal SM, Dellinger RP, Vincent J-L, Masur H & Angus DC The next generation of sepsis clinical trial designs: what is next after the demise of recombinant human activated protein C?*. Crit. Care Med 42, 1714–1721 (2014). [DOI] [PMC free article] [PubMed] [Google Scholar]
- 6.Scicluna BP & Baillie JK The Search for Efficacious New Therapies in Sepsis Needs to Embrace Heterogeneity. Am. J. Respir. Crit. Care Med (2018) doi: 10.1164/rccm.201811-2148ED. [DOI] [PMC free article] [PubMed] [Google Scholar]
- 7.Prescott HC, Calfee CS, Thompson BT, Angus DC & Liu VX Toward Smarter Lumping and Smarter Splitting: Rethinking Strategies for Sepsis and Acute Respiratory Distress Syndrome Clinical Trial Design. Am. J. Respir. Crit. Care Med 194, 147–155 (2016). [DOI] [PMC free article] [PubMed] [Google Scholar]
- 8.Coopersmith CM et al. Surviving sepsis campaign: research priorities for sepsis and septic shock. Intensive Care Med. (2018) doi: 10.1007/s00134-018-5175-z [DOI] [PMC free article] [PubMed] [Google Scholar]
- 9.Sweeney TE & Khatri P Benchmarking Sepsis Gene Expression Diagnostics Using Public Data. Crit. Care Med 45 , 1–10 (2017). [DOI] [PMC free article] [PubMed] [Google Scholar]
- 10.Sweeney TE et al. A community approach to mortality prediction in sepsis via gene expression analysis. Nat. Commun 9, 694 (2018). [DOI] [PMC free article] [PubMed] [Google Scholar]
- 11.Davenport EE et al. Genomic landscape of the individual host response and outcomes in sepsis: a prospective cohort study. Lancet Respir Med 4, 259–271 (2016). [DOI] [PMC free article] [PubMed] [Google Scholar]
- 12.Sweeney TE, Shidham A, Wong HR & Khatri P A comprehensive time-course-based multicohort analysis of sepsis and sterile inflammation reveals a robust diagnostic gene set. Sci. Transl. Med 7, 287ra71 (2015). [DOI] [PMC free article] [PubMed] [Google Scholar]
- 13.Reyes M et al. Multiplexed enrichment and genomic profiling of peripheral blood cells reveal subset-specific immune signatures. Science Advances 5, eaau9223 (2019). [DOI] [PMC free article] [PubMed] [Google Scholar]
- 14.Levy MM et al. 2001 SCCM/ESICM/ACCP/ATS/SIS International Sepsis Definitions Conference. Intensive Care Med. 29, 530–538 (2003). [DOI] [PubMed] [Google Scholar]
- 15.Villani A-C et al. Single-cell RNA-seq reveals new types of human blood dendritic cells, monocytes, and progenitors. Science 356 , eaah4573–eaah4573 (2017). [DOI] [PMC free article] [PubMed] [Google Scholar]
- 16.Crinier A et al. High-Dimensional Single-Cell Analysis Identifies Organ-Specific Signatures and Conserved NK Cell Subsets in Humans and Mice. Immunity 49 , 971–986.e5 (2018). [DOI] [PMC free article] [PubMed] [Google Scholar]
- 17.Zheng GXY et al. Massively parallel digital transcriptional profiling of single cells. Nat. Commun 8 , 14049 (2017). [DOI] [PMC free article] [PubMed] [Google Scholar]
- 18.Sundén-Cullberg J et al. Pronounced elevation of resistin correlates with severity of disease in severe sepsis and septic shock. Crit. Care Med 35 , 1536–1542 (2007). [DOI] [PubMed] [Google Scholar]
- 19.Lang Y et al. Interleukin-1 Receptor 2: A New Biomarker for Sepsis Diagnosis and Gram-Negative/Gram-Positive Bacterial Differentiation. Shock 47 , 119–124 (2017). [DOI] [PubMed] [Google Scholar]
- 20.Schaack D, Siegler BH, Tamulyte S, Weigand MA & Uhle F The immunosuppressive face of sepsis early on intensive care unit-A large-scale microarray meta-analysis. PLoS One 13 , e0198555 (2018). [DOI] [PMC free article] [PubMed] [Google Scholar]
- 21.Bauer M et al. A Transcriptomic Biomarker to Quantify Systemic Inflammation in Sepsis - A Prospective Multicenter Phase II Diagnostic Study. EBioMedicine 6 , 114–125 (2016). [DOI] [PMC free article] [PubMed] [Google Scholar]
- 22.McHugh L et al. A Molecular Host Response Assay to Discriminate Between Sepsis and Infection-Negative Systemic Inflammation in Critically Ill Patients: Discovery and Validation in Independent Cohorts. PLoS Med. 12 , e1001916 (2015). [DOI] [PMC free article] [PubMed] [Google Scholar]
- 23.Cheng S-C et al. Broad defects in the energy metabolism of leukocytes underlie immunoparalysis in sepsis. Nat. Immunol 17 , 406–413 (2016). [DOI] [PubMed] [Google Scholar]
- 24.Ulas T et al. S100-alarmin-induced innate immune programming protects newborn infants from sepsis. Nat. Immunol 18 , 622–632 (2017). [DOI] [PubMed] [Google Scholar]
- 25.Jang JC et al. Human resistin protects against endotoxic shock by blocking LPS-TLR4 interaction. Proc. Natl. Acad. Sci. U. S. A 114 , E10399–E10408 (2017). [DOI] [PMC free article] [PubMed] [Google Scholar]
- 26.Orr SK et al. Gene Expression of Proresolving Lipid Mediator Pathways Is Associated With Clinical Outcomes in Trauma Patients. Crit. Care Med 43 , 2642–2650 (2015). [DOI] [PMC free article] [PubMed] [Google Scholar]
- 27.Hotchkiss RS, Monneret G & Payen D Immunosuppression in sepsis: a novel understanding of the disorder and a new therapeutic approach. Lancet Infect. Dis 13 , 260–268 (2013). [DOI] [PMC free article] [PubMed] [Google Scholar]
- 28.Scicluna BP et al. A molecular biomarker to diagnose community-acquired pneumonia on intensive care unit admission. Am. J. Respir. Crit. Care Med 192 , 826–835 (2015). [DOI] [PubMed] [Google Scholar]
- 29.Newman AM et al. Robust enumeration of cell subsets from tissue expression profiles. Nat. Methods 12 ,453–457 (2015). [DOI] [PMC free article] [PubMed] [Google Scholar]
- 30.Roy Chowdhury R et al. A multi-cohort study of the immune factors associated with M. tuberculosis infection outcomes. Nature 560 , 644–648 (2018). [DOI] [PMC free article] [PubMed] [Google Scholar]
- 31.Gossez M et al. Proof of concept study of mass cytometry in septic shock patients reveals novel immune alterations. Sci. Rep 8 , 17296 (2018). [DOI] [PMC free article] [PubMed] [Google Scholar]
- 32.Landelle C et al. Low monocyte human leukocyte antigen-DR is independently associated with nosocomial infections after septic shock. Intensive Care Med. 36 , 1859–1866 (2010). [DOI] [PubMed] [Google Scholar]
- 33.Veglia F, Perego M & Gabrilovich D Myeloid-derived suppressor cells coming of age. Nat. Immunol 19 , 108–119 (2018). [DOI] [PMC free article] [PubMed] [Google Scholar]
- 34.Schrijver IT, Théroude C & Roger T Myeloid-Derived Suppressor Cells in Sepsis. Front. Immunol 10 , 327 (2019). [DOI] [PMC free article] [PubMed] [Google Scholar]
- 35.Chavakis T, Mitroulis I & Hajishengallis G Hematopoietic progenitor cells as integrative hubs for adaptation to and fine-tuning of inflammation. Nat. Immunol 20 , 802–811 (2019). [DOI] [PMC free article] [PubMed] [Google Scholar]
- 36.Rodriguez S et al. Dysfunctional expansion of hematopoietic stem cells and block of myeloid differentiation in lethal sepsis. Blood 114 , 4064–4076 (2009). [DOI] [PMC free article] [PubMed] [Google Scholar]
- 37.Zhang H et al. Sepsis Induces Hematopoietic Stem Cell Exhaustion and Myelosuppression through Distinct Contributions of TRIF and MYD88. Stem Cell Reports 6 , 940–956 (2016). [DOI] [PMC free article] [PubMed] [Google Scholar]
- 38.Rosenbauer F & Tenen DG Transcription factors in myeloid development: balancing differentiation with transformation. Nat. Rev. Immunol 7 , 105–117 (2007). [DOI] [PubMed] [Google Scholar]
- 39.McPeak MB et al. Frontline Science: Myeloid cell-specific deletion of Cebpb decreases sepsis-induced immunosuppression in mice. J. Leukoc. Biol 102 , 191–200 (2017). [DOI] [PMC free article] [PubMed] [Google Scholar]
- 40.Manz MG & Boettcher S Emergency granulopoiesis. Nat. Rev. Immunol 14 , 302–314 (2014). [DOI] [PubMed] [Google Scholar]
- 41.Center for Medicare & Medicaid Services (CMS). Sepsis Bundle Project (SEP), National Hospital Inpatient Quality Measures. Quality Net http://www.qualitynet.org/. [Google Scholar]
- 42.Nakahira K et al. Circulating mitochondrial DNA in patients in the ICU as a marker of mortality: derivation and validation. PLoS Med. 10 , e1001577; discussion e1001577 (2013). [DOI] [PMC free article] [PubMed] [Google Scholar]
- 43.Dolinay T et al. Inflammasome-regulated cytokines are critical mediators of acute lung injury. Am. J. Respir. Crit. Care Med 185 , 1225–1234 (2012). [DOI] [PMC free article] [PubMed] [Google Scholar]
- 44.Stoeckius M et al. Cell Hashing with barcoded antibodies enables multiplexing and doublet detection for single cell genomics. Genome Biol. 19 , 224 (2018). [DOI] [PMC free article] [PubMed] [Google Scholar]
- 45.Wolf FA, Angerer P & Theis FJ SCANPY: large-scale single-cell gene expression data analysis. Genome Biol. 19 , 15 (2018). [DOI] [PMC free article] [PubMed] [Google Scholar]
- 46.Kotliar D et al. Identifying gene expression programs of cell-type identity and cellular activity with single-cell RNA-Seq. Elife 8 , 310599 (2019). [DOI] [PMC free article] [PubMed] [Google Scholar]
- 47.Vallania F et al. Leveraging heterogeneity across multiple datasets increases cell-mixture deconvolution accuracy and reduces biological and technical biases. Nat. Commun 9 , 4735 (2018). [DOI] [PMC free article] [PubMed] [Google Scholar]
- 48.Haynes WA et al. Empowering Multi-Cohort Gene Expression Analysis to Increase Reproducibility in Biocomputing 2017 144–153 (World Scientific, 2016). [DOI] [PMC free article] [PubMed] [Google Scholar]
- 49.Corces MR et al. An improved ATAC-seq protocol reduces background and enables interrogation of frozen tissues. Nat. Methods 14 , 959–962 (2017). [DOI] [PMC free article] [PubMed] [Google Scholar]
- 50.Picelli S et al. Full-length RNA-seq from single cells using Smart-seq2. Nat. Protoc 9 , 171–181 (2014). [DOI] [PubMed] [Google Scholar]
- 51.Ramilowski JA et al. A draft network of ligand-receptor-mediated multicellular signalling in human. Nat. Commun 6 , 7866 (2015). [DOI] [PMC free article] [PubMed] [Google Scholar]
Associated Data
This section collects any data citations, data availability statements, or supplementary materials included in this article.