

Abstract
Social anxiety has been associated with abnormalities in cognitive processing in the literature, manifesting as various cognitive biases. To what extent these biases interrupt social interactions remains largely unclear. This study used the Social Judgment Paradigm that could separate the expectation and experience stages of social feedback processing. Event-related potentials (ERPs) in these two stages were recorded to detect the effect of social anxiety that might not be reflected by behavioral data. Participants were divided into two groups according to their social anxiety level. Participants in the high social anxiety (HSA) group were more likely to predict that they would be socially rejected by peers than did their low social anxiety (LSA) counterparts (i.e. the control group). Compared to the ERP data of the LSA group, the HSA group showed: (a) a larger P1 component to social cues (peer faces) prior to social feedback presentation, possibly indicating an attention bias; (b) a difference in feedback-related negativity amplitude between unexpected social acceptance and unexpected social rejection, possibly indicating an expectancy bias; and (c) a diminished sensitivity of the P3 amplitude to social feedback valence (be accepted/be rejected), possibly indicating an experience bias. These results could help understand the cognitive mechanisms that comprise and maintain social anxiety.
Keywords: social anxiety, social rejection, expectancy bias, event-related potential, P1, feedback-related negativity, P3
Introduction
Social anxiety and information processing biases
Social anxiety is defined as a fear of being in social or performance contexts that involve potential evaluation or scrutiny by other people. At the clinical level, severe social anxiety significantly harms life quality and well-being, known as social anxiety disorder (SAD; or social phobia) (American Psychiatric Association, 2013; Caouette et al., 2015). The presence of SAD negatively influences educational attainment, employment opportunities, financial independence and the development of professional, peer and intimate relationships (Stein and Stein, 2008; Leichsenring and Leweke, 2017). Moreover, a chronic course of the SAD may lead to an increased vulnerability for secondary disorders including depression and substance-use disorders (Ruscio et al., 2008; Crome et al., 2015). Regarding its high lifetime prevalence (e.g. around 13% in the general population of the USA; see Kessler et al., 2012), improving our understanding of social anxiety and SAD is beneficial to foundational research, clinical practice and social service (Andrews et al., 2004; Crome et al., 2015).
Identifying the cognitive mechanisms underlying and maintaining social anxiety is critical to help clinical preventions and interventions. A heightened level of social anxiety is accompanied by distortions in information processing, including attention bias (i.e. attend to negative social information to a greater extent; see Gilboa-Schechtman et al., 1999; Mogg et al., 2004; Killgore and Yurgelun-Todd, 2005; Buckner et al., 2010), memory bias (i.e. preferential memory, such as a higher memory accuracy, for negative social information; see Coles and Heimberg, 2002; Mitte, 2008) and response bias (i.e. more likely to respond as having been socially rejected; see Coles and Heimberg, 2005). For example, socially anxious individuals allocate excessive attentional resources towards potentially threatening social cues (Bogels and Mansell, 2004). These biases lead individuals with social anxiety to be hypervigilant to negative social stimuli (Harrewijn et al., 2017) and to view social situations in an excessively negative fashion (Heinrichs and Hofmann, 2001; Horley et al., 2004; Kashdan, 2007). Harrewijn et al. (2017) suggested that the information processing biases could be regarded as cognitive symptoms that hinder the anticipation of, and recovery from, socially stressful situations.
Cognitive biases associated with social feedback
The current study focuses on the cognitive mechanisms of social feedback processing in socially anxious people. Here, social feedback (including social acceptance and rejection) refers to verbal or non-verbal evaluative signals from others about the appearance, characteristics or performance of an individual (Amir and Bomyea, 2010; Vossen et al., 2010). Social feedback is one of the most important social information in human communications and plays a crucial role in our everyday social life (Ruff and Fehr, 2014). Appropriate processing of social feedback helps keeping a benign social relationship with other people (Baumeister and Leary, 1995).
Cognitive biases associated with social feedback processing are considered as one of the key aspects of social anxiety (Stirling et al., 2006; Cao et al., 2015). For one thing, socially anxious individuals suffer from social feedback expectancy bias, that is, they typically anticipate a more negative outcome during social interactions and have more negative expectations about their social performance compared to non-socially anxious controls (Heinrichs and Hofmann, 2001; Clark and McManus, 2002; Caouette et al., 2015; Qi et al., 2017). This phenomenon has been confirmed by converging evidence, as socially anxious participants reported more pessimistic expectation for social evaluation (Messenger et al., 2004; Guyer et al., 2008; Creswell et al., 2014). In contrast, the controls are generally more prone to expect social acceptance rather than social rejection (Van der Molen et al., 2014; Dekkers et al., 2015). For another, the experience of socially stressful events is also modulated by social anxiety. For instance, SAD patients interpret mildly negative situations in a catastrophic way (Brozovich and Heimberg, 2008); as a result, they are more likely to overestimate the severity of negative social evaluation from others (Hirsch and Clark, 2004). Moreover, SAD patients tend to judge ambiguous faces as angry ones rather than happy ones (Maoz et al., 2016). In a word, socially anxious individuals not only are fear of negative social feedback, but also experience more negative feedback than non-socially anxious counterparts (Van der Molen et al., 2014). As pointed out by the cognitive-behavioral model of social anxiety (Rapee and Heimberg, 1997), these biases are involved in strengthening the core belief of socially anxious individuals, that is, other people would evaluate them negatively and underestimate their social performance (Alden and Wallace, 1995; Spence et al., 1999). In this way, the negative expectancy and experience biases reinforce socially anxious behaviors (including avoidance and withdrawal) overtime, manifesting as a persistent cycle that comprises and maintains social anxiety (Heimberg et al., 2010; Morrison and Heimberg, 2013).
Research paradigm and technique
A number of pragmatic issues are worth noting regarding the purpose of this study. For one thing, researchers should choose a paradigm that could adequately isolate different factors of social feedback processing, since each factor could be susceptible to the cognitive biases associated with social anxiety. Actually, mixing the effects of feedback expectation and feedback evaluation might have resulted in heterogeneous findings across studies (Kujawa et al., 2014; Cao et al., 2015). For this concern, we selected the Social Judgment Paradigm (SJP: Somerville et al., 2006), which is able to separate the expectation and the experience of social feedback. Specifically, participants are first asked to view peer photographs and predict whether they would be accepted or rejected by those peers (the expectation stage), then they observe the presentation of social feedback from those peers (the experience stage). Although the SJP has only recently been applied for the research on social neuroscience, it has been proven to be a powerful tool (Van der Molen et al., 2014; van der Molen et al., 2017). For example, Via et al. (2015) used the SJP and found that patients with anorexia nervosa (which is also related to impaired social interactions) showed hypoactivation of the dorsomedial prefrontal cortex (a brain region involved in social feedback processing) when receiving social acceptance and hyperactivation of visual areas when receiving social rejection.
For another, researchers must consider how to overcome the constraints of subjective dependent variables (e.g. self-reports) such as the social desirability response effect, which should be seriously taken into account when investigating social anxiety (Osman et al., 1998). Relying on measures of behavioral response also takes the risk of mixing the effect of specific cognitive biases with the response bias. For example, using behavioral measures, Caouette et al. (2015) found that participants with a higher level of social anxiety (hereafter, HSA) showed both negative expectancy and negative memory biases compared to their counterparts with a lower level of social anxiety (hereafter, LSA). However, their findings might have been interfered by the response bias (see Qi et al., 2017, for details). Actually, Windmann et al. (2002) observed response bias-related event-related potential (ERP) effects, but there was no group difference in memory accuracy. To resolve this problem, the current study utilized both behavioral and ERP indexes. Derived from time-locked electroencephalogram (EEG) signals, the ERPs could be regarded as an objective and direct measure of neural activity. Owing to its exquisite temporal resolution, the ERP technique is well suited to untangle different cognitive processes that may overlap in time domain (Amodio et al., 2014). Hence, Harrewijn et al. (2017) suggested that employing the ERPs could provide more insight into the information processing biases related to social anxiety.
ERP indexes
In light of the relevant ERP literature (Van der Molen et al., 2014; Cao et al., 2017; Qi et al., 2017; Harrewijn et al., 2018), this study focused on: (a) the P1 component elicited by facial cues in the expectation stage, and (b) the feedback-related negativity (FRN), P3, and late positive potential (LPP) elicited by social feedback in the experience stage. The P1 is an early component (around 100 ms after stimulus onset) maximal over the occipital cortex (Clark and Hillyard, 1996). This component is widely regarded as an index of sensory processing and is sensitive to stimulus-driven or bottom-up attention allocation (Luck and Kappenman, 2012). Overall, an enhanced P1 amplitude in response to faces is related to a high level of social anxiety (Kolassa et al., 2007; Peschard et al., 2013). Also, the difference in P1 amplitude between emotional faces (especially the angry ones) and neutral faces is increased in high vs low socially anxious participants (Mueller et al., 2009; Rossignol et al., 2012; Hagemann et al., 2016). These results indicate that HSA individuals show an initial hypervigilance towards potentially threatening social stimuli, which is in line with the understanding of attentional functions in anxiety disorders according to the hypervigilance-avoidance theory (Mogg et al., 1997).
The FRN is a negative-going waveform that reaches its peak between 200 and 300 ms following feedback presentation (Miltner et al., 1997; Gehring and Willoughby, 2002) and is considered as one of the most important ERP indexes of outcome evaluation (San Martín, 2012; Walsh and Anderson, 2012). Classical theories interpret the FRN as a negative prediction error signal that becomes larger for negative than positive feedback (Nieuwenhuis et al., 2004a,b). Nevertheless, recent studies have revealed that the FRN could be sensitive to both positive and negative prediction errors (Talmi et al., 2013; Sambrook and Goslin, 2014). Regardless of this debate, a majority of previous studies acknowledge that the FRN is sensitive to expectation violation, such that its amplitude increases as a function of the difference between the reality and prior expectation for both economic and social feedback (i.e. being larger in response to unexpected vs expected feedback; see Holroyd et al., 2006; Hajcak et al., 2007; Van der Molen et al., 2014, 2016; van der Molen et al., 2018). Therefore, the FRN could be used as a neurological ‘surprise signal’ that indirectly reflects prior expectation (Hauser et al., 2014). Alternatively, another interpretation is that the FRN reflects the process of feedback monitoring; that is to say, an unexpected outcome requires to be monitored to a greater extent and thus elicits a larger FRN compared to an expected outcome (Nieuwenhuis et al., 2004b; Cavanagh et al., 2010; Meadows et al., 2016; Cheval et al., 2019; Wilhelm et al., 2019). This idea is supported by the discovery that the anterior cingulate cortex, where might be the neural source of the FRN, is a key region of the action monitoring system in the brain (van Veen et al., 2001; Yeung and Cohen, 2006; Holroyd and Yeung, 2012; Yang et al., 2018). Previous studies on social anxiety disagree on whether social rejection or social acceptance elicits a larger FRN (Kujawa et al., 2014; Cao et al., 2015); as mentioned above, this inconsistency might have been generated from mixing the effects of expectation and experience in experimental paradigms.
The P3 is another important component associated with feedback evaluation following the appearance of the FRN (Picton, 1992; Nieuwenhuis et al., 2005). Two subcomponents of the P3 have been identified in previous research, including a frontocentral localized P3a and a parietal localized P3b (Polich and Criado, 2006; Polich, 2007). The P3 has been linked to various cognitive functions depending on task design (Johnston et al., 1986; Donchin and Coles, 1988). With respect to feedback evaluation, the P3 is often regarded as an indicator of the motivational significance of a given feedback (Polezzi et al., 2010; San Martín, 2012). As one of the most important ERP signals of feedback processing (San Martín, 2012), the P3 could reflect whether the motivational significance of social feedback shows abnormality among socially anxious individuals, which may help understand their low motivation of participating in social life (Langston and Cantor, 1989). When participants receive social feedback, the P3 amplitude is enhanced following social acceptance/praise (van der Veen et al., 2016; van der Molen et al., 2018). According to Harrewijn et al. (2017), previous studies using the identification task, approach-avoidance task and attention-shifting paradigm have found no effect of social anxiety on the P3 component (van Peer et al., 2007; Staugaard, 2010; Rossignol et al., 2012, 2013). It should be noted, however, that the amplitude of this component elicited by emotional facial stimuli is sensitive to social anxiety, indicating face-processing biases (Rossignol et al., 2007; Moser et al., 2008; Felmingham et al., 2016). For instance, Sewell et al. (2008) used the emotional oddball task and found that the social anxiety level was correlated with the P3 elicited by angry faces but not happy faces. In light of these findings, we analyzed the P3 associated with social feedback in the SJP.
Finally, we also considered the LPP that emerges around 600–1000 ms post-stimulus, an ERP component most often related to emotional experience and emotion regulation (Ito and Cacioppo, 2000; Hajcak et al., 2010). The significance of the LPP to feedback evaluation has not been appreciated until recently (Meadows et al., 2016; Gu et al., 2017; Yuan et al., 2019). Previous findings regarding the association between social anxiety and the LPP are conflicting (Hajcak et al., 2010). For instance, Moser et al. (2008) found that compared to their LSA counterparts, HSA participants showed an increased LPP in response to angry or disgusted faces in a modified Erikson flanker task (see also Schmitz et al., 2012). Nevertheless, some other studies failed to replicate this effect (Kolassa et al., 2007).
Very recently, Harrewijn et al. (2018) used the SJP in a family study, of which the sample included SAD patients and their family members. Their ERP data showed that SAD was associated with an enlarged N1 to expected social rejection and an enlarged P3 to social acceptance. These results indicate a possibility that some ERP components are electrocortical endophenotypes of SAD, which could be applied for early detection, prevention and treatment (Harrewijn et al., 2017). However, the statistical power of the study by Harrewijn et al. (2018) might have been affected by a relatively small SAD sample (18 individuals). Additionally, another potential issue was the imbalanced sample size between groups (18 vs 97) as it takes the risk of inflating rates of Type I error (Keselman and Keselman, 1988).
Research significance and experimental hypotheses
While the study of Harrewijn et al. (2018) focused on patients diagnosed with SAD and their siblings, that is, individuals exposed to the genetic susceptibility to SAD, the current study is interested in using the ERPs to detect the vulnerability to social anxiety in general populations. Social anxiety is expressed along a severity continuum, with both SAD patients and HSA individuals being placed at the same end of this continuum (Rapee and Spence, 2004). That is to say, many people suffer from symptoms of social anxiety without meeting the clinical diagnostic criteria for SAD (Harrewijn et al., 2017). In this regard, examining the electrophysiological signatures of social anxiety in general populations may help predict and prevent the risk of SAD development.
In brief, we combined the SJP with the ERP technique and investigated the impact of social anxiety on: (a) the facial cue-evoked component P1 associated with early attention allocation in the expectation stage, and (b) the feedback-evoked components FRN, P3, and LPP associated with social feedback processing in the experience stage. We aim to examine the possibility that compared to the LSA ones (i.e. controls), HSA participants would manifest a larger P1 in response to facial cues (indicating hypervigilance to social stimuli), a larger FRN (indicating expectation violation) in response to social acceptance during the SJP, as well as larger P3 and LPP in response to social rejection (indicating an experience bias). In our opinion, the ERP results would help understand the negative expectancy and experience biases in social anxiety. It should be noted that due to the heterogeneous findings from the literature (see above), the current study is an exploratory one in the research field. In this regard, one of the main advantages of this study is a relatively large sample compared to many previous experiments (Sun and Yu, 2014; van der Veen et al., 2014; Dekkers et al., 2015; van der Molen et al., 2018).
Methods
Participants
We selected the following thresholds to conduct a priori power analysis: a power value of not lower than 80% (as suggested by Vazire, 2016), a small effect size of  for the two-way interaction of social feedback × group (Pfabigan et al., 2010) and an α value of 0.05. We used G*Power 3.1.7 (Faul et al., 2007; Faul et al., 2009) to calculate the minimal sample size for the within-between interaction in repeated measures F tests. According to the results of this analysis, 30 participants in each group would ensure 80% statistical power even in case of a small effect size. In a regular mental health screening, 300 undergraduate students of Shenzhen University completed the Chinese version of the Liebowitz Social Anxiety Scale (LSAS; Liebowitz, 1987). The LSAS is made up of 24 items to evaluate fear and avoidance in 11 social and 13 performance situations. Previous studies have suggested two cut-off points of the LSAS score: a score <30 indicates no SAD, whereas a score >60 indicates a high probability of SAD (Mennin et al., 2002; Rytwinski et al., 2009). Among the students whose scores met one of these criteria, we randomly selected candidates and called them via cell phone for invitation. Approximately, 2/3 of the students who answered the phone agreed to participate in the experiment, but the other 1/3 said they had no time or were not interested. The recruitment process was continued until the number of participants reached 30 in each group. Finally, both the HSA (LSAS score >60) and the LSA (LSAS score <30) groups consisting of 30 volunteers. Demographic and psychological characteristics of these 60 participants are shown in Table 1. In addition to the 60 participants of whom the EEG data were collected, we also invited another 40 volunteers, whose LSAS scores were within the range of 30–60, to perform the same task without EEG recording. Setting up this medium socially anxious (MSA) group helps examine the possibility that the relationship between social anxiety and cognitive biases shows a non-linear pattern. Considering that the level of social anxiety conforms to a normal distribution in general populations (Ranta et al., 2007), we intentionally recruited a larger number of participants for the MSA group. Taken together, the LSAS scores in the whole sample (100 participants) ranging from 5–110.
Table 1.
Demographic and psychological characteristics of the low and high social anxiety groups (mean ± standard deviation)
| Items | Low social anxiety (n = 30) | High social anxiety (n = 30) | Statistics |
|---|---|---|---|
| Age (years) | 20.5 ± 2.06 | 20.33 ± 1.33 | t(49.6) = 0.60, P = 0.555 |
| Gender (male/female) | 16/14 | 14/16 | χ2 = 0.267, P = 0.606 |
| LSAS | 20.4 ± 8.2 | 76.6 ± 14.9 | t(45.0) = −18.10, P < 0.001 |
| BDI-II | 4.6 ± 7.3 | 19.6 ± 9.5 | t(58) = −6.88, P < 0.001 |
| STAI-T | 35.9 ± 8.8 | 53.3 ± 9.4 | t(58) = −7.42, P < 0.001 |
| RSQ | 6.9 ± 3.8 | 9.8 ± 4.5 | t(58) = −2.69, P = 0.009 |
| RSAS | 21.0 ± 7.5 | 21.7 ± 3.9 | t(58) = −0.50, P = 0.621 |
| ERQ | |||
| Reappraisal | 32.2 ± 5.7 | 28.5 ± 5.0 | t(58) = 2.67, P = 0.010 |
| Suppression | 13.7 ± 4.8 | 15.7 ± 4.3 | t(58) = −1.71, P = 0.092 |
| RSES | 29.1 ± 3.1 | 23.5 ± 3.1 | t(58) = 6.97, P < 0.001 |
LSAS, Liebowitz Social Anxiety Scale; BDI-II, Beck Depression Inventory (Second Edition); STAI-T, the Trait form of Spielberger’s State-Trait Anxiety Inventory; RSQ, Rejection Sensitivity Questionnaire; RSAS, Revised Social Anhedonia Scale; ERQ, the Emotion Regulation Questionnaire; RSES, Rosenberg Self-Esteem Scale.
Exclusion criteria for all participants were: (1) schizophrenia, schizophrenic affective disorder, depression, anxiety disorder, bipolar affective disorder or other mental disorders according to the screening results with SCID-I/NP (First et al., 2002) and SCID-II (First et al., 1996); (2) seizure disorder; (3) history of head injury with possible neurological sequelae, and (4) substance abuse or dependence in the past six months. All participants were right-handed and had a normal (or corrected-to-normal) vision. Written informed consent was obtained prior to the experiment. The experimental protocol was approved by the Ethics Committee of Shenzhen University.
Procedure
Invited students were told that they would attend a study about first impression. To enhance the credibility of the cover story, participants were asked to send a portrait photograph of themselves to the experimenter approximately one week before the formal experiment. They were told that their photograph would be evaluated by a number of anonymous students from neighboring universities (see below for details). Unbeknownst to participants, their photographs were actually not utilized in the study and were deleted to avoid inappropriate use.
At the experiment day, participants were first required to finish several self-reported questionnaires including the Beck Depression Inventory Second Edition (BDI-II; Beck et al., 1996), Trait form of Spielberger’s State-Trait Anxiety Inventory (STAI-T; Spielberger et al., 1983), Rejection Sensitivity Questionnaire (RSQ; Downey and Feldman, 1996), Revised Social Anhedonia Scale (RSAS; Eckblad et al., 1982), Emotion Regulation Questionnaire (ERQ; Gross and John, 2003) and Rosenberg Self-Esteem Scale (RSES; Rosenberg, 1965; see 2.4 Self-reported measures for details).
Participants were then required to finish the SJP developed by Somerville et al. (2006). During this task, the participant sat comfortably in an electrically-shielded room and were approximately 100 cm away from a computer screen. The task consisted of four blocks (each containing 60 trials) and there was a self-terminated break between neighboring blocks. The SJP lasted for 35 min and the whole procedure lasted for approximately 1.5 h. After the task, each participant was paid 140 Chinese RMB (approximately 20 US dollars) for remuneration.
Experimental design and stimuli
Each trial began with the presentation of a fixation cross for 200–300 ms (see Figure 1). Then in the cue stage, the participant saw a colored photograph (white background) of an anonymous student (‘peer’). There were 240 ID photographs in total, taken from 240 undergraduate students (120 males and 120 females) in Shenzhen University who did not participated in the experiment. Each individual in the photograph exhibited a neutral facial expression, facing the camera directly with both ears visible. All photographs were presented with the same contrast and brightness (3.0 × 3.5° visual angle). Each photograph appeared only once during the task.
Fig. 1.

Illustration of an example trial. On both sides of the photograph, ‘A’ and ‘R’ indicate ‘acceptance’ and ‘rejection’, respectively. RT: response time. Concerning the right of portrait, a picture of the corresponding author (D.Z.) was used here to replace the ID photograph in the real task.
The participant was instructed to guess whether the peer on the screen considered her/him to be socially acceptable and likeable, according to the photograph that he/she submitted to the experimenter. The participant made his/her prediction (be accepted/be rejected) by pressing the F or J button on the keyboard with his/her left or right index finger. The button assignment was counterbalanced across participants. The cue stage ended immediately after the participant pressed a button, otherwise it would last for up to 3000 ms. Then in the delay stage, participant prediction was highlighted as a letter ‘A’ (be accepted) or ‘R’ (be rejected) on the left side of the ID photograph for 2000 ms. Subsequently in the feedback stage, the ‘actual’ social feedback was displayed, also as a letter ‘A’ or ‘R’, on the right side of the ID photograph for another 2000 ms. In fact, the feedback was not provided by real people; rather, it was pseudo-randomly set up such that the probabilities of receiving ‘A’ and ‘R’ were both 50%. Finally, all stimuli disappeared, leaving a blank screen for 2000 ms as an inter-trial interval.
Self-reported measures
In addition to social anxiety, the general trends of anxiety and depression are also well-known characteristics that might influence social cognition and reward processing (Wu et al., 2013; He et al., 2019). This study therefore employed STAI-I and BDI-II to measure the level of general anxiety and depression in participants. The STAI-T is designed to examine the individual difference in anxiety tendency. It has 20 items and the total score ranges from 20–80, with a higher score suggesting a higher level of trait anxiety. The BDI-II is a widely used self-administered screening tool for depressive symptoms. It contains 21 items that measure somatic and psychological symptoms of depression in the past 2 weeks. The BDI-II scores from 0–63, with a higher score indicating a higher level of depressive tendency. Furthermore, previous studies have demonstrated that rejection sensitivity (Powers et al., 2013) and self-esteem (Somerville et al., 2010) might influence behavioral performance and neural patterns in the SJP, thus we included the RSQ and RSES to quantify these two characteristics. The RSQ includes 18 items describing hypothetical situations in which respondents make requests of important others. For each item, participants were instructed to imagine the situation and then report their: (a) level of anxiety about the peer’s reaction and (b) expectation that the person would grant the request. A possible score range is 1–36, with a higher score indicating a higher rejection sensitivity. The RSES is commonly used to measure self-esteem. It consists of 10 items and a possible score range is 10–50; a higher score indicates a higher level of self-esteem. Also, it is well-known that social reward processing could be highly influenced by the level of social anhedonia (Healey et al., 2014). Accordingly, we used the RSAS to measure social anhedonia, which is a 40-item yes/no response questionnaire with a score range of 0–40; a higher score indicates less enjoyment from and need for social contact. In addition, the ERQ was employed to measure individual tendency to use two kinds of emotional regulation strategies, i.e. cognitive reappraisal and expressive suppression, since many studies have suggested that emotional regulation strategies may affect behavioral performance and neural activations in social tasks (Lam et al., 2009; Grecucci et al., 2013). In the ERQ, the cognitive reappraisal subscale has 6 items and scores from 6 to 42,while the expressive suppression subscale has 4 items and scores from 4–28. A higher score on a subscale suggests that the corresponding strategy is more frequently adopted.
EEG recording and analysis
Brain electrical activity was recorded referentially against the FCz electrode site using a32-channel amplifier with a sampling frequency of 250 Hz (NeuSen.W32, Neuracle, China). Electrode impedances were kept below 8 kΩ during recording. The recorded EEG data were off-line filtered (0.1–30 Hz) followed by ocular artifact removal. We used the regression procedure implemented in NeuroScan software (Scan 4.3, NeuroScan Inc., Charlotte, NC) to reduce blink noises (threshold = 250 μV). The electrode placed on supra-orbital region of the right eye was selected as the reference for blinks. Then the data were off-line re-referenced to a whole-head average reference (including 29 sites: Fp1, Fp2, F3, F4, F7, F8, Fz, T7, T8, FC1, FC2, FC5, FC6, FCz, C3, C4, Cz, P3, P4, P7, P8, Pz, CP1, CP2, CP5, CP6, O1, O2 and Oz). This procedure was followed by segmentation beginning 200 ms prior to the onset of stimulus and lasting for 800 ms (cue-evoked ERPs) or for 2000 ms (feedback-evoked ERPs). Trials contaminated with significant artifacts (peak-to-peak deflection exceeded ±100 μV) were excluded from further analyses. After the data preprocessing, 64.3 ± 16.6 (mean ± standard deviation, hereinafter the same), 64.8 ± 16.5, 43.7 ± 16.4 and 43.1 ± 16.3 trials (per participant) were determined as artifact-free in the LSA group (control group) for the ‘expected acceptance’, ‘unexpected acceptance’, ‘expected rejection’ and ‘unexpected rejection’ conditions, respectively. Meanwhile, the numbers of artifact-free trials in the HSA group were 52.5 ± 15.6, 53.0 ± 15.7, 55.1 ± 15.0 and 54.6 ± 15.1 (per participant) for these four conditions. All epochs were baseline-corrected with respect to the mean voltage over the 200 ms preceding the onset of stimulus, followed by averaging within each experimental condition.
This study focused on the ERPs elicited by cues (i.e. ID photographs) and social feedback. The time windows and electrodes for the analysis on each ERP component were determined according to the suggestion of classic studies (see below). For the cue-evoked ERP, we analyzed the average amplitude of the occipital P1 component. Specifically, the P1 amplitude was calculated as the average amplitude between 100 and 130 ms after the onset of cues at the O1 and O2 sites (Neumann et al., 2015; Fisher et al., 2016; Hagemann et al., 2016). For the feedback-evoked ERP, we analyzed average amplitudes of the frontal FRN, frontal P3a, parietal P3b, as well as LPP. The frontal FRN (250–310 ms) and P3a (300–450 ms) amplitudes were calculated as the average amplitude post-feedback at the Fz, FC1 and FC2 sites, using the arithmetical means of these electrodes (Ferdinand et al., 2012; Maurage et al., 2012, 2018); the parietal P3b (500–650 ms) and LPP (800–1800 ms) amplitudes were calculated as the average amplitude post-feedback at the electrode sites of P3, P4, Pz, CP1 and CP2, also using the arithmetical means of these electrodes (Sarlo et al., 2011; Weinberg et al., 2012; Suzuki et al., 2015). Aside from these components, the N170 has been widely regarded as one of the most important ERP indexes of facial processing (Bentin et al., 1996; Rossion and Jacques, 2008; Hinojosa et al., 2015). However, previous studies indicate that the N170 is not modulated by social anxiety, as SAD patients or HSA individuals show no differences in N170 amplitude with the controls (Kolassa et al., 2009; Schmitz et al., 2012; Hagemann et al., 2016). For this reason, we did not analyze the N170 in the current study.
Statistics
Repeated-measures analysis of variances (ANOVAs) were used to examine the behavioral and ERP measures, with group as the between-subject factor. Also, a multiple linear regression model was built with the positive prediction rate (see below) as the dependent variable. Predictors of the model included self-reported measures (LSAS, BDI-II, STAI-T, RSQ, RSAS, ERQ and RSES). It should be noted that the ANOVAs and multiple regression model served different purposes. The primary aim of this study was to investigate the expectation and experience stages of social feedback processing, and the ANOVA was used to examine behavioral and ERP differences between the HSA and LSA (control) participants with a total sample of 60. Aside from this main purpose, our study also explored whether and how individual characteristics/features could influence the expectation of social feedback with regression analysis on the behavioral level with a total sample of 100.
The significance level was set at P < 0.05. The Bonferroni correction was used to counteract the problem of multiple comparisons when examining the positive prediction rate across three groups. The Greenhouse-Geisser correction was unnecessary in this study since none of our datasets violated the assumption of sphericity in repeated measures ANOVAs. Significant interactions were analyzed using simple effects models. We also provided partial eta-squared ( ) values to demonstrate effect size for significant results (Cohen, 1973). For brevity, only the significant findings are presented below.
Results
Behavioral data
Positive prediction rate
On average, participants in the HAS group predicted that the peer in the photograph would accept them in 115.5 ± 31.2 trials, reject them in 119.7 ± 30.1 trials and made no response in 4.8 ± 3.7 trials. Participants in the MSA group predicted that the peer would accept them in 130.7 ± 36.3 trials, reject them in 105.4 ± 35.9 trials and made no response in 3.9 ± 3.5 trials. Finally, participants in the LSA group predicted that the peer would accept them in 139.1 ± 33.1 trials, reject them in 96.8 ± 32.7 trials and made no response in 4.5 ± 4.7 trials.
We calculate the positive prediction rate to measure the participant tendency of predicting that he/she would be socially accepted by peers, by dividing the number of trials in which participants made such a positive prediction (i.e. choosing the option ‘be accepted’) by the total number of responded trials. Univariate ANOVA shows that the group effect was significant (F(2,97) = 3.74, P = 0.027,  = 0.072). Multiple comparisons (Bonferroni corrected) reveal that the positive prediction rate was lower in the HSA (49.1 ± 13.0%) compared to the LSA group (59.0 ± 13.9%; t(58) = −2.84,
  = 0.118, P = 0.025), while no significant difference was found between the MSA and HSA groups (t(68) = 1.81,
  = 0.046, P = 0.214) or between the MSA and LSA groups (t(68) = −1.02,
  = 0.015, P = 0.878).
To explore the influence of individual characteristics on the tendency of making positive prediction, multiple linear regression (enter method) was implemented on all the 100 datasets, with the positive prediction rate as the dependent variable, and self-reported scores of LSAS, BDI-II, STAI-T, RSQ, RSAS, ERQ (including reappraisal and suppression) and RSES as eight predictors. Results showed that LSAS (standardized coefficient β = −0.339, P = 0.007), ERQ reappraisal (β = 0.292, P = 0.018) and ERQ suppression (β = −0.261, P = 0.009) significantly predicted the positive prediction rate (R2 = 0.243, F(8,91) = 3.6, P = 0.001).
Reaction time
On average, the reaction time (RT) of predicting ‘accept’ and ‘reject’ in the LSA group were 1003 ± 249 and 1032 ± 239 ms, respectively. The RT of these two conditions in the MSA group were 1072 ± 203 and 1071 ± 197 ms, respectively. The RT of these two conditions in the HSA group were 1059 ± 153 and 1054 ± 151 ms, respectively. Repeated-measures ANOVA was performed on the RT with social prediction (be accepted vs be rejected) as the within-subject factor and group (LSA/MSA/HSA) as the between-subject factor. No significant effect was detected between conditions (F(1,58) ≤ 1.29, P ≥ 0.280).
ERPs
Cue-evoked ERPs
Repeated-measures ANOVA was performed on the occipital P1 amplitude with social prediction (be accepted vs be rejected) and hemisphere (left vs right) as two within-subject factors, and group (LSA vs HSA) as the between-subject factor. Here, the hemisphere factor was taken into account because previous studies have highlighted the significance of hemispheric lateralization for the P1 (Tomberg et al., 2005). The main effect of group was significant (F(1,58) = 14.6, P < 0.001,  = 0.202; Figure 2); participants in the HSA group (9.2 ± 3.6 μV) showed a larger P1 than participants in the LSA group (6.1 ± 4.0 μV). The main effect of hemisphere was significant (F(1,58) = 10.6, P = 0.002,
  = 0.155; left vs right = 6.8 ± 4.5 vs 8.5 ± 3.6 μV). No significant interaction effect was found.
Fig. 2.

Grand-mean ERP waveforms elicited by cue presentation at the O1 and O2 sites, representing the occipital P1 component. Pre: prediction; LSA/HSA: low/high social anxiety group.
Feedback-evoked ERPs
Repeated-measures ANOVA was performed on the amplitudes of the frontal FRN, frontal P3, parietal P3 and LPP, with social feedback (acceptance vs rejection) and prediction-feedback congruence (expected vs unexpected) as two within-subject factors and group (LSA vs HSA) as the between-subject factor. For the FRN, the main effect of prediction-feedback congruence was significant (F(1,58) = 24.5, P < 0.001,  = 0.297); unexpected feedback (4.3 ± 4.4 μV) evoked a larger (i.e. more negative-going) FRN than expected feedback (5.3 ± 4.5 μV) regardless of its valence. Furthermore, we observed a three-way interaction of social feedback × prediction-feedback congruence × group (F(1,58) = 4.1, P = 0.047,
  = 0.038; Figure 3). To understand this three-way interaction, we tested the social feedback × prediction-feedback congruence interaction in the LSA and HSA groups, respectively. In the LSA group, the two-way interaction was not significant (F < 1); in the HSA group, there was a significant two-way interaction (F(1,29) = 7.1, P = 0.012,
  = 0.197), that is, while the FRN evoked by unexpected acceptance (3.8 ± 5.0 μV) was significantly larger than that evoked by unexpected rejection (5.4 ± 5.4 μV; F(1,29) = 18.4, P < 0.001,
  = 0.388), this effect was not significant for expected feedback (F < 1; acceptance vs rejection = 5.3 ± 5.6 vs 5.2 ± 4.6 μV).
Fig. 3.

Grand-mean ERP waveforms (as the averages across the Fz, FC1 and FC2 sites) elicited by feedback presentation, representing the FRN and P3a components. Unexp: unexpectedly; exp: expectedly.
Regarding the frontal P3a, a three-way interaction of social feedback × prediction-feedback congruence × group was observed (F(1,58) = 4.1, P = 0.047,  = 0.066; Figure 3). To understand this three-way interaction, we tested the social feedback × prediction-feedback congruence interaction in the LSA and HSA groups, respectively. In the LSA group, this two-way interaction was significant (F(1,29) = 4.8, P = 0.036,
  = 0.142); the P3a evoked by expected acceptance (8.5 ± 3.7 μV) was significantly larger than that evoked by expected rejection (7.1 ± 4.6 μV; F(1,29) = 9.8, P = 0.004,
  = 0.252); in contrast, this effect was insignificant for unexpected feedback (F < 1; acceptance vs rejection = 6.8 ± 3.2 vs 6.9 ± 4.3 μV). In the HSA group, the two-way interaction was insignificant (F < 1). Regarding the parietal P3b, no significant effect was found between conditions (Figure 4).
Fig. 4.
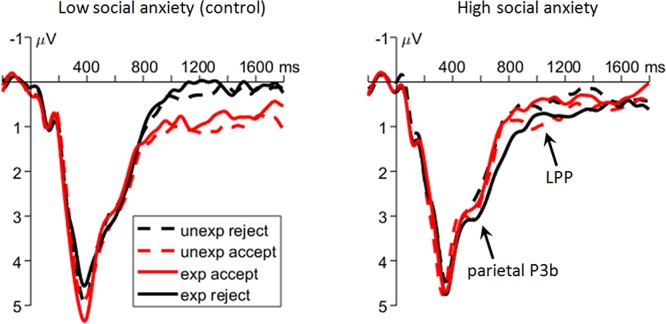
Grand-mean ERP waveforms (as the averages across the P3, P4, Pz, CP1 and CP2 sites) elicited by feedback presentation, representing the P3b component and LPP. unexp: unexpectedly; exp: expectedly.
Regarding the LPP, the main effect of social feedback was significant (F(1,58) = 8.8, P = 0.004,  = 0.131); rejection (0.4 ± 1.4 μV) evoked a reduced LPP than acceptance feedback did (0.7 ± 1.6 μV). Additionally, we observed a two-way interaction of social feedback × group (F(1,58) = 8.8, P = 0.004,
  = 0.132; Figure 4); the LSA group showed a reduced LPP in response to social rejection (0.3 ± 1.3 μV) compared to social acceptance (1.0 ± 1.5 μV; F(1,58) = 17.6, P < 0.001,
  = 0.233), while there was no significant effect of social feedback in the HSA group (F < 1; acceptance vs rejection = 0.5 ± 1.6 vs 0.5 ± 1.5 μV).
Discussion
Cognitive biases during the expectation stage and the experience stage of social feedback processing play an important role in social anxiety. Combining the SJP with EEG recording, the current study has collected behavioral and ERP results that could help understand the relationship between these cognitive biases and the level of social anxiety in general populations. Regarding the behavioral data, we found that compared to their LSA counterparts, participants in the HSA group were more prone to predict that they would be socially rejected by peers. Linear regression analysis confirmed that in the whole sample, the likelihood of predicting a social acceptance decreased as a function of social anxiety score. These results replicated the behavioral pattern in other social anxiety studies using the SJP (Harrewijn et al., 2018; van der Molen et al., 2018), thus demonstrating that our task manipulation was valid. More generally, one interpretation of the observed behavioral data is that HSA individuals are more pessimistic about the consequence of social interactions. In other words, they are more prone to expect negative social feedback (Harrewijn et al., 2018). However, as pointed out by Qi et al. (2017), we could not rule out the possibility that the behavioral results merely reflected a response bias (rather than an expectation bias) associated with social anxiety. From this perspective, ERP indexes would be helpful to provide more direct evidence at the neural level.
For the ERP analysis, we selected (1) the P1 component evoked by peer faces to investigate the processing of social cues, (2) the FRN evoked by social feedback to investigate expectation violation and (3) the P3 and LPP evoked by social feedback to investigate feedback experience. Regarding the ERPs related to social cue presentation, the P1 was sensitive to social anxiety. Specifically, the HSA group showed a larger P1 than the LSA group in response to facial cues regardless of the participant’s subsequent prediction (be accepted vs be rejected). Previous studies have suggested that the P1 amplitude is enhanced for emotional faces than neutral faces among socially anxious individuals (Mueller et al., 2009; Rossignol et al., 2012; Hagemann et al., 2016). Seeing that the current experiment only used neutral faces, the P1 results might be interpreted as hypervigilance to social stimuli in general (Kolassa et al., 2007; Peschard et al., 2013). In our opinion, the attention bias manifested on the P1 amplitude may contribute to the emergence of expectancy bias (i.e. pessimistic about the future of social interactions) associated with social anxiety, which (as mentioned above) has been observed in our behavioral data. That is to say, participants with a higher level of social anxiety allocated excessive attentional resources to social cues, which may then inappropriately strengthened their expectation to be rejected (i.e. the confirmation bias; see Remmerswaal et al., 2014). This idea is in line with the a recent finding that socially anxious individuals reveal greater automatic attention to social stimuli, indicating a global modulation of attentional processing (Peschard et al., 2013; Wieser and Moscovitch, 2015; Felmingham et al., 2016). Nevertheless, the correlation between the behavioral prediction rate and the P1 amplitude failed to reach statistical significance (not presented in the Results section), thus limits the reliability of our theory. One possibility is that normal individuals are generally capable of regulating the influence of attention bias on their behavior. In contrast, we expect that the relationship between attention bias and negative expectation would be more prominent among SAD patients. Further examinations would be needed on this issue.
Regarding the ERPs related to social feedback processing, the most significant finding is that the FRN amplitude was sensitive to the two-way interaction of social feedback × prediction-feedback congruence in the HSA group, but not in the LSA group. Specifically, in the HSA group, unexpected acceptance elicited a larger (i.e. more negative-going) FRN compared to unexpected rejection did; in contrast, the difference between conditions was insignificant for expected feedback. As mentioned in the Introduction section, the cognitive function of the FRN is under debate. According to the classic ‘reinforcement learning theory of the error-related negativity (RL-ERN theory)’, the FRN should be consider as a negative prediction error signal, such that it is larger following negative than positive feedback (Holroyd and Coles, 2002; Nieuwenhuis et al., 2004a,b). This theory assumes that individuals tend to expect for positive feedback, therefore negative feedback violates their prior expectation to a greater extent than positive feedback does (i.e. a larger negative prediction error). However, accumulating evidence suggests that when prior expectation is manipulated by the task, the FRN becomes larger in response to both positive and negative prediction errors; accordingly, the FRN might better be understood as a ‘surprise signal’ regardless of feedback valence (i.e. an unsigned prediction error signal; see Ferdinand et al., 2012; Talmi et al., 2013; Garofalo et al., 2014; Hauser et al., 2014; Sambrook and Goslin, 2014; Gu et al., 2017). In our opinion, the current FRN results fit well with the second theory, as the FRN amplitude increased in response to unexpected social acceptance (positive feedback) than unexpected social rejection (negative feedback) in the HSA group. However, the P value (0.047) of the three-way interaction of social feedback × prediction-feedback congruence × group on the FRN was just below the significant level. Therefore, the reliability of this finding needs to be confirmed by follow-up studies.
Here, an interesting phenomenon that should be explained is why unexpected acceptance elicited a larger FRN compared to unexpected rejection, seeing that both kinds of feedback violated prior expectation according to self-reports. von Borries et al. (2013) have found that the FRN is more likely to reflect implicit (habit-like) rather than explicit prediction errors (see also Cavanagh et al., 2010; Chase et al., 2011). Inspired by this idea, we suggest that the expectation from HSA participants was actually more pessimistic than that revealed by self-reports. That is, in many trials that HSA participants explicitly reported a positive prediction (possibly for the sake of maintaining overtly positive self-views), they implicitly expected to be socially rejected. The FRN pattern, however, revealed their implicit belief: ‘unexpected’ rejection did not violate prior expectation as much as unexpected acceptance did, as indicated by a smaller FRN in the HSA group. This hypothesis is in line with the idea that the ERPs could reflect implicit beliefs and attitudes beyond self-report (Lust and Bartholow, 2009; Amodio et al., 2014; Wu et al., 2016), thus demonstrating the importance of using ERPs to investigate social anxiety.
Recently, an emerging line of studies has re-interpreted the FRN as a ‘reward positivity’ (RewP) that becomes more positive-going for positive feedback (rather than more negative-going for negative feedback; see Foti et al., 2011; Proudfit, 2015; Proudfit et al., 2015; Ait Oumeziane and Foti, 2016). According to these studies, motivation is a key component in feedback monitoring as reflected by the RewP (Ma et al., 2014; Grand et al., 2015; Meadows et al., 2016; Wilhelm et al., 2019). From this perspective, the current results might be explained in the way that for HSA participants, unexpected acceptance has a relatively low motivational value compared to other kinds of feedback, since the ‘reward positivity’ was smallest in this condition (see Figure 3). In other words, socially anxious individuals generally focus on interpreting negative social feedback, thus are less motivated to process feedback that is unexpectedly positive (i.e. social acceptance). In contrast, the activity of feedback monitoring system was attenuated in response to expected feedback, thus the RewP amplitude did not distinguish between expected acceptance and expected rejection. This hypothesis is in line with the finding that SAD patients showed decreased striatal activity in response to social incentives (Cremers et al., 2014). Follow-up research would be required to determine between the above two hypotheses of the FRN.
Following the FRN, both the frontal P3 and LPP (but not the parietal P3b) also showed significant effects of social anxiety. More specifically, in the LSA group, the P3a elicited by expected acceptance was larger than that elicited by expected rejection, and the LPP elicited by social acceptance was larger than that elicited by social rejection. Meanwhile, no significant difference between conditions was observed in the HSA group. As pointed out in the Introduction section, the P3a amplitude indicates the emotional significance of the ongoing event, while the LPP amplitude is an index of the intensity of sustained emotional experience. Taken together, the current results showed that the emotional responses of the LSA participants distinguished between acceptance and rejection and also distinguished between expected acceptance and expected rejection. Differentially responding to different social feedback (or social evaluation) is one of the characteristics of a functioning emotional system, which has important implications for social adaptation (Mendes et al., 2008; DeWall and Bushman, 2011). In contrast, the emotional insensitivity to social feedback value among HSA participants (though some feedback violated their prior expectation to a greater degree: see our discussion on the FRN) indicates deficits in social emotion processing that may damage the quality of their social interactions (see also Ginsburg et al., 1998). However, it should be noted that the P value (0.047) of the three-way interaction of social feedback × prediction-feedback congruence × group on the frontal P3a just reached statistical significance.
To sum up, owing to the temporal accuracy of the ERP technique, the current study provides a full picture of social feedback processing in time domain among socially anxious individuals. The experimental results include ERP evidence for the existence of attentional bias (indexed by the P1), expectation bias (indexed by the FRN) and experience bias (indexed by the frontal P3 and LPP) associated with social anxiety. These findings help understand the cognitive underpinnings of social anxiety, which is both theoretically and empirically meaningful. In our opinion, one or more of the ERP indexes observed in the SJP have the potential to be biomarkers of early symptoms of social anxiety, which predict the risk of developing into SAD for individuals.
Finally, some limitations and future directions should be discussed. First, the associations between the aforementioned cognitive biases are unclear. Particularly, it is undetermined whether social anxiety symptoms are generated from interactions between these biases, or instead are predominantly driven by one of these biases. Second, a recent study on SAD patients and family members found that the P3 elicited in the SJP was larger for social acceptance than the social rejection, which is different from our results (Harrewijn et al., 2018). It remains to be explored whether the discrepancy in P3 pattern could distinguish between clinical and subclinical social anxiety. Third, follow-up research needs to consider the significance of our results to interventions. Notably, an interesting finding from our behavioral data is that the individual tendency to use (cognitive) reappraisal for emotional regulation was positively correlated with the positive prediction rate, while the reverse was true for (expressive) suppression (both were measured with the ERQ). These findings echo the literature that reappraisal is a more efficient strategy than suppression (Goldin et al., 2008; Memedovic et al., 2010) and indicate the importance of reappraisal for coping with social anxiety (see also Goldin et al., 2009; Goldin et al., 2012). Fourth, this study did not collect EEG data from the MSA group due to resource limitations, and it remains to be explored whether the ERP signals in the expectation and experience stages of social feedback processing show a linear trend with social anxiety level. Last but not least, this exploratory study did not apply pre-registration. This issue warrants attention as it has the potential to affect the reproducibility of the current findings (Gelman and Loken, 2013; Stevens, 2017; Nosek et al., 2018).
Author contributions
X.A. and D.Z. conceived the experiment. X.A., L.M. and D.Z. designed and performed the experiment. D.Z. analyzed the data. R.G., X.A. and D.Z. wrote the manuscript.
Declaration of ethics
All procedures performed in this study were in accordance with the 1964 Helsinki declaration and its later amendments or comparable ethical standards.
Statement of data processing
In response to the Standard Reviewer Disclosure Request (2014) endorsed by the Center for Open Science (http://osf.io/hadz3), the authors confirm that in this manuscript, they have reported all measures, conditions, data exclusions and how they determined their sample sizes.
Data and code availability
The data and code of this study would be available upon reasonable request and with approvals of School of Psychology, Shenzhen University. More information on making this request can be obtained from the corresponding author, Prof. Dandan Zhang (zhangdd05@gmail.com).
Acknowledgements
The authors thank Ziyan Yang for providing comments on the revised manuscript.
Funding
This study was funded by the National Natural Science Foundation of China (31970980, 31571124), Guangdong Key Basic Research Grant (2018B030332001), Shenzhen Basic Research Project (JCYJ20180305124305294), Shenzhen-Hong Kong Institute of Brain Science-Shenzhen Fundamental Research Institutions 2019SHIBS0003, the Major Program of the Chinese National Social Science Foundation (17ZDA324) and Youth Innovation Promotion Association CAS (2019088).
Conflict of interest. The authors have declared that there is no conflict of interest in relation to the subject of this study.
References
- Ait Oumeziane B., Foti D. (2016). Reward-related neural dysfunction across depression and impulsivity: a dimensional approach. Psychophysiology, 53(8), 1174–84. doi: 10.1111/psyp.12672. [DOI] [PubMed] [Google Scholar]
- Alden L.E., Wallace S.T. (1995). Social phobia and social appraisal in successful and unsuccessful social interactions. Behaviour Research and Therapy, 33(5), 497–505. doi: 10.1016/0005-7967(94)00088-2. [DOI] [PubMed] [Google Scholar]
- American-Psychiatric-Association (2013). Diagnostic and Statistical Manual of Mental Disorders (DSM-5®), Arlington, VA: American Psychiatric Publishing. [Google Scholar]
- Amir N., Bomyea J. (2010). Cognitive biases in social anxiety disorder In: Hofmann S.G., DiBartolo P.M., editors. Social Anxiety: Clinical, Developmental, and Social Perspectives, 2nd edn, London: Academic Press, pp. 373–93. [Google Scholar]
- Amodio D.M., Bartholow B.D., Ito T.A. (2014). Tracking the dynamics of the social brain: ERP approaches for social cognitive and affective neuroscience. Social Cognitive and Affective Neuroscience, 9(3), 385–93. doi: 10.1093/scan/nst177. [DOI] [PMC free article] [PubMed] [Google Scholar]
- Andrews G., Issakidis C., Sanderson K., Corry J., Lapsley H. (2004). Utilising survey data to inform public policy: comparison of the cost-effectiveness of treatment of ten mental disorders. British Journal of Psychiatry, 184, 526–33. doi: 10.1192/bjp.184.6.526. [DOI] [PubMed] [Google Scholar]
- Baumeister R.F., Leary M.R. (1995). The need to belong: desire for interpersonal attachments as a fundamental human motivation. Psychological Bulletin, 117(3), 497–529. doi: 10.1037/0033-2909.117.3.497. [DOI] [PubMed] [Google Scholar]
- Beck A.T., Steer R.A., Brown G.K. (1996). Beck Depression Inventory—Second Edition, San Antonio, TX: The Psychological Corporation. [Google Scholar]
- Bentin S., Allison T., Puce A., Perez E., McCarthy G. (1996). Electrophysiological studies of face perception in humans. Journal of Cognitive Neuroscience, 8(6), 551–65. doi: 10.1162/jocn.1996.8.6.551. [DOI] [PMC free article] [PubMed] [Google Scholar]
- Bogels S.M., Mansell W. (2004). Attention processes in the maintenance and treatment of social phobia: hypervigilance, avoidance and self-focused attention. Clinical Psychology Review, 24(7), 827–56. doi: 10.1016/j.cpr.2004.06.005. [DOI] [PubMed] [Google Scholar]
- Borries A.K., Verkes R.J., Bulten B.H., Cools R., Bruijn E.R. (2013). Feedback-related negativity codes outcome valence, but not outcome expectancy, during reversal learning. Cognitive, Affective, & Behavioral Neuroscience, 13(4), 737–46. doi: 10.3758/s13415-013-0150-1. [DOI] [PubMed] [Google Scholar]
- Brozovich F., Heimberg R.G. (2008). An analysis of post-event processing in social anxiety disorder. Clinical Psychology Review, 28(6), 891–903. doi: 10.1016/j.cpr.2008.01.002. [DOI] [PubMed] [Google Scholar]
- Buckner J.D., Maner J.K., Schmidt N.B. (2010). Difficulty disengaging attention from social threat in social anxiety. Cognitive Therapy and Research, 34(1), 99–105. doi: 10.1007/s10608-008-9205-y. [DOI] [PMC free article] [PubMed] [Google Scholar]
- Cao J., Gu R., Bi X., Zhu X., Wu H. (2015). Unexpected acceptance? Patients with social anxiety disorder manifest their social expectancy in ERPs during social feedback processing. Frontiers in Psychology, 6, 1745. doi: 10.3389/fpsyg.2015.01745. [DOI] [PMC free article] [PubMed] [Google Scholar]
- Cao J., Liu Q., Li Y., et al. (2017). Cognitive behavioural therapy attenuates the enhanced early facial stimuli processing in social anxiety disorders: an ERP investigation. Behavioral and Brain Functions, 13(1), 12. doi: 10.1186/s12993-017-0130-7. [DOI] [PMC free article] [PubMed] [Google Scholar]
- Caouette J.D., Ruiz S.K., Lee C.C., Anbari Z., Schriber R.A., Guyer A.E. (2015). Expectancy bias mediates the link between social anxiety and memory bias for social evaluation. Cognition & Emotion, 29(5), 945–53. doi: 10.1080/02699931.2014.960368. [DOI] [PMC free article] [PubMed] [Google Scholar]
- Cavanagh J.F., Frank M.J., Klein T.J., Allen J.J. (2010). Frontal theta links prediction errors to behavioral adaptation in reinforcement learning. NeuroImage, 49(4), 3198–209. doi: 10.1016/j.neuroimage.2009.11.080. [DOI] [PMC free article] [PubMed] [Google Scholar]
- Chase H.W., Swainson R., Durham L., Benham L., Cools R. (2011). Feedback-related negativity codes prediction error but not behavioral adjustment during probabilistic reversal learning. Journal of Cognitive Neuroscience, 23(4), 936–46. doi: 10.1162/jocn.2010.21456. [DOI] [PubMed] [Google Scholar]
- Cheval B., Boisgontier M.P., Bacelar M.F.B., Feiss R., Miller M.W. (2019). Opportunities to sit and stand trigger equivalent reward-related brain activity. International Journal of Psychophysiology, 141, 9–17. doi: 10.1016/j.ijpsycho.2019.04.009. [DOI] [PubMed] [Google Scholar]
- Clark V.P., Hillyard S.A. (1996). Spatial selective attention affects early extrastriate but not striate components of the visual evoked potential. Journal of Cognitive Neuroscience, 8(5), 387–402. doi: 10.1162/jocn.1996.8.5.387. [DOI] [PubMed] [Google Scholar]
- Clark D.M., McManus F. (2002). Information processing in social phobia. Biological Psychiatry, 51(1), 92–100. doi: 10.1016/S0006-3223(01)01296-3. [DOI] [PubMed] [Google Scholar]
- Cohen J. (1973). Eta-squared and partial eta-squared in fixed factor ANOVA designs. Educational and Psychological Measurement, 33(1), 107–12. doi: 10.1177/001316447303300111. [DOI] [Google Scholar]
- Coles M.E., Heimberg R.G. (2002). Memory biases in the anxiety disorders: current status. Clinical Psychology Review, 22(4), 587–627. doi: 10.1016/S0272-7358(01)00113-1. [DOI] [PubMed] [Google Scholar]
- Coles M.E., Heimberg R.G. (2005). Recognition bias for critical faces in social phobia: a replication and extension. Behaviour Research and Therapy, 43(1), 109–20. doi: 10.1016/j.brat.2003.12.001. [DOI] [PubMed] [Google Scholar]
- Cremers H.R., Veer I.M., Spinhoven P., Rombouts S.A., Roelofs K. (2014). Neural sensitivity to social reward and punishment anticipation in social anxiety disorder. Frontiers in Behavioral Neuroscience, 8, 439. doi: 10.3389/fnbeh.2014.00439. [DOI] [PMC free article] [PubMed] [Google Scholar]
- Creswell C., Murray L., Cooper P. (2014). Interpretation and expectation in childhood anxiety disorders: age effects and social specificity. Journal of Abnormal Child Psychology, 42(3), 453–65. doi: 10.1007/s10802-013-9795-z. [DOI] [PMC free article] [PubMed] [Google Scholar]
- Crome E., Grove R., Baillie A.J., Sunderland M., Teesson M., Slade T. (2015). DSM-IV and DSM-5 social anxiety disorder in the Australian community. The Australian and New Zealand Journal of Psychiatry, 49(3), 227–35. doi: 10.1177/0004867414546699. [DOI] [PMC free article] [PubMed] [Google Scholar]
- Dekkers L.M., Molen M.J.W., Gunther Moor B., Veen F.M., Molen M.W. (2015). Cardiac and electro-cortical concomitants of social feedback processing in women. Social Cognitive and Affective Neuroscience, 10(11), 1506–14. doi: 10.1093/scan/nsv039. [DOI] [PMC free article] [PubMed] [Google Scholar]
- DeWall C.N., Bushman B.J. (2011). Social acceptance and rejection: the sweet and the bitter. Current Directions in Psychological Science, 20(4), 256–60. doi: 10.1177/0963721411417545. [DOI] [Google Scholar]
- Donchin E., Coles M.G.H. (1988). Is the P300 component a manifestation of context updating? The Behavioral and Brain Sciences, 11(3), 355–72. doi: 10.1017/S0140525X00058027. [DOI] [Google Scholar]
- Downey G., Feldman S.I. (1996). Implications of rejection sensitivity for intimate relationships. Journal of Personality and Social Psychology, 70(6), 1327–43. doi: 10.1037/0022-3514.70.6.1327. [DOI] [PubMed] [Google Scholar]
- Eckblad M.L., Chapman L.J., Chapman J.P., Mishlove M. (1982). The Revised Social Anhedonia Scale. Unpublished Test Copies Available from, Champaign, IL: T.R. Kwapil. UIUC Department of Psychology. [Google Scholar]
- Faul F., Erdfelder E., Lang A.G., Buchner A. (2007). G*power 3: a flexible statistical power analysis program for the social, behavioral, and biomedical sciences. Behavior Research Methods, 39(2), 175–91. doi: 10.3758/BF03193146. [DOI] [PubMed] [Google Scholar]
- Faul F., Erdfelder E., Buchner A., Lang A.G. (2009). Statistical power analyses using G*power 3.1: tTests for correlation and regression analyses. Behavior Research Methods, 41(4), 1149–60. doi: 10.3758/BRM.41.4.1149. [DOI] [PubMed] [Google Scholar]
- Felmingham K.L., Stewart L.F., Kemp A.H., Carr A.R. (2016). The impact of high trait social anxiety on neural processing of facial emotion expressions in females. Biological Psychology, 117, 179–86. doi: 10.1016/j.biopsycho.2016.04.001. [DOI] [PubMed] [Google Scholar]
- Ferdinand N.K., Mecklinger A., Kray J., Gehring W.J. (2012). The processing of unexpected positive response outcomes in the mediofrontal cortex. Journal of Neuroscience, 32(35), 12087–92. doi: 10.1523/JNEUROSCI.1410-12.2012. [DOI] [PMC free article] [PubMed] [Google Scholar]
- First M.B., Spitzer R.L., Gibbon M., Williams J.B.W., Benjamin L. (1996). Structured Clinical Interview for DSM-IV Axis II Personality Disorders (SCID-II), New York, NY: Biometrics Research Department, New York State Psychiatric Institute. [Google Scholar]
- First M.B., Gibbon M., Spitzer R.L., Williams J.B.W. (2002). Structured Clinical Interview for DSM-IV-TR Axis I Disorders, Research Version, Non-Patient Edition (SCID-I/NP), Biometrics Research Department, New York State Psychiatric Institute: New York. NY. [Google Scholar]
- Fisher K., Towler J., Eimer M. (2016). Facial identity and facial expression are initially integrated at visual perceptual stages of face processing. Neuropsychologia, 80, 115–25. doi: 10.1016/j.neuropsychologia.2015.11.011. [DOI] [PubMed] [Google Scholar]
- Foti D., Weinberg A., Dien J., Hajcak G. (2011). Event-related potential activity in the basal ganglia differentiates rewards from nonrewards: temporospatial principal components analysis and source localization of the feedback negativity. Human Brain Mapping, 32(12), 2207–16. doi: 10.1002/hbm.21182. [DOI] [PMC free article] [PubMed] [Google Scholar]
- Garofalo S., Maier M.E., Pellegrino G. (2014). Mediofrontal negativity signals unexpected omission of aversive events. Scientific Reports, 4, 4816. doi: 10.1038/srep04816. [DOI] [PMC free article] [PubMed] [Google Scholar]
- Gehring W.J., Willoughby A.R. (2002). The medial frontal cortex and the rapid processing of monetary gains and losses. Science, 295(5563), 2279–82. doi: 10.1126/science.1066893. [DOI] [PubMed] [Google Scholar]
- Gelman A., Loken E. (2013). The garden of forking paths: why multiple comparisons can be a problem, even when there is no “fishing expedition” or “p-hacking” and the research hypothesis was posited ahead of time Department of Statistics. Columbia University; Retrieved fromhttp://www.stat.columbia.edu/~gelman/research/unpublished/forking.pdf [Google Scholar]
- Gilboa-Schechtman E., Foa E.B., Amir N. (1999). Attentional biases for facial expressions in social phobia: the face-in-the-crowd paradigm. Cognition & Emotion, 13(3), 305–18. doi: 10.1080/026999399379294. [DOI] [Google Scholar]
- Ginsburg G.S., La Greca A.M., Silverman W.K. (1998). Social anxiety in children with anxiety disorders: relation with social and emotional functioning. Journal of Abnormal Child Psychology, 26(3), 175–85. doi: 10.1023/a:1022668101048. [DOI] [PubMed] [Google Scholar]
- Goldin P.R., McRae K., Ramel W., Gross J.J. (2008). The neural bases of emotion regulation: reappraisal and suppression of negative emotion. Biological Psychiatry, 63(6), 577–86. doi: 10.1016/j.biopsych.2007.05.031. [DOI] [PMC free article] [PubMed] [Google Scholar]
- Goldin P.R., Manber-Ball T., Werner K., Heimberg R., Gross J.J. (2009). Neural mechanisms of cognitive reappraisal of negative self-beliefs in social anxiety disorder. Biological Psychiatry, 66(12), 1091–9. doi: 10.1016/j.biopsych.2009.07.014. [DOI] [PMC free article] [PubMed] [Google Scholar]
- Goldin P.R., Ziv M., Jazaieri H., et al. (2012). Cognitive reappraisal self-efficacy mediates the effects of individual cognitive-behavioral therapy for social anxiety disorder. Journal of Consulting and Clinical Psychology, 80(6), 1034–40. doi: 10.1037/a0028555. [DOI] [PMC free article] [PubMed] [Google Scholar]
- Grand K.F., Bruzi A.T., Dyke F.B., et al. (2015). Why self-controlled feedback enhances motor learning: answers from electroencephalography and indices of motivation. Human Movement Science, 43, 23–32. doi: 10.1016/j.humov.2015.06.013. [DOI] [PubMed] [Google Scholar]
- Grecucci A., Giorgetta C., Van't Wout M., Bonini N., Sanfey A.G. (2013). Reappraising the ultimatum: an fMRI study of emotion regulation and decision making. Cerebral Cortex, 23(2), 399–410. doi: 10.1093/cercor/bhs028. [DOI] [PubMed] [Google Scholar]
- Gross J.J., John O.P. (2003). Individual differences in two emotion regulation processes: implications for affect, relationships, and well-being. Journal of Experimental Social Psychology, 85(2), 348–62. doi: 10.1037/0022-3514.85.2.348. [DOI] [PubMed] [Google Scholar]
- Gu R., Jiang Y., Kiser S., Luo Y.J., Kelly T.H. (2017). Impulsive personality dimensions are associated with altered behavioral performance and neural responses in the monetary incentive delay task. Neuropsychologia, 103, 59–68. doi: 10.1016/j.neuropsychologia.2017.07.013. [DOI] [PMC free article] [PubMed] [Google Scholar]
- Guyer A.E., Lau J.Y., McClure-Tone E.B., et al. (2008). Amygdala and ventrolateral prefrontal cortex function during anticipated peer evaluation in pediatric social anxiety. Archives of General Psychiatry, 65(11), 1303–12. doi: 10.1001/archpsyc.65.11.1303. [DOI] [PMC free article] [PubMed] [Google Scholar]
- Hagemann J., Straube T., Schulz C. (2016). Too bad: bias for angry faces in social anxiety interferes with identity processing. Neuropsychologia, 84, 136–49. doi: 10.1016/j.neuropsychologia.2016.02.005. [DOI] [PubMed] [Google Scholar]
- Hajcak G., Moser J.S., Holroyd C.B., Simons R.F. (2007). It's worse than you thought: the feedback negativity and violations of reward prediction in gambling tasks. Psychophysiology, 44(6), 905–12. doi: 10.1111/j.1469-8986.2007.00567.x. [DOI] [PubMed] [Google Scholar]
- Hajcak G., MacNamara A., Olvet D.M. (2010). Event-related potentials, emotion, and emotion regulation: an integrative review. Developmental Neuropsychology, 35(2), 129–55. doi: 10.1080/87565640903526504. [DOI] [PubMed] [Google Scholar]
- Harrewijn A., Schmidt L.A., Westenberg P.M., Tang A., Molen M.J.W. (2017). Electrocortical measures of information processing biases in social anxiety disorder: a review. Biological Psychology, 129, 324–48. doi: 10.1016/j.biopsycho.2017.09.013. [DOI] [PubMed] [Google Scholar]
- Harrewijn A., Molen M.J.W., Vliet I.M., Tissier R.L.M., Westenberg P.M. (2018). Behavioral and EEG responses to social evaluation: a two-generation family study on social anxiety. Neuroimage: Clinical, 17, 549–62. doi: 10.1016/j.nicl.2017.11.010. [DOI] [PMC free article] [PubMed] [Google Scholar]
- Hauser T.U., Iannaccone R., Stämpfli P., et al. (2014). The feedback-related negativity (FRN) revisited: new insights into the localization, meaning and network organization. NeuroImage, 84, 159–68. doi: 10.1016/j.neuroimage.2013.08.028. [DOI] [PubMed] [Google Scholar]
- He Z., Zhang D., Muhlert N., Elliott R. (2019). Neural substrates for anticipation and consumption of social and monetary incentives in depression. Social Cognitive and Affective Neuroscience, 14(8), 815–26. doi: 10.1093/scan/nsz061. [DOI] [PMC free article] [PubMed] [Google Scholar]
- Healey K.L., Morgan J., Musselman S.C., Olino T.M., Forbes E.E. (2014). Social anhedonia and medial prefrontal response to mutual liking in late adolescents. Brain and Cognition, 89, 39–50. doi: 10.1016/j.bandc.2013.12.004. [DOI] [PMC free article] [PubMed] [Google Scholar]
- Heimberg R.G., Brozovich F.A., Rapee R.M. (2010). A cognitive behavioral model of social anxiety disorder: update and extension In: Hofmann S.G., DiBartolo P.M., editors. Social Anxiety: Clinical, Developmental, and Social Perspectives, 2nd edn, Academic Press, pp. 395–422. [Google Scholar]
- Heinrichs N., Hofmann S.G. (2001). Information processing in social phobia: a critical review. Clinical Psychology Review, 21(5), 751–70. doi: 10.1016/S0272-7358(00)00067-2. [DOI] [PubMed] [Google Scholar]
- Hinojosa J.A., Mercado F., Carretie L. (2015). N170 sensitivity to facial expression: a meta-analysis. Neuroscience and Biobehavioral Reviews, 55, 498–509. doi: 10.1016/j.neubiorev.2015.06.002. [DOI] [PubMed] [Google Scholar]
- Hirsch C.R., Clark D.M. (2004). Information-processing bias in social phobia. Clinical Psychology Review, 24(7), 799–825. doi: 10.1016/j.cpr.2004.07.005. [DOI] [PubMed] [Google Scholar]
- Holroyd C.B., Coles M.G.H. (2002). The neural basis of human error processing: reinforcement learning, dopamine, and the error-related negativity. Psychological Review, 109(4), 679–709. doi: 10.1037/0033-295X.109.4.679. [DOI] [PubMed] [Google Scholar]
- Holroyd C.B., Yeung N. (2012). Motivation of extended behaviors by anterior cingulate cortex. Trends in Cognitive Sciences, 16(2), 122–8. doi: 10.1016/j.tics.2011.12.008. [DOI] [PubMed] [Google Scholar]
- Holroyd C.B., Hajcak G., Larsen J.T. (2006). The good, the bad and the neutral: electrophysiological responses to feedback stimuli. Brain Research, 1105(1), 93–101. doi: 10.1016/j.brainres.2005.12.015. [DOI] [PubMed] [Google Scholar]
- Horley K., Williams L.M., Gonsalvez C., Gordon E. (2004). Face to face: visual scanpath evidence for abnormal processing of facial expressions in social phobia. Psychiatry Research, 127 (1–2), 43–53. doi: 10.1016/j.psychres.2004.02.016. [DOI] [PubMed] [Google Scholar]
- Ito T.A., Cacioppo J.T. (2000). Electrophysiological evidence of implicit and explicit categorization processes. Journal of Experimental Social Psychology, 36(6), 660–76. doi: 10.1006/jesp.2000.1430. [DOI] [Google Scholar]
- Johnston V.S., Miller D.R., Burleson M.H. (1986). Multiple P3s to emotional stimuli and their theoretical significance. Psychophysiology, 23(6), 684–94. doi: 10.1111/j.1469-8986.1986.tb00694.x. [DOI] [PubMed] [Google Scholar]
- Kashdan T.B. (2007). Social anxiety spectrum and diminished positive experiences: theoretical synthesis and meta-analysis. Clinical Psychology Review, 27(3), 348–65. doi: 10.1016/j.cpr.2006.12.003. [DOI] [PubMed] [Google Scholar]
- Keselman H.J., Keselman J.C. (1988). Repeated measures multiple comparison procedures: effects of violating multisample sphericity in unbalanced designs. Journal of Educational Statistics, 13(3), 215–26. doi: 10.3102/10769986013003215. [DOI] [Google Scholar]
- Kessler R.C., Petukhova M., Sampson N.A., Zaslavsky A.M., Wittchen H.U. (2012). Twelve-month and lifetime prevalence and lifetime morbid risk of anxiety and mood disorders in the United States. International Journal of Methods in Psychiatric Research, 21(3), 169–84. doi: 10.1002/mpr.1359. [DOI] [PMC free article] [PubMed] [Google Scholar]
- Killgore W.D., Yurgelun-Todd D.A. (2005). Social anxiety predicts amygdala activation in adolescents viewing fearful faces. Neuroreport, 16(15), 1671–5. doi: 10.1097/01.wnr.0000180143.99267.bd. [DOI] [PubMed] [Google Scholar]
- Kolassa I.T., Kolassa S., Musial F., Miltner W.H. (2007). Event-related potentials to schematic faces in social phobia. Cognition & Emotion, 21(8), 1721–44. doi: 10.1080/02699930701229189. [DOI] [Google Scholar]
- Kolassa I.T., Kolassa S., Bergmann S., et al. (2009). Interpretive bias in social phobia: an ERP study with morphed emotional schematic faces. Cognition & Emotion, 23(1), 69–95. doi: 10.1080/02699930801940461. [DOI] [Google Scholar]
- Kujawa A., Arfer K.B., Klein D.N., Proudfit G.H. (2014). Electrocortical reactivity to social feedback in youth: a pilot study of the island getaway task. Developmental Cognitive Neuroscience, 10, 140–7. doi: 10.1016/j.dcn.2014.08.008. [DOI] [PMC free article] [PubMed] [Google Scholar]
- Lam S., Dickerson S.S., Zoccola P.M., Zaldivar F. (2009). Emotion regulation and cortisol reactivity to a social-evaluative speech task. Psychoneuroendocrinology, 34(9), 1355–62. doi: 10.1016/j.psyneuen.2009.04.006. [DOI] [PubMed] [Google Scholar]
- Langston C.A., Cantor N. (1989). Social anxiety and social constraint: when making friends is hard. Journal of Personality and Social Psychology, 56(4), 649–61. doi: 10.1037/0022-3514.56.4.649. [DOI] [Google Scholar]
- Leichsenring F., Leweke F. (2017). Social anxiety disorder. New England Journal of Medicine, 376(23), 2255–64. doi: 10.1056/NEJMcp1614701. [DOI] [PubMed] [Google Scholar]
- Liebowitz M.R. (1987). Social phobia. Modern Problems of Pharmacopsychiatry, 22, 141–73. doi: 10.1159/000414022. [DOI] [PubMed] [Google Scholar]
- Luck S.J., Kappenman E.S. (2012). ERP components and selective attention In: Kappenman E.S., Luck S.J., editors. The Oxford Handbook of Event-Related Potential Components, New York, NY: Oxford University Press, pp. 295–327. [Google Scholar]
- Lust S.A., Bartholow B.D. (2009). Self-reported and P3 event-related potential evaluations of condoms: does what we say match how we feel? Psychophysiology, 46(2), 420–4. doi: 10.1111/j.1469-8986.2008.00775.x. [DOI] [PMC free article] [PubMed] [Google Scholar]
- Ma Q., Jin J., Meng L., Shen Q. (2014). The dark side of monetary incentive: how does extrinsic reward crowd out intrinsic motivation. Neuroreport, 25(3), 194–8. doi: 10.1097/WNR.0000000000000113. [DOI] [PubMed] [Google Scholar]
- Mangels J.A., Hoxha O., Lane S.P., Jarvis S.N., Downey G. (2018). Evidence that disrupted orienting to evaluative social feedback undermines error correction in rejection sensitive women. Social Neuroscience, 13(4), 451–70. doi: 10.1080/17470919.2017.1358210. [DOI] [PMC free article] [PubMed] [Google Scholar]
- Maoz K., Eldar S., Stoddard J., Pine D.S., Leibenluft E., Bar-Haim Y. (2016). Angry-happy interpretations of ambiguous faces in social anxiety disorder. Psychiatry Research, 241, 122–7. doi: 10.1016/j.psychres.2016.04.100. [DOI] [PubMed] [Google Scholar]
- Maurage P., Joassin F., Speth A., Modave J., Philippot P., Campanella S. (2012). Cerebral effects of binge drinking: respective influences of global alcohol intake and consumption pattern. Clinical Neurophysiology, 123(5), 892–901. doi: 10.1016/j.clinph.2011.09.018. [DOI] [PubMed] [Google Scholar]
- Meadows C.C., Gable P.A., Lohse K.R., Miller M.W. (2016). The effects of reward magnitude on reward processing: an averaged and single trial event-related potential study. Biological Psychology, 118, 154–60. doi: 10.1016/j.biopsycho.2016.06.002. [DOI] [PubMed] [Google Scholar]
- Memedovic S., Grisham J.R., Denson T.F., Moulds M.L. (2010). The effects of trait reappraisal and suppression on anger and blood pressure in response to provocation. Journal of Research in Personality, 44(4), 540–3. doi: 10.1016/j.jrp.2010.05.002. [DOI] [Google Scholar]
- Mendes W.B., Major B., McCoy S., Blascovich J. (2008). How attributional ambiguity shapes physiological and emotional responses to social rejection and acceptance. Journal of Personality and Social Psychology, 94(2), 278–91. doi: 10.1037/0022-3514.94.2.278. [DOI] [PMC free article] [PubMed] [Google Scholar]
- Mennin D.S., Fresco D.M., Heimberg R.G., Schneier F.R., Davies S.O., Liebowitz M.R. (2002). Screening for social anxiety disorder in the clinical setting: using the Liebowitz social anxiety scale. Journal of Affective Disorders, 16(6), 661–73. doi: 10.1016/S0887-6185(02)00134-2. [DOI] [PubMed] [Google Scholar]
- Messenger M., Onslow M., Packman A., Menzies R. (2004). Social anxiety in stuttering: measuring negative social expectancies. Journal of Fluency Disorders, 29(3), 201–12. doi: 10.1016/j.jfludis.2004.06.002. [DOI] [PubMed] [Google Scholar]
- Miltner W.H.R., Braun C.H., Coles M.G.H. (1997). Event-related brain potentials following incorrect feedback in a time-estimation task: evidence for a "generic" neural system for error detection. Journal of Cognitive Neuroscience, 9(6), 788–98. doi: 10.1162/jocn.1997.9.6.788. [DOI] [PubMed] [Google Scholar]
- Mitte K. (2008). Memory bias for threatening information in anxiety and anxiety disorders: a meta-analytic review. Psychological Bulletin, 134(6), 886–911. doi: 10.1037/a0013343. [DOI] [PubMed] [Google Scholar]
- Mogg K., Bradley B.P., Bono J., Painter M. (1997). Time course of attentional bias for threat information in non-clinical anxiety. Behaviour Research and Therapy, 35(4), 297–303. doi: 10.1016/S0005-7967(96)00109-X. [DOI] [PubMed] [Google Scholar]
- Mogg K., Philippot P., Bradley B.P. (2004). Selective attention to angry faces in clinical social phobia. Journal of Abnormal Psychology, 113(1), 160–5. doi: 10.1037/0021-843X.113.1.160. [DOI] [PubMed] [Google Scholar]
- Molen M.J.W., Dekkers L.M.S., Westenberg P.M., Veen F.M., Molen M.W. (2017). Why don't you like me? Midfrontal theta power in response to unexpected peer rejection feedback. NeuroImage, 146, 474–83. doi: 10.1016/j.neuroimage.2016.08.045. [DOI] [PubMed] [Google Scholar]
- Molen M.J.W., Harrewijn A., Westenberg P.M. (2018). Will they like me? Neural and behavioral responses to social-evaluative peer feedback in socially and non-socially anxious females. Biological Psychology, 135, 18–28. doi: 10.1016/j.biopsycho.2018.02.016. [DOI] [PubMed] [Google Scholar]
- Morrison A.S., Heimberg R.G. (2013). Social anxiety and social anxiety disorder. Annual Review of Clinical Psychology, 9, 249–74. doi: 10.1146/annurev-clinpsy-050212-185631. [DOI] [PubMed] [Google Scholar]
- Moser J.S., Huppert J.D., Duval E., Simons R.F. (2008). Face processing biases in social anxiety: an electrophysiological study. Biological Psychology, 78(1), 93–103. doi: 10.1016/j.biopsycho.2008.01.005. [DOI] [PubMed] [Google Scholar]
- Mueller E.M., Hofmann S.G., Santesso D.L., Meuret A.E., Bitran S., Pizzagalli D.A. (2009). Electrophysiological evidence of attentional biases in social anxiety disorder. Psychological Medicine, 39(7), 1141–52. doi: 10.1017/S0033291708004820. [DOI] [PMC free article] [PubMed] [Google Scholar]
- Neumann M.F., End A., Luttmann S., Schweinberger S.R., Wiese H. (2015). The own-age bias in face memory is unrelated to differences in attention—evidence from event-related potentials. Cognitive, Affective, & Behavioral Neuroscience, 15(1), 180–94. doi: 10.3758/s13415-014-0306-7. [DOI] [PubMed] [Google Scholar]
- Nieuwenhuis S., Holroyd C.B., Mol N., Coles M.G.H. (2004a). Reinforcement-related brain potentials from medial frontal cortex: origins and functional significance. Neuroscience & Biobehavioral Reviews, 28(4), 441–8. doi: 10.1016/j.neubiorev.2004.05.003. [DOI] [PubMed] [Google Scholar]
- Nieuwenhuis S., Yeung N., Holroyd C.B., Schurger A., Cohen J.D. (2004b). Sensitivity of electrophysiological activity from medial frontal cortex to utilitarian and performance feedback. Cerebral Cortex, 14(7), 741–7. doi: 10.1093/cercor/bhh034. [DOI] [PubMed] [Google Scholar]
- Nieuwenhuis S., Aston-Jones G., Cohen J.D. (2005). Decision making, the P3, and the locus coeruleus-norepinephrine system. Psychological Bulletin, 131(4), 510–32. doi: 10.1037/0033-2909.131.4.510. [DOI] [PubMed] [Google Scholar]
- Nosek B.A., Ebersole C.R., DeHaven A.C., Mellor D.T. (2018). The preregistration revolution. Proceedings of the National Academy of Sciences of the United States of America, 115(11), 2600–6. doi: 10.1073/pnas.1708274114. [DOI] [PMC free article] [PubMed] [Google Scholar]
- Osman A., Gutierrez P.M., Barrios F.X., Kopper B.A., Chiros C.E. (1998). The social phobia and social interaction anxiety scales: evaluation of psychometric properties. Journal of Psychopathology and Behavioral Assessment, 20(3), 249–64. doi: 10.1023/A:1023067302227. [DOI] [Google Scholar]
- Peer J.M., Roelofs K., Rotteveel M., Dijk J.G., Spinhoven P., Ridderinkhof K.R. (2007). The effects of cortisol administration on approach-avoidance behavior: an event-related potential study. Biological Psychology, 76(3), 135–46. doi: 10.1016/j.biopsycho.2007.07.003. [DOI] [PubMed] [Google Scholar]
- Peschard V., Philippot P., Joassin F., Rossignol M. (2013). The impact of the stimulus features and task instructions on facial processing in social anxiety: an ERP investigation. Biological Psychology, 93(1), 88–96. doi: 10.1016/j.biopsycho.2013.01.009. [DOI] [PubMed] [Google Scholar]
- Pfabigan D.M., Alexopoulos J., Bauer H., Sailer U. (2010). Manipulation of feedback expectancy and valence induces negative and positive reward prediction error signals manifest in event-related brain potentials. Psychophysiology, 48(5), 656–64. doi: 10.1111/j.1469-8986.2010.01136.x. [DOI] [PubMed] [Google Scholar]
- Picton T.W. (1992). The P300 wave of the human event-related potential. Journal of Clinical Neurophysiology, 9(4), 456–79. doi: 10.1097/00004691-199210000-00002. [DOI] [PubMed] [Google Scholar]
- Polezzi D., Sartori G., Rumiati R., Vidotto G., Daum I. (2010). Brain correlates of risky decision-making. NeuroImage, 49(2), 1886–94. doi: 10.1016/j.neuroimage.2009.08.068. [DOI] [PubMed] [Google Scholar]
- Polich J. (2007). Updating P300: an integrative theory of P3a and P3b. Clinical Neurophysiology, 118(10), 2128–48. doi: 10.1016/j.clinph.2007.04.019. [DOI] [PMC free article] [PubMed] [Google Scholar]
- Polich J., Criado J.R. (2006). Neuropsychology and neuropharmacology of P3a and P3b. International Journal of Psychophysiology, 60(2), 172–85. doi: 10.1016/j.ijpsycho.2005.12.012. [DOI] [PubMed] [Google Scholar]
- Powers K.E., Somerville L.H., Kelley W.M., Heatherton T.F. (2013). Rejection sensitivity polarizes striatal-medial prefrontal activity when anticipating social feedback. Journal of Cognitive Neuroscience, 25(11), 1887–95. doi: 10.1162/jocn_a_00446. [DOI] [PMC free article] [PubMed] [Google Scholar]
- Proudfit G.H. (2015). The reward positivity: from basic research on reward to a biomarker for depression. Psychophysiology, 52(4), 449–59. doi: 10.1111/psyp.12370. [DOI] [PubMed] [Google Scholar]
- Proudfit G.H., Bress J.N., Foti D., Kujawa A., Klein D.N. (2015). Depression and event-related potentials: emotional disengagement and reward insensitivity. Current Opinion in Psychology, 4, 110–3. doi: 10.1016/j.copsyc.2014.12.018. [DOI] [PMC free article] [PubMed] [Google Scholar]
- Qi Y., Gu R., Cao J., Bi X., Wu H., Liu X. (2017). Response bias-related impairment of early subjective face discrimination in social anxiety disorders: an event-related potential study. Journal of Anxiety Disorders, 47, 10–20. doi: 10.1016/j.janxdis.2017.02.003. [DOI] [PubMed] [Google Scholar]
- Ranta K., Kaltiala-Heino R., Rantanen P., Tuomisto M.T., Marttunen M. (2007). Screening social phobia in adolescents from general population: the validity of the social phobia inventory (SPIN) against a clinical interview. European Psychiatry, 22(4), 244–51. doi: 10.1016/j.eurpsy.2006.12.002. [DOI] [PubMed] [Google Scholar]
- Rapee R.M., Heimberg R.G. (1997). A cognitive-behavioral model of anxiety in social phobia. Behaviour Research and Therapy, 35(8), 741–56. doi: 10.1016/S0005-7967(97)00022-3. [DOI] [PubMed] [Google Scholar]
- Rapee R.M., Spence S.H. (2004). The etiology of social phobia: empirical evidence and an initial model. Clinical Psychology Review, 24(7), 737–67. doi: 10.1016/j.cpr.2004.06.004. [DOI] [PubMed] [Google Scholar]
- Remmerswaal D., Huijding J., Bouwmeester S., Brouwer M., Muris P. (2014). Cognitive bias in action: evidence for a reciprocal relation between confirmation bias and fear in children. Journal of Behavior Therapy and Experimental Psychiatry, 45(1), 26–32. doi: 10.1016/j.jbtep.2013.07.005. [DOI] [PubMed] [Google Scholar]
- Rosenberg M. (1965). Society and the Adolescent Self-Image, Princeton, NJ: Princeton University Press. [Google Scholar]
- Rossignol M., Anselme C., Vermeulen N., Philippot P., Campanella S. (2007). Categorical perception of anger and disgust facial expression is affected by non-clinical social anxiety: an ERP study. Brain Research, 1132(1), 166–76. doi: 10.1016/j.brainres.2006.11.036. [DOI] [PubMed] [Google Scholar]
- Rossignol M., Campanella S., Maurage P., Heeren A., Falbo L., Philippot P. (2012). Enhanced perceptual responses during visual processing of facial stimuli in young socially anxious individuals. Neuroscience Letters, 526(1), 68–73. doi: 10.1016/j.neulet.2012.07.045. [DOI] [PubMed] [Google Scholar]
- Rossignol M., Fisch S.A., Maurage P., Joassin F., Philippot P. (2013). Reduced processing of facial and postural cues in social anxiety: insights from electrophysiology. PLoS One, 8(9), e75234. doi: 10.1371/journal.pone.0075234. [DOI] [PMC free article] [PubMed] [Google Scholar]
- Rossion B., Jacques C. (2008). Does physical interstimulus variance account for early electrophysiological face sensitive responses in the human brain? Ten lessons on the N170. NeuroImage, 39(4), 1959–79. doi: 10.1016/j.neuroimage.2007.10.011. [DOI] [PubMed] [Google Scholar]
- Ruff C.C., Fehr E. (2014). The neurobiology of rewards and values in social decision making. Nature Reviews Neuroscience, 15(8), 549–62. doi: 10.1038/nrn3776. [DOI] [PubMed] [Google Scholar]
- Ruscio A.M., Brown T.A., Chiu W.T., Sareen J., Stein M.B., Kessler R.C. (2008). Social fears and social phobia in the USA: results from the National Comorbidity Survey Replication. Psychological Medicine, 38(1), 15–28. doi: 10.1017/S0033291707001699. [DOI] [PMC free article] [PubMed] [Google Scholar]
- Rytwinski N.K., Fresco D.M., Heimberg R.G., et al. (2009). Screening for social anxiety disorder with the self-report version of the Liebowitz social anxiety scale. Depression and Anxiety, 26(1), 34–8. doi: 10.1002/da.20503. [DOI] [PubMed] [Google Scholar]
- Sambrook T.D., Goslin J. (2014). Mediofrontal event-related potentials in response to positive, negative and unsigned prediction errors. Neuropsychologia, 61C, 1–10. doi: 10.1016/j.neuropsychologia.2014.06.004. [DOI] [PubMed] [Google Scholar]
- San Martín R. (2012). Event-related potential studies of outcome processing and feedback-guided learning. Frontiers in Human Neuroscience, 6, 304. doi: 10.3389/fnhum.2012.00304. [DOI] [PMC free article] [PubMed] [Google Scholar]
- Sarlo M., Buodo G., Devigili A., Munafo M., Palomba D. (2011). Emotional sensitization highlights the attentional bias in blood-injection-injury phobics: an ERP study. Neuroscience Letters, 490(1), 11–5. doi: 10.1016/j.neulet.2010.12.016. [DOI] [PubMed] [Google Scholar]
- Schmitz J., Scheel C.N., Rigon A., Gross J.J., Blechert J. (2012). You don't like me, do you? Enhanced ERP responses to averted eye gaze in social anxiety. Biological Psychology, 91(2), 263–9. doi: 10.1016/j.biopsycho.2012.07.004. [DOI] [PubMed] [Google Scholar]
- Sewell C., Palermo R., Atkinson C., McArthur G. (2008). Anxiety and the neural processing of threat in faces. Neuroreport, 19(13), 1339–43. doi: 10.1097/WNR.0b013e32830baadf. [DOI] [PubMed] [Google Scholar]
- Somerville L.H., Heatherton T.F., Kelley W.M. (2006). Anterior cingulate cortex responds differentially to expectancy violation and social rejection. Nature Neuroscience, 9(8), 1007–8. doi: 10.1038/nn1728. [DOI] [PubMed] [Google Scholar]
- Somerville L.H., Kelley W.M., Heatherton T.F. (2010). Self-esteem modulates medial prefrontal cortical responses to evaluative social feedback. Cerebral Cortex, 20(12), 3005–13. doi: 10.1093/cercor/bhq049. [DOI] [PMC free article] [PubMed] [Google Scholar]
- Spence S.H., Donovan C., Brechman-Toussaint M. (1999). Social skills, social outcomes, and cognitive features of childhood social phobia. Journal of Abnormal Psychology, 108(2), 211–21. doi: 10.1037/0021-843X.108.2.211. [DOI] [PubMed] [Google Scholar]
- Spielberger C.D., Gorsuch R.L., Lushene R., Vagg P.R., Jacobs G.A. (1983). Manual for the State-Trait Anxiety Inventory, Palo Alto, CA: Consulting Psychologist Press. [Google Scholar]
- Staugaard S.R. (2010). Threatening faces and social anxiety: a literature review. Clinical Psychology Review, 30(6), 669–90. doi: 10.1016/j.cpr.2010.05.001. [DOI] [PubMed] [Google Scholar]
- Stein M.B., Stein D.J. (2008). Social anxiety disorder. Lancet, 371(9618), 1115–25. doi: 10.1016/S0140-6736(08)60488-2. [DOI] [PubMed] [Google Scholar]
- Stevens J.R. (2017). Replicability and reproducibility in comparative psychology. Frontiers in Psychology, 8, 862. doi: 10.3389/fpsyg.2017.00862. [DOI] [PMC free article] [PubMed] [Google Scholar]
- Stirling L.J., Eley T.C., Clark D.M. (2006). Preliminary evidence for an association between social anxiety symptoms and avoidance of negative faces in school-age children. Journal of Clinical Child and Adolescent Psychology, 35(3), 431–9. doi: 10.1207/s15374424jccp3503_9. [DOI] [PubMed] [Google Scholar]
- Sun S., Yu R. (2014). The feedback related negativity encodes both social rejection and explicit social expectancy violation. Frontiers in Human Neuroscience, 8, 556. doi: 10.3389/fnhum.2014.00556. [DOI] [PMC free article] [PubMed] [Google Scholar]
- Suzuki Y., Galli L., Ikeda A., Itakura S., Kitazaki M. (2015). Measuring empathy for human and robot hand pain using electroencephalography. Scientific Reports, 5, 15924. doi: 10.1038/srep15924. [DOI] [PMC free article] [PubMed] [Google Scholar]
- Talmi D., Atkinson R., El-Deredy W. (2013). The feedback-related negativity signals salience prediction errors, not reward prediction errors. Journal of Neuroscience, 33(19), 8264–9. doi: 10.1523/JNEUROSCI.5695-12.2013. [DOI] [PMC free article] [PubMed] [Google Scholar]
- Tomberg C., Weinberg H., Vrba J., Tcheung T. (2005). Paradoxical scalp lateralization of the P100 cognitive somatic potential in humans: a magnetic field study. Neuroscience Letters, 391(1–2), 68–70. doi: 10.1016/j.neulet.2005.08.035. [DOI] [PubMed] [Google Scholar]
- Van der Molen M.J.W., Poppelaars E.S., Van Hartingsveldt C.T., Harrewijn A., Gunther Moor B., Westenberg P.M. (2014). Fear of negative evaluation modulates electrocortical and behavioral responses when anticipating social evaluative feedback. Frontiers in Human Neuroscience, 7, 936. doi: 10.3389/fnhum.2013.00936. [DOI] [PMC free article] [PubMed] [Google Scholar]
- Vazire S. (2016). Editorial. Social Psychological and Personality Science, 7(1), 3–7. doi: 10.1177/1948550615603955. [DOI] [Google Scholar]
- Veen V., Cohen J.D., Botvinick M.M., Stenger V.A., Carter C.S. (2001). Anterior cingulate cortex, conflict monitoring, and levels of processing. NeuroImage, 14(6), 1302–8. doi: 10.1006/nimg.2001.0923. [DOI] [PubMed] [Google Scholar]
- Veen F.M., Molen M.W., Sahibdin P.P., Franken I.H. (2014). The heart-break of social rejection versus the brain wave of social acceptance. Social Cognitive and Affective Neuroscience, 9(9), 1346–51. doi: 10.1093/scan/nst120. [DOI] [PMC free article] [PubMed] [Google Scholar]
- Veen F.M., Molen M.J.W., Molen M.W., Franken I.H. (2016). Thumbs up or thumbs down? Effects of neuroticism and depressive symptoms on psychophysiological responses to social evaluation in healthy students. Cognitive, Affective, & Behavioral Neuroscience, 16(5), 836–47. doi: 10.3758/s13415-016-0435-2. [DOI] [PMC free article] [PubMed] [Google Scholar]
- Via E., Soriano-Mas C., Sanchez I., et al. (2015). Abnormal social reward responses in anorexia nervosa: an fMRI study. PLoS One, 10(7), e0133539. doi: 10.1371/journal.pone.0133539. [DOI] [PMC free article] [PubMed] [Google Scholar]
- Vossen S., Ham J., Midden C. (2010). What makes social feedback from a robot work? Disentangling the effect of speech, physical appearance and evaluation In: Ploug T., Hasle P., Oinas-Kukkonen H., editors. PERSUASIVE: 5th International Conference on Persuasive Technology, Berlin, Heidelberg: Springer, pp. 52–7. [Google Scholar]
- Walsh M.M., Anderson J.R. (2012). Learning from experience: event-related potential correlates of reward processing, neural adaptation, and behavioral choice. Neuroscience & Biobehavioral Reviews, 36(8), 1870–84. doi: 10.1016/j.neubiorev.2012.05.008. [DOI] [PMC free article] [PubMed] [Google Scholar]
- Weinberg A., Hilgard J., Bartholow B.D., Hajcak G. (2012). Emotional targets: evaluative categorization as a function of context and content. International Journal of Psychophysiology, 84(2), 149–54. doi: 10.1016/j.ijpsycho.2012.01.023. [DOI] [PubMed] [Google Scholar]
- Wieser M.J., Moscovitch D.A. (2015). The effect of affective context on visuocortical processing of neutral faces in social anxiety. Frontiers in Psychology, 6, 1824. doi: 10.3389/fpsyg.2015.01824. [DOI] [PMC free article] [PubMed] [Google Scholar]
- Wilhelm R.A., Miller M.W., Gable P.A. (2019). Neural and attentional correlates of intrinsic motivation resulting from social performance expectancy. Neuroscience, 416, 137–46. doi: 10.1016/j.neuroscience.2019.07.039. [DOI] [PubMed] [Google Scholar]
- Windmann S., Urbach T.P., Kutas M. (2002). Cognitive and neural mechanisms of decision biases in recognition memory. Cerebral Cortex, 12(8), 808–17. doi: 10.1093/cercor/12.8.808. [DOI] [PubMed] [Google Scholar]
- Wu T., Luo Y., Broster L.S., Gu R., Luo Y.J. (2013). The impact of anxiety on social decision-making: behavioral and electrodermal findings. Social Neuroscience, 8(1), 11–21. doi: 10.1080/17470919.2012.694372. [DOI] [PMC free article] [PubMed] [Google Scholar]
- Wu L., Gu R., Cai H., Zhang J. (2016). Electrophysiological evidence for executive control and efficient categorization involved in implicit self-evaluation. Social Neuroscience, 11(2), 153–63. doi: 10.1080/17470919.2015.1044673. [DOI] [PubMed] [Google Scholar]
- Yang Z., Sedikides C., Gu R., Luo Y.L.L., Wang Y., Cai H. (2018). Narcissism and risky decisions: a neurophysiological approach. Social Cognitive and Affective Neuroscience, 13(8), 889–97. doi: 10.1093/scan/nsy053. [DOI] [PMC free article] [PubMed] [Google Scholar]
- Yeung N., Cohen J.D. (2006). The impact of cognitive deficits on conflict monitoring: predictable dissociations between the error-related negativity and N2. Psychological Science, 17(2), 164–71. doi: 10.1111/j.1467-9280.2006.01680.x. [DOI] [PubMed] [Google Scholar]
- Yuan B., Wang Y., Roberts K., Valadez E., Yin J., Li W. (2019). An electrophysiological index of outcome evaluation that may influence subsequent cooperation and aggression strategies. Social Neuroscience, 14(4), 420–33. doi: 10.1080/17470919.2018.1488766. [DOI] [PubMed] [Google Scholar]
Associated Data
This section collects any data citations, data availability statements, or supplementary materials included in this article.
Data Availability Statement
The data and code of this study would be available upon reasonable request and with approvals of School of Psychology, Shenzhen University. More information on making this request can be obtained from the corresponding author, Prof. Dandan Zhang (zhangdd05@gmail.com).