Abstract
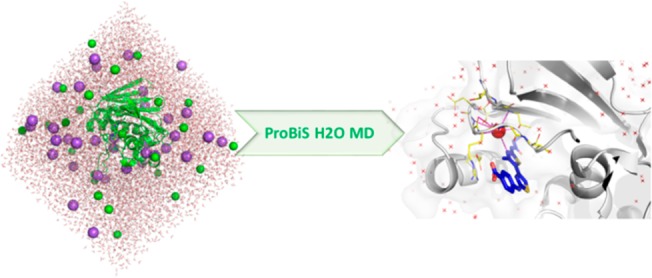
The ProBiS H2O MD approach for identification of conserved waters and water sites of interest in macromolecular systems, which is becoming a typical step in a structure-based drug design or macromolecular study in general, is described. This work explores an extension of the ProBiS H2O approach introduced by Jukič et al. Indeed, water molecules are key players in the interaction mechanisms of macromolecules and small molecules and play structural roles. Our earlier developed approach, ProBiS H2O, is a simple and transparent workflow for conserved water detection. Here we have considered generalizing the idea by supplementing the experimental data with data derived from molecular dynamics to facilitate work on less known systems. Newly developed ProBiS H2O MD workflow uses trajectory data, extracts and identifies interesting water sites, and visualizes the results. ProBiS H2O MD can thus robustly process molecular dynamic trajectory snapshots, perform local superpositions, collect water location data, and perform density-based clustering to identify discrete sites with high conservation of water molecules. This is a new approach that uses experimental data in silico to identify interesting water sites. Methodology is fast and water-model or molecular dynamics software independent. Trends in the conservation of water molecules can be followed over a variety of trajectories, and our approach has been successfully validated using reported protein systems with experimentally observed conserved water molecules. ProBiS H2O MD is freely available as PyMOL plugin at http://insilab.org.
Keywords: ProBiS, conserved water molecules, molecular dynamics, water clustering, in silico drug design, water site identification
Identification of conserved waters in macromolecular structures is becoming a key step in medicinal chemistry and structural biochemistry research.1 Conserved waters are contributors to hydrogen bonding networks between targets and their ligands as reviewed by Kubinyi et al.2 To generalize, water plays a structural role in macromolecules and their interfaces, is a catalyst and a proton mediator, as well as enables molecular recognition.3 It has already been established that the study of conserved water molecules is of utmost importance, as we described in our previous work on ProBiS H2O, however to additionally grasp the body of available methods in the field of water analysis today, a brief review is provided in the Supporting Information.4−6
In the context of available methods, we report a generalization of our previous approach.4 The new ProBiS H2O MD approach in contrast to the previous, which used RCSB PDB deposited experimental crystal data to identify conserved water sites by local superimposition of similar protein structures and water density-clustering analysis,4 exploits MD trajectories and uses explicit water molecules. As it was shown previously, MD can be a valuable source of water location data and can be successfully applied toward water analysis.7−10 We thus extended our approach to include trajectory data as an input and devised a water density analysis optimization algorithm for analysis of the obtained results. ProBiS H2O MD workflow is designed to take advantage of user supplied trajectories in selected PDB-formatted snapshots (Figure 1). Based on a max-clique algorithm, a local superimposition is performed and transposed water location data gathered.11 After the clustering, a conservation score is assigned to individual clusters and the result displayed. ProBiS H2O MD is implemented as a PyMOL (version 1.x and 2.x) plugin.
Figure 1.

ProBiS H2O MD algorithm where user conducts an MD study and makes a selection of trajectory snapshots to be processed by ProBiS H2O MD. Software consecutively collects the water data and performs DB SCAN clustering. In order to provide the user with a relative snapshot conservation span, clustering optimization by trimming the ε value of DB SCAN is performed and, ultimately, water sites of interest identified. User is encouraged to supplement the study with experimental structures (if available) or perform the study on an MD replicate or on a different density of snapshots in order to confirm the observations.
Selection of protein structures to be analyzed can be performed by the PDB ID entry with corresponding precalculated blastclust sequence clusters available at the PDB Web site or using custom query with custom-defined clusters.12 Now a user can select a custom query structure used for the MD experiment and a series of pdb-formatted snapshots from their MD trajectory, including all explicit molecules in the system—namely water molecules being aware of the water models currently in use. These are HOH, SPC, T3P,and T4P, which can be supplemented with additional models. This body of structures will be locally superimposed and provide water location data for the next steps. Alternatively, a complete user-selected series of macromolecular systems can be used in place of MD trajectory snapshot selections.
Protein structures are then locally superimposed on the query using the ProBiS algorithm that identifies the most common subsurface of both compared structures using a max clique algorithm.13 Crucial local superimposition conveniently circumvents both global-alignment and protein conformation problems as users select the focus analysis point,14,15 with a focus point being a whole chain, specific active site (4 Å larger than its extreme borders), or any water molecule in the system. All possible active sites are automatically parsed by the ProBiS H2O MD plugin and presented to the user that selects a site and performs analysis around the selection.
Transposed water molecules to the query are then examined for displacement conservation relative to all examined and transposed protein structures. The key postulation is that a single water molecule or a water molecule with great mobility during the MD experiment is probably bulk water while a dense cluster of waters in a specific defined space during the trajectory realization indicates a conserved water site or a water molecule site of interest. Herein, specific key interactions could be made by waters toward macromolecule(s), small molecule(s), and other waters and should be examined further. To this end, the Three Dimensional Density Based Spatial Clustering of Applications with Noise (3DDBSCAN) algorithm is implemented.16 3D-DBSCAN enables potentially lightning-fast identification of water-dense clusters and fast iteration. In comparison to superimposing RCSB PDB experimental similar systems, MD derived snapshots possess a greater density of water molecules. Namely, water density 0.997 g/mL at T = 298 K for an MD experiment translates to approximately 170 water molecules (TIP3P water model) per 20 Å3 but other water models can also be used. Therefore, a default epsilon (ε) parameter of 0.9 in 3D-DBSCAN cannot always discriminate between more and less occupied clusters in the whole structure set. We normally strive to identify the most spatially conserved regions in the context of less-conserved regions so that we can triage the importance of specific water sites. Therefore, we implemented a user selectable optimization in an iterative 3D-DBSCAN clustering approach where the ε parameter is adjusted, i.e. the cluster sphere radius diminished, until discrimination between high- and low-conserved water site clusters is achieved (Algorithm 1). In essence, this is performed by identification of the waters present in most spatially constrained clusters defined as spheres (Figure 2).
Figure 2.

Conserved cluster identification algorithm. The count of the most conserved clusters is modified by adjusting the cluster sphere size, thereby identifying the spatially most constrained water molecules.
While number of cluster groups with (conservation = 1) > 1:
-
1.
Calculate cluster groups: Nε(p):{q|d(p, q) ≤ ε}
-
2.
Reduce the radius of ε by 0.05
-
3.
Return number of clusters groups with all conservation levels.
Algorithm 1: ε–neighborhood with objects (p, q) within a radius ε from an object; n–number of data points where n parameter is gradually increased from 1 indicating random water molecules, to N, where N is the number of superimposed chains; clusters are dense spatial regions defined as a maximal set of density connected points separated by a lower density space..
Similarly as reported in our previous work, the clustering calculation is iterated until no additional clusters can be identified, and all possible densities have been examined.4
Usage and Analysis
The user first adds the plugin to their PyMol installation of choice and upon its first usage sets up the software as described in the Supporting Information (Figure S1). The user can now input a custom structure or MD starting trajectory snapshot in pdb format and select a series of MD trajectory snapshots in pdb format to be applied for conserved water site study (Figure 3; “custom” and “MD traj” buttons).
Figure 3.
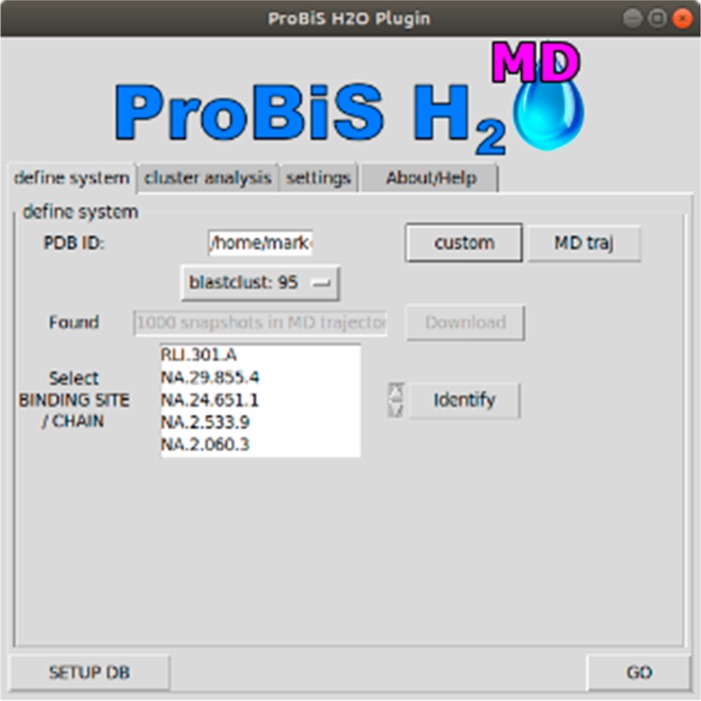
ProBiS H2O MD PyMol plugin implementation. ProBiS H2O MD logo, reproduced with permission from logo author Marko Jukič.
After the calculation is complete, the user is presented with a color-coded list of identified water clusters sorted by their conservation (e.g., number of water molecules in identified cluster/superimposed protein chains).17
Examples
To generate the data for conserved water site identification, molecular dynamics (MD) simulation was employed and trajectories exported as pdb snapshots using Schrödinger (Small molecule discovery suite - SMD, 2018-3) and Yasara Structure standard protocols as described in the Supporting Information.8,18 Published experimental crystal complexes were used as starting complexes (RCSB PDB Database).
Key Water in Bound Ligand
The ProBiS H2O MD approach was validated and applied in the identification of a conserved water molecule at the ATP-binding site of the DNA Gyrase B (PDB ID: 4DUH) (Figure 4) where this key water molecule enables a favorable active conformation of a bound ligand. After the system preparation in Desmond, a 10 ns MD production run was performed for chain B with pdb snapshots recorded in 10 ps intervals. After the snapshots were imported in ProBiS H2O MD plugin and water sites clustered, calculation yielded the most conserved water cluster with conservation of 0.98 that contained 985 water molecules and included the same key conserved water molecule as identified and used in identification of high-nanomolar (IC50 = 480 nM) inhibitor of DNA Gyrase B (Figure 4).19
Figure 4.
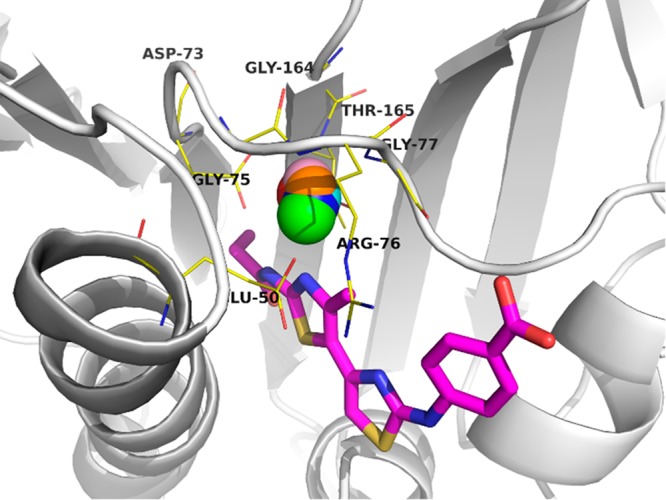
DNA Gyrase B (PDB ID: 4DUH). Protein is represented as a white-colored cartoon model with ligand in magenta-colored stick model (oxygen in red, nitrogen in blue, and sulfur in yellow). Key conserved water cluster identified from MD trajectory snapshots (10 ns, 1000 snapshots, SPC water model) is represented as a red sphere with a radius of 0.9 Å. Sphere is superposed by similar identified clusters from parallel MD experiments using different water models, namely TIP3P—blue sphere, and TIP4P—green sphere. Additional magenta, pink, and orange spheres demonstrate ProBiS H2O MD analysis using pdb snapshots every 1 ns (10 snapshots), 100 ps (100 snapshots), or 20 ps (500 snapshots), respectively.
Identified highly conserved water cluster resides in proximity to small-molecule ligand (4-{[4′-methyl-2′-(propanoylamino)-4,5′-bi-1,3-thiazol-2-yl]amino}benzoic acid) where it can effectively interact with ligand’s thiazole aromatic nitrogen and bridges toward Asp73, Thr165, or Gly77 residues. This result was corroborated with additional parallel MD experiments designed to inspect the influence of various 3- and 4-site water models (Table 1).
Table 1. Identification of Conserved Water Sites in DNA Gyrase B.
| entry | MD Experiment production timea | water model | cluster and distance from referenceb |
|---|---|---|---|
| 1 | D, 10 | SPC | 0.2 |
| 2 | D, 10 | TIP3P | 0.4 |
| 3 | D, 10 | TIP4P | 0.8 |
| 4 | D, 100 | SPC | 0.2 |
| 5 | D, 1 | SPC | 0.2 |
| 6 | Y, 10 | TIP3P | 0.6 |
D, Desmond; Y, Yasara; time in ns.
From the crystal (PDB id 4DUH) water molecule in the vicinity of Asp73 toward identified cluster center, in Å.
Indeed the same cluster was identified for all inspected water models (SPC, SPC/E, TIP3P, and TIP4P) with mobility of the cluster in the range below the cluster definition radius of 0.9 Å. (Figure 4). As the approach is intended to direct the user to the water site of interest to be further elaborated upon using other software, we believe that our approach offers straightforward water analysis and identification. Furthermore, to assess the robustness, additional ProBiS H2O MD calculations were performed by selective snapshot analysis from the same 10 ns production run using 1 ns (10 snapshots), 100 ps (100 snapshots), and 20 ps intervals (500 snapshots) evenly dispersed throughout the run. A similar water cluster was identified in the vicinity of Asp73 at the ATP binding site of DNA Gyrase B. Parallel MD experiments using short 1 ns (208 snapshots in 4.8 ps intervals) production runs as well as drawn-out production runs of 100 ns (1000 snapshots in 100 ps intervals) produced the previously observed highly conserved water cluster. To inspect the influence of protein chain used on the water clustering and conserved water site identification, MD experiments using 4DUH chain A were also performed yielding similar observations. The missing loop did not escape us, and the P5 loop (residues 109–116) was indeed modeled upon E. coli GyrB subunit A (PDB entry: 3G7E) for residue sequence template using Prime software.20 Side chain and main chain parameters were evaluated and the generated model additionally validated using PROCHECK software.21 The generated model was used in MD experiment (10 ns production run, SPC water model) to generate water location data. In this case also, a similar water cluster was identified by the ProBiS H2O MD approach.
We believe this method of water data generation should be software agnostic, and to asses this postulation, additional experiments were conducted using Yasara structure and WHAT IF.18 The setup of the 4DUH model in a periodic cube system (10 Å from protein extremes) included an optimization of the hydrogen bonding network and a pKa prediction to fine-tune the protonation states of protein residues at the chosen pH of 7.4.22 After steepest descent and simulated annealing minimizations, a simulation was run for 10 ns using the AMBER14 force field (nonbonding interactions cutoff radius = 8 Å) for the solute, GAFF, and AM1BCC for ligands and TIP3P water model.23−25 The experiment was performed at a temperature of 298 K and a pressure of 1 atm (NPT ensemble).18 1000 snapshots were exported in PDB format and analyzed by ProBiS H2O MD to substantiate the identification of a highly conserved water cluster in the vicinity of Asp73. All observed data indicate that the ProBiS H2O MD approach represents a robust, quick, and software independent approach for highlighting water sites of interest.
Ligands Displacing Key Water
Water molecules are crucial for ligand binding and can either enable ligand binding through H-bonds via water bridges or can make large entropic contributions to ligand binding by being displaced themselves into the bulk solvent during the ligand-target complex formation. Thus, water-informed structure-based design of a ligand that is able to displace high-energy water molecules can result in elevated affinity.26 Herein, therapeutically relevant target HIV-1 protease HIV1P (PDB ID: 1HN0) was used for an MD-derived water location study using the ProBiS H2O MD approach.27 Protease is a homodimer with 99 residues. Catalytic site is composed of two Asp25 residues, each originating from its own chain at the bottom of the ligand-binding active site interface. Past ligand design took the advantage of the Asp25 interface where the hydroxyl group of the active compound (e.g., approved drug Saquinavir) replaces a water molecule present in the transition state.28 A 10 ns MD production run in Desmond was performed for chain homodimer and pdb snapshots recorded in 10 ps intervals. Analysis of 1000 snapshots using ProBiS H2O MD afforded the top two key conserved water clusters, namely a cluster with conservation of 0.37 that contained 745 molecules within a sphere of 0.9 Å radius and a cluster with conservation of 0.26 with 518 molecules in a sphere with 0.9 Å radius. Both clusters define conserved water sites in close proximity or enclosed at the interface of both Asp25/Asp25′ residues (Figure 5).
Figure 5.
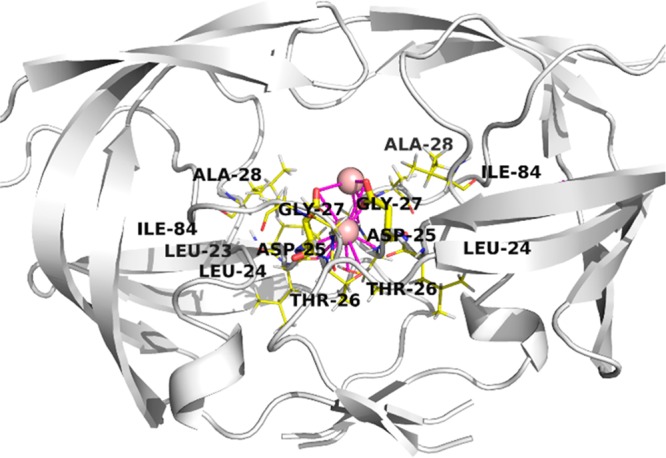
HIV1P protease (PDB ID: 1NH0). Protein is represented as a white-colored cartoon model with key binding site in yellow-colored stick model. Key conserved water clusters identified from MD trajectory snapshots (10 ns, 1000 snapshots, SPC water model) are represented as light-red spheres with a radius of 0.9 Å. Key Asp25/Asp25′ are depicted in thick stick model colored yellow. Atoms are color-coded (oxygen in red and nitrogen in blue).
The examined system spanned the volume of 96 976 Å3 (both chains used in analysis), and 10 481 238 water molecules were clustered using DBSCAN to identify the two key water sites near catalytic aspartic acid residues on the homodimer interface. HIV-1 protease inhibitors incorporating these water sites in the design benefited from favorable binding energies. Observations resulted in multiple registered drugs against HIV still in use nowadays.
Waters on Protein–Protein Interface
We examined the protein interface in human programmed death 1 receptor hPD-1 (PDB ID: 4ZQK) forming toward human PD-1 inhibitory receptor ligand hPD-L1. This oncologically relevant target is used for the development of small molecule inhibitors as well as antibodies that mimic hPD-1 or hPD-L1 surfaces. Herein waters favorably contribute to the hPD-1–hPD-L1 interface interaction, namely water between the amide nitrogen of Ile134, oxygen of Glu58 from hPD-1 and Tyr56 from hPD-L1 as well as between Asn66 from hPD-1 and carbonyl oxygen of Ala121 from hPD-L1.29 To generalize our approach, the 4ZQK system heterodimer (chain A and chain B) was used in MD experiment where a 10 ns production run was performed using Desmond software and PDB snapshots collected every 100 ps. Final clustering and analysis of protein interface with ProBiS H2O MD correctly identified both key water clusters with conservation of 0,21 that contribute toward protein interface formation. The first water cluster is sandwiched between Thr127 (ligand) and Asn74 (receptor) while the second cluster resides in a proximity of Gly120, Asp122 (ligand), and Lys78 (receptor). An additional water surrounded by Glu60, Arg113, and Val111 on the ligand was also identified and could prove to be important in ligand conformation stabilization upon binding. If the conservation level was decreased to 0.18, a third key water cluster between Ile134 and Glu58 from (hPD-1) and Tyr56 (hPD-L1) was also found. Identified clusters are presented in Figure 6 where discrete water clusters were also experimentally reported. Therefore, in the analysis of large molecules ProBiS H2O MD proves to be a useful tool, providing additional data by using on-hand MD trajectory water data.
Figure 6.
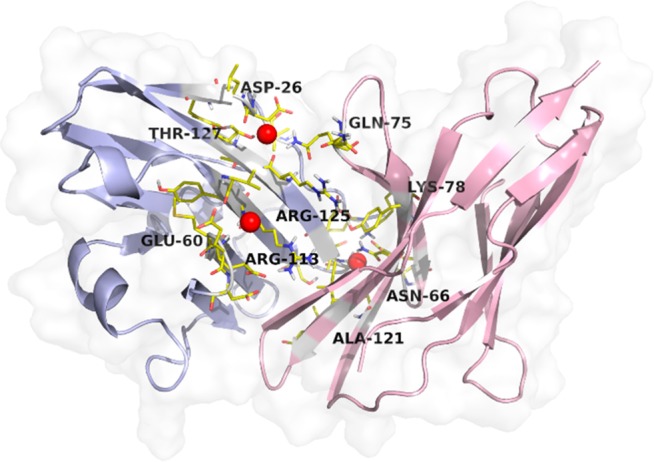
Human programmed death 1 receptor hPD-1 and human PD-1 inhibitory receptor ligand hPD-L1 (PDB ID: 4ZQK). Ligand is represented as a light blue cartoon model with key water interacting residues in yellow stick model; receptor is analogously represented in light pink. Key conserved water clusters identified from MD trajectory snapshots are depicted as red spheres with a radius of 0.9 Å.
Conclusion
Water analysis in medicinal chemistry and structural biology already demonstrated its usefulness in structure based drug design, either of small molecules or biological medicines.30 Tools are becoming available, and our previous contributions toward water analysis in drug design have been well-received. Now we report a generalization of our initial idea, namely the ProBiS H2O approach. The methodology can now employ MD-derived water location data in addition to experimental crystal clusters obtained from the RCSB PDB database. ProBiS H2O MD methodology can successfully identify conserved water sites and direct the user’s attention to potential sites of interest and is adaptable to a diversity of MD experimental techniques. Our approach is fast, simple, and robust as the calculations are started from an intuitive interface with a few clicks, concluded in minutes, and adaptable to various experimental MD conditions. Furthermore, the software can be used to examine systems with few or no cryptographic data on hand.31 Furthermore, the inclusion of additional water location data inputs opens the analysis to less-known systems or novel structures still not collected in the PDB database.
Acknowledgments
We gratefully acknowledge the support of NVIDIA Corporation with the donation of two Tesla K80, Tesla K40, and TITAN GPUs used for this research. We thank Rita Podzuna, Director at Schrödinger and Schrödinger LLC for support and Ole Tange for supercharging our linux (GNU Parallel - The Command-Line Power Tool; login: 2011, 36, 42-47).
Glossary
Abbreviations
- MD
molecular dynamics
- ProBiS
protein binding sites
- RISM
reference interaction site model
Supporting Information Available
The Supporting Information is available free of charge at https://pubs.acs.org/doi/10.1021/acsmedchemlett.9b00651.
Water analysis methodology review (PDF)
Author Contributions
The manuscript was written through contributions of all authors. All authors have given approval to the final version of the manuscript.
This work is supported by the Slovenian Research Agency project grants Z1-8158, J1-1715, J1-9186, and L7-8269 as well by the Slovenian Ministry of Science and Education infrastructure project grant HPC-RIVR.
The authors declare no competing financial interest.
Dedication
‡ This paper is dedicated to the memory of Professor Maurizio Botta, an excellent researcher and an exceptional colleague with whom we had long-standing fruitful collaboration.
Supplementary Material
References
- Poornima C. S.; Dean P. M. Hydration in Drug Design. 3. Conserved Water Molecules at the Ligand-Binding Sites Of Homologous Proteins. J. Comput.-Aided Mol. Des. 1995, 9, 521–531. 10.1007/BF00124323. [DOI] [PubMed] [Google Scholar]
- Kubinyi H. Hydrogen Bonding: The Last Mystery in Drug Design. Pharmacokinetic optimization in drug research 2001, 513–524. 10.1002/9783906390437.ch28. [DOI] [Google Scholar]
- Spyrakis F.; Ahmed M. H.; Bayden A. S.; Cozzini P.; Mozzarelli A.; Kellogg G. E. The Roles of Water in the Protein Matrix: A Largely Untapped Resource for Drug Discovery. J. Med. Chem. 2017, 60, 6781–6827. 10.1021/acs.jmedchem.7b00057. [DOI] [PubMed] [Google Scholar]
- Jukic M.; Konc J.; Gobec S.; Janezic D. Identification of Conserved Water Sites in Protein Structures for Drug Design. J. Chem. Inf. Model. 2017, 57, 3094–3103. 10.1021/acs.jcim.7b00443. [DOI] [PubMed] [Google Scholar]
- Bucher D.; Stouten P.; Triballeau N. Shedding light on important waters for drug design: simulations versus grid-based methods. J. Chem. Inf. Model. 2018, 58 (3), 692–699. 10.1021/acs.jcim.7b00642. [DOI] [PubMed] [Google Scholar]
- Bodnarchuk M. S.; Viner R.; Michel J.; Essex J. W. Strategies to Calculate Water Binding Free Energies in Protein-Ligand Complexes. J. Chem. Inf. Model. 2014, 54, 1623–1633. 10.1021/ci400674k. [DOI] [PubMed] [Google Scholar]
- Venkatakrishnan A. J.; Ma A. K.; Fonseca R.; Latorraca N. R.; Kelly B.; Betz R. M.; Asawa C.; Kobilka B. K.; Dror R. O. Diverse GPCRs exhibit conserved water networks for stabilization and activation. Proc. Natl. Acad. Sci. U. S. A. 2019, 116, 3288–3293. 10.1073/pnas.1809251116. [DOI] [PMC free article] [PubMed] [Google Scholar]
- Rudling A.; Orro A.; Carlsson J. Prediction of Ordered Water Molecules in Protein Binding Sites from Molecular Dynamics Simulations: The Impact of Ligand Binding on Hydration Networks. J. Chem. Inf. Model. 2018, 58, 350–361. 10.1021/acs.jcim.7b00520. [DOI] [PMC free article] [PubMed] [Google Scholar]
- Nguyen C. N.; Young T. K.; Gilson M. K. Grid inhomogeneous solvation theory: hydration structure and thermodynamics of the miniature receptor cucurbituril. J. Chem. Phys. 2012, 137, 044101. 10.1063/1.4733951. [DOI] [PMC free article] [PubMed] [Google Scholar]
- Kearney B. M.; Schwabe M.; Marcus K. C.; Roberts D. M.; Dechene M.; Swartz P.; Mattos C. DRoP: Automated detection of conserved solvent-binding sites on proteins. Proteins: Struct., Funct., Genet. 2020, 88, 1–14. 10.1002/prot.25781. [DOI] [PubMed] [Google Scholar]
- Konc J.; Janežič D. ProBiS Algorithm for Detection of Structurally Similar Protein Binding Sites by Local Structural Alignment. Bioinformatics 2010, 26, 1160–1168. 10.1093/bioinformatics/btq100. [DOI] [PMC free article] [PubMed] [Google Scholar]
- Altschul S. F.; Gish W.; Miller W.; Myers E. W.; Lipman D. J. Basic local alignment search tool. J. Mol. Biol. 1990, 215, 403–410. 10.1016/S0022-2836(05)80360-2. [DOI] [PubMed] [Google Scholar]
- Konc J.; Janezic D. An Improved Branch and Bound Algorithm for the Maximum Clique Problem. MATCH Commun. Math. Comput. Chem. 2007, 58, 569–590. [Google Scholar]
- Rocha J.; Segura J.; Wilson R. C.; Dasgupta S. Flexible structural protein alignment by a sequence of local transformations. Bioinformatics 2009, 25, 1625–1631. 10.1093/bioinformatics/btp296. [DOI] [PMC free article] [PubMed] [Google Scholar]
- Hasegawa H.; Holm L. Advances and pitfalls of protein structural alignment. Curr. Opin. Struct. Biol. 2009, 19, 341–348. 10.1016/j.sbi.2009.04.003. [DOI] [PubMed] [Google Scholar]
- Ester M.; Kriegel H.-P.; Sander J.; Xu X. A Density-Based Algorithm for Discovering Clusters in Large Spatial Databases With Noise. Proceedings of the Second International Conference on Knowledge Discovery and Data Mining 1996, 96, 226–231. [Google Scholar]
- Sander J.; Ester M.; Kriegel H. P.; Xu X. Density-Based Clustering in Spatial Databases: The Algorithm GDBSCAN and Its Application. Data. Min. knowl. Disc. 1998, 2, 169–194. 10.1023/A:1009745219419. [DOI] [Google Scholar]
- Krieger E.; Vriend G. New ways to boost molecular dynamics simulations. J. Comput. Chem. 2015, 36, 996–1007. 10.1002/jcc.23899. [DOI] [PMC free article] [PubMed] [Google Scholar]
- Jukič M.; Ilaš J.; Brvar M.; Kikelj D.; Cesar J.; Anderluh M. Linker-Switch Approach Towards New ATP Binding Site Inhibitors of DNA Gyrase B. Eur. J. Med. Chem. 2017, 125, 500–514. 10.1016/j.ejmech.2016.09.040. [DOI] [PubMed] [Google Scholar]
- Jacobson M. P.; Pincus D. L.; Rapp C. S.; Day T. J. F.; Honig B.; Shaw D. E.; Friesner R. A. A Hierarchical Approach to All-Atom Protein Loop Prediction. Proteins: Struct., Funct., Genet. 2004, 55, 351–367. 10.1002/prot.10613. [DOI] [PubMed] [Google Scholar]
- Laskowski R. A.; MacArthur M. W.; Moss D. S.; Thornton J. M. PROCHECK - a program to check the stereochemical quality of protein structures. J. Appl. Crystallogr. 1993, 26, 283–291. 10.1107/S0021889892009944. [DOI] [Google Scholar]
- Krieger E.; Dunbrack R. L. Jr; Hooft R. W.; Krieger B. Assignment of protonation states in proteins and ligands: combining pKa prediction with hydrogen bonding network optimization. Methods Mol. Biol. 2012, 819, 405–421. 10.1007/978-1-61779-465-0_25. [DOI] [PubMed] [Google Scholar]
- Maier J.; Martinez C.; Kasavajhala K.; Wickstrom L.; Hauser K.; Simmerling C. ff14SB: Improving the accuracy of protein side chain and backbone parameters from ff99SB. J. Chem. Theory Comput. 2015, 11, 3696–3713. 10.1021/acs.jctc.5b00255. [DOI] [PMC free article] [PubMed] [Google Scholar]
- Wang J.; Wolf R. M.; Caldwell J. W.; Kollman P. A.; Case D. A. Development and Testing of a General AMBER Force Field. J. Comput. Chem. 2004, 25, 1157–1174. 10.1002/jcc.20035. [DOI] [PubMed] [Google Scholar]
- Jakalian A.; Jack D. B.; Bayly C. I. Fast, efficient generation of high-quality atomic charges. AM1-BCC model: II. Parameterization and validation. J. Comput. Chem. 2002, 23, 1623–1641. 10.1002/jcc.10128. [DOI] [PubMed] [Google Scholar]
- Michel J.; Tirado-Rives J.; Jorgensen W. L. Energetics of displacing water molecules from protein binding sites: consequences for ligand optimization. J. Am. Chem. Soc. 2009, 131, 15403–15411. 10.1021/ja906058w. [DOI] [PMC free article] [PubMed] [Google Scholar]
- Li Z.; Lazaridis T. Thermodynamic Contributions of the Ordered Water Molecule in HIV-1 Protease. J. Am. Chem. Soc. 2003, 125, 6636–6637. 10.1021/ja0299203. [DOI] [PubMed] [Google Scholar]
- Ghosh A. K.; Osswald H. L.; Prato G. Recent Progress in the Development of HIV-1 Protease Inhibitors for the Treatment of HIV/AIDS. J. Med. Chem. 2016, 59, 5172–5208. 10.1021/acs.jmedchem.5b01697. [DOI] [PMC free article] [PubMed] [Google Scholar]
- Zak K. M.; Kitel R.; Przetocka S.; Golik P.; Guzik K.; Musielak B.; Dömling A.; Dubin G.; Holak T. A. Structure of the Complex of Human Programmed Death 1, PD-1, and Its Ligand PD-L1. Structure 2015, 23, 2341–2348. 10.1016/j.str.2015.09.010. [DOI] [PMC free article] [PubMed] [Google Scholar]
- de Beer S. B.; Vermeulen N. P.; Oostenbrink C. The Role of Water Molecules in Computational Drug Design. Curr. Top. Med. Chem. 2010, 10, 55–66. 10.2174/156802610790232288. [DOI] [PubMed] [Google Scholar]
- Mitusinska K.; Raczynska A.; Bzówka M.; Bagrowska W.; Góra A.. Applications of water molecules for analysis of macromolecule properties. Comput. Struct. Biotechnol. J. 2020, 18, 355. 10.1016/j.csbj.2020.02.001 [DOI] [PMC free article] [PubMed] [Google Scholar]
Associated Data
This section collects any data citations, data availability statements, or supplementary materials included in this article.


