

SUMMARY
Information flow through neural circuits often requires their organization into topographic maps, in which the positions of cell bodies and synaptic targets correspond. To understand how topographic map development is controlled, we examine the mechanism underlying targeting of vagus motor axons to the pharyngeal arches in zebrafish. We reveal that Retinoic Acid organizes topography by specifying anterior-posterior identity in vagus motor neurons. We then show that chemoattractant signaling between Hgf and Met is required for vagus innervation of the pharyngeal arches. Finally, we find that Retinoic Acid controls the spatiotemporal dynamics of Hgf/Met signaling to coordinate axon targeting with the developmental progression of the pharyngeal arches, and show that experimentally altering the timing of Hgf/Met signaling is sufficient to redirect axon targeting and disrupt the topographic map. These findings establish a mechanism of topographic map development in which the regulation of chemoattractant signaling in space and time guides axon targeting.
eTOC
Nervous system function requires that synaptic connections within neural circuits be precisely organized. Here, Isabella et al. examine the development of the intricately organized vagus nerve, and find that chemoattractant signaling dynamics are spatiotemporally coordinated between neurons and their target tissues to guide complex axon targeting decisions.
Graphical Abstract
INTRODUCTION
For information to be accurately transmitted through the complex cellular networks that comprise the nervous system, these networks must be extremely well organized. Many neural circuits are organized into topographic maps, in which the relative positions of neurons’ cell bodies correspond to the relative positions of their axons in the target field. Topographic organization maintains spatial information during transmission, and is crucial for coherent, accurate, and efficient information flow (Bednar, 2016; Cang and Feldheim, 2013; Chklovskii and Koulakov, 2004; Levine et al., 2012). Disruption of these maps can impair signal coordination and processing and, ultimately, behavior (Bargary and Mitchell, 2008; Sperry, 1943; Sürmeli et al., 2011). Although most neural circuits are topographically organized, in many cases we do not understand how these maps form.
Topographic innervation begins with the guidance of growing axons to appropriate target regions during development. The predominant model is one of spatial signaling, in which axons interpret spatially patterned attractive and/or repulsive cues to reach their targets (Sperry, 1963). A classic example of this model is the retinotopic map, in which corresponding gradients of Ephrin ligands and Eph receptors allow retinal axons to select their target sites in the optic tectum by seeking the optimal Eph-Ephrin signaling state (Triplett and Feldheim, 2012).
While retinal axon targeting relies purely on spatial cues, in some cases the timing of events is important to topographic map development (Eerdunfu et al., 2017; Kulkarni et al., 2016; Petrovic and Hummel, 2008; Takeuchi et al., 2010). For example, topographic mapping of mouse olfactory sensory neurons is instructed by the sequential projection of axons (Eerdunfu et al., 2017; Takeuchi et al., 2010). In this and other examples, temporal differences in targeting have been ascribed to the timing of neuronal birth. It is not clear how topography might be temporally regulated independently of birth timing differences, nor how changes in molecular communication between neurons and their targets are coordinated over time.
We recently identified a key role for developmental timing in the topography of the zebrafish vagus nerve, which functions independently of neuron birth timing (Barsh et al., 2017). The vagus nerve (cranial nerve X) carries sensory information from the pharynx, larynx, heart and viscera, and returns appropriate motor and parasympathetic innervation for control of speech, swallowing, heart rate, and digestion. In zebrafish, vagus motor neurons (mX neurons) form a discrete nucleus of a few hundred cells between 24 and 36 hours post fertilization (hpf). They extend axons in a large fascicle that projects anteriorly and then ventrally into the pharyngeal arch (PA) region (Fig. 1A). The nerve then splits into five branches, four of which innervate PAs 4, 5, 6, & 7 (branches 4, 5, 6, & 7), and one of which extends posteriorly toward the viscera (visceral branch) (Fig. 1A). Each mX neuron extends an axon into a single branch between 28 and 60 hpf (Barsh et al., 2017). The vagus motor nerve exhibits a conserved topography in fish and mammals, with more anterior neurons innervating more anterior branches and more posterior neurons innervating more posterior branches (Fig. 1B) (Barsh et al., 2017; Bieger and Hopkins, 1987; Morita and Finger, 1985). We previously found that mX neurons at different A-P positions extend axons and innervate their targets at different times, and that experimentally changing the timing of individual axon outgrowth is sufficient to override spatial cues and alter axon target selection (Barsh et al., 2017). Thus, mX neurons must integrate spatial and temporal cues to coordinate topographic axon targeting. However, we do not know the nature of these cues, their dynamics in space and time, or how they are coordinated between mX neurons and their targets to precisely guide targeting.
Figure 1: Spatiotemporal dynamics of vagus nerve branch development.

(A) Zebrafish vagus nerve structure. (A’) Enlarged view of boxed region. The five nerve branches are labeled.
(B) Vagus nerve topography. Anterior cells (yellow and green) innervate anterior branches. More posterior cells (blues) innervate more posterior branches.
(C)Time series of PA4–7 formation and innervation. PAs (magenta) form sequentially from anterior to posterior and are sequentially innervated by mX axons (green). Numbers: PAs. P: primordium. Arrowheads: axon branches.
(D) Quantification of PA formation and innervation timing represented in (C). Data represent mean ± SEM. N = 5–16 embryos/arch.
All images are lateral views with anterior to left. Scale bars = 50 μm.
Here, we examine the cell signaling dynamics within and between mX neurons and the PAs that regulate topographic axon targeting. We find that Retinoic Acid (RA) signaling in the posterior hindbrain directs axon target selection by providing A-P positional information to mX neurons. We then discover that the Met receptor and its ligand, Hgf, are the chemoattractant signaling system that guides mX axon targeting. We describe matching RA-regulated A→P wavefronts of met expression in the mX nucleus and hgf expression in the PAs. By experimentally manipulating the timing of Hgf/Met signaling, we reveal how the spatiotemporal regulation of chemoattraction controls topographic axon targeting. This work establishes a “temporal matching” mechanism in which neurons and their targets coordinate chemoattractant signaling in space and time to enable topographic map formation.
RESULTS
Spatiotemporal dynamics of pharyngeal arch formation and innervation
We previously identified a critical role for innervation timing in the formation of the vagus topographic map (Barsh et al., 2017). To elucidate the mechanisms that guide timing-dependent targeting, we first established a developmental timeline of the formation of PAs 4–7 and their innervation by mX neurons in embryos expressing TgBAC(tcf21:mcherry-NTR)pd108, a marker of PA muscle precursors (Nagelberg et al., 2015; Wang et al., 2015), and Tg(isl1:EGFPcaax)fh474, a marker of post-mitotic cranial motor neurons (Higashijima et al., 2000) (Fig. 1C). The PAs form by sequentially emerging from a posterior tcf21+ primordium-like domain with the following timing: PA4: 27 hpf; PA5: 30 hpf; PA6: 35 hpf (Fig. 1C–D). The timing of PA7 formation cannot be determined as it derives from what remains of the primordium after PA6 emerges. mX axons innervate the PAs sequentially with the following timing: PA4: 34 hpf; PA5: 41 hpf; PA6: 49 hpf; PA7: 54 hpf (Fig. 1C–D). These results provide a timeline with which to contextualize the timing of events reported in this study.
Retinoic Acid is a putative regulator of A-P vagus motor neuron identity
The A-P position of a neuron within the mX nucleus determines which branch it innervates, indicative of molecular identity differences along the A-P axis (Barsh et al., 2017). Further, altering the A-P position of a post-mitotic mX neuron is sufficient to change target selection, indicative of inductive signals along the A-P axis (Barsh et al., 2017). The signals that regulate mX identity, and how they control axon targeting, are not known. We reasoned that understanding the gene expression differences between anterior and posterior mX neurons would provide insight into how they select axon targets. To this end, we used Kaede photoconversion in Tg(isl1:Kaede)ch103 embryos to isolate anterior and posterior mX neurons at 28–30 hpf, shortly after the onset of axon formation (Fig. 2A), and performed RNA sequencing (RNAseq) of these populations. Anterior and posterior mX neurons have very similar transcriptomes; however, we identified several genes enriched in one population or the other (Fig. 2B). In validation of this approach, one of the significantly posteriorly-enriched genes it identified is hoxb5a, which we know is expressed only in posterior mX neurons (Fig. 2C) (Barsh et al., 2017).
Figure 2: Retinoic Acid is a putative regulator of A-P vagus motor neuron identity.

(A-B) Differential gene expression between anterior and posterior mX neurons.
(A) Representative anterior (A) and posterior (A’) photoconverted (magenta)mX nucleus regions collected for RNAseq analysis in (B).
(B) Volcano plot of RNAseq data indicating mRNAs enriched in anterior (left) or posterior (right) mX neurons. Dashed lines indicate significance threshold for a false discovery rate of 10% (y-axis) and a fold change of 1.5 (x-axis). Blue and red dots: significantly differentially expressed genes. Red dots: genes related to Retinoic Acid signaling.
(C-E) RNA In situ hybridization of selected genes (purple) identified in (B) in the mX nucleus (brown). hoxb5a (C) and dhrs3b (D) mRNAs are posteriorly enriched. crabplb (E) mRNA is anteriorly enriched.
(F) The retinoic acid-responsive RARE:GFP transgene (green) is expressed in posterior, but not anterior, mX neurons (magenta).
All images are lateral views with anterior to left. Scale bars = 50 μm.
Our results reveal the extrinsic signal that specifies A-P mX neuron identity. After filtering out genes with no expression in one population or the other, the five most significantly differentially expressed genes (highlighted in Fig. 2B) are related to retinoic acid (RA) signaling. Four of the five - hoxb1b, hoxb5a, hoxb6b, and dhrs3b, all posteriorly enriched - are transcriptional targets of RA (Chen et al., 2007; Kam et al., 2013; Kudoh et al., 2002; Oosterveen et al., 2003), suggesting that posterior mX neurons experience higher levels of RA than anterior mX neurons. Two of the five - crabp1b (anteriorly enriched) and dhrs3b - are believed to attenuate RA signaling (Cai et al., 2012; Feng et al., 2010; Kam et al., 2013). We validated the differential expression of dhrs3b and crabp1b with RNA in situ hybridization (ISH) (Fig. 2D–E). While it remains to be determined whether these individual genes impact vagus development, their differential expression suggested that RA may play a role in topographic mapping.
RA is a morphogen that controls A-P embryonic patterning, primarily through the transcriptional regulation of Hox genes (Nolte et al., 2019; Rhinn and Dolle, 2012). RA synthesized in paraxial mesoderm plays a crucial role in patterning the hindbrain (Moens and Prince, 2002; Nolte et al., 2019) and spinal motor neurons (Diez del Corral et al., 2003; Novitch et al., 2003). Although RA plays a late (post-24 hpf in zebrafish) role in some contexts(e.g. Uribe et al., 2017), its ability to specify A-P identity in the hindbrain is believed to be restricted to a critical window early in development (before 14 hpf in zebrafish) (Begemann and Meyer, 2001). It is therefore unclear whether RA can influence the A-P identity of mature vagus neurons. To address this question, we first visualized a direct reporter for RA signaling (Tg(12xrare-ef1a:EGFP)sk71) (Mark et al., 2004; Waxman and Yelon, 2011). Consistent with a role for RA in specifying A-P mX identity, RARE.GFP is detectable in the posterior but not the anterior of the vagus nucleus (Fig. 2F). Note that, due to differing sensitivities to RA, individual RA-responsive genes may have expression boundaries that lie anterior or posterior to the RARE.GFP boundary (Papalopulu et al., 1991).
Retinoic Acid controls axon target selection in mature vagus motor neurons
We hypothesize that RA specifies an aspect of posterior mX neuron identity which promotes targeting to posterior branches and/or prevents targeting to anterior branches. We therefore tested whether altering RA signaling can change mX axon target selection. We first examined mX axon targeting in cyp26a1rw716 mutant embryos, which are deficient in RA degradation and consequently experience an anterior expansion of RA signaling (Emoto et al., 2005; Hernandez et al., 2007). We used two complementary experiments to address the hypothesis that the increased RA levels experienced by anterior neurons in this condition would bias their axons towards more posterior branches.
First, using Tg(isl1:Kaede)ch103, we photoconverted the axons innervating PA4 or PA7 in wildtype and cyp26a1rw716 embryos and, after retrograde transport of photoconverted protein, we measured the locations of neurons innervating these branches in the mX nucleus (Fig. 3A). As predicted, we observed a significant anterior shift in the PA7-innervating territory in mutants (Fig. 3A–B). We also saw a smaller but unexpected posterior shift of the PA4-innervating domain (Fig. 3A,C). Consequently, in mutants we observed a great increase in overlap of the PA7-innervating territory with the PA4-innervating territory (22.9% in control, 74.7% in mutants). cyp26a1m716 also slightly shortens the mX nucleus (Fig. S1A).
Figure 3: Retinoic Acid controls axon target selection in vagus motor neurons, see also Supplementary Figure 1.

(A) PA4- and PA7-innervating regions of the mX nucleus determined by retrograde labeling.
(A) Method: red and green regions were outlined in individual embryos, all outlines were overlaid and averaged, and averages were overlaid for comparison. (A’) Overlaid individual outlines of PA4- and PA7-innervating regions in control and cyp26a1rw716 embryos. (A”) Overlaid average outlines. cyp26a1rw716 causes loss of separation between the PA4- and PA7-innervating regions of the mX nucleus (22.9% overlap in control vs. 74.7% overlap in cyp26a1rw716). N = 12–14 embryos/condition.
(B) The PA4-innervating region extends further posteriorly in cyp26a1rw716 embryos.
(C) The PA7-innervating region extends further anteriorly in cyp26a1rw716 embryos.
(B-C) Data represent mean ± SEM. N = 12–14 embryos/condition.
(D-I) Altered RA signal transduction cell-autonomously changes axon target selection in mature mX neurons.
(D) Anterior neurons expressing Tg(UAS:eGFPcaax) (green in D, black in D’) innervate anterior branches (PA4, PA5).
(E) Position probability matrix showing wild-type vagus topography. N = 89 cells.
(F) Posterior neurons expressing Tg(UAS:DN-RAR-p2a-GFPcaax) (green in F, black in F’) aberrantly target a more anterior branch (PA6).
(G) Position probability matrix showing an anterior targeting bias in DN-RAR vagus topography. N = 67 cells.
(H) An anterior neuron expressing Tg(UAS:CA-RAR-p2a-GFPcaax) (green in H, black in H’) aberrantly targets a more posterior branch (PA7).
(I) Position probability matrix showing a posterior targeting bias in CA-RAR vagus topography. N = 41 cells.
(E, G, I) Data are represented as the proportion of cells that innervate the noted branch. Fisher’s exact test comparing positional axon distribution to control, *P<0.05.
All images are lateral views with anterior to left. Scale bars = 50 μm.
Second, we performed the inverse experiment by photoconverting the anterior-most 10% of the mX motor nucleus and, after anterograde transport of photoconverted protein, quantified the distribution of this protein in mX axons by measuring the red fluorescence signal (normalized to total fluorescence) in each branch (Fig. S1B–C). No difference in the number of photoconverted mX neurons, percentage of photoconverted cells, or percentage of the nucleus that was photoconverted was seen between these conditions (Fig. S1D–F). We observed a decrease in the normalized red fluorescence in PA4, indicating that the proportion of anterior mX neurons innervating this branch in cyp26a1rw716 mutants is decreased, and an increase in the normalized red fluorescence in PA7, suggesting that some of the anterior mX neurons that fail to target PA4 are redirected to PA7 in these mutants (Fig. S1C). Together, these retrograde and anterograde labeling experiments demonstrate a disrupted topographic map in the presence of excess RA.
While the above experiments indicate that RA regulates mX axon targeting, the constitutive nature of the cyp26a1rw716 mutation does not allow us to determine on what tissue(s), and at what developmental stage(s), the change in RA signaling exerts its effect. We therefore devised an experiment that directly tests whether altering RA signaling in mature mX neurons is sufficient to autonomously impact axon target selection. For this experiment, we manipulated RA signal transduction in one or a few post-mitotic mX neurons via mosaic expression of UAS-driven transgenes using an Tg(isl1:Gal4)fh452 driver (Davey et al., 2016). Three transgenic constructs were expressed in this manner: 1. Tg(UAS-GFPcaax), which expresses a membrane GFP; 2. Tg(UAS:DN-hRARα-p2a-GFPcaax), which expresses a dominant-negative Retinoic Acid Receptor (DN-RAR) in combination with membrane GFP; 3. Tg(UAS:CA-RARga-p2a-GFPcaax), which expresses a constitutively active RAR (CA-RAR) in combination with membrane-GFP. The DN-hRARα and CA-RARga transgenes cell-autonomously decrease and increase RA signal transduction, respectively, in zebrafish (Waxman and Yelon, 2011). The RAR and GFPcaax genes were co-expressed on a single transcript separated by a p2a self-cleaving peptide to ensure that the GFP signal accurately reflected RAR expression (Kim et al., 2011). We then examined the targeting effect of these transgenes by quantifying both the A-P position of each GFP+ cell body within the mX nucleus (marked with Tg(isl1:mRFP) ), and the branch innervated by its axon (Fig. 3D–I). This experiment revealed a dramatic cell-autonomous influence of RA signaling on mX axon target selection. Decreasing signal transduction with DN-hRARα causes mX neurons to project to more anterior PAs than is appropriate for their A-P position (Fig. 3F–G). Conversely, increasing signal transduction with CA-RARga causes mX neurons to project to more posterior PAs than is appropriate for their A-P position (Fig. 3H–I). These data confirm that RA acts to control the axon targeting decisions of mature neurons in the mX nucleus, with low RA levels promoting anterior target selection and high RA levels promoting posterior target selection.
Retinoic Acid controls mX chemoattraction through Hgf/Met signaling
How does RA control axon target selection? The timing of axogenesis is determined by mX neuron position, and delayed axogenesis is sufficient to drive posterior targeting (Barsh et al., 2017). We therefore hypothesized that RA promotes posterior targeting by delaying axogenesis. To test this hypothesis, we measured the timing of anterior and posterior axogenesis in embryos treated with either 50 nM RA, which induces high RA signaling throughout the mX nucleus (Fig. S2A–B), or with 1 μM of the RA-synthesis inhibitor DEAB, which reduces RA signaling throughout the mX nucleus (Fig. S2C). Treatment was started at 24 hpf, when vagus motor neurons are largely post-mitotic (Barsh et al., 2017), to avoid the early adverse effects of disrupted RA signaling on hindbrain patterning. We performed live imaging on Tg(isl1:Kaede)ch103 embryos in which the posterior half of the mX nucleus had been photoconverted to compare when anterior (Kaede green) and posterior (Kaede red) axons appear. While RA, which promotes neuronal differentiation, slightly increased the total number of neurons in the motor nucleus (Fig. S2D–G), we were surprised to find that neither RA nor DEAB had any effect on axogenesis timing (Figs. 4A, S2H–J, Video 1).
Figure 4: RA controls mX chemoattraction through Hgf/Met signaling, see also Supplementary Figures 2–3 & Videos 1–3.

(A) RA and DEAB treatments do not affect the difference in axogenesis timing between anterior and posterior mX neurons. Data represent mean ± SEM. t-test: ns = not significant. N = 15–35 embryos/condition.
(B) Volcano plot of RNAseq data showing mRNAs depleted (left) or enriched (right) in mX neurons of RA-treated embryos relative to controls. Dashed lines: significance threshold for a false discovery rate of 5% (y-axis) and fold change of 1.5 (x-axis). Blue dots: significantly differentially expressed genes. Red dot: met.
(C-E) met RNA in situ hybridization (purple) in the mX nucleus (brown) in control (D), RA-treated (E) and DEAB-treated (F) embryos.
(F-H) hgfa RNA in situ hybridization (purple) in the PAs (brown) in control (F), RA-treated (G) and DEAB-treated (H) embryos. Arrowheads: hgfa expression in PAs. Numbers: PAs. P: primordium.
(I) Quantification of met expression domains at 38 hpf as represented in (C-E). Data represent mean ± SEM. t-test ****P<0.0001. N = 11–33 embryos/condition.
(J) Frequency of hgfa expression patterns observed at 36 hpf as represented in (F-H). N = 15–20 embryos/condition.
(K-O) Paired 52hpf and 72hpf mX nerve structure in control (K), hgfafh528 (L, N), and mef1533 (M, O) embryos. In the strong phenotype, mX axons stall and completely fail to innervate the PAs (arrowheads) (L-M). In the weak phenotype, mX axons exhibit a prolonged stall at the ventral choice point (arrows) (N-O) but eventually achieve delayed, partial innervation (N’-O’). Numbers: innervated PAs.
All images are lateral views with anterior to left. Scale bars = 50 μm.
The above finding suggests that RA controls axon target selection through an as-yet-unidentified mechanism. To discover this mechanism, we used RNA-seq to identify candidate genes whose expression in mX neurons is regulated by RA. We treated Tg(isl1:Kaede)ch103 embryos with DMSO (control) or with 50nM RA starting at 24 hpf, dissected the posterior hindbrain at 38 hpf (when anterior, but not posterior, mX axons are innervating their targets), and collected Kaede positive cells by flow cytometry for RNA sequencing. Because axon targeting is mediated by chemoattractant and chemorepellent signals, we were particularly interested in identifying genes of this type. Among the genes whose expression was significantly changed by RA treatment (397 up-regulated & 364 down-regulated genes), one of the most significant was met (3.1-fold decrease, FDR = 5.90E-10) (Fig. 4B). met, which is expressed in vagus motor neurons in mouse (Kamitakahara et al., 2017; Wu and Levitt, 2013), encodes a receptor tyrosine kinase that is the only known receptor for Hgf (Bottaro et al., 1991). Hgf is a chemoattractant for spinal motor neurons (Ebens et al., 1996) and attracts cranial motor neurons in hindbrain explant cultures (Caton et al., 2000), but a requirement for Hgf and Met in topographic map development, or in vagus development, has not been demonstrated. We first examined the expression of met and hgfa (one of two hgf genes in the zebrafish; hgfb is not expressed in PAs and does not appear to regulate mX axon targeting (data not shown)). At 38hpf, met is expressed in the anterior part of the mX nucleus (Fig. 4C). In validation of our RNAseq findings, the met domain is significantly reduced towards the anterior in RA-treated embryos and significantly expanded towards the posterior in DEAB-treated embryos (Fig. 4C–E, I). Correspondingly, hgfa is expressed in the anterior part of the PA4–7 region (PAs 4 & 5) at 36hpf (Fig. 4F). hgfa expression is also regulated by RA: in RA-treated embryos, hgfa expression is shifted so anteriorly as to be almost completely lost from the PA4–7 region, while in DEAB-treated embryos it expands posteriorly to fill the entire PA4–7 region, including the primordium (Fig. 4F–H, J). Thus, RA coordinately represses met and hgf expression in the mX nucleus and PAs, respectively.
Hox5 genes are expressed in posterior mX neurons and can regulate mX axon targeting (Barsh et al., 2017); we thought perhaps they do so by mediating RA’s repression of met. However, we generated hoxa5afh510;hoxb5afh477;hoxb5bfh478 mutant embryos lacking all hox5 genes that are expressed in the vagal region and saw no effect on met expression (Fig. S2K–M).
Do Met and Hgf mediate mX axon chemoattraction? To test this, we generated frameshift alleles of met (mef1533) and hgfa (hgfafh528 and hgfafh529) and examined their effect on mX axon targeting. We also examined the previously described met5908 hypomorphic allele (Anderson et al., 2013). In these mutants, although PA formation and mX neuron differentiation occur normally (Fig. S3A–B, Videos 2 & 3), PA innervation is strongly disrupted. The phenotypes we observed vary in severity; the strongest phenotype, observed in all alleles except met5908, is a complete loss of all vagus motor innervation of the PAs and viscera. In these cases, mX axons extend anteriorly towards the otic vesicle but fail to turn ventrally towards the PAs (Figs. 4K–M, S3C–E). All alleles also sometimes show a weaker innervation defect, in which axons exhibit a prolonged stall at the branch point (until 56hpf or later) but eventually attain partial innervation (Figs. 4N–O, S3C,F–G). In these cases, branch formation is incomplete – branch 4 never forms and branches 5, 6, and 7 sometimes fail to form – and the branches that do form do so late and often appear thinner than normal. These findings reveal that Hgf, signaling through Met, is the chemoattractant that guides mX axons to their PA targets.
Spatiotemporal coordination of hgfa and met expression controls vagus motor axon target selection
Although mX axons require Hgf/Met signaling to innervate the PAs normally, it is not clear whether or how they might instruct the differential targeting decisions that underlie topographic organization. One hypothesis is that spatially graded met and hgf expression promotes differential target selection. However, this is inconsistent with the fact that the timing of axogenesis can override spatial identity in determining target selection (Barsh et al., 2017). Therefore, we considered that topographic axon target selection may result from differences in the timing, rather than the level, of chemoattractant signaling along the A-P axis. To test this hypothesis, we observed the expression of met and hgfa by ISH over the course of axon targeting. hgfa expression expands through the PA region from anterior to posterior beginning at ~30hpf, appearing in each arch shortly after its formation (Fig. 5A–C,G). Similarly, met, initially only expressed in the anterior-most mX neurons, expands posteriorly between 32 and 48 hpf (Fig. 5D–F,H). Expansion of the hgf and met expression domains corresponds with a recession of the inhibitory RA signaling domain, which we infer from the receding expression of hoxb5a between 24 hpf and 32 hpf (Fig. S4A–D). The delay in met and hgf expansion compared to hoxb5a recession may indicate that their regulation by RA is less direct than that of hoxb5a and requires the production and/or degradation of other factor(s). We could not detect RA recession with the 12xRARE:GFP reporter, which is less sensitive to RA than the hoxb5a gene and thus is never expressed in the anterior vagus region (Fig. 2F) or in the PAs (Fig. S4E).
Figure 5: Spatiotemporal dynamics of hgf and met expression, see also Supplementary Figure 4.

(A-C) hgfa RNA in situ hybridization (purple) time series showing sequential expression in the PAs (brown). Arrowheads: hgfa expression in PAs. Numbers: PAs. P: primordium.
(D-F) met RNA in situ hybridization (purple) time series showing A-P expansion over time in the mX nucleus (brown).
(G) Frequency of hgfa expression patterns observed over time as represented in (A-C). N = 7–28 embryos/stage.
(H) Quantification of met expression domain size over time as represented in (D-F). Data represent mean ± SEM. t-test ****P<0.0001, **P<0.005, ns = not significant. N = 15–26 embryos/stage.
All images are lateral views with anterior to left. Scale bars = 50 μm.
The above findings suggest that the domain of Hgf/Met signaling in the vagus motor nucleus is temporally constrained and suggest a model for how topographic targeting is controlled, which we refer to as “temporal matching”. The correlation between the sequential onset of hgfa expression in the PAs and their sequential innervation suggests that hgfa expression functions to establish distinct developmental windows during which each PA is able to attract mX axons. Likewise, the expanding met expression domain in the mX nucleus functions to establish a distinct developmental time at which each neuron becomes competent to respond to Hgf. Thus, the earliest met-expressing mX neurons (the anterior-most) become matched with the earliest hgfa-expressing PA (PA4). As the expression wavefronts of hgf and met coordinately sweep across their respective tissues, more posterior neurons are subsequently matched with more posterior PAs, resulting in sequential innervation and, consequently, the topographic organization of the vagus nerve. We propose that the RA signal controls axon target selection by coordinately regulating the timing of these two expression wavefronts.
To validate the temporal matching hypothesis, we tested two key predictions made by the model. First, it predicts that precociously expanding Hgf/Met signaling will drive early innervation of posterior PAs. Our DEAB treatment provides just such a condition (Fig. 4E,H). As expected, at 38 hpf in this condition, axons aberrantly extend to all tcf21:mcherry+ pharyngeal regions, including the PA primordium (Fig. 6A–B). We also observe defects in PA5–7 development in this condition (Fig. 6B). Second, the model predicts that delaying Hgf/Met signaling will cause the axons of anterior mX neurons to shift into to more posterior branches, and that the extent of the posterior shift will be proportional to the length of the delay. We delayed Met signal transduction with Crizotinib, a reversible small molecule inhibitor of Met kinase activity (Zou et al., 2007). Crizotinib treatment starting at 24hpf consistently recapitulates the weak meth533 and hgfafh528 mutant phenotypes: a prolonged stall of mX axons at the branch point and incomplete PA innervation (Fig. 6C–E). However, unlike in the mutants, Met function can be rapidly restored by washing out the drug, allowing us to control the onset of signaling. We washed out the drug at two timepoints - 38 hpf, when PA5 innervation normally begins, and 48 hpf, when PA6 innervation normally begins. Vagus nerve structure was then assessed at 72hpf. Delaying Met signal transduction causes progressive loss of anterior PA branches. The short delay (until 38 hpf) prevents the PA4 branch from forming, while the longer delay (until 48 hpf) additionally frequently prevents the PA5 branch from forming (Fig. 6E–I); these phenotypes are both weaker than when we do not wash out the drug (Fig. 6E).
Figure 6: Spatiotemporal coordination of hgfa and met expression controls vagus motor axon target selection.

(A-B) 38hpf vagus innervation pattern in control (A) and DEAB (B) treatments. Arrows: precocious nerve branches aberrantly innervating posterior PA regions, including the primordium. Numbers: PAs. P: primordium.
(C-D) mX nerve structure in control (C) and Crizotinib-treated (D) embryos. At 52 hpf, mX axons in Crizotinib-treated embryos stall at the dorsal choice point (arrow) (D). At 72 hpf, some mX axons escape and innervate posterior PAs (D’). Numbers: innervated PAs.
(E) Frequency of innervation patterns observed as represented in (C-D & G-I). Progressively longer Crizotinib treatment causes progressively more severe loss of anterior branches. N = 11–17 embryos/condition.
(F-I) Delayed Met signal transduction causes a timing-dependent posterior shift in anterior mX axon target selection. Numbers: PAs.
(F) Representative anterior mX neuron photoconversion used for anterograde labeling in (L-N).
(G) mX branches in a control embryo. Anterior mX neurons predominantly target PA4.
(H) mX branches in embryo treated with Crizotinib from 24–38 hpf. The PA4 branch is missing, and anterior mX neurons predominantly target PA5.
(I) mX branches in embryo treated with Crizotinib from 24–48 hpf. The PA4 and PA5 branches are missing, and anterior mX neurons predominantly target PA6.
(J) PA4- and PA6-innervating regions in control embryos, and in Crizotinib-treated embryos in which the anterior-most branch is in PA6. (J’) Overlaid individual outlines. (J”) Overlaid average outlines. In Crizotinib, the region that would normally innervate PA4 instead innervates PA6 (47.8% overlap with control PA6 region, 89.2% overlap with Crizotinib PA6 region). N = 12–22 embryos/condition.
(K) The PA6-innervating region is shifted anteriorly in Crizotinib-treated embryos. Data represent mean ± SEM. t-test ****P<0.0001. N = 12–14 embryos/condition.
All images are lateral views with anterior to left. Scale bars = 50 mm.
The loss of anterior mX branches after Crizotinib treatment could be because anterior mX neurons fail to innervate any PAs, or because they redirect to more posterior PAs, the latter being more consistent with the temporal matching model. Anterograde axon labeling by photoconversion of the anterior-most 10% of mX neurons reveals that these neurons indeed redirect to the next most anterior available branch: PA5 in the 38 hpf washout or PA6 in the 48 hpf washout (Fig. 6F–I). Likewise, retrograde labeling of mX neurons innervating PA6 in the 48hpf washout shows that the PA6-innervating region shifts anteriorly to include most of the region that would normally innervate PA4 (Fig. 6J–K). These results show that controlling the timing of Hgf/Met signaling is sufficient to determine mX axon target selection, and confirm our model that mX axon target selection is driven by coordinating the spatiotemporal dynamics of met expression in the mX nucleus and hgfa expression in the PAs, thus establishing the topographic innervation pattern of the vagus nerve (Fig. 7).
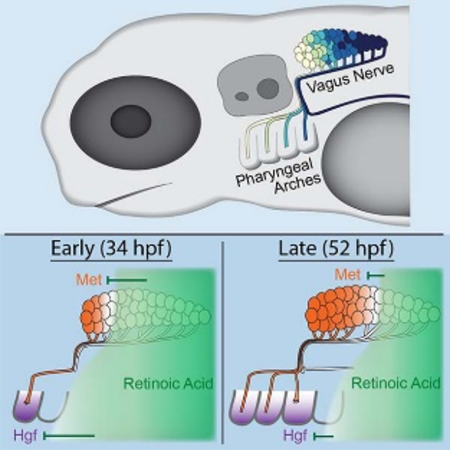
Figure 7: Temporal matching model of topographic vagus motor axon targeting.

During early innervation (left), the anterior-most PAs (4 & 5) have formed. A broad, posteriorly sourced RA signaling domain represses hgf in all but the most anterior PA and represses met in all but the most anterior neurons, causing matching of anterior neurons with the anterior PA. Later (right), more posterior PAs have formed and the inhibitory RA signaling domain has regressed. Consequently, hgf is activated in a more posterior PA (6) and met is activated in more posterior neurons, causing matching of those more posterior neurons with PA6.
DISCUSSION
The classic chemoaffinity model of axon guidance posits that the communication of spatial differences between neurons and their targets guides axon outgrowth (Cang and Feldheim, 2013; Sperry, 1963). While this model adequately explains topographic map development in some systems, such as the retinotopic map, in some cases spatial signaling alone is insufficient to direct the requisite targeting decisions (Eerdunfu et al., 2017; Kulkarni et al., 2016; Petrovic and Hummel, 2008; Takeuchi et al., 2010). Here, we have presented a “temporal matching” mechanism of axon targeting that integrates spatial and temporal signaling dynamics. We first reported the A-P temporal pattern of mX branch formation. We then found that RA signaling is active in posterior, but not anterior, mX neurons and promotes posterior axon targeting. Next, we discovered that Hgf and its receptor, Met, constitute the chemoattractant signaling pathway that guides mX axon targeting. Finally, we reveal that RA coordinately regulates the spatiotemporal dynamics of hgf and met expression to guide topographic axon targeting decisions.
We identify a critical role for RA signaling in mX axon targeting. RA is a well-established regulator of early rhombomeric A-P patterning in the hindbrain (Moens and Prince, 2002; Nolte et al., 2019) and, later, in the specification of motor neuron subtypes in the spinal cord (Sockanathan and Jessell, 1998; Sockanathan et al., 2003). RA has also been proposed to provide positional information for topographic axon targeting in the olfactory and retinotopic maps (Login et al., 2015; Sen et al., 2005). In these cases, it is believed to act as a stable morphogen gradient that establishes different identities at different levels of signaling. RA’s role in the mX nucleus is fundamentally different - rather than acting as a morphogen gradient, the receding RA signal instead acts as a determination front, behind which mX neurons become competent to respond to a PA-derived chemoattractant. These observations highlight the importance of considering temporal, as well as spatial, qualities when inferring signal function during development.
This work also represents an important advance in our understanding of the developmental role of Hgf/Met signaling. Hgf/Met was one of the earliest identified axon chemoattractants (Caton et al., 2000; Ebens et al., 1996). Since its discovery, the detailed developmental mechanisms of several other major axon guidance signals has been elucidated (Bellon and Mann, 2018; Robichaux and Cowan, 2014; Stoeckli, 2017), while our understanding of how Hgf/Met regulates axon targeting has advanced comparatively little. This may be in part because in the limb, where Hgf/Met has been best studied, it has multiple successive functions, including in the migration of muscle precursors into the limb (Bladt et al.,1995), as well as motor neuron specification (Helmbacher et al., 2003), attraction (Ebens et al., 1996), and survival (Novak et al., 2000; Yamamoto et al., 1997). Hgf/Met is not required for the specification or survival of mX neurons, and although a requirement for the migration of PA-derived muscle progenitors to form esophageal muscle has been reported in the mouse (Comai et al., 2019), we do not observe any abnormalities of posterior PA muscle progenitors in zebrafish hgfa or met mutants at the stages we studied. Thus, we were able to study its function specifically in motor axon guidance, and we found that precise developmental regulation of Hgf/Met signaling plays an essential and direct role in guiding the topographic targeting of vagus motor axons.
A key aspect of topographic mX nerve formation is that anterior PAs are innervated before posterior PAs. Here, we propose that the timing Hgf/Met signaling causes this delay and show that delaying signaling is sufficient to shift axons to more posterior PAs. We have also previously reported that posterior mX neurons initiate axogenesis several hours later than anterior mX neurons (Barsh et al., 2017), independently of Hgf/Met (this paper). This phenomenon could also cause the requisite innervation delay and, in support of this idea, we have shown that delaying axogenesis is sufficient to direct axons to more posterior PAs. Therefore, two events – onset of Hgf/Met signaling and initiation of axon formation – are independently regulated to control mX axon targeting. Why the apparent redundancy? Perhaps each is required, but not sufficient, to generate the full delay required for posterior targeting. Indeed, the difference in timing between PA4 and PA7 innervation (20 hours) is longer than either the A-P difference in timing of axogenesis or the difference in timing of met expression. Further, neither delaying axogenesis (Barsh et al., 2017) nor delaying Hgf/Met signaling (this paper) completely disrupts vagus topography. Thus, these two mechanisms likely both contribute to temporal matching in the vagus nerve.
Our findings raise several questions for future investigation. 1) How does RA repress met and hgfa expression? RA is generally believed to activate transcription (Ghyselinck and Duester, 2019), but can also directly repress gene expression (Kumar and Duester, 2014). If it acts on met and hgfa indirectly via induction of a repressor, that gene would likely be found amongst the RA-upregulated transcripts in our RA-treated RNA-Seq dataset. 2) What is the source of the RA that represses met and hgf? RA from paraxial mesoderm, the major source in the early embryo, could impact both the hindbrain (met) and the PAs (hgfa). However, the RA biosynthetic enzyme aldh1a2 is also expressed in the PA primordium, raising the possibility that met and hgfa are repressed by RA from separate sources. 3) What sets the PA innervation windows? The onset of hgfa expression determines when innervation of each PA begins, but it is unclear what causes axons to stop innervating one PA in favor of its posterior neighbor. In other contexts, competition between axons can cause shifts in target selection over time, for instance by the innervation-induced expression of a chemorepellent (Takeuchi et al., 2010); however, the failure to innervate anterior PAs in our Crizotinib experiments indicates that switching between PA targets is independent of innervation. While hgfa is not downregulated in the PAs over time, downregulation of a required processing factor (Kawaguchi and Kataoka, 2014) or the delayed expression of a repulsive or inhibitory cue could cause axons to switch targets. Alternatively, the ongoing morphogenesis that moves the PAs anteriorly relative to the brain (Videos 2 & 3) could make posterior PAs more easily accessible over time.
A major challenge in developmental biology is how to precisely generate varied and complex structures in a small space with a limited molecular toolkit. This challenge is particularly acute in the nervous system, in which the formation of intricate innervation patterns requires the communication of diverse patterned signals through the noisy embryonic environment. Many innovations in developmental complexity have been built on increases in signal complexity - the ability to interpret more varied and combinatorial signals along more embryonic axes with higher spatial resolution. It is in this context that most topographic mapping events have been interpreted. Our work reveals that the communication of information along the temporal axis is also crucial in generating the signal complexity required for topographic axon targeting, thus highlighting the importance of developmental time as an additional dimension with which to enhance signal resolution. The importance of combining spatial and temporal information in generating the complexity of the nervous system is evident in other contexts. For instance, temporal transcription factor cascades in neural progenitors allow for the generation of a diversity of cell types greater than could be achieved by spatial cues alone (Doe, 2017; Holguera and Desplan, 2018). Likewise, differences in the timing of neuron birth can direct differential axon targeting decisions (Eerdunfu et al., 2017; Petrovic and Hummel, 2008; Takeuchi et al., 2010). However, to the best of our knowledge, the vagus nerve represents the only example of a temporal axon targeting mechanism that is independent of cell birth timing (Barsh et al., 2017). While temporal signaling dynamics are inherently more difficult to identify and study than spatial signaling dynamics, it is likely that the temporal axis is a major, and underrepresented, contributor to the organization of the nervous system, and the embryo as a whole.
STAR METHODS
Resource Availability
Lead Contact
Further information and requests for resources and reagents should be directed to and will be fulfilled by the Lead Contact, Cecilia Moens (cmoens@fredhutch.org).
Materials Availability
All materials generated for this paper are available from the Moens lab upon request. Requests for materials should be directed to Cecilia Moens (cmoens@fredhutch.org).
Data and Code Availability
Genomic data generated in this study has been deposited to the NCBI Gene Expression Omnibus (GEO) with the following accession numbers: GSE135780 for the A-P experiment, and GSE135781 for the RA experiment. Custom code used in this study has been deposited in the public GitHub repository MoensLab/Isabella_et_al_2019.
Experimental model and subject details
Zebrafish care and maintenance
Danio rerio animals were raised at the Fred Hutchinson Cancer Research Center facility in accordance with IACUC-approved protocols. All experiments were carried out in accordance with IACUC standards. Fish were bred and maintained according to standard protocols (Westerfield, 2000). All experimental stages are noted in the figures and text. Staging of embryos between 24–38 hpf was done according to the prim staging method (Kimmel et al., 1995). Staging of embryos beyond 38 hpf was done by elapsed time at 28°C. Sex is not a relevant biological variable in our experiments, as they are carried out before sex is determined in zebrafish (Siegfried, 2010). Transgenic lines used in this study include Tg(isl1:Kaede)ch103 (Barsh et al., 2017); Tg(isl1:Gal4)fh452 (Davey et al., 2016); Tg(isl1:mRFP)fh1 (Grant and Moens, 2010); TgBAC(tcf21:mCherry-NTR)pd108 (Wang et al., 2015); Tg(isl1:EGFPCAAX)fh474 (Barsh et al., 2017); Tg(12xrare-ef1a:EGFP)sk71 (Waxman and Yelon, 2011). Mutant lines used in this study include met5908 (Anderson et al., 2013) and cyp26a1rw716 (Emoto et al., 2005). Lines generated for this study include Tg(isl1:NLS-GFP)fh558, hoxa5afh510, hoxb5afh477, hoxb5bfh478, mef1533, hgfafh528, hgfafh529 (see details below).
Method Details
Plasmid construction and transgenesis
The following plasmids were generated for this study: isl1:NLS-GFP-polyA, 10X-UAS:eGFP-CAAX-polyA, 10X-UAS:DN-hRARa-p2a-eGFP-CAAX-polyA, and 10X-UAS:CA-RARga-p2a-eGFP-CAAX-polyA. The isll promoter is from (Higashijima et al2000). The 10X-UAS and eGFP-CAAX sequence were obtained from the Tol2kit (Kwan et al., 2007). Plasmids containing the DN-hRARα and CA-RARga were kindly provided by the Waxman lab (Waxman and Yelon, 2011), and a plasmid containing the NLS-GFP kindly provided by Jeremy Rabinowitz, and cloned using the following primers:
| DN-hRARα: | Forward | ATGGCCAGCAACAGCAGCTC |
| Reverse | CGGGATCTCCATCTTCAGCG | |
| CA-RARga: | Forward | ATGGCCCCCCCGACCGATG |
| Reverse | CTGAGCTCTTCCTCCGTGGC | |
| NLS-GFP: | Forward | GGGGACAA GTTTGTACAAAAAAGCAGGCTCCATGGCTCCAAAGAAGAAGCG |
| Reverse | GGGGACCACTTTGTACAAGAAAGCTGGGTCTTACTTGTACAGCTCGTCCATGCCG |
RAR sequences were inserted into a pDONR 221 vector in-frame upstream of a p2a-eGFP-CAAX element (Barsh et al., 2017). NLS-GFP was inserted into a pME gateway vector. Final constructs were assembled in a pBHR4R3 plasmid (gift of the Brockerhoff lab) using the Gateway system (Life Technologies). Sparse transgenic labeling of cells was done by injecting one-cell-stage embryos with 50pg of plasmid and 50pg of Tol2 mRNA, and screening embryos for sparse GFP expression at 2 days post fertilization on a Zeiss AxioZoom.V16 microscope. The Tg(isl1:NLS-GFP)fh558 line was generated using the same injection and screening strategy, after which animals were grown to adulthood and an F1 transgenic line generated.
Generation of mutant alleles
Mutant alleles were generated with CRISPR/Cas9 using standard protocol (Talbot and Amacher, 2014). gRNAs were designed using chopchop (https://chopchop.cbu.uib.no). One-cell-stage embryos were injected with 200pg gRNA and 500pg Cas9 protein, and F1 mutant animals identified by sequencing. The following gRNA targeting sequences were synthesized and co-injected for each target gene:
| hoxa5a | gRNA | GGAACGGTTCTCAGCCGGGA |
| hoxb5a | gRNA | GGAAGGGGGCGAAGAGCCTT |
| hoxb5b | gRNA | GGTGGTCTGTGCTCCTTCCT |
| met | gRNA 1 | GGTTCTGGCCATCTGGCTCG |
| gRNA 2 | GGCTTCGGCTGCGTGTTTCA | |
| hgfa | gRNA 1 | GGAGTGTATGAAATGTAATG |
| gRNA 2 | TTCGGCAAAAGTTCTGACGT | |
| gRNA 3 | TCGTCCGTGGTGTTACACGA |
hoxa5afh510 is a 17bp deletion at nucleotide 413 of the coding sequence, resulting in a frameshift at amino acid 135 and a premature stop codon at amino acid 151. hoxb5afh477 is a 2bp insertion at nucleotide 332 of the coding sequence, resulting in a frameshift at amino acid 112 and a premature stop at amino acid 187. hoxb5bfh478 is a 4bp deletion at nucleotide 455 of the coding sequence, resulting in a frameshift at amino acid 153 and a premature stop at amino acid 186. mefh533 is a 7bp deletion starting at nucleotide 3,280, and a 17bp insertion at nucleotide 3,301, of the coding sequence, resulting in a frameshift at amino acid 1094 and a premature stop at amino acid 1099. hgfafh528 is a 79bp deletion covering the start of exon 6. hgfafh529 is a 11 bp insertion at nucleotide 474, and a 265 bp deletion at nucleotide 597, of the coding sequence, resulting in a frameshift at amino acid 159 and a premature stop at amino acid 201.
RNA in situ hybridization
Anesthetized embryos were fixed overnight at 4°C in 4% paraformaldehyde with 1X PBS and 4% sucrose. RNA in situ hybridization was performed using standard protocol (see Prince et al., 1998). GFP (from Tg(isl1:EGFPcaax)fh474) or mcherry (from TgBAC(tcf21:mCherry-NTR)pd108) protein was visualized in tandem with mRNA signal as follows. After completion of in situ hybridization, embryos were washed and incubated with primary antibody (rabbit anti-GFP, 1:1000 or rabbit anti-dsRed, 1:200). Samples were re-blocked for 1 hour, stained with secondary antibody (mouse anti-rabbit HRP, 1:200), washed 3x with PBS+0.1% Tween 20 and color was developed with DAB solution. For imaging, embryos were cleared step-wise into 75% glycerol, dissected, and imaged on a Zeiss Axioplan2 microscope. The hoxb5a probe is from (Prince et al., 1998). The met and hgfa probes are from (Haines et al., 2004). The tcf21 probe is from Chuck Kimmel and can be amplified with the following primers:
| tcf21: | Forward | CGTTTCCACATAGCCAGTTGC |
| Reverse | GGAGAGTTTGGTGTCCGGCGG |
The crabp1b and dhrs3b probes were amplified from cDNA prepared from 2dpf embryos using the following primers and in vitro transcribed with the MEGAscript T7 transcription kit.
| crabp1b: | Forward | TGCTGAGAAAAGTGGCTTGTGC |
| Reverse | taatacgactcactatagggagaCACATCATCAGCCCCAAACATC | |
| dhrs3b: | Forward | CGGACGGAAAAATGTCTGAAGG |
| Reverse | taatacgactcactatagggagaGATAACGAGTGCGTTCATGGTCC |
Fluorescence microscopy
All embryos were anesthetized with 400mg/L MESAB, embedded in 1.4% (for single time point imaging) or 0.7% (for time-lapse imaging) low-melt agarose and imaged live on a Zeiss LSM 700 confocal microscope at the stages noted. Images were processed using imageJ (Schneider et al., 2012). For Kaede photoconversion, the appropriate region was photoconverted using 200 iterations of the 405nm laser at 10% power.
RNA sequencing
To prepare embryos for sequencing of anterior and posterior mX neuron populations (A-P experiment), 28 hpf Tg(isl1:Kaede)ch103 embryos were mounted for fluorescence microscopy and cells in the anterior or posterior 25–30% of the mX nucleus were photoconverted as described above, and unmounted. To prepare embryos for sequencing of DMSO- and RA-treated mX neuron populations (RA experiment), Tg(isl1:Kaede)ch103 embryos were treated with drugs as described below and dissected at 38 hpf. For both experiments, hindbrain rhombomere 8 was dissected in calcium-free Ringer’s solution with MESAB, and dissected tissue was dissociated to single-cell suspension by pipetting in 0.25%Trypsin-EDTA for 5 minutes. For the A-P experiment, dissociated cells were transferred into cold DPBS + 5% FBS + 1% BSA. The cell suspension was then transferred onto a glass coverslip, covered with mineral oil, and photoconverted cells were manually picked up using a 10μm diameter transplant pipette on a hydraulic micromanipulator mounted on a Zeiss AxioSkop microscope. Picked cells were transferred into lysis buffer from the RNA isolation kit (see below) and frozen at −80°C until RNA isolation. For the RA experiment, dissociated cells were transferred into cold DPBS + 1%BSA + 2pg/mL DAPI. Cells were then sorted on an BD FACS ARIA II flow cytometer. Kaede+, DAPI-cells were collected in lysis buffer from the RNA isolation kit and immediately processed. For both experiments, RNA was isolated using the RNAqueous-Micro Total RNA Isolation Kit, cDNA was amplified using the SMART-Seq v4 Ultra Low Input RNA Kit for Sequencing, and libraries were prepared using the Nextera XT DNA library prep kit and sequenced on an Illumina HiSeq 2500 sequencer. For the A-P experiment, 3 replicates of 100 cells were sequenced and analyzed for each position. Reads of low quality were filtered prior to alignment to zebrafish (GRCz10) using TopHat v2.1.0 (Trapnell et al., 2009). Counts were generated from TopHat alignments for each gene using HTSeq v0.6.1, (Anders et al., 2015), employing the “intersection-strict” overlap mode. Genes with low counts across all samples were removed, prior to identification of differentially expressed genes using the Bioconductor package edgeR v3.18.1 (Robinson et al., 2009). A false discovery rate (FDR) method was employed to correct for multiple testing (Reiner et al., 2003), with differential expression defined as |log2 (ratio) | >= 0.585 (± 1.5-fold) with the FDR set to 10%. For the RA experiment, 3 replicates of 4500–10000 cells were sequenced and analyzed for each condition. Reads of low quality were filtered prior to alignment to zebrafish (GRCz11) using STAR v2.5.2a (Dobin et al., 2013) in 2-pass mode. Counts were generated from were generated from STAR alignments for each gene using featureCounts from the Subread package v1.5.0 (Liao et al., 2014). Genes with low counts across all samples were removed, prior to identification of differentially expressed genes using the Bioconductor package edgeR v3.20.9 (Robinson et al., 2009). A FDR method was employed to correct for multiple testing (Reiner et al., 2003), with differential expression defined as |log2 (ratio) | >= 0.585 (± 1.5-fold) with the FDR set to 5%.
Drug treatments
Embryos were routinely treated with 0.2mM PTU at 24hpf to block pigment formation. For RA and DEAB treatments, embryos were dechorionated and treated with 50nM RA in DMSO or 1|mM DEAB in DMSO, or the equivalent volume of DMSO as a control, beginning at 24hpf. For Crizotinib treatments, embryos were dechorionated and treated with 20μM Crizotinib in DMSO, or the equivalent volume of DMSO as a control, beginning at 24hpf. For Crizotinib wash-out, embryos were transferred to fresh water at the specified times.
Quantification and Statistical Analysis
Unless otherwise noted, all image analysis was performed in imageJ, and all statistics were performed in GraphPad Prism in the form of unpaired t-tests. Additional statistical information on each experiment is noted in figure legends.
Quantification of pharyngeal arch formation and innervation
From our staged image series of 24–60 hpf embryos, we counted as positive each embryo that exhibited formation of PA4, 5, or 6 (defined by the PA having fully separated from the posterior primordium), or that exhibited innervation of PA4, 5, 6, or 7 by mX neurons (defined by axons having crossed the dorsal boundary of the PA).
Quantification of Axon Initiation Timing
We started at the end of the movie when axons were clearly visible, and tracked backwards until the first frame in which the axon was visible. The green (un-photoconverted) channel was used to assess anterior mX neurons, and the red (photoconverted) channel was used to assess posterior mX neurons.
Quantification of PA4- and PA7-innervating regions by retrograde labeling
At 72hpf, Axon branches innervating PA4 or PA7 were photoconverted and >1 hour allowed for diffusion of converted protein into cell bodies. The following steps were completed in Illustrator (Adobe). In maximum intensity projection images of individual mX nuclei containing retrogradely labeled cells, the red (labeled cells) and green (all cells) regions of the nucleus were manually outlined. Numerical values (e.g. PA7-innervating region anterior boundary) were measured from individual outlines. For each condition, all outlines were overlaid (center aligned) and the red and green outlines averaged down to a single average outline using the blend tool. Accuracy of average outlines was ensured by alignment to measured numerical values. When overlaying average outlines, all nuclei were scaled to the same length.
Quantification of axon branch distribution of anterior mX neurons by anterograde labeling
At 72hpf, neurons in the anterior 10% of the mX nucleus were photoconverted and >1 hour allowed for diffusion of converted protein into axons before imaging of axon branches. In ImageJ, from maximum intensity projection images of axon branches, a 3.9|mm-thick line was drawn that covered all four PA branches (see Fig. 3A) and Plot Profile tool was used to measure green and red intensity values along that line. A custom Python script was then used to identify the intensity peaks in the green channel that correspond to the axon branches, and to measure the sum of the red and green fluorescence values under those peaks. From these values, the normalized red fluorescence value for each peak was calculated as (red/(red+green)).
Quantification of mX nerve topography using sparse GFP labeling
F0 transgenic embryos were generated as described above, sorted for very sparse GFP labeling of mX neurons, and imaged as in Fig. 3C. To measure the A-P position of the labeled cell, the mX nucleus was manually divided into 10 bins across the A-P axis and the bin in which that cell was contained was noted. The branch which that axon innervated was also noted. In some cases, more than one cell was labeled by GFP; in these cases, we measured the position of the anterior-most GFP+ neuron, and the position of the anterior-most GFP+ axon. This data is graphed as position probability matrices in which the height of numbers on the Y-axis represents the percentage of cells in that position that innervate the indicated branch. We tested whether the target distribution at each position in DN-RAR and CA-RAR was significantly different from that of control using a Fisher’s exact test in R. Posterior regions 5–10 were pooled for this analysis to increase power because we observed low numbers of cells in these regions.
Quantification of mRNA expression domain size
In RNA in situ hybridization images, we measured the length of a line drawn from the anterior edge of the mX nucleus to the posterior boundary of mRNA expression, and divided this by the measured length of the mX nucleus.
Quantification of mX cell number
For the cyp26a1rw716 photoconversion experiments, red and green cells were manually counted from single z-slices through the center of the mX nucleus using the Cell Counter plugin in ImageJ. For the RA and DEAB treatment experiments, z-stacks through the entire mX nucleus were collected, and cell nuclei were counted in 3D using the spots feature of Imaris (Bitplane).
Supplementary Material
Video 1: Anterior & posterior mX axogenesis timing in RA & DEAB treated embryos, related to Figure 4
Time lapse of control, RA, and DEAB treated embryos, represented in Fig. S2H–J, showing the onset of axon formation in anterior (green) and posterior (magenta) mX neurons. Black & white images are color-inverted views of the Kaede-red channel.
Video 2: Disrupted early mX axon targeting in met mutant embryos, related to Figure 4
Time lapse of early axon targeting in control (left) and met8908 mutant (right) embryos starting at 28 hpf. PA formation (magenta) and initial axon outgrowth (green) are indistinguishable between conditions, but, whereas control axons extend to the PAs, met8908 mutant axons stall prior to reaching the PAs.
Video 3, Disrupted late mX axon targeting in met mutant embryos, related to Figure 4
Time lapse of late axon targeting in control (left) and met8908 mutant (right) embryos starting at 50 hpf. PA structure (magenta) is indistinguishable between conditions but, whereas control axons fully innervate PAs 4–7, met8908 mutant axons predominantly stall, with a small subset escaping to innervate PAs 5,6, and 7.
Highlights.
Differential retinoic acid signaling levels specify vagus motor axon target choice
Hgf-Met chemoattractant signaling is required for vagus motor axon guidance
Retinoic acid drives coordinated A-P waves of hgf & met expression
The timing of Hgf-Met signaling determines vagus motor axon target choice
ACKNOWLEDGEMENTS
We thank Rachel Garcia for excellent animal care. Victoria Prince, Ken Poss, Josh Waxman, Jeremy Rabinowitz, Ryan Anderson, and Chuck Kimmel provided transgenic lines, constructs, and reagents. We thank Jeff Delrow and Ryan Basom for assistance with RNAseq, Tim Randolph for statistical assistance, and Taeer Avnon for technical input. We thank all members of the Moens lab for discussion and editing. Funding for this project was provided by NIH grant R01 NS109425 to C.B.M., F32 HD096860 to A.J.I., and F30 NS093703 to G.R.B., as well as American Heart Association grant 18POST33990492 to A.J.I.
Footnotes
DECLARATION OF INTERESTS
The authors declare no competing interests.
Publisher's Disclaimer: This is a PDF file of an unedited manuscript that has been accepted for publication. As a service to our customers we are providing this early version of the manuscript. The manuscript will undergo copyediting, typesetting, and review of the resulting proof before it is published in its final form. Please note that during the production process errors may be discovered which could affect the content, and all legal disclaimers that apply to the journal pertain.
REFERENCES
- Anders S, Pyl PT, and Huber W (2015). HTSeq-A Python framework to work with high-throughput sequencing data. Bioinformatics 31, 166–169. [DOI] [PMC free article] [PubMed] [Google Scholar]
- Anderson RM, Delous M, Bosch JA, Ye L, Robertson MA, Hesselson D, and Stainier DYR (2013). Hepatocyte Growth Factor Signaling in Intrapancreatic Ductal Cells Drives Pancreatic Morphogenesis. PLoS Genet. 9, 1–10. [DOI] [PMC free article] [PubMed] [Google Scholar]
- Bargary G, and Mitchell KJ (2008). Synaesthesia and cortical connectivity. Trends Neurosci. 31, 335–342. [DOI] [PubMed] [Google Scholar]
- Barsh GR, Isabella AJ, and Moens CB (2017). Vagus motor neuron topographic map determined by parallel mechanisms of hox5 expression and time of axon initiation. Curr. Biol 27, 3812–3825. [DOI] [PMC free article] [PubMed] [Google Scholar]
- Bednar JA (2016). Neural Maps: Their Function and Development In From Neuron to Cognition Via Computational Neuroscience, Arbib MA, and Bonaiuto JJ, eds. (MIT press; ), pp. 409–432. [Google Scholar]
- Begemann G, and Meyer A (2001). Hindbrain patterning revisited: Timing and effects of retinoic acid signalling. BioEssays 23, 981–986. [DOI] [PubMed] [Google Scholar]
- Bellon A, and Mann F (2018). Keeping up with advances in axon guidance. Curr. Opin. Neurobiol 53, 183–191. [DOI] [PubMed] [Google Scholar]
- Bieger D, and Hopkins DA (1987). Viscerotopic representation of the upper alimentary tract in the medulla oblongata in the rat: The nucleus ambiguus. J. Comp. Neurol 262, 546–562. [DOI] [PubMed] [Google Scholar]
- Bladt F, Riethmacher D, Isenmann S, Aguzzi A, and Birchmeier C (1995). Essential role for the c-met receptor in the migration of myogenic precursor cells into the limb bud. Nature 376, 768–771. [DOI] [PubMed] [Google Scholar]
- Bottaro D, Rubin J, Faletto D, Chan A, Kmiecik T, Vande Woude G, and Aaronson S (1991). Identification of the hepatocyte growth factor receptor as the c-met proto-oncogene product. Science 251, 802–804. [DOI] [PubMed] [Google Scholar]
- Cai AQ, Radtke K, Linville A, Lander AD, Nie Q, and Schilling TF (2012). Cellular retinoic acid-binding proteins are essential for hindbrain patterning and signal robustness in zebrafish. Development 139, 2150–2155. [DOI] [PMC free article] [PubMed] [Google Scholar]
- Cang J, and Feldheim DA (2013). Developmental Mechanisms of Topographic Map Formation and Alignment. Annu. Rev. Neurosci 36, 51–77. [DOI] [PubMed] [Google Scholar]
- Caton A, Hacker A, Naeem A, Livet J, Maina F, Bladt F, Klein R, Birchmeier C, and Guthrie S (2000). The branchial arches and HGF are growth-promoting and chemoattractant for cranial motor axons. Development 127, 1751–1766. [DOI] [PubMed] [Google Scholar]
- Chen H, Zhang H, Lee J, Liang X, Wu X, Zhu T, Lo PK, Zhang X, and Sukumar S (2007). HOXA5 acts directly downstream of retinoic acid receptor p and contributes to retinoic acid-induced apoptosis and growth inhibition. Cancer Res. 67, 8007–8013. [DOI] [PubMed] [Google Scholar]
- Chklovskii DB, and Koulakov AA (2004). MAPS IN THE BRAIN: What Can We Learn from Them? Annu. Rev. Neurosci 27, 369–392. [DOI] [PubMed] [Google Scholar]
- Comai G, Heude E, Mella S, Paisant S, Pala F, Gallardo M, Kardon G, Gopalakrishnan S, and Tajbakhsh S (2019). A distinct cardiopharyngeal mesoderm genetic hierarchy establishes antero-posterior patterning of esophagus striated muscle. Elife 8, 1–27. [DOI] [PMC free article] [PubMed] [Google Scholar]
- Davey CF, Mathewson AW, and Moens CB (2016). PCP Signaling between Migrating Neurons and their Planar-Polarized Neuroepithelial Environment Controls Filopodial Dynamics and Directional Migration. PLoS Genet. 12, 1–30. [DOI] [PMC free article] [PubMed] [Google Scholar]
- Diez del Corral R, Olivera-martinez I, Goriely A, Gale E, Maden M, and Storey K (2003). Opposing FGF and Retinoid Pathways Control Ventral Neural Pattern, Neuronal Differentiation, and Segmentation during Body Axis Extension. Neuron 40, 65–79. [DOI] [PubMed] [Google Scholar]
- Dobin A, Davis CA, Schlesinger F, Drenkow J, Zaleski C, Jha S, Batut P, Chaisson M, and Gingeras TR (2013). STAR: Ultrafast universal RNA-seq aligner. Bioinformatics 29, 15–21. [DOI] [PMC free article] [PubMed] [Google Scholar]
- Doe CQ (2017). Temporal Patterning in the Drosophila CNS. Annu. Rev. Cell Dev. Biol 33, 219–240. [DOI] [PubMed] [Google Scholar]
- Ebens A, Brose K, Leonardo ED, Hanson MG, Bladt F, Birchmeier C, Barres BA, and Tessier-Lavigne M (1996). Hepatocyte growth factor/scatter factor is an axonal chemoattractant and a neurotrophic factor for spinal motor neurons. Neuron 17, 1157–1172. [DOI] [PubMed] [Google Scholar]
- Eerdunfu, Ihara N, Ligao B, Ikegaya Y, and Takeuchi H (2017). Differential timing of neurogenesis underlies dorsal-ventral topographic projection of olfactory sensory neurons. Neural Dev. 12, 2. [DOI] [PMC free article] [PubMed] [Google Scholar]
- Emoto Y, Wada H, Okamoto H, Kudo A, and Imai Y (2005). Retinoic acid-metabolizing enzyme Cyp26a1 is essential for determining territories of hindbrain and spinal cord in zebrafish. Dev. Biol 278, 415–427. [DOI] [PubMed] [Google Scholar]
- Feng L, Hernandez RE, Waxman JS, Yelon D, and Moens CB (2010). Dhrs3a regulates retinoic acid biosynthesis through a feedback inhibition mechanism. Dev. Biol 338, 1–14. [DOI] [PMC free article] [PubMed] [Google Scholar]
- Ghyselinck NB, and Duester G (2019). Retinoic acid signaling pathways. Development 146, 1–7. [DOI] [PMC free article] [PubMed] [Google Scholar]
- Grant PK, and Moens CB (2010). The neuroepithelial basement membrane serves as a boundary and a substrate for neuron migration in the zebrafish hindbrain. Neural Dev. 5, 9. [DOI] [PMC free article] [PubMed] [Google Scholar]
- Haines L, Neyt C, Gauter P, Keenan DG, Bryson-Richardson RJ, Hollway GE, Cole NJ, and Currie PD (2004). Met and Hgf signaling controls hypaxial muscle and lateral line development in the zebrafish. Development 131, 4857–4869. [DOI] [PubMed] [Google Scholar]
- Helmbacher F, Dessaud E, Arber S, DeLapeyriere O, Henderson CE, Klein R, and Maina F (2003). Met signaling is required for recruitment of motor neurons to PEA3-positive motor pools. Neuron 39, 767–777. [DOI] [PubMed] [Google Scholar]
- Hernandez RE, Putzke AP, Myers JP, Margaretha L, and Moens CB (2007). Cyp26 enzymes generate the retinoic acid response pattern necessary for hindbrain development. Development 134, 177–187. [DOI] [PMC free article] [PubMed] [Google Scholar]
- Higashijima S, Hotta Y, and Okamoto H (2000). Visualization of Cranial Motor Neurons in Live Transgenic Zebrafish Expressing Green Fluorescent Protein Under the Control of the Islet-1 Promoter/Enhancer. J. Neurosci 20, 206–218. [DOI] [PMC free article] [PubMed] [Google Scholar]
- Holguera I, and Desplan C (2018). Neuronal specification in space and time. Science 362, 176–180. [DOI] [PMC free article] [PubMed] [Google Scholar]
- Kam RKT, Shi W, Chan SO, Chen Y, Xu G, Lau CBS, Fung KP, Chan WY, and Zhao H (2013). Dhrs3 protein attenuates retinoic acid signaling and is required for early embryonic patterning. J. Biol. Chem 288, 31477–31487. [DOI] [PMC free article] [PubMed] [Google Scholar]
- Kamitakahara A, Wu HH, and Levitt P (2017). Distinct projection targets define subpopulations of mouse brainstem vagal neurons that express the autism-associated MET receptor tyrosine kinase. J. Comp. Neurol 525, 3787–3808. [DOI] [PMC free article] [PubMed] [Google Scholar]
- Kawaguchi M, and Kataoka H (2014). Mechanisms of hepatocyte growth factor activation in cancer tissues. Cancers (Basel). 6, 1890–1904. [DOI] [PMC free article] [PubMed] [Google Scholar]
- Kim JH, Lee SR, Li LH, Park HJ, Park JH, Lee KY, Kim MK, Shin BA, and Choi SY (2011). High cleavage efficiency of a 2A peptide derived from porcine teschovirus-1 in human cell lines, zebrafish and mice. PLoS One 6, 1–8. [DOI] [PMC free article] [PubMed] [Google Scholar]
- Kimmel CB, Ballard WW, Kimmel SR, Ullmann B, and Schilling TF (1995). Stages of embryonic development of the zebrafish. Dev. Dyn 203, 253–310. [DOI] [PubMed] [Google Scholar]
- Kudoh T, Wilson SW, and Dawid IB (2002). Distinct roles for Fgf, Wnt and retinoic acid in posteriorizing the neural ectoderm. Development 129, 4335–4346. [DOI] [PubMed] [Google Scholar]
- Kulkarni A, Ertekin D, Lee CH, and Hummel T (2016). Birth order dependent growth cone segregation determines synaptic layer identity in the Drosophila visual system. Elife 5, 1–22. [DOI] [PMC free article] [PubMed] [Google Scholar]
- Kumar S, and Duester G (2014). Retinoic acid controls body axis extension by directly repressing Fgf8 transcription. Dev. 141, 2972–2977. [DOI] [PMC free article] [PubMed] [Google Scholar]
- Kwan KM, Fujimoto E, Grabher C, Mangum BD, Hardy ME, Campbell DS, Parant JM, Yost HJ, Kanki JP, and Chien C Bin (2007). The Tol2kit: A multisite gateway-based construction Kit for Tol2 transposon transgenesis constructs. Dev. Dyn 236, 3088–3099. [DOI] [PubMed] [Google Scholar]
- Levine AJ, Lewallen KA, and Pfaff SL (2012). Spatial organization of cortical and spinal neurons controlling motor behavior. Curr. Opin. Neurobiol 22, 812–821. [DOI] [PMC free article] [PubMed] [Google Scholar]
- Liao Y, Smyth GK, and Shi W (2014). FeatureCounts: An efficient general purpose program for assigning sequence reads to genomic features. Bioinformatics 30, 923–930. [DOI] [PubMed] [Google Scholar]
- Login H, Haglin S, Berghard A, and Bohm S (2015). The stimulus-dependent gradient of Cyp26B1+ olfactory sensory neurons is necessary for the functional integrity of the olfactory sensory map. J. Neurosci 35, 13807–13818. [DOI] [PMC free article] [PubMed] [Google Scholar]
- Mark M, Ghyselinck NB, and Chambon P (2004). Retinoic acid signalling in the development of branchial arches. Curr. Opin. Genet. Dev 14, 591–598. [DOI] [PubMed] [Google Scholar]
- Moens CB, and Prince VE (2002). Constructing the hindbrain: Insights from the zebrafish. Dev. Dyn. 224, 1–17. [DOI] [PubMed] [Google Scholar]
- Morita Y, and Finger TE (1985). Topographic and laminar organization of the vagal gustatory system in the goldfish, carassius auratus. J. Comp. Neurol 238, 187–201. [DOI] [PubMed] [Google Scholar]
- Nagelberg D, Wang J, Su R, Torres-Vazquez J, Targoff KL, Poss KD, and Knaut H (2015). Origin, specification, and plasticity of the great vessels of the heart. Curr. Biol 25, 2099–2110. [DOI] [PMC free article] [PubMed] [Google Scholar]
- Nolte C, De Kumar B, and Krumlauf R (2019). Hox genes: Downstream “effectors” of retinoic acid signaling in vertebrate embryogenesis. Genesis 1–17. [DOI] [PubMed] [Google Scholar]
- Novak KD, Prevette D, Wang S, Gould TW, and Oppenheim RW (2000). Hepatocyte growth factor/scatter factor is a neurotrophic survival factor for lumbar but not for other somatic motoneurons in the chick embryo. J. Neurosci 20, 326–337. [DOI] [PMC free article] [PubMed] [Google Scholar]
- Novitch BG, Wichterle H, Jessell TM, and Sockanathan S (2003). A requirement for retinoic acid-mediated transcriptional activation in ventral neural patterning and motor neuron specification. Neuron 40, 81–95. [DOI] [PubMed] [Google Scholar]
- Oosterveen T, Niederreither K, Dolle P, Chambon P, Meijlink F, and Deschamps J (2003). Retinoids regulate the anterior expression boundaries of 5’ Hoxb genes in posterior hindbrain. EMBO J. 22, 262–269. [DOI] [PMC free article] [PubMed] [Google Scholar]
- Papalopulu N, Lovel-badage R, and Krumlauf R (1991). The expression of murine Hox-2 genes id dependent on the differenation pathway and displays a collinear sensitivity to retinoic acid in F9 cels and Xenopus embroys. Nucleic Acids Res. 19, 5497–5506. [DOI] [PMC free article] [PubMed] [Google Scholar]
- Petrovic M, and Hummel T (2008). Temporal identity in axonal target layer recognition. Nature 456, 800–803. [DOI] [PubMed] [Google Scholar]
- Prince VE, Joly L, Ekker M, and Ho RK (1998). Zebrafish hox genes: genomic organization and modified colinear expression patterns in the trunk. Development 125, 407–420. [DOI] [PubMed] [Google Scholar]
- Reiner A, Yekutieli D, and Benjamini Y (2003). Identifying differentially expressed genes using false discovery rate controlling procedures. Bioinformatics 19, 368–375. [DOI] [PubMed] [Google Scholar]
- Rhinn M, and Dolle P (2012). Retinoic acid signalling during development. Development 139, 843–858. [DOI] [PubMed] [Google Scholar]
- Robichaux MA, and Cowan CW (2014). Signaling mechanisms of axon guidance and early synaptogenesis. Curr. Top. Behav. Neurosci 16, 19–48. [DOI] [PubMed] [Google Scholar]
- Robinson MD, McCarthy DJ, and Smyth GK (2009). edgeR: A Bioconductor package for differential expression analysis of digital gene expression data. Bioinformatics 26, 139–140. [DOI] [PMC free article] [PubMed] [Google Scholar]
- Schneider CA, Rasband WS, and Eliceiri KW (2012). NIH Image to ImageJ: 25 years of image analysis. Nat. Methods 9, 671–675. [DOI] [PMC free article] [PubMed] [Google Scholar]
- Sen J, Harpavat S, Peters MA, and Cepko CL (2005). Retinoic acid regulates the expression of dorsoventral topographic guidance molecules in the chick retina. Development 132, 5147–5159. [DOI] [PubMed] [Google Scholar]
- Siegfried KR (2010). In search of determinants: Gene expression during gonadal sex differentiation. J. Fish Biol 76, 1879–1902. [DOI] [PubMed] [Google Scholar]
- Sockanathan S, and Jessell TM (1998). Motor neuron-derived retinoid signaling specifies the subtype identity of spinal motor neurons. Cell 94, 503–514. [DOI] [PubMed] [Google Scholar]
- Sockanathan S, Perlmann T, and Jessell TM (2003). Retinoid receptor signaling in postmitotic motor neurons regulates rostrocaudal positional identity and axonal projection pattern. Neuron 40, 97–111. [DOI] [PubMed] [Google Scholar]
- Sperry RW (1943). Visuomotor coordination in the newt (triturus viridescens) after regeneration of the optic nerve. J. Comp. Neurol 79, 33–55. [Google Scholar]
- Sperry RW (1963). Chemoaffinity in the Orderly Growth of Nerve Fiber Patterns and Connections. Proc. Natl. Acad. Sci 50, 703–710. [DOI] [PMC free article] [PubMed] [Google Scholar]
- Stoeckli E (2017). Where does axon guidance lead us? F1000Research 6, 1–9. [DOI] [PMC free article] [PubMed] [Google Scholar]
- Surmeli G, Akay T, Ippolito GC, Tucker PW, and Jessell TM (2011). Patterns of spinal sensory-motor connectivity prescribed by a dorsoventral positional template. Cell 147, 653–665. [DOI] [PMC free article] [PubMed] [Google Scholar]
- Takeuchi H, Inokuchi K, Aoki M, Suto F, Tsuboi A, Matsuda I, Suzuki M, Aiba A, Serizawa S, Yoshihara Y, et al. (2010). Sequential arrival and graded secretion of Sema3F by olfactory neuron axons specify map topography at the bulb. Cell 141, 1056–1067. [DOI] [PubMed] [Google Scholar]
- Talbot JC, and Amacher SL (2014). A streamlined CRISPR pipeline to reliably generate zebrafish frameshifting alleles. Zebrafish 11, 583–585. [DOI] [PMC free article] [PubMed] [Google Scholar]
- Trapnell C, Pachter L, and Salzberg SL (2009). TopHat: Discovering splice junctions with RNA-Seq. Bioinformatics 25, 1105–1111. [DOI] [PMC free article] [PubMed] [Google Scholar]
- Triplett JW, and Feldheim DA (2012). Eph and ephrin signaling in the formation of topographic maps. Semin. Cell Dev. Biol 23, 7–15. [DOI] [PMC free article] [PubMed] [Google Scholar]
- Uribe RA, Hong SS, and Bronner ME (2017). Retinoic acid temporally orchestrates colonization of the gut by vagal neural crest cells. Dev. Biol. 433, 17–32. [DOI] [PMC free article] [PubMed] [Google Scholar]
- Wang J, Cao J, Dickson AL, and Poss KD (2015). Epicardial regeneration is guided by cardiac outflow tract and Hedgehog signalling. Nature 522, 226–230. [DOI] [PMC free article] [PubMed] [Google Scholar]
- Waxman JS, and Yelon D (2011). Zebrafish retinoic acid receptors function as context-dependent transcriptional activators. Dev. Biol. 352, 128–140. [DOI] [PMC free article] [PubMed] [Google Scholar]
- Westerfield M (2000). The zebrafish book. A guide for the laboratory use of zebrafish (Danio rerio). (University of Oregon Press; ). [Google Scholar]
- Wu HH, and Levitt P (2013). Prenatal expression of MET receptor tyrosine kinase in the fetal mouse dorsal raphe nuclei and the visceral motor/sensory brainstem. Dev. Neurosci 35, 1–16. [DOI] [PMC free article] [PubMed] [Google Scholar]
- Yamamoto Y, Livet J, Pollock RA, Garces A, Arce V, DeLapeyriere O, and Henderson CE (1997). Hepatocyte growth factor (HGF/SF) is a muscle-derived survival factor for a subpopulation of embryonic motoneurons. Development 124, 2903–2913. [DOI] [PubMed] [Google Scholar]
- Zou HY, Li Q, Lee JH, Arango ME, McDonnell SR, Yamazaki S, Koudriakova TB, Alton G, Cui JJ, Kung PP, et al. (2007). An orally available small-molecule inhibitor of c-Met, PF-2341066, exhibits cytoreductive antitumor efficacy through antiproliferative and antiangiogenic mechanisms. Cancer Res. 67, 4408–4417. [DOI] [PubMed] [Google Scholar]
Associated Data
This section collects any data citations, data availability statements, or supplementary materials included in this article.
Supplementary Materials
Video 1: Anterior & posterior mX axogenesis timing in RA & DEAB treated embryos, related to Figure 4
Time lapse of control, RA, and DEAB treated embryos, represented in Fig. S2H–J, showing the onset of axon formation in anterior (green) and posterior (magenta) mX neurons. Black & white images are color-inverted views of the Kaede-red channel.
Video 2: Disrupted early mX axon targeting in met mutant embryos, related to Figure 4
Time lapse of early axon targeting in control (left) and met8908 mutant (right) embryos starting at 28 hpf. PA formation (magenta) and initial axon outgrowth (green) are indistinguishable between conditions, but, whereas control axons extend to the PAs, met8908 mutant axons stall prior to reaching the PAs.
Video 3, Disrupted late mX axon targeting in met mutant embryos, related to Figure 4
Time lapse of late axon targeting in control (left) and met8908 mutant (right) embryos starting at 50 hpf. PA structure (magenta) is indistinguishable between conditions but, whereas control axons fully innervate PAs 4–7, met8908 mutant axons predominantly stall, with a small subset escaping to innervate PAs 5,6, and 7.
Data Availability Statement
Genomic data generated in this study has been deposited to the NCBI Gene Expression Omnibus (GEO) with the following accession numbers: GSE135780 for the A-P experiment, and GSE135781 for the RA experiment. Custom code used in this study has been deposited in the public GitHub repository MoensLab/Isabella_et_al_2019.