. 2020 May 19;9:e54935. doi: 10.7554/eLife.54935

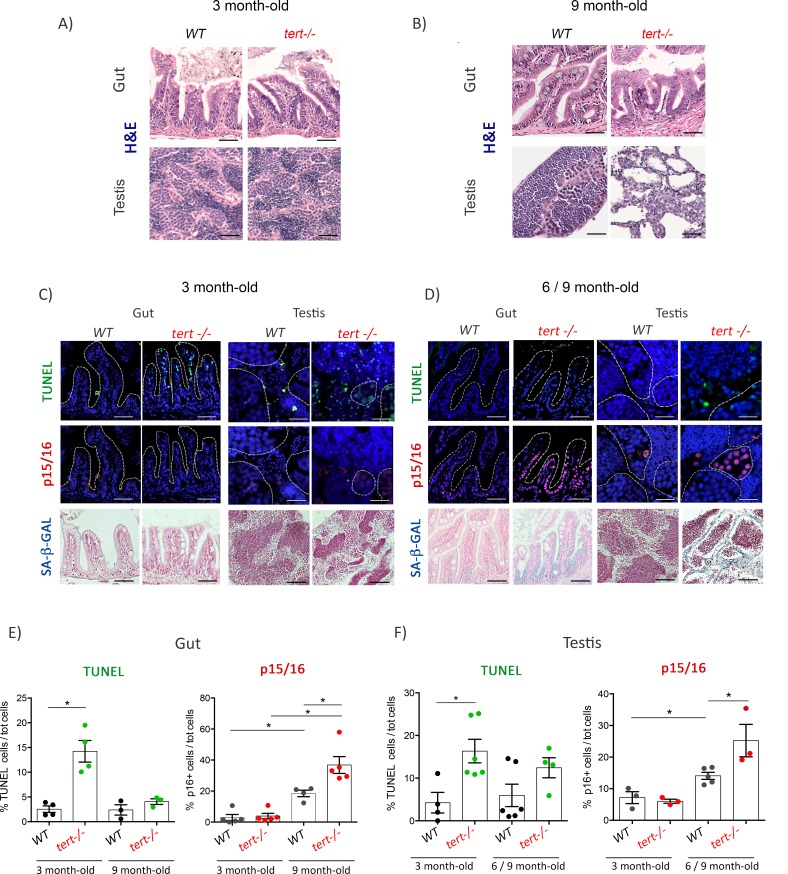
Figure 1. Proliferative tissues of tert-/- zebrafish undergo an in vivo switch from apoptosis to senescence with age.

(A-B) Representative haematoxylin and eosin-stained sections of gut (scale bar: 40 µm) and testis (scale bar: 25 µm) from 3-month-old (A) or 9-month-old (B) of WT and tert-/- siblings. While no macroscopic tissue defects are distinguishable at 3 months (N = 3), 9 month tert-/- (N = 3) exhibit altered gut and testis structures. (C-D) Representative immunofluorescence images of apoptosis (TUNEL) or senescence (p15/16 and SA-β-GAL) of gut and testis from 3 month (C) or 6–9 month-old (D) WT and tert-/- siblings (N = 3–6 each)(scale bar: 25 µm). Dashed outlines locate cysts of spermogonia cells or spermatocytes (testis) or villi (gut). At 3 months, both tissues show an increased number of apoptotic cells in tert-/- compared to WT. At that age, no signs of senescence are visible in these tissues. However, senescent cells appear in the gut and testis of 6–9 month-old tert-/- fish depicting a switch between apoptosis and senescence. (E-F) Quantification of the percentage of TUNEL and p15/16 positive cells in 3 month and 6–9 month-old tert-/- or WT. Data are represented as mean ± SEM. * p-value<0.05; using the Mann-Whitney test.

Figure 1—source data 1. Quantification of TUNEL and p16 positive cells in gut, as plotted in Figure 1E.
Figure 1—source data 2. Quantification of TUNEL and p16 positive cells in testis, as plotted in Figure 1F.

Figure 1.

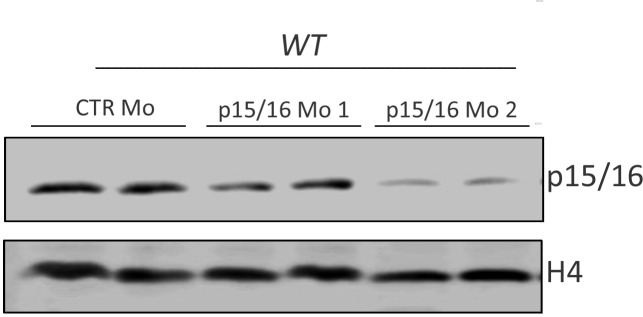
Figure 1—figure supplement 1. Anti-p16 antibody validation in zebrafish through antisense morpholino knock-down of cdkn2a/b (p15/16).

Figure 1—figure supplement 1.

Representative Western blot of p15/16 using 4dpf larvae injected (at 1 cell-stage) with control, 2.4 ng (p15/16 Mo1) or 3.6 ng (p15/16 Mo2) of p15/16 antisense morpholinos. Dose-dependent decrease of p15/16 protein levels with p15/16 morpholinos confirm the specificity of anti-p16 (F-12) (1:50, Santa Cruz Biotechnology, sc-1661) for zebrafish p15/16 protein.
Figure 1—figure supplement 2. Bcl-XL is overexpressed in 9 month but not 3-month-old tert-/-.

Figure 1—figure supplement 2.

RT-qPCR analysis of Bcl-XL in gut and testis of 3- or 9-month-old tert-/- or WT siblings (N = 6 fish). While no differences are seen at 3 months (A), Bcl-XL is overexpressed in 9-month-old (B) tert-/- gut and testis compared to WT. Graphs are representing mean ± SEM mRNA fold increase after normalisation to rpl13a gene expression levels (** p-value<0.01, using t-test).
Figure 1—figure supplement 2—source data 1. Real-time qPCR data of Bcl-XL, as plotted in Figure 1—figure supplement 2.
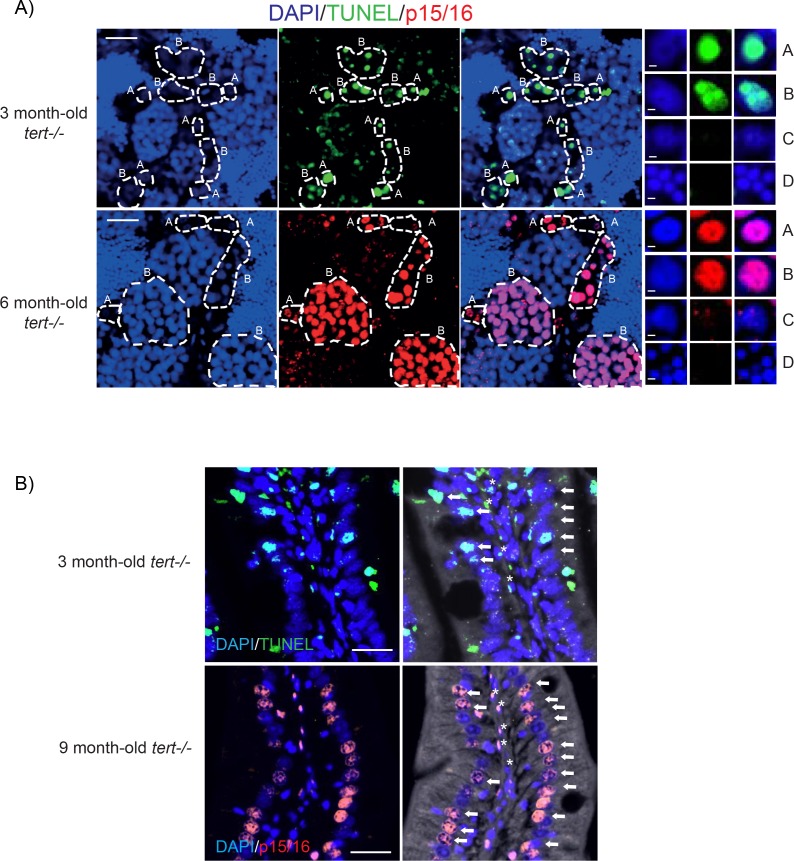
Figure 1—figure supplement 3. Apoptosis and senescence cell fate is present in the same cell types of gut and testis.

Figure 1—figure supplement 3.

(A) Representative immunofluorescence images of apoptosis (TUNEL) or senescence (p15/16 IF) of testis from 3 month or 6-month-old tert-/- fish. Dashed lines delimitate cysts containing spermatogonia A (A) or B (B); scale bar: 20 µm. Right panel depicts examples of every cell type identified (A: spermatogonia A; B: spermatogonia B; C: spermatocytes; D: spermatids/spermatozoids); scale bar: 2 µm. Cell types were identified by their nuclear size and morphology, presence and number of nucleoli, and number of cells per cyst. B) Representative immunofluorescence images of apoptosis (TUNEL) or senescence (p15/16) of gut from 3 month or 9-month-old tert-/- fish. Arrows represent enterocyte cells; asterisks show blood cells). Cell types were identified by cell morphology and location. Scale bars: 20 µm.