

Abstract
Cycles of heavy drinking and abstinence can lead to ethanol abuse disorder. We studied the effects of chronic intermittent ethanol exposure (CIE) over three weeks on neuroblastoma cells, using an ethanol concentration frequently attained in binge drinking (40 mM, 184 mg/dl). There were many changes in gene expression but most were small. CIE affected pathways instrumental in the development or plasticity of neurons, including axonal guidance, reelin signaling and synaptogenesis. Genes involved in dopamine and serotonin signaling were also affected. Changes in transporters and receptors could dampen both NMDA and norepinephrine transmissions. Decreased expression of the GABA transporter SLC6A11 could increase GABA transmission and has been associated with a switch from sweet drinking to ethanol consumption in rats. Ethanol increased stress responses such as unfolded protein response. TGF-β and NFκB signaling were increased. Most of the genes involved in cholesterol biosynthesis were decreased in expression. Withdrawal for 24 h after CIE caused most of the CIE-induced expression changes to move back toward unexposed levels.
Keywords: alcohol, binge drinking, withdrawal, gene expression, SH-SY5Y cells
Introduction
In the United States, 8.5% of adults age 18 and older have met criteria for alcohol use disorders in the last 12 months, and 30.3% have met them at some point in their lifetime (Hasin & Grant, 2015). The economic burden of alcohol misuse in the US was recently estimated at $249 billion per year, with three quarters of the total cost related to binge drinking (Sacks, Gonzales, Bouchery, Tomedi, & Brewer, 2015). In 2012–2013, 33% of US adults reported past year drinking at binge levels (five drinks or more for men and four drinks or more for women, over 2 hours). Many drank at binge levels at least weekly (Hingson, Zha, & White, 2017) and 13% reporting drinking beyond twice binge level, defined by NIAAA as “high intensity drinking” (Hingson et al., 2017).
We modeled the effects of repeated binge drinking on a neuroblastoma cell line, using chronic intermittent exposure to ethanol (CIE). This model will be useful to determine whether the effects of repeated ethanol exposures differ from those seen after single acute exposure (e.g. McClintick et al., 2014; McClintick et al., 2019). CIE has been modeled in animals in several ways (Becker & Lopez, 2004; Bell, Rodd, Engleman, Toalston, & McBride, 2014; Jury et al., 2017; McClintick et al., 2015). The Becker protocol in many mice studies uses four 16 h cycles of ethanol vapor separated by 8 h periods of withdrawal (Becker & Lopez, 2004; Jury et al., 2017). In P (alcohol preferring) and HAD (high alcohol drinking) rat strains, which voluntarily consume ethanol, several different multiple scheduled access protocols have been used, including a single 2 h or 4 h bout, or four 1 h bouts during the dark cycle, usually for 5 days a week for 3–4 weeks (Bell et al., 2014; McBride et al., 2013; McClintick et al., 2015). These protocols can achieve high blood alcohol levels (BEC); using voluntary consumption methods, P rats reached BEC of 40–90 mg/dl (8.7 – 19.5 mM) (Bell et al., 2014); with ethanol vapor chambers BEC of 175–325 mg/dl (38 – 70 mM) can be achieved (Jury et al., 2017; Melendez, 2011).
We chose the neuroblastoma cell line SH-SY5Y as a model, because it expresses more of the genes found in brain tissue than other readily available cells. Among these are dopamine receptor D2 (DRD2), two serotonin receptors, three opioid receptors (OPRM1, OPRD1, OPRL1) several GABA(A) receptor subunits, three metabotropic glutamate receptors (GRM7, GRM2 & GRM8), subunits of AMPA, NMDA and kainate iontropic receptors, nicotinic and muscarinic cholinergic receptor subunits, and two adrenergic receptors (ADRA2A and ADRA2C).
We repeatedly exposed the SH-SY5Y cells to 40 mM ethanol for 4 h per day, 4 days per week over 3 weeks. This concentration is equivalent to a blood alcohol concentration of 0.18%, which can be reached by a 180-pound man drinking about 7 beers over 2 h, and is below the level defined as “high intensity drinking” (Hingson et al., 2017). We found that the expression of many genes was affected. We also examined the effect of a 24 h withdrawal after the last exposure, and found most of those genes returned toward baseline expression.
Methods
Cell culture and ethanol treatment of SH-SY5Y cells
SH-SY5Y cells (CRL-2266, Lot 63724189, ATCC, Manassas, VA) were cultured in a 1:1 mixture of EMEM (ATCC) and F12K medium (10025-CV, Thermo Fisher Scientific) with 10% (vol/vol) fetal bovine serum (ATCC) and 1% penicillin and streptomycin. Cells were plated at a density of 1.5 × 10⁶ in 25 cm2 canted neck flasks (Corning, Corning, NY). We modeled chronic intermittent exposure to ethanol (CIE) by using a pattern of 4 h exposure to 40 mM ethanol on 4 successive days, followed by 3 days without, repeated for 3 weeks (see Supplementary Figure 1). One hour after seeding, the cells were treated for 4 h with a “binge level” concentration of ethanol (40 mM) or left untreated, after which both sets of cells were washed with 4 mL 1X phosphate-buffered saline (PBS), and medium without ethanol was added. The 4 h ethanol exposure, wash and fresh medium was repeated Monday through Thursday for one pair of samples and Tuesday through Friday for a second. After washing the cells on Thursday (or Friday for the second pair), all dishes were split and plated in medium without ethanol until the following Monday. This pattern was repeated in week 2. In week 3, the treated group was split into two flasks on Monday (or Tuesday) and both were treated with ethanol as above for 3 days but on Thursday (or Friday), one group was treated with 40 mM ethanol for 4 h, the other received medium without ethanol. All cells were collected after 4 h. RNA was extracted using a Direct-zol DNA/RNA miniprep kit (R2080, Zymo Research, www.zymoresearch.com) per manufacturer’s instructions. The repeated washings and media changes removed most non-adherent cells, so the cells being studied were primarily adherent. Six independent biological replicates were conducted for each condition, with each pair of samples starting in on a new day (Monday or Tuesday of 3 successive weeks). The experiment thus spanned 5 weeks, during which cells were from passages 6 to 14 after receipt from ATCC.
RNA sequencing
Total RNA was evaluated for its quantity and quality using an Agilent Bioanalyzer 2100; RNA integrity numbers were all greater than 9. Fifty nanograms of total RNA was used for each sequencing library. cDNA library preparation was carried out at the Center for Medical Genomics, and included mRNA enrichment using oligo dT-beads to capture polyA RNA, RNA fragmentation, cDNA synthesis, ligation of index adaptors, and amplification, following the KAPA mRNA Hyper Prep Kit Technical Data Sheet, KR1352 – v4.17 (Roche Corporate). Each resulting indexed library was quantified and its quality accessed by Qubit and Agilent Bioanalyzer, and all libraries were pooled at equal molarity. Five microliter aliquots of 2 nM pooled libraries per lane were denatured, neutralized and applied to flow cell deposition on both surfaces of the flow cell; library cluster amplification was performed on a cBot 2 System (Illumina, Inc.). The resulting flow cell was sequenced on an Illumina HiSeq 4000, 75 base paired-end sequencing (Illumina, Inc.). Approximately 30 M reads per library were generated (minimum 26.5 M, maximum 35.4 M). A Phred quality score (Q score) was used to measure the quality of sequencing. More than 90% of the sequencing reads reached Q30 (99.9% base call accuracy).
Sequence alignment and gene counts
The sequencing data were first assessed for quality control using FastQC (v.0.11.5, Babraham Bioinformatics, Cambridge, UK). Then all sequenced libraries were mapped to the human genome (GRCh38/hg38) using the STAR RNA-seq aligner (v.2.5) (Dobin et al., 2013) with the following parameter: “--outSAMmapqUnique 60”. The reads distribution across the genome was assessed using bamutils (from ngsutils v.0.5.9) (Breese & Liu, 2013). Uniquely mapped sequencing reads were assigned to GRCh38/hg38 refGene genes using featureCounts (subread v.1.5.1) (Liao, Smyth, Shi, 2014) with the following parameters: “−s 2 –p –Q 10”.
Analyses
Reads aligned to known genes were analyzed by edgeR (Robinson, McCarthy, & Smyth, 2010); median alignments per sample was 20.7 M (minimum 17.7 M, maximum 24.1 M). Counts were normalized to counts per million reads (CPM) for each sample. Data were examined by Multidimentional Scaling in the edgeR package (Robinson et al., 2010) to detect outliers. Most samples clustered by experimental replicate, but one outlier was detected (Supplementary Figure 2), so all 3 samples from the replicate containing the outlier were removed from analyses, leaving 5 sets of 3 samples each: untreated, repeatedly treated (CIE), and repeatedly treated but withdrawn for 24 h (CIE+withdrawn). The MDS plot without the omitted samples (Supplementary Figure 3) indicates that there is a batch effect by replicate therefore analysis included replicate as a factor. To avoid analyzing genes that were not expressed or expressed at near background levels, only genes that had 2 or more CPM in at least 5 samples were retained for analysis (cf. (McClintick & Edenberg, 2006). Paired analysis was done based on experimental replicate: ethanol vs. controls, ethanol vs. ethanol withdrawal, and ethanol withdrawal vs. controls. False discovery rates (FDR) were calculated using the method of Benjamini & Hochberg (Benjamini & Hochberg, 1995) within edgeR.
GTEx data (GTEx Consortium, 2013; Lonsdale et al., 2013) were used to determine whether the gene was expressed in brain tissue. We considered any gene expressed at ≥ 1 Transcripts Per kilobase Million (TPM; read counts per million reads divided by length of transcript in kb) in any brain region to be significantly expressed in brain.
Qiagen’s Ingenuity Pathway Analysis Spring 2019 release (IPA; QIAGEN Inc., www.qiagenbioinformatics.com/products/ingenuitypathway-analysis) was used to analyze genes that were differentially expressed when treated with ethanol (at FDR < 0.20; using “Base Genes only” as background). Pathways were limited to those with FDR < 0.20 and 5 or more differentially expressed genes. The results for the upstream analysis were limited to those entries with absolute z-score ≥ 1.9.
The genes in Table 1 (FDR< 0.20, absolute fold ≥ 1.2) were imported into FUMA Version: 1.3.5e (27 May 2019) (Watanabe, Taskesen, van Bochoven, & Posthuma, 2017) at 2019-11-17 20:17:42 for GENE2FUNC analysis vs. GTEx version 8 all genes using standard parameters with minimum overlap set to 5 differentially expressed genes and FDR < 0.2.
Table 1.
Expression changes in SH-SY5Y neuroblastoma cells due to chronic intermittent ethanol treatment (40mM). Genes with FDR < 0.20, absolute fold changes > 1.2. (subset of Supplementary Table S1). EvC: ethanol vs. control.
| Gene Symbol | Gene Name | Fold Ethanol vs. Control | FDR |
|---|---|---|---|
| GPRC5C | G protein-coupled receptor class C group 5 member C | 1.68 | 2.86E-04 |
| RHBDF1 | rhomboid 5 homolog 1 | 1.54 | 4.70E-02 |
| LRRC29 | leucine rich repeat containing 29 | 1.54 | 1.42E-02 |
| ZNF433 | zinc finger protein 433 | 1.51 | 3.07E-04 |
| SLC16A14 | solute carrier family 16 member 14 | 1.50 | 9.97E-13 |
| ARMC12 | armadillo repeat containing 12 | 1.50 | 2.27E-04 |
| WTIP | WT1 interacting protein | 1.48 | 7.07E-03 |
| FZD5 | frizzled class receptor 5 | 1.47 | 9.50E-04 |
| FAM129A | family with sequence similarity 129 member A | 1.46 | 1.40E-01 |
| CDHR3 | cadherin related family member 3 | 1.46 | 8.31E-03 |
| MYLK-AS1 | MYLK antisense RNA 1 | −1.44 | 1.65E-02 |
| GPRIN2 | G protein regulated inducer of neurite outgrowth 2 | 1.42 | 1.72E-02 |
| CELSR1 | cadherin EGF LAG seven-pass G-type receptor 1 | 1.40 | 7.70E-02 |
| HGFAC | HGF activator | 1.40 | 1.02E-03 |
| LOC100272217 | uncharacterized LOC100272217 | −1.40 | 1.18E-02 |
| SLC2A10 | solute carrier family 2 member 10; class III facilitative glucose transporter | 1.39 | 2.15E-03 |
| PRNP | prion protein | 1.38 | 2.39E-04 |
| LINC00473 | long intergenic non-protein coding RNA 473 | 1.37 | 2.98E-03 |
| LOC100130992 | uncharacterized LOC100130992 | −1.36 | 8.50E-02 |
| ZNF844 | zinc finger protein 844 | 1.36 | 2.65E-07 |
| KLHL35 | kelch like family member 35 | 1.36 | 1.33E-01 |
| PTH1R | parathyroid hormone 1 receptor | 1.36 | 2.16E-02 |
| TMEM200C | transmembrane protein 200C | 1.35 | 3.85E-02 |
| GAS1 | growth arrest specific 1 | 1.34 | 1.45E-04 |
| WNT5A | Wnt family member 5A | 1.34 | 1.06E-01 |
| GUSBP5 | glucuronidase, beta pseudogene 5 | −1.34 | 1.96E-01 |
| CMAHP | cytidine monophospho-N-acetylneuraminic acid hydroxylase, pseudogene | −1.33 | 4.00E-03 |
| LBX2-AS1 | LBX2 antisense RNA 1 | 1.33 | 1.17E-02 |
| DLK2 | delta like non-canonical Notch ligand 2 | 1.33 | 9.22E-02 |
| LTB4R | leukotriene B4 receptor | 1.32 | 4.34E-07 |
| RPL21P28 | ribosomal protein L21 pseudogene 28 | −1.32 | 1.96E-02 |
| SERTM2 | serine rich and transmembrane domain containing 2 | −1.32 | 3.32E-14 |
| TMC7 | transmembrane channel like 7 | 1.32 | 7.54E-02 |
| CCM2L | CCM2 like scaffold protein | 1.32 | 5.03E-02 |
| KLF3-AS1 | KLF3 antisense RNA 1 | −1.32 | 1.02E-01 |
| ICAM3 | intercellular adhesion molecule 3 | 1.32 | 1.55E-01 |
| LOC100996419 | uncharacterized LOC100996419 | −1.31 | 1.92E-01 |
| TBXAS1 | thromboxane A synthase 1 | −1.31 | 2.29E-02 |
| STARD8 | StAR related lipid transfer domain containing 8 | 1.31 | 1.30E-01 |
| NRTN | neurturin | 1.31 | 5.47E-03 |
| PACRG | parkin coregulated | 1.30 | 1.09E-01 |
| LOC105373156 | uncharacterized LOC105373156 | −1.30 | 9.10E-02 |
| TMEM266 | transmembrane protein 266 | 1.29 | 1.09E-01 |
| MIR4458HG | MIR4458 host gene | −1.29 | 2.57E-03 |
| RN7SL832P | RNA, 7SL, cytoplasmic 832, pseudogene | −1.29 | 7.10E-02 |
| DENND1B | DENN domain containing 1B | 1.29 | 1.49E-01 |
| EXOC3-AS1 | EXOC3 antisense RNA 1 | −1.29 | 1.95E-03 |
| ABHD11 | abhydrolase domain containing 11 | −1.29 | 9.16E-04 |
| ITPKB | inositol-trisphosphate 3-kinase B | 1.29 | 1.73E-04 |
| JCAD | junctional cadherin 5 associated | 1.28 | 1.93E-01 |
| PCF11-AS1 | PCF11 antisense RNA 1 | −1.28 | 5.48E-02 |
| USP44 | ubiquitin specific peptidase 44 | 1.28 | 1.99E-02 |
| ROR1-AS1 | ROR1 antisense RNA 1 | −1.28 | 1.39E-02 |
| MKLN1-AS | MKLN1 antisense RNA | 1.28 | 1.65E-01 |
| KCNH6 | potassium voltage-gated channel subfamily H member 6 | 1.28 | 8.39E-02 |
| UBTD1 | ubiquitin domain containing 1 | 1.28 | 2.82E-02 |
| SUSD5 | sushi domain containing 5 | 1.27 | 1.79E-01 |
| MIR3064 | microRNA 3064 | −1.27 | 9.74E-04 |
| KCNC4 | potassium voltage-gated channel subfamily C member 4 | 1.27 | 3.24E-02 |
| LDLRAD4 | low density lipoprotein receptor class A domain containing 4 | 1.27 | 8.43E-07 |
| FAT1 | FAT atypical cadherin 1 | 1.27 | 1.32E-03 |
| FAM78A | family with sequence similarity 78 member A | 1.27 | 1.14E-04 |
| LOC107984035 | uncharacterized LOC107984035 | −1.27 | 1.41E-01 |
| AJM1 | apical junction component 1 homolog | 1.27 | 1.14E-01 |
| FBXO32 | F-box protein 32 | 1.26 | 5.19E-04 |
| BAG3 | BCL2 associated athanogene 3 | 1.26 | 6.11E-03 |
| LRIG1 | leucine rich repeats and immunoglobulin like domains 1 | 1.26 | 1. 16E-01 |
| SLC16A9 | solute carrier family 16 member 9 | 1.26 | 1.52E-09 |
| MAN1C1 | mannosidase alpha class 1C member 1 | 1.26 | 2.75E-02 |
| INHBA | inhibin subunit beta A | −1.26 | 9.69E-02 |
| HTRA1 | HtrA serine peptidase 1 | 1.26 | 3.09E-02 |
| SLC6A9 | solute carrier family 6 member 9, glycine | 1.26 | 6.10E-02 |
| SWSAP1 | SWIM-type zinc finger 7 associated protein 1 | −1.26 | 1.85E-01 |
| KCNB1 | potassium voltage-gated channel subfamily B member 1 | 1.25 | 9.93E-07 |
| HIST2H2BE | histone cluster 2 H2B family member e | −1.25 | 5.58E-03 |
| SMIM18 | small integral membrane protein 18 | −1.25 | 1.05E-01 |
| JAK3 | Janus kinase 3 | −1.25 | 1.69E-01 |
| OLFML2B | olfactomedin like 2B | 1.25 | 7.65E-02 |
| PTPN3 | protein tyrosine phosphatase, non-receptor type 3 | 1.25 | 1.73E-01 |
| MEF2C | myocyte enhancer factor 2C | 1.25 | 4.11E-02 |
| SPRY1 | sprouty RTK signaling antagonist 1 | −1.25 | 4.16E-03 |
| MGEA5 | new symbol OGA O-GlcNAcase | 1.25 | 8.39E-14 |
| GRASP | general receptor for phosphoinositides 1 associated scaffold protein | 1.25 | 1.29E-01 |
| TRIM9 | tripartite motif containing 9 | 1.24 | 3.34E-02 |
| ANKRD1 | ankyrin repeat domain 1 | −1.24 | 1.09E-01 |
| LOC100506282 | uncharacterized LOC100506282 | −1.24 | 1.17E-01 |
| NBAT1 | neuroblastoma associated transcript 1 | −1.24 | 1.41E-01 |
| NIPAL2 | NIPA like domain containing 2 | 1.24 | 1.28E-01 |
| LINC00638 | long intergenic non-protein coding RNA 638 | 1.24 | 1.73E-01 |
| CEBPB | CCAAT enhancer binding protein beta | 1.23 | 1.98E-02 |
| EMILIN2 | elastin microfibril interfacer 2 | 1.23 | 1.40E-01 |
| ZNF441 | zinc finger protein 441 | 1.23 | 1.54E-04 |
| C17orf51 | chromosome 17 open reading frame 51 | 1.23 | 5.46E-03 |
| ERVMER34–1 | endogenous retrovirus group MER34 member 1, envelope | 1.23 | 9.78E-02 |
| SYBU | syntabulin | 1.23 | 2.48E-02 |
| ABHD15 | abhydrolase domain containing 15 | 1.23 | 6.63E-02 |
| QRICH2 | glutamine rich 2 | 1.23 | 3.25E-03 |
| LOC100287015 | uncharacterized LOC100287015 | −1.23 | 8.50E-02 |
| JDP2 | Jun dimerization protein 2 | 1.22 | 1.09E-01 |
| HLX | H2.0 like homeobox | 1.22 | 1.70E-01 |
| CHST8 | carbohydrate sulfotransferase 8 | 1.22 | 3.09E-05 |
| LINC01003 | long intergenic non-protein coding RNA 1003 | −1.22 | 5.58E-03 |
| WSCD2 | WSC domain containing 2 | 1.22 | 1.91E-01 |
| LINC00526 | long intergenic non-protein coding RNA 526 | −1.22 | 1.79E-01 |
| SMAD6 | SMAD family member 6 | 1.22 | 5.67E-07 |
| DGAT2 | diacylglycerol O-acyltransferase 2 | 1.22 | 1.69E-01 |
| SESN2 | sestrin 2 | 1.22 | 3.83E-03 |
| MIR17HG | miR-17–92a-1 cluster host gene | −1.22 | 1.44E-02 |
| HAPLN3 | hyaluronan and proteoglycan link protein 3 | 1.22 | 1.51E-01 |
| CCDC3 | coiled-coil domain containing 3 | 1.22 | 2.65E-02 |
| CCDC61 | coiled-coil domain containing 61 | −1.21 | 7.70E-02 |
| TGFBR2 | transforming growth factor beta receptor 2 | 1.21 | 1.09E-01 |
| KCTD16 | potassium channel tetramerization domain containing 16 | 1.21 | 1.30E-01 |
| SLCO1A2 | solute carrier organic anion transporter family member 1A2 | −1.21 | 1.92E-01 |
| TUFT1 | tuftelin 1 | 1.21 | 3.27E-03 |
| RWDD2B | RWD domain containing 2B | −1.21 | 5.38E-07 |
| CLYBL | citrate lyase beta like | −1.21 | 1.36E-01 |
| PXDC1 | PX domain containing 1 | 1.21 | 1.60E-01 |
| WNT6 | Wnt family member 6 | 1.21 | 9.10E-02 |
| SWI5 | SWI5 homologous recombination repair protein | 1.21 | 1.01E-01 |
| ADAMTS9-AS2 | ADAMTS9 antisense RNA 2 | −1.21 | 1.59E-01 |
| LOC150051 | uncharacterized LOC150051 | −1.21 | 1.41E-01 |
| TSPEAR-AS2 | TSPEAR antisense RNA 2 | −1.21 | 3.27E-09 |
| FZD4 | frizzled class receptor 4 | 1.21 | 3.15E-02 |
| GABPB1-IT1 | GABPB1 intronic transcript | −1.21 | 8.43E-07 |
| CCEPR | cervical carcinoma expressed PCNA regulatory lncRNA | −1.21 | 2.07E-04 |
| TYSND1 | trypsin domain containing 1 | 1.20 | 7.20E-04 |
| NOTCH1 | notch 1 | 1.20 | 9.73E-02 |
| FUT10 | fucosyltransferase 10 | 1.20 | 1.44E-02 |
| CHST15 | carbohydrate sulfotransferase 15 | 1.20 | 4.07E-02 |
| ONECUT2 | one cut homeobox 2 | 1.20 | 1.76E-01 |
| ADCK2 | aarF domain containing kinase 2 | 1.20 | 4.03E-03 |
| ADRA2C | adrenoceptor alpha 2C | 1.20 | 4.83E-03 |
Results
To determine the effects of repeated ethanol exposure on SH-SY5Y neuroblastoma cells, we used a 3-week chronic intermittent exposure to ethanol (CIE) paradigm. Cells were exposed to 40 mM ethanol (or control) for 4 h per day on 4 successive days, followed by 3 days without ethanol, for 3 weeks. The repeated exposures were akin to three weeks of binge drinking on 4 successive days with 3 abstinent days in between. The 40 mM ethanol dose is equivalent to a blood alcohol concentration of 0.18%, which can be surpassed in a bout of high intensity drinking. On the last week, after 3 days of exposure, half of the ethanol-treated cells were withdrawn for 24 h while the other half received the fourth 4 h exposure (Supplementary Figure 1), to determine how much recovery occurred in that time. The only ADH detectably expressed in these cells is ADH5, which has a very high Km for ethanol and is not likely to carry out significant metabolism; mRNA levels are the same under all 3 conditions and very similar to the levels seen in various brain regions in GTEx.
Ethanol Exposure vs. Control
In these SH-SY5Y cells, 12,599 genes were expressed significantly over background, 97% of which were also expressed in at least one human brain region. CIE led to the differential expression of 1,498 genes at FDR < 0.20 (Supplementary Table S1; all data have been deposited into GEO, accession number GSE139408); 744 (50%) were decreased in expression. Most of the changes were small, with 91% (1365) having an absolute fold change ≤ 1.2 (full list in Supplementary Table S1). The 133 genes with absolute fold change ≥ 1.2 are listed in Table 1. Among the differentially expressed genes were those related to neuron function or development, including AMPA glutamate receptor subunit (GRIA2), ephrin B2 (EFNB2) and two ephrin receptors (EPHA2, EPHB4), genes encoding proteins that degrade neurotransmitters (MAOB and COMT), and dopa decarboxylase which produces dopamine and serotonin. Norepinephrine transporter SLC6A2 and glycine transporter SLC6A9 were increased in expression, while GABA transporter SLC6A11 was decreased; all three remove their respective neurotransmitter from the synaptic cleft. Several voltage-gated potassium channel subunits were increased in expression as were three calcium channel subunits. Calcium subunit CACNA2D2 had decreased expression. Several genes that are important for signaling were found in multiple affected pathways; these include MAP/ERK kinases (MAPK1, MAPK12, MAP2K1, MAP2K12, MAP3K1, MAP3K3), GAB1 and IRS1 that activate ERK signaling by binding to GRB2, and adenylate cyclases (ADCY1, ADCY3, ADCY6 and ADCY9; all with increased expression). Genes involved in neural development, axon growth, synaptogenesis, etc. were affected by ethanol, including growth factor receptors FGFR1 and FGFR2, WNT5A, and four frizzled receptors, FZD2, FZD4, FZD5 and FZD7 (all increased).
IPA identified 114 pathways that met FDR < 0.20 and contained at least 5 differentially expressed genes (Supplementary Table S2). [Several of the pathways were redundant, sharing all or most of their genes with another pathway.] The most significant pathway that was affected by CIE was cholesterol biosynthesis; the rate-limiting gene for cholesterol production, HMGCR, and 10 other genes in that pathway showed decreased expression after CIE. Pathways that showed overall activation (i.e., had positive z-scores) include dopamine receptor signaling, TGF-β signaling, and synaptogenesis signaling. Other affected pathways important in neurons were reelin signaling in neurons, axonal guidance, Ephrin A signaling, and GABA receptor signaling.
The Unfolded Protein Response pathway had many genes increased in expression. Many of these pathways are driven by a core set of genes: the adenylate cyclases, fibroblast growth factor receptors, WNTs, MAP kinases and frizzled receptors.
Upstream regulator analysis identified putative proteins and chemicals that may be responsible for the pattern of changes in expression (Supplementary Tables S3 & S4, respectively). This analysis indicated increased activity for TP53, NFκB, INSIG1, cAMP and ATF4, genes that regulate large numbers of other genes, as well as dexamethasone, which indicates changes similar to cortisol treatment. Regulators that appear to be less active include HIF1A, RARA, insulin receptor, estrogen receptor and SREBF1/2. SREBF1/2 regulate the expression of genes in the cholesterol pathway.
Effects of Withdrawal
CIE-treated samples that were withdrawn from ethanol for the 24 h before harvest were very similar to the controls that had not been exposed to ethanol at all during the 3 weeks. Only 9 genes differed from the unexposed cells at FDR < 0.20. Four of these had changes similar to the effects of ethanol treatment without withdrawal, while the other 5 did not have significant changes after ethanol alone (Supplementary Table S1).
The comparison of ethanol exposed cells to cells withdrawn for 24 h reinforced this: it was very similar to the comparison of exposed cells to the control cells. The correlation of expression levels was quite good (Figure 1; the coefficient for the regression line was 1.1, R2=0.83), suggesting that the recovery was mostly but not quite complete after the 24 h withdrawal.
Figure 1.
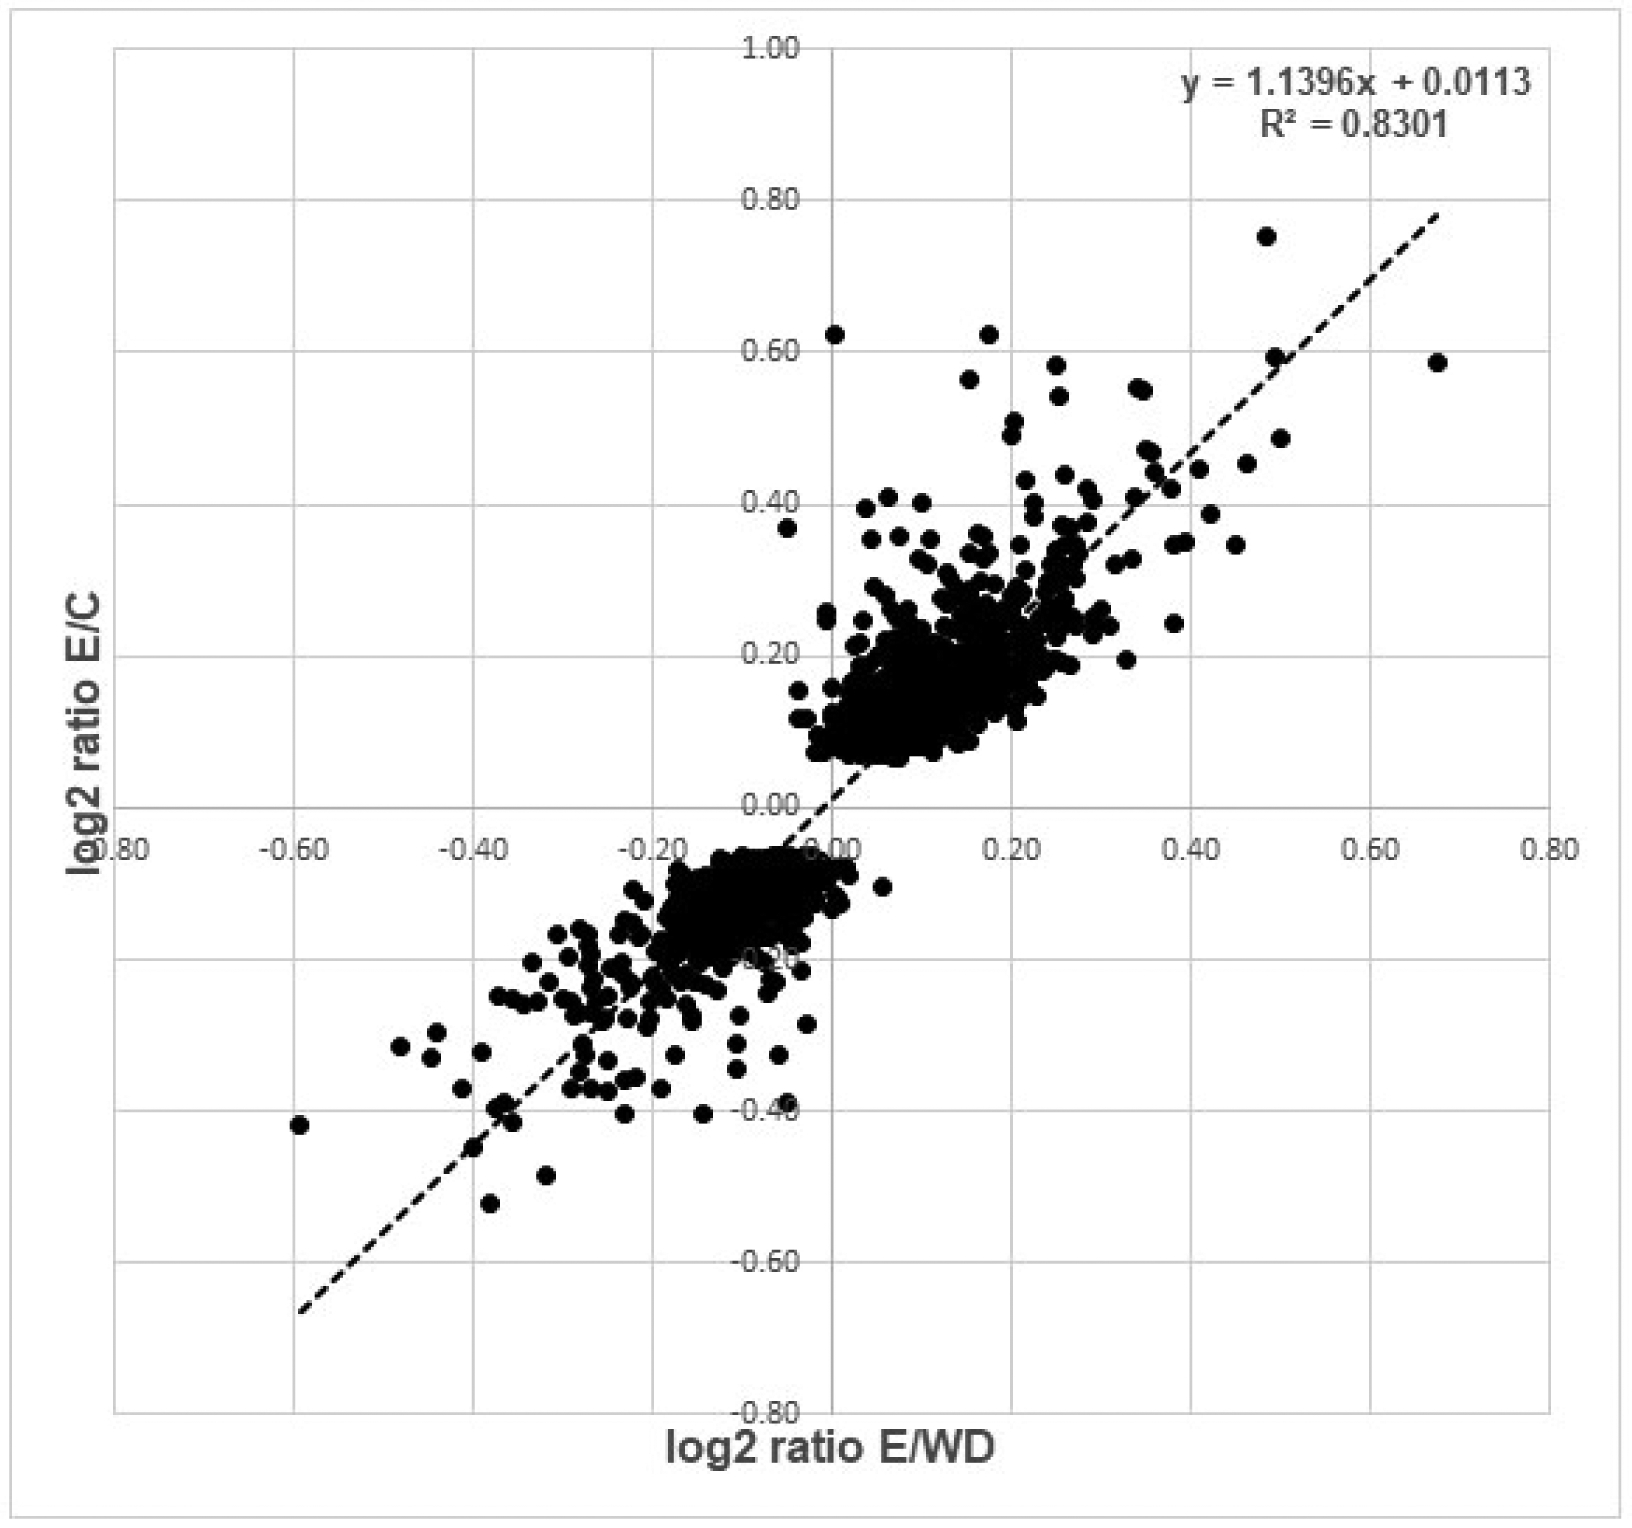
Scatter plot of log2 ratios comparing ethanol treatment to control (y-axis) and ethanol treatment to ethanol plus 24h withdrawal (x-axis). Genes shown differ in expression between ethanol vs. control at FDR < 0.20.
We analyzed the genes in Table 1 using FUMA GENE2FUNC analysis (Watanabe et al., 2017). This highlighted GO cellular components neuron, synapse, post-synapse, and synapse part (Supplementary Table S5). Other functional entries include epithelial to mesenchymal transition, pluripotency, neurogenesis, neuron cell death and neuron differentiation
Discussion
A series of repeated exposures of SH-SY5Y neuroblastoma cells to binge-drinking levels of ethanol over 3 weeks (CIE) led to changes in the expression of many genes, although most changes were of small magnitude (Supplementary Table S1). These fell into a number of pathways relevant to neuronal cells, many of which have been shown to be affected in the brains of animals exposed to CIE. Perhaps surprisingly, nearly all of the changes returned toward control levels after only 24 h without ethanol.
The CIE treatment led to lower expression of most of the genes in the cholesterol biosynthesis pathway. Three brain regions, dorsal raphe nucleus, periaqueductal gray, and ventral hippocampus, from CIE treated adolescent P rats also had lower expression of cholesterol synthesis genes (McClintick et al., 2015, 2016, 2018). Lower expression of the genes in cholesterol biosynthesis pathway was also detected in lymphoblastoid cell lines (LCLs) from alcoholics, compared to cells from controls (McClintick et al., 2019), although 48 h treatment with 75mM ethanol to LCLs did not result in decreased expression of these genes (McClintick et al., 2019). Lower expression was also found in post-mortem frontal cortex, basolateral amygdala and temporal cortex of alcoholics compared to controls (Mayfield et al., 2002; Ponomarev, Wang, Zhang, Harris, & Mayfield, 2012; Sokolov, Jiang, Trivedi, & Aston, 2003).
Genes affected by CIE fell into several pathways associated with neuronal development and/or plasticity (Supplementary Table S2). Fifty-eight genes in the axonal guidance pathway were affected, among which 38 were increased in expression (including frizzled and ephrin receptors, semaphorins and plexins), but the tubulins were decreased in expression. Tubulins make up microtubules necessary for development and movement of neurons (Breuss, Leca, Gstrein, Hansen, & Keays, 2017). Related pathways that share some of the same genes include reelin signaling in neurons, Ephrin A signaling, synaptogenesis signaling, and Wnt/β-catenin signaling. Reelin signaling is important in neuronal migration and modulation of synaptic functions (Lee & D’Arcangelo, 2016). TGF-β signaling, involved in late-stage adult neurogenesis (He et al., 2014), showed an overall increase in activity. All of these pathways except synaptogenesis were affected in at least one brain region of the CIE treated P rats (Supplementary Table S2) (McClintick et al., 2015, 2016, 2018). TGFβ signaling was also increased in the LCLs of alcoholics (McClintick et al., 2019). There is substantial overlap of genes within these pathways, including multiple Wnts and their Frizzled receptors, FGF receptors, ephrin receptors, semaphorins and adenylate cyclases.
Chronic ethanol treatment also affected genes that are associated with neurotransmission. Dopamine signaling was increased, including DDC which produces dopamine from l-dopa, but DBH, which converts dopamine to norepinephrine, is also increased in expression. Increased expression of ADRA2C, one of the α2-adrenergic autoreceptors, could attenuate norepinephrine release, an effect that could be amplified by the increased expression of the norepinephrine transporter, SLC6A2. Increases in the glycine transporter SLC6A9 and serine transporter SLC1A4 could dampen glutamate signaling via the NMDA receptor, because glycine and or D-serine act as co-agonists of that receptor; the dampening could be amplified because the glutamate transporter SLC1A2 is also increased. Glycine can also act as a neurotransmitter. GRIA2, the glutamate ionotropic receptor AMPA type subunit 2, was decreased. The GABA pathway was affected; although the analysis did not predict a direction, the GABA transporter SLC6A11 was decreased, which could mean less uptake of GABA and more activity. Decreased expression of SLC6A11/GAT3 in sweet drinking rats caused them to increase their intake of ethanol, and SLC6A11 was decreased in expression in the amygdala of post-mortem brains (Augier et al., 2018). In CIE treated P rats, the GABA, serotonin, and glutamate pathways were strongly affected, especially in the dorsal raphe nucleus (McClintick et al., 2015, 2016, 2018). In the DRN there were large decreases in most of the genes of the serotonin pathway, and more subtle changes in glutamate and GABA subunits.
Alcohol has a known proinflammatory effect in multiple organs including the brain (Crews & Vetreno, 2016; J. Mayfield, Ferguson, & Harris, 2013; McClintick et al., 2013) and lymphoblastoid cells (McClintick et al., 2014; McClintick et al., 2019). A few pathways and upstream regulators related to inflammation were increased in the CIE cells, including the key regulators NFκB and cytokines C5, CCL5 and IL11. LTB4R, a receptor for the proinflammatory leukotriene LTB4, had a large increase in expression. Although no Toll-like receptors (TLRs) were detectably expressed in these cells, genes downstream of TLR4 were affected, possibly via effects of related activators such as C5 and NFκB. Both WNT5A and its receptor FZD5 increased in expression; this combination regulates inflammatory responses, linking innate and adaptive immune responses (Blumenthal et al., 2006). The pair can also activate the Wnt5a/JNK pathway which is important in neural differentiation from stem cells (Jang, Park, & Jeong, 2015). The significant FUMA gene sets include 42 sets from Immunologic signatures (Supplementary Table S5).
Several stress-responsive pathways were significantly affected, with most affected genes having increased expression. These include the unfolded protein response pathway, endoplasmic stress response and the NRF2 mediated oxidative stress pathway. These were also significantly affected in the LCLs treated with ethanol and in LCLs of alcoholics compared to controls (McClintick et al., 2019). The Hif1α pathway, which responds to low oxygen stress, is decreased, which might increase the impact of the other stress-responsive pathways. Nearly 200 genes downstream of TP53 were affected. These include cyclins and several genes in the minichromosome maintenance complex (all decreased) which are involved in cell cycle checkpoint and control. Also downstream of TP53 are SREBF1 and cholesterol biosynthesis genes.
Even after 3 weeks of repeated exposure to 40 mM ethanol, a single 24 h withdrawal largely reversed the effects of ethanol. There were nearly no genes that significantly differed between the withdrawn cells and the untreated cells (Supplementary Table S1), and the comparison of CIE-treated to the withdrawn cells is very similar to the comparison of CIE-treated to control (unexposed) cells (Supplementary Figure 2). The latter pair of comparisons shows that the return to baseline is not complete, but clearly substantial. There have been several studies of the timecourse of the effects of CIE in C57BL/6J mice (exposed via vapor chamber). There were many changes in gene expression detected immediately after 4 weeks of CIE exposure, with a slight drop in differentially expressed mRNAs and a more pronounced drop in differentially expressed miRNAs 8 h later and a further drop after 120 h (Osterndorff-Kahanek et al., 2015, 2018). Those experiments provided evidence for overrepresentation of genes characteristic of astrocytes and microglia in the amygdala and to a lesser extent in the nucleus accumbens at the early times, but no evidence of overexpression of genes characteristic of neurons. In the pre-frontal cortex, in contrast, neuronal genes were overrepresented along with astrocytes and, to a lesser degree, microglia (Osterndorff-Kahanek et al., 2015). A similar experiment looked only at 0 and 8 h after CIE exposure, and found many differences in gene expression in pre-frontal cortex but few in hippocampus or nucleus accumbens; the number of differentially expressed genes in pre-frontal cortex dropped markedly by 8 h (Melendez et al., 2012). Another experiment showed that pre-frontal cortex had the most differences at time 0, dropping by half at 8 h and to about 10% by 72 h (Smith et al., 2016). These experiments reveal much complexity in the timecourse and nature of genes affected, and differences among brain regions. They also suggest changes in the cellular composition of different regions at different times. Our study of a single cell type removes these complexities and focuses on understanding how a single cell type is affected in a single environment. The recovery toward baseline is a common feature of all of these experiments.
Examining the effects of CIE exposure on neuroblastoma cells allowed us to measure changes in neurotransmitter systems that cannot be studied in non-neural cell lines. There are limitations, however. The lack of other cell types found in brain could affect their response to ethanol, as could the lack of the spatial differentiation in brain.
What may be surprising is that pathways related to neuronal development and connectivity appear to be activated, with most genes in axonal guidance and synaptogenesis pathways increased in expression. The cholesterol biosynthesis pathway was decreased. TP53-controlled genes included some affecting the cell cycle, which may indicate that cell cycle were being slowed by checkpoint mechanisms. Stress systems like the unfolded protein response were activated; NFκB1 expression is increased and genes downstream of NFκB were affected. Another surprising finding was that the many changes evoked by the CIE exposure over 3 weeks returned nearly to baseline after only 24 h of withdrawal. It is possible that more lasting changes could result from exposures over a much longer period, or that chronic heavy exposure of individuals might lead to changes in connectivity within the brain, or might predispose to stronger effects of ethanol on reexposure.
Supplementary Material
Supplementary Figures & Tables
Supplementary Figure 1: Schematic of method for ethanol exposure.
Supplementary Figure 4. Scatter plot of the log2 ratios for all 3 comparisons using genes that were significantly changed ethanol vs. control, FDR< 0.20. Ethanol/control (x-axis), Ethanol/WD (Y-axis) orange, WD/control (Y-axis) blue
Supplementary Figure 2: Multidimensional scaling plot of all samples showing outlier in replicate 3 samples.
Supplementary Figure 3: Multidimensional scaling plot of all samples after replicate 3 samples were removed. Dimensions 1 and 4 are shown. Demonstrates differences between replicates and treatment groups.
Supplementary Table S1. Genes affected by ethanol only treatment vs. control or ethanol only vs ethanol + WD, FDR<0.20 in at least one comparison. Results shown for ethanol only vs. control, ethanol + withdrawal vs. control, ethanol only vs. ethanol + withdrawal, fold, pvalue and false discovery rate (FDR) shown for each. This table contains all genes which met FDR< 0.20 for any of the 3 comparisons. Bolded results for each comparison show those meeting FDR< 0.20 for that comparison. FPKM is fragments per kilobase per million mapped reads, average for each group. GTEX, largest average TPM among all brain regions listed in GTEx (https://gtexportal.org/home/). LCL 48h: results for 48 h 70 mM ethanol treatment of LCLs, PMID 30639126, McClintick et al., 2019. Bold indicates significant at FDR< 0.05. PM Brain: From a list of genes differentially expressed in at least one of 13 Post-mortem studies of brain tissue from alcoholics vs. controls.
Supplementary Table S2. Pathways associated with ethanol only treatment, FDR< 0.20. Ingenuity pathway analysis results for genes affected by ethanol only treatment vs. control with FDR< 0.020. Results are displayed for pathways significant at FDR< 0.20. Overlapping pathways are displayed after the most significant pathway and shaded with pale gray.
Supplementary Table S3. Upstream regulators - genes, proteins, protein complexes Ingenuity pathway analysis upstream results for genes affected by ethanol only treatment vs. control with FDR< 0.20. Fold changes, regardless of significance, are given for genes expressed in these cells. Blanks for fold indicates that this gene did not meet the threshold for expression.
Supplementary Table S4. Upstream regulators - chemicals, drugs Ingenuity pathway analysis upstream results for genes affected by ethanol only treatment vs. control with FDR< 0.20. S4 lists results for exogenous chemicals, drugs or proteins; fold change is irrelevant.
Supplementary Table S5. FUMA gene sets FUMA gene sets that were significant (FDR<0.20, 5 or more genes in the set) based upon the genes in Table 1, FDR<0.20 absolute fold ≥ 1.2.
Highlights.
Chronic intermittent ethanol exposure of neuroblastoma cells affected expression of 1,498 genes.
Gene expression returns to near baseline after 24 hour withdrawal from CIE.
Expression changes could affect glutamate transmission via AMPA and NMDA receptors.
Genes for cholesterol biosynthesis are decreased in expression.
Axonal guidance, reelin signaling and synaptogenesis pathways were affected.
Acknowledgements
The Center for Medical Genomics at the Indiana University School of Medicine performed the RNA sequencing and alignment.
The Collaborative Study on the Genetics of Alcoholism (COGA), Principal Investigators B. Porjesz, V. Hesselbrock, H. Edenberg, L. Bierut, includes 11 different centers: University of Connecticut (V. Hesselbrock); Indiana University (H.J. Edenberg, J. Nurnberger Jr., T. Foroud); University of Iowa (S. Kuperman, J. Kramer); SUNY Downstate (B. Porjesz); Washington University in St. Louis (L. Bierut, J. Rice, K. Bucholz, A. Agrawal); University of California at San Diego (M. Schuckit); Rutgers University (J. Tischfield, A. Brooks); Department of Biomedical and Health Informatics, The Children’s Hospital of Philadelphia; Department of Genetics, Perelman School of Medicine, University of Pennsylvania, Philadelphia, PA (L. Almasy); Virginia Commonwealth University (D. Dick); Icahn School of Medicine at Mount Sinai (A. Goate); and Howard University (R. Taylor). Other COGA collaborators include L. Bauer (University of Connecticut); J. McClintick, L. Wetherill, X. Xuei, Y. Liu, D. Lai, S. O’Connor, M. Plawecki, S. Lourens (Indiana University); G. Chan (University of Iowa; University of Connecticut); J. Meyers, D. Chorlian, C. Kamarajan, A. Pandey, J. Zhang (SUNY Downstate); J.‐C. Wang, M. Kapoor, S. Bertelsen (Icahn School of Medicine at Mount Sinai); A. Anokhin, V. McCutcheon, S. Saccone (Washington University); J. Salvatore, F. Aliev, B. Cho (Virginia Commonwealth University); and M. Kos (University of Texas Rio Grande Valley). A. Parsian and M. Reilly are the NIAAA Staff Collaborators. This national collaborative study is supported by NIH Grant U10AA008401 from the National Institute on Alcohol Abuse and Alcoholism (NIAAA) and the National Institute on Drug Abuse (NIDA).
The Genotype-Tissue Expression (GTEx) Project was supported by the Common Fund of the Office of the Director of the National Institutes of Health, and by NCI, NHGRI, NHLBI, NIDA, NIMH, and NINDS. The data used for the analyses described in this manuscript were obtained from the GTEx Portal on 04/18/2018 (version 7, Lonsdale et al., 2013).
Footnotes
Publisher's Disclaimer: This is a PDF file of an unedited manuscript that has been accepted for publication. As a service to our customers we are providing this early version of the manuscript. The manuscript will undergo copyediting, typesetting, and review of the resulting proof before it is published in its final form. Please note that during the production process errors may be discovered which could affect the content, and all legal disclaimers that apply to the journal pertain.
References
- Augier E, Barbier E, Dulman RS, Licheri V, Augier G, Domi E, … Heilig M (2018). A molecular mechanism for choosing alcohol over an alternative reward. Science, 360(6395), 1321–1326. doi: 10.1126/science.aao1157 [DOI] [PubMed] [Google Scholar]
- Becker HC, & Lopez MF (2004). Increased ethanol drinking after repeated chronic ethanol exposure and withdrawal experience in C57BL/6 mice. Alcohol Clin Exp Res, 28(12), 1829–1838. [DOI] [PubMed] [Google Scholar]
- Bell RL, Rodd ZA, Engleman EA, Toalston JE, & McBride WJ (2014). Scheduled access alcohol drinking by alcohol-preferring (P) and high-alcohol-drinking (HAD) rats: modeling adolescent and adult binge-like drinking. Alcohol, 48(3), 225–234. doi: 10.1016/j.alcohol.2013.10.004 [DOI] [PMC free article] [PubMed] [Google Scholar]
- Benjamini Y, & Hochberg Y (1995). Controlling the false discovery rate: a practical and powerful approach to multiple testing. J R Stat Soc Ser B Methodol, 57. [Google Scholar]
- Blumenthal A, Ehlers S, Lauber J, Buer J, Lange C, Goldmann T, … Reiling N (2006). The Wingless homolog WNT5A and its receptor Frizzled-5 regulate inflammatory responses of human mononuclear cells induced by microbial stimulation. Blood, 108(3), 965–973. doi: 10.1182/blood-2005-12-5046 [DOI] [PubMed] [Google Scholar]
- Breese MR, & Liu Y (2013). NGSUtils: a software suite for analyzing and manipulating next-generation sequencing datasets. Bioinformatics, 29(4), 494–496. doi: 10.1093/bioinformatics/bts731 [DOI] [PMC free article] [PubMed] [Google Scholar]
- Breuss MW, Leca I, Gstrein T, Hansen AH, & Keays DA (2017). Tubulins and brain development - The origins of functional specification. Mol Cell Neurosci, 84, 58–67. doi: 10.1016/j.mcn.2017.03.002 [DOI] [PubMed] [Google Scholar]
- Crews FT, & Vetreno RP (2016). Mechanisms of neuroimmune gene induction in alcoholism. Psychopharmacology (Berl), 233(9), 1543–1557. doi: 10.1007/s00213-015-3906-1 [DOI] [PMC free article] [PubMed] [Google Scholar]
- Dobin A, Davis CA, Schlesinger F, Drenkow J, Zaleski C, Jha S, … Gingeras TR (2013). STAR: ultrafast universal RNA-seq aligner. Bioinformatics, 29(1), 15–21. doi: 10.1093/bioinformatics/bts635 [DOI] [PMC free article] [PubMed] [Google Scholar]
- GTEx Consortium G (2013). The Genotype-Tissue Expression (GTEx) project. Nat Genet, 45(6), 580–585. doi: 10.1038/ng.2653 [DOI] [PMC free article] [PubMed] [Google Scholar]
- Hasin DS, & Grant BF (2015). The National Epidemiologic Survey on Alcohol and Related Conditions (NESARC) Waves 1 and 2: review and summary of findings. Soc Psychiatry Psychiatr Epidemiol, 50(11), 1609–1640. doi: 10.1007/s00127-015-1088-0 [DOI] [PMC free article] [PubMed] [Google Scholar]
- He Y, Zhang H, Yung A, Villeda SA, Jaeger PA, Olayiwola O, … Wyss-Coray T (2014). ALK5-dependent TGF-beta signaling is a major determinant of late-stage adult neurogenesis. Nat Neurosci, 17(7), 943–952. doi: 10.1038/nn.3732 [DOI] [PMC free article] [PubMed] [Google Scholar]
- Hingson RW, Zha W, & White AM (2017). Drinking Beyond the Binge Threshold: Predictors, Consequences, and Changes in the U.S. Am J Prev Med, 52(6), 717–727. doi: 10.1016/j.amepre.2017.02.014 [DOI] [PubMed] [Google Scholar]
- Jang S, Park JS, & Jeong HS (2015). Neural Differentiation of Human Adipose Tissue-Derived Stem Cells Involves Activation of the Wnt5a/JNK Signalling. Stem Cells Int, 2015, 178618. doi: 10.1155/2015/178618 [DOI] [PMC free article] [PubMed] [Google Scholar]
- Jury NJ, Pollack GA, Ward MJ, Bezek JL, Ng AJ, Pinard CR, … Holmes A (2017). Chronic Ethanol During Adolescence Impacts Corticolimbic Dendritic Spines and Behavior. Alcohol Clin Exp Res, 41(7), 1298–1308. doi: 10.1111/acer.13422 [DOI] [PMC free article] [PubMed] [Google Scholar]
- Lee GH, & D’Arcangelo G (2016). New Insights into Reelin-Mediated Signaling Pathways. Front Cell Neurosci, 10, 122. doi: 10.3389/fncel.2016.00122 [DOI] [PMC free article] [PubMed] [Google Scholar]
- Liao Y, Smyth GK, & Shi W (2014). featureCounts: an efficient general purpose program for assigning sequence reads to genomic features. Bioinformatics, 30(7), 923–930. doi: 10.1093/bioinformatics/btt656 [DOI] [PubMed] [Google Scholar]
- Lonsdale J, Thomas J, Salvatore M, Phillips R, Lo E, Shad S, … Moore HF (2013). The Genotype-Tissue Expression (GTEx) project. Nature Genetics, 45, 580. doi: 10.1038/ng.2653 [DOI] [PMC free article] [PubMed] [Google Scholar]
- Mayfield J, Ferguson L, & Harris RA (2013). Neuroimmune signaling: a key component of alcohol abuse. Curr Opin Neurobiol. doi: 10.1016/j.conb.2013.01.024 [DOI] [PMC free article] [PubMed] [Google Scholar]
- Mayfield RD, Lewohl JM, Dodd PR, Herlihy A, Liu J, & Harris RA (2002). Patterns of gene expression are altered in the frontal and motor cortices of human alcoholics. J Neurochem, 81(4), 802–813. [DOI] [PubMed] [Google Scholar]
- McBride WJ, Kimpel MW, McClintick JN, Ding ZM, Hauser SR, Edenberg HJ, … Rodd ZA (2013). Changes in gene expression within the ventral tegmental area following repeated excessive binge-like alcohol drinking by alcohol-preferring (P) rats. Alcohol, 47(5), 367–380. doi: 10.1016/j.alcohol.2013.04.002 [DOI] [PMC free article] [PubMed] [Google Scholar]
- McClintick JN, Brooks AI, Deng L, Liang L, Wang JC, Kapoor M, … Edenberg HJ (2014). Ethanol treatment of lymphoblastoid cell lines from alcoholics and non-alcoholics causes many subtle changes in gene expression. Alcohol, 48(6), 603–610. doi: 10.1016/j.alcohol.2014.07.004 [DOI] [PMC free article] [PubMed] [Google Scholar]
- McClintick JN, & Edenberg HJ (2006). Effects of filtering by Present call on analysis of microarray experiments. BMC Bioinformatics, 7, 49. [DOI] [PMC free article] [PubMed] [Google Scholar]
- McClintick JN, McBride WJ, Bell RL, Ding ZM, Liu Y, Xuei X, & Edenberg HJ (2015). Gene expression changes in serotonin, GABA-A receptors, neuropeptides and ion channels in the dorsal raphe nucleus of adolescent alcohol-preferring (P) rats following binge-like alcohol drinking. Pharmacol Biochem Behav, 129, 87–96. doi: 10.1016/j.pbb.2014.12.007 [DOI] [PMC free article] [PubMed] [Google Scholar]
- McClintick JN, McBride WJ, Bell RL, Ding ZM, Liu Y, Xuei X, & Edenberg HJ (2016). Gene Expression Changes in Glutamate and GABA-A Receptors, Neuropeptides, Ion Channels, and Cholesterol Synthesis in the Periaqueductal Gray Following Binge-Like Alcohol Drinking by Adolescent Alcohol-Preferring (P) Rats. Alcohol Clin Exp Res, 40(5), 955–968. doi: 10.1111/acer.13056 [DOI] [PMC free article] [PubMed] [Google Scholar]
- McClintick JN, McBride WJ, Bell RL, Ding ZM, Liu Y, Xuei X, & Edenberg HJ (2018). Gene expression changes in the ventral hippocampus and medial prefrontal cortex of adolescent alcohol-preferring (P) rats following binge-like alcohol drinking. Alcohol, 68, 37–47. doi: 10.1016/j.alcohol.2017.09.002 [DOI] [PMC free article] [PubMed] [Google Scholar]
- McClintick JN, Tischfield JA, Deng L, Kapoor M, Xuei X, & Edenberg HJ (2019). Ethanol activates immune response in lymphoblastoid cells. Alcohol, 79, 81–91. doi: 10.1016/j.alcohol.2019.01.001 [DOI] [PMC free article] [PubMed] [Google Scholar]
- McClintick JN, Xuei X, Tischfield JA, Goate A, Foroud T, Wetherill L, … Edenberg HJ (2013). Stress-response pathways are altered in the hippocampus of chronic alcoholics. Alcohol, 47(7), 505–515. doi: 10.1016/j.alcohol.2013.07.002 [DOI] [PMC free article] [PubMed] [Google Scholar]
- Melendez RI (2011). Intermittent (every-other-day) drinking induces rapid escalation of ethanol intake and preference in adolescent and adult C57BL/6J mice. Alcohol Clin Exp Res, 35(4), 652–658. doi: 10.1111/j.1530-0277.2010.01383.x [DOI] [PMC free article] [PubMed] [Google Scholar]
- Melendez RI, McGinty JF, Kalivas PW and Becker HC (2012), Brain region‐specific gene expression changes after chronic intermittent ethanol exposure and early withdrawal in C57BL/6J mice. Addiction Biology, 17: 351–364. [DOI] [PMC free article] [PubMed] [Google Scholar]
- Osterndorff-Kahanek EA, Becker HC, Lopez MF, Farris SP, Tiwari GR, Nunez YO, et al. (2015) Chronic Ethanol Exposure Produces Time- and Brain Region-Dependent Changes in Gene Coexpression Networks. PLoS ONE 10(3): e0121522. [DOI] [PMC free article] [PubMed] [Google Scholar]
- Osterndorff-Kahanek EA, Tiwari GR, Lopez MF, Becker HC, Harris RA, Mayfield RD (2018) Long-term ethanol exposure: Temporal pattern of microRNA expression and associated mRNA gene networks in mouse brain. PLoS ONE 13(1): e0190841. [DOI] [PMC free article] [PubMed] [Google Scholar]
- Ponomarev I, Wang S, Zhang L, Harris RA, & Mayfield RD (2012). Gene coexpression networks in human brain identify epigenetic modifications in alcohol dependence. J Neurosci, 32(5), 1884–1897. doi: 10.1523/jneurosci.3136-11.2012 [DOI] [PMC free article] [PubMed] [Google Scholar]
- Robinson MD, McCarthy DJ, & Smyth GK (2010). edgeR: a Bioconductor package for differential expression analysis of digital gene expression data. Bioinformatics, 26(1), 139–140. doi: 10.1093/bioinformatics/btp616 [DOI] [PMC free article] [PubMed] [Google Scholar]
- Sacks JJ, Gonzales KR, Bouchery EE, Tomedi LE, & Brewer RD (2015). 2010 National and State Costs of Excessive Alcohol Consumption. Am J Prev Med, 49(5), e73–e79. doi: 10.1016/j.amepre.2015.05.031 [DOI] [PubMed] [Google Scholar]
- Smith ML, Lopez MF, Archer KJ, Wolen AR, Becker HC, Miles MF (2016) Time-Course Analysis of Brain Regional Expression Network Responses to Chronic Intermittent Ethanol and Withdrawal: Implications for Mechanisms Underlying Excessive Ethanol Consumption. PLoS ONE 11(1): e0146257. [DOI] [PMC free article] [PubMed] [Google Scholar]
- Sokolov BP, Jiang L, Trivedi NS, & Aston C (2003). Transcription profiling reveals mitochondrial, ubiquitin and signaling systems abnormalities in postmortem brains from subjects with a history of alcohol abuse or dependence. J Neurosci Res, 72(6), 756–767. doi: 10.1002/jnr.10631 [DOI] [PubMed] [Google Scholar]
- Watanabe K, Taskesen E, van Bochoven A, & Posthuma D (2017). Functional mapping and annotation of genetic associations with FUMA. Nat Commun, 8(1), 1826. doi: 10.1038/s41467-017-01261-5 [DOI] [PMC free article] [PubMed] [Google Scholar]
- Wilcox LJ, Barrett PH, & Huff MW (1999). Differential regulation of apolipoprotein B secretion from HepG2 cells by two HMG-CoA reductase inhibitors, atorvastatin and simvastatin. J Lipid Res, 40(6), 1078–1089. [PubMed] [Google Scholar]
Associated Data
This section collects any data citations, data availability statements, or supplementary materials included in this article.
Supplementary Materials
Supplementary Figures & Tables
Supplementary Figure 1: Schematic of method for ethanol exposure.
Supplementary Figure 4. Scatter plot of the log2 ratios for all 3 comparisons using genes that were significantly changed ethanol vs. control, FDR< 0.20. Ethanol/control (x-axis), Ethanol/WD (Y-axis) orange, WD/control (Y-axis) blue
Supplementary Figure 2: Multidimensional scaling plot of all samples showing outlier in replicate 3 samples.
Supplementary Figure 3: Multidimensional scaling plot of all samples after replicate 3 samples were removed. Dimensions 1 and 4 are shown. Demonstrates differences between replicates and treatment groups.
Supplementary Table S1. Genes affected by ethanol only treatment vs. control or ethanol only vs ethanol + WD, FDR<0.20 in at least one comparison. Results shown for ethanol only vs. control, ethanol + withdrawal vs. control, ethanol only vs. ethanol + withdrawal, fold, pvalue and false discovery rate (FDR) shown for each. This table contains all genes which met FDR< 0.20 for any of the 3 comparisons. Bolded results for each comparison show those meeting FDR< 0.20 for that comparison. FPKM is fragments per kilobase per million mapped reads, average for each group. GTEX, largest average TPM among all brain regions listed in GTEx (https://gtexportal.org/home/). LCL 48h: results for 48 h 70 mM ethanol treatment of LCLs, PMID 30639126, McClintick et al., 2019. Bold indicates significant at FDR< 0.05. PM Brain: From a list of genes differentially expressed in at least one of 13 Post-mortem studies of brain tissue from alcoholics vs. controls.
Supplementary Table S2. Pathways associated with ethanol only treatment, FDR< 0.20. Ingenuity pathway analysis results for genes affected by ethanol only treatment vs. control with FDR< 0.020. Results are displayed for pathways significant at FDR< 0.20. Overlapping pathways are displayed after the most significant pathway and shaded with pale gray.
Supplementary Table S3. Upstream regulators - genes, proteins, protein complexes Ingenuity pathway analysis upstream results for genes affected by ethanol only treatment vs. control with FDR< 0.20. Fold changes, regardless of significance, are given for genes expressed in these cells. Blanks for fold indicates that this gene did not meet the threshold for expression.
Supplementary Table S4. Upstream regulators - chemicals, drugs Ingenuity pathway analysis upstream results for genes affected by ethanol only treatment vs. control with FDR< 0.20. S4 lists results for exogenous chemicals, drugs or proteins; fold change is irrelevant.
Supplementary Table S5. FUMA gene sets FUMA gene sets that were significant (FDR<0.20, 5 or more genes in the set) based upon the genes in Table 1, FDR<0.20 absolute fold ≥ 1.2.